Article

Effect of Laser Peening Process Parameters and Sequences on Residual Stress Profiles

1
Helmholtz-Zentrum Geesthacht, Institute of Materials Research, Materials Mechanics, Max-Planck-Straße 1, 21502 Geesthacht, Germany
2
Leuphana University of Lüneburg, Institute of Product and Process Innovation, Universitätsallee 1, 21335 Lüneburg, Germany
*
Author to whom correspondence should be addressed.
Metals 2019, 9(6), 655; https://doi.org/10.3390/met9060655
Submission received: 9 April 2019 / Revised: 29 May 2019 / Accepted: 30 May 2019 / Published: 4 June 2019
(This article belongs to the Special Issue Laser Shock Processing and Related Phenomena)

Abstract

:
Laser Peening (LP) is a surface modification technology that can induce high residual stresses in a metallic material. The relation between LP process parameters, in particular laser sequences, as well as pulse parameters and the resulting residual stress state was investigated in this study. The residual stress measurements, performed with the hole drilling technique, showed a non-equibiaxial stress profile in laser peened AA2024-T3 samples with a clad layer for certain parameter combinations. Shot overlap and applied energy density were found to be crucial parameters for the characteristic of the observed non-equibiaxial residual stress profile. Furthermore, the investigation showed the importance of the advancing direction, as the advancing direction influences the direction of the higher compressive residual stress component. The direction of higher residual stresses was parallel or orthogonal to the rolling direction of the material. The effect was correlated to the microstructural observation obtained via electron backscattered diffraction. Additionally, for peening with two sequences of different advancing directions, the study showed that the order of applied advancing directions was important for the non-equibiaxiality of the resulting residual stress profile.

1. Introduction

The improvement of fatigue life of lightweight structures plays an important role in the construction of aircrafts. In order to fulfill the requirement of long-living lightweight structures, advanced materials with innovative processing technologies have to be utilized. Aluminum alloys like AA2024-T3 are frequently used, for example, in commercial aircrafts [1]. AA2024 is characterized by a high strength and a comparatively low density. Despite the advanced development of modern alloys, corrosion and fatigue remain factors limiting aircrafts’ working life [2]. Modification technologies like laser peening (LP), also named laser shock peening (LSP), treat the surface of the material locally, leading to residual stresses in the material which can improve corrosion and fatigue resistance [3,4]. The LP process is contact-free, highly controllable and achieves deeper residual stress profiles in comparison to shot peening [5].
To generate tailored residual stress distributions, it is necessary to gain knowledge of the residual stress influencing LP process parameters. The result of the LP process is influenced by laser parameters like the energy input and the size of the laser focus [6,7] as well as the geometry of the laser focus [8]. The achievable maximum residual stress values are limited by the material’s yield strength. Multiple investigations [9,10,11] have observed increased residual stresses for higher energy densities. Multiple shots on one area lead to higher and deeper residual stresses [5,9,12]. Furthermore, as shown by Toparli and Fitzpatrick [13], a shot overlap also leads to higher stresses. The overlap rate may influence the anisotropy of the residual stress profile [13,14,15]. To sum up, the energy density, directly defined by the focus size and chosen energy input, the number of shots, and the applied overlap rate determine how much energy an area experiences. This is crucial for the residual stress distribution.
The shot pattern describes the strategy for the positioning of the laser pulses on the peening area. Saliminarizi et al. [16] compared a row-wise peening pattern to a spiral peening pattern with regard to the surface properties of the material. As a result, surface roughness was found to be dependent on the peening pattern and overlap rate. Xu et al. [15] have shown that the choice of scanning path has an influence on residual stresses in a 316L stainless steel blade. Correa et al. [14,17] showed that the choice of the advancing direction influences the residual stress profile and the improvement of fatigue attributes. Furthermore, the same research group [18] proposed that randomly applied shots provide a more equibiaxial stress profile than the row-wise application of shots.
The present study relates the applied shot pattern to the residual stresses developing in the material. The systematic investigation showed the influence of the advancing direction as well as the applied overlap on the residual stress profile. Moreover, different shot patterns are combined by peening two sequences with different advancing directions, and possible mechanisms for the resulting residual stress profiles are discussed. The experimental setup for this work as well as material used and measurement technology are presented in the following section. The influence of the clad layer and the use of aluminum foil during peening on the resulting residual stresses is also shown in this study. Moreover, the importance of the choice of the advancing direction for the residual stress state as well as the effect of shot overlap is presented for one peening sequence. Additionally, the residual stresses for peening with two sequences with different shot patterns for each sequence are pointed out. For unpeened materials as well as for materials treated by particular shot patterns, local orientation changes are investigated using electron backscattered diffraction (EBSD). Furthermore, the effect of different energy densities on the material’s surface is investigated.

2. Materials and Methods
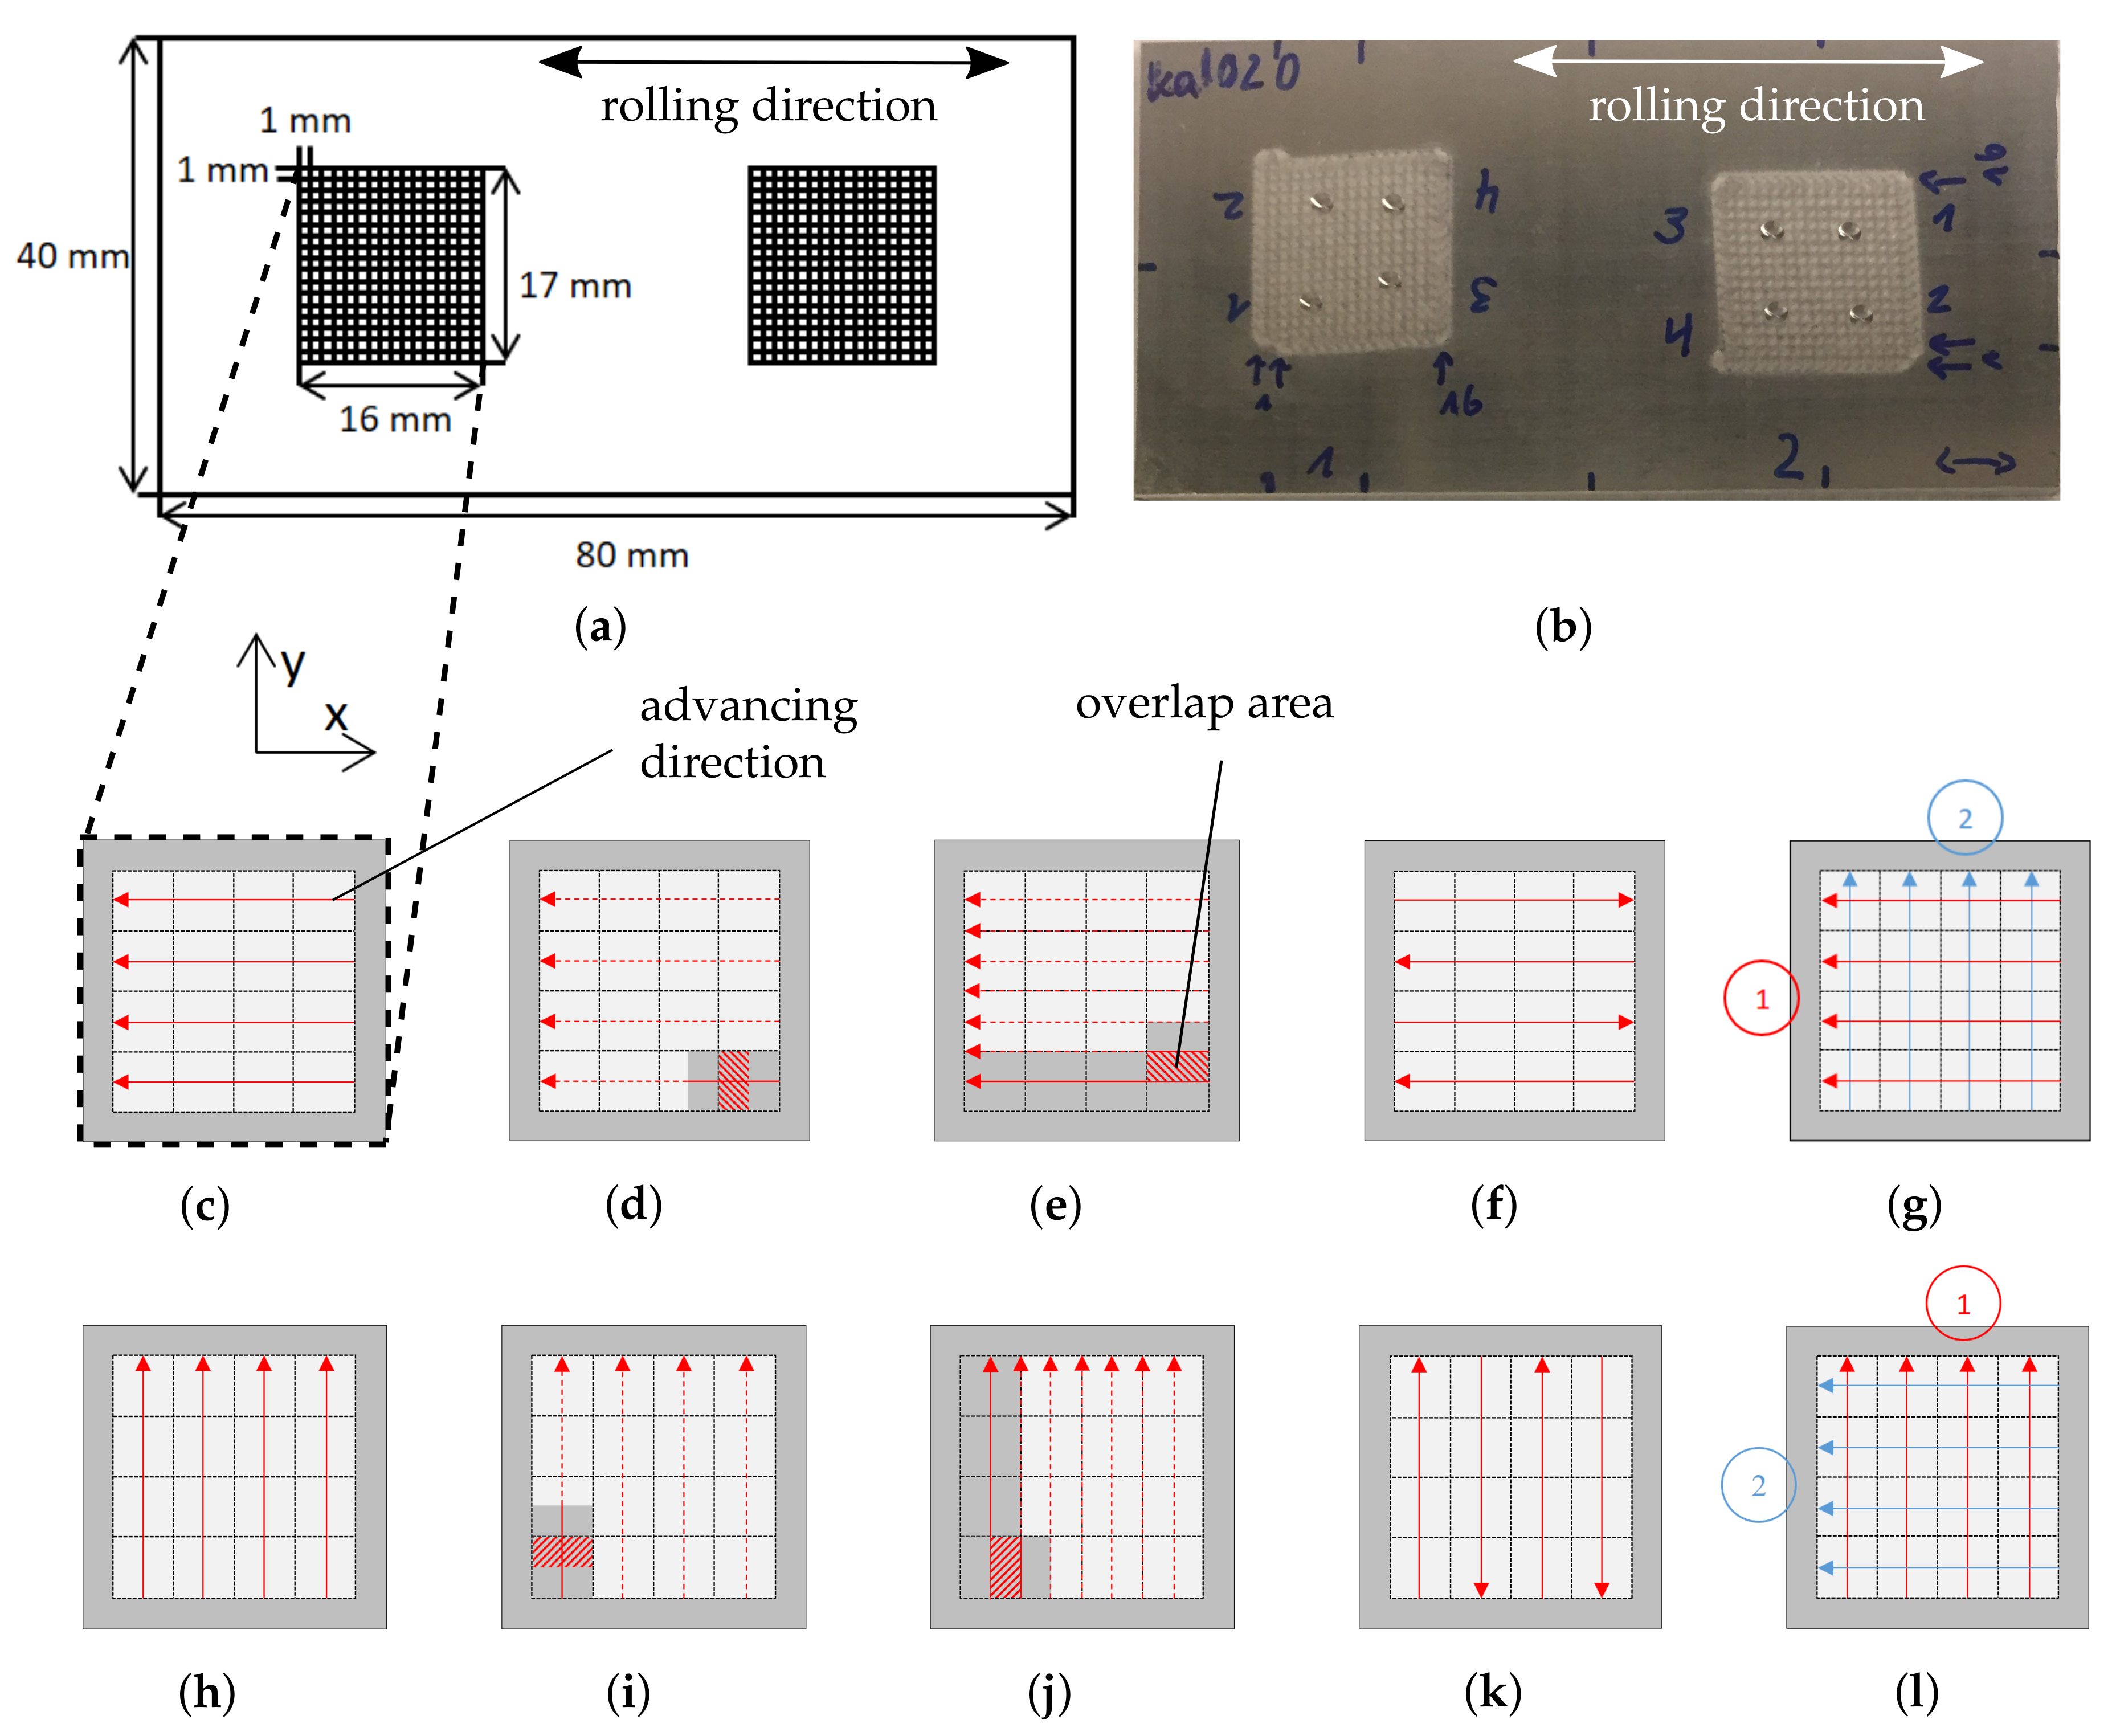
2.1. Laser Peening

During the LP process, the pulsed laser is focused on the material’s surface. The energy input of a laser pulse leads to vaporization of the material at the surface. Thermal expansion of the developing plasma induces a shock wave propagating into the material. Local plastic deformation occurs and causes residual stresses. A transparent overlay increases the pressure and the duration of the plasma and, thus, the efficiency of the process [3]. In the present work, water is used as a transparent overlay. An Nd:YAG laser (wavelength 1064 nm) with the full width at half maximum (FWHM) of 20 ns and a frequency of 10 Hz was employed. A squared laser focus of 1 mm × 1 mm with 1.5 J of energy is used to study the effect of the laser sequence. Additionally, the energy input is changed to 1 J and 3 J for investigating the influence of the energy density. For each specimen, two peening areas which had no interacting effects on the residual stress profile are used. Possible interacting effects were tested for quadratic specimens (40 mm × 40 mm) with only one peening area, which did not show variation in the residual stress profile in comparison to a specimen (40 mm × 80 mm) peened with the same process parameters in two different areas.
For the experimental investigation of the process, AA2024-T3clad specimens (40 mm × 80 mm) with thicknesses of 4.8 mm are investigated (see Figure 1a,b). The specimens feature a clad layer of approximately 0.15 mm thickness on both sides. For some specimens, the aluminum clad layer on one side is removed by milling 0.2 mm, leading to a specimen thickness of 4.6 mm. This allows the investigation of the effect of the clad layer on residual stresses. The milled specimens are named AA2024-T3 in the following. Influences on residual stresses due to the reduced thickness of the milled specimens are assumed negligible. The dimension of the peening areas on the specimens are 16 mm × 17 mm for the investigation of the laser sequence. For particular experiments, an adhesive Al foil of approximately 0.05 mm thickness is applied to the untreated specimen surface with special attention to avoid any air inclusions between the foil and specimen. After peening, the adhesive foil is removed to allow residual stress measurements of the specimen only.
An overview of the different applied peening strategies in this study is given in Figure 1c–l. The two basic peening strategies are characterized by the choice of the advancing direction in relation to the rolling direction (see Figure 1c,h). For the investigation of the influence of shot overlap, the overlap is chosen to be 50 percent only in one direction. Consequently, an overlap can be applied parallel or orthogonal to the chosen advancing direction. The generation of the overlap is schematically shown in Figure 1d,e,i,j. The two basic patterns are also peened with a row-wise change in direction (see Figure 1f,k). The applied strategies for peening with two sequences are presented in Figure 1g,l.

2.2. Residual Stress Measurement via Incremental Hole Drilling Technique

The PRISM system by Stresstech (Rennerod, Germany) was used for the residual stress measurements. The basis of the system is the incremental hole drilling technique and the electronic speckle pattern interferometry (ESPI). The procedure can be divided into three steps [19]:
1.
Drilling the hole increment;
2.
Recording surface deformation using ESPI; and
3.
Calculation of the residual stresses based on the integral method.
All three steps were performed for each increment of the hole, leading to a residual stress profile over the material depth. Coherent light illuminates the surface around the hole, and the light reflection results in a shift of each pixel depending on the roughness of the surface. The superposition of reflected light and reference beam lead to the speckle pattern. The phase shift after the reflection defines the pixel intensity. The comparison of intensity before and after each drilling increment is an indicator for the displacement [20]. Accordingly, thousands of pixels are considered for determining the displacement using the ESPI technique. Subsequently, the integral method is applied. The hole drilling technique assumes constant residual stresses parallel to the material’s surface as well as purely elastic deformations during the drilling. Restrictions and necessary assumptions for the incremental hole drilling method using ESPI are explained in detail [21]. In this regard, Chupakhin et al. [22] presented a correction method for equibiaxial residual stress profiles based on an artificial neural network to account for possible plasticity effects.
For all performed measurements, holes of 2 mm diameter and 1 mm depth were drilled incrementally. One hole was drilled in 19 increments. Increments close to the surface were smaller than below, according to the expected residual stress gradient. The position of the holes in the peened area is exemplarily shown in Figure 1b. For most investigated combinations of shot patterns, eight measurements were performed to have sufficient statistics. Four measurements are performed for the peening experiments with Al foil, with overlap, with a 1 J pulse energy as well as the peening experiment where the advancing direction is orthogonal to the rolling direction with a row-wise change in direction. Therefore, the average value as well as the minimum and maximum measured values are shown for these results.

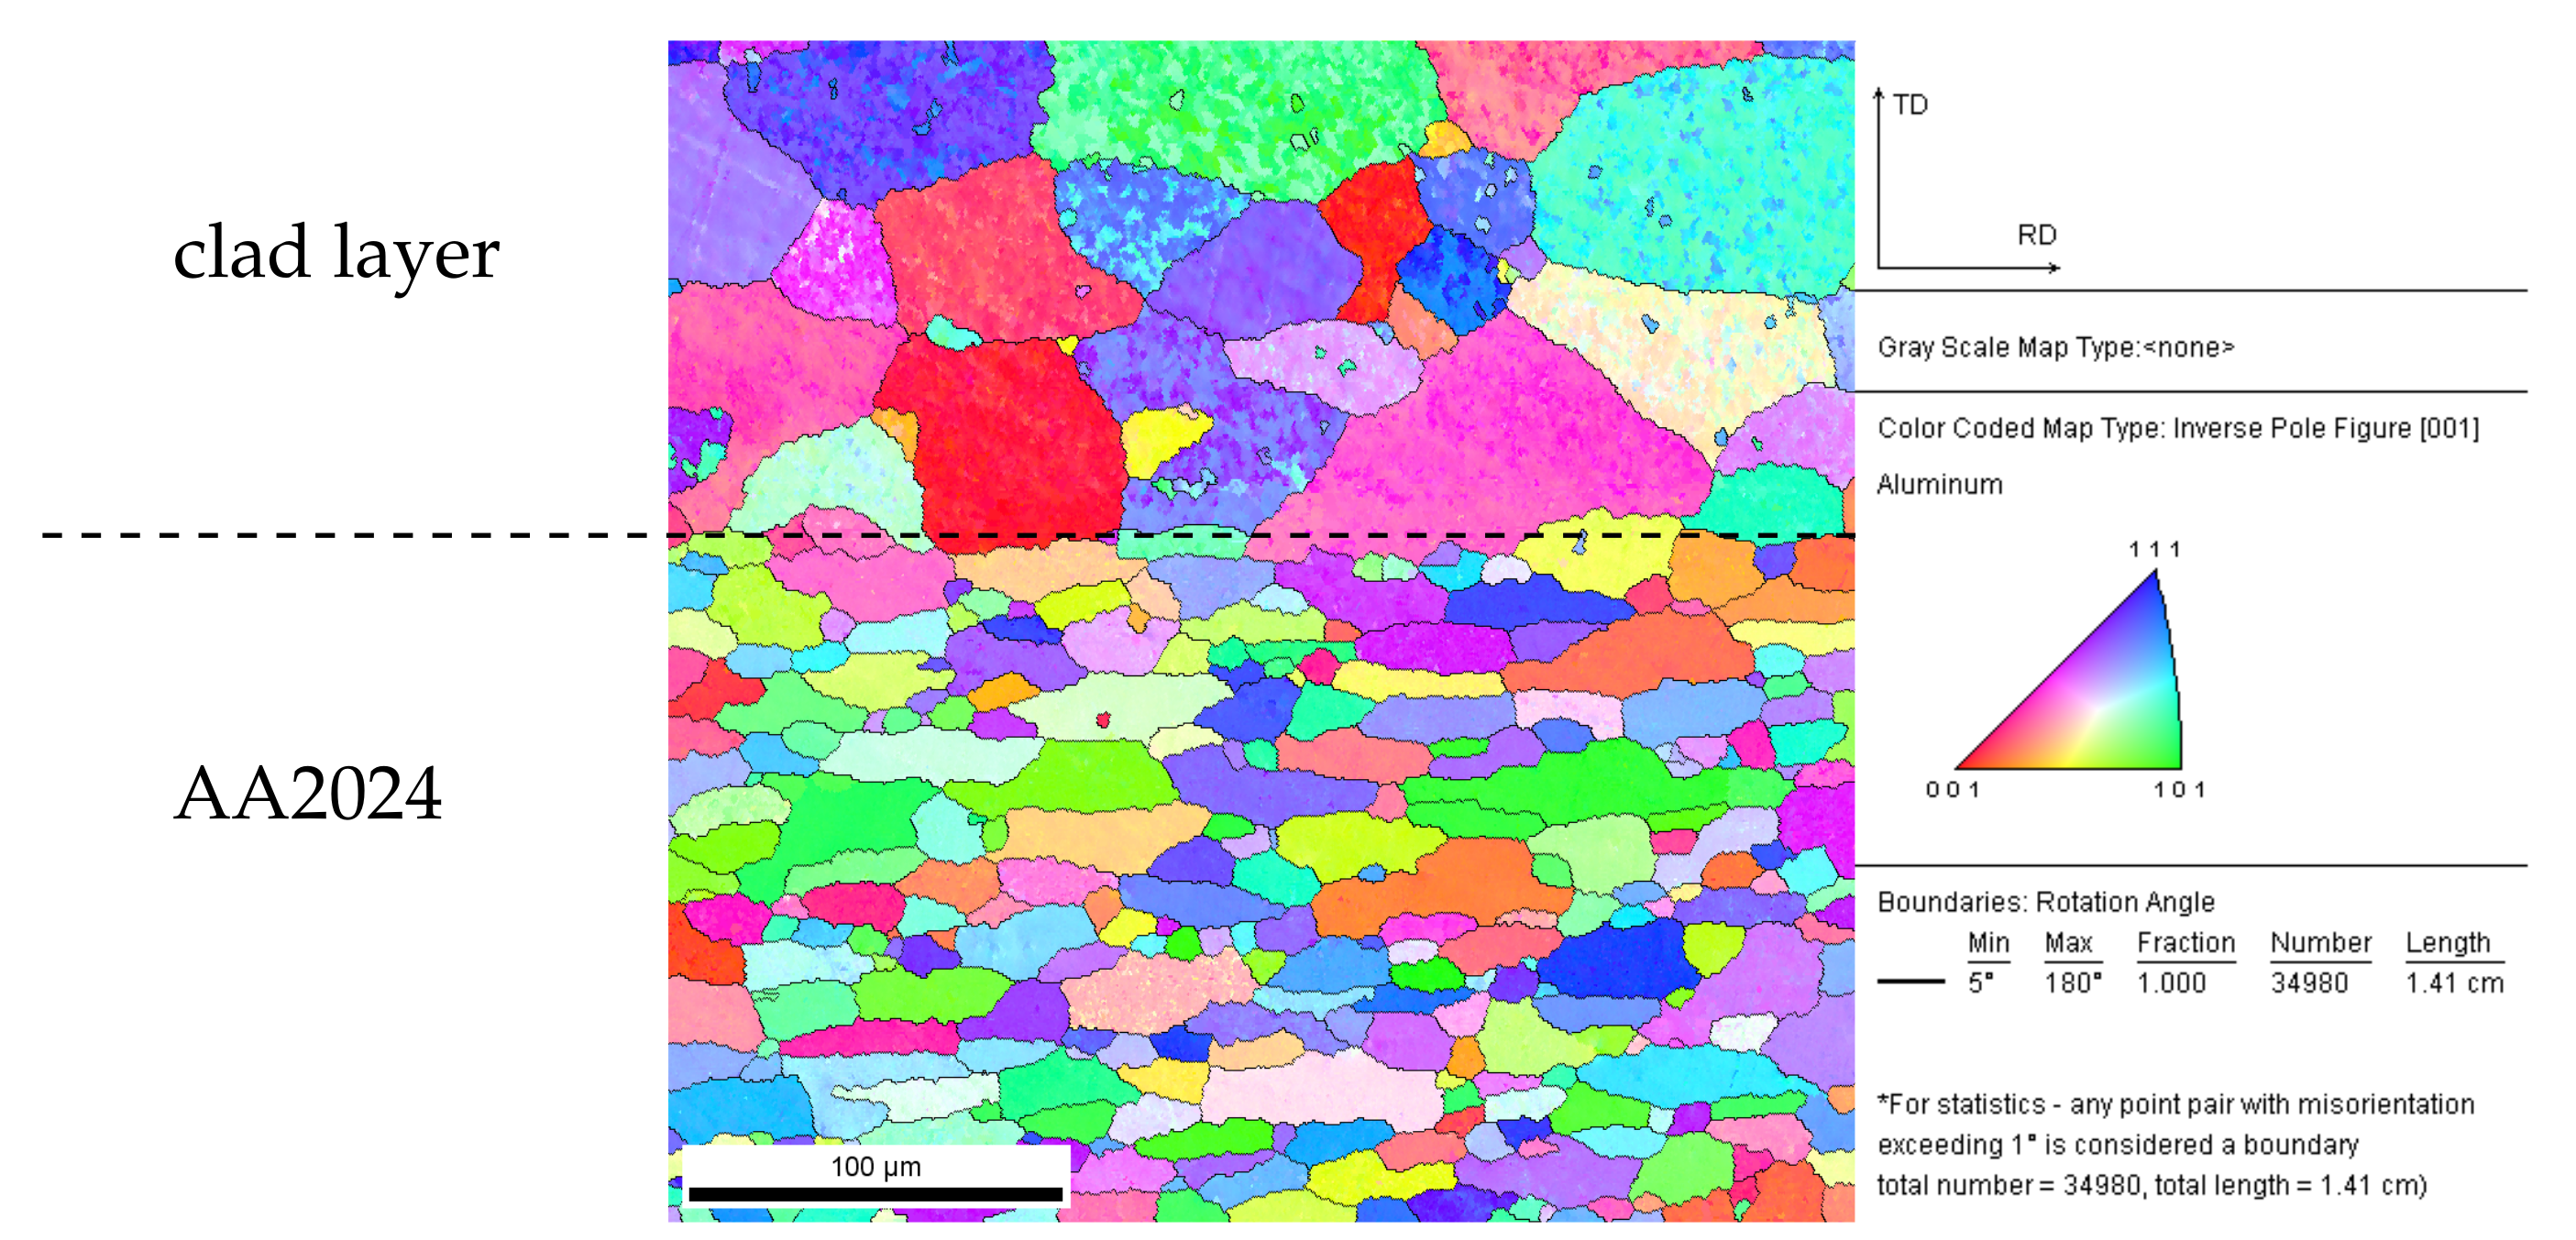
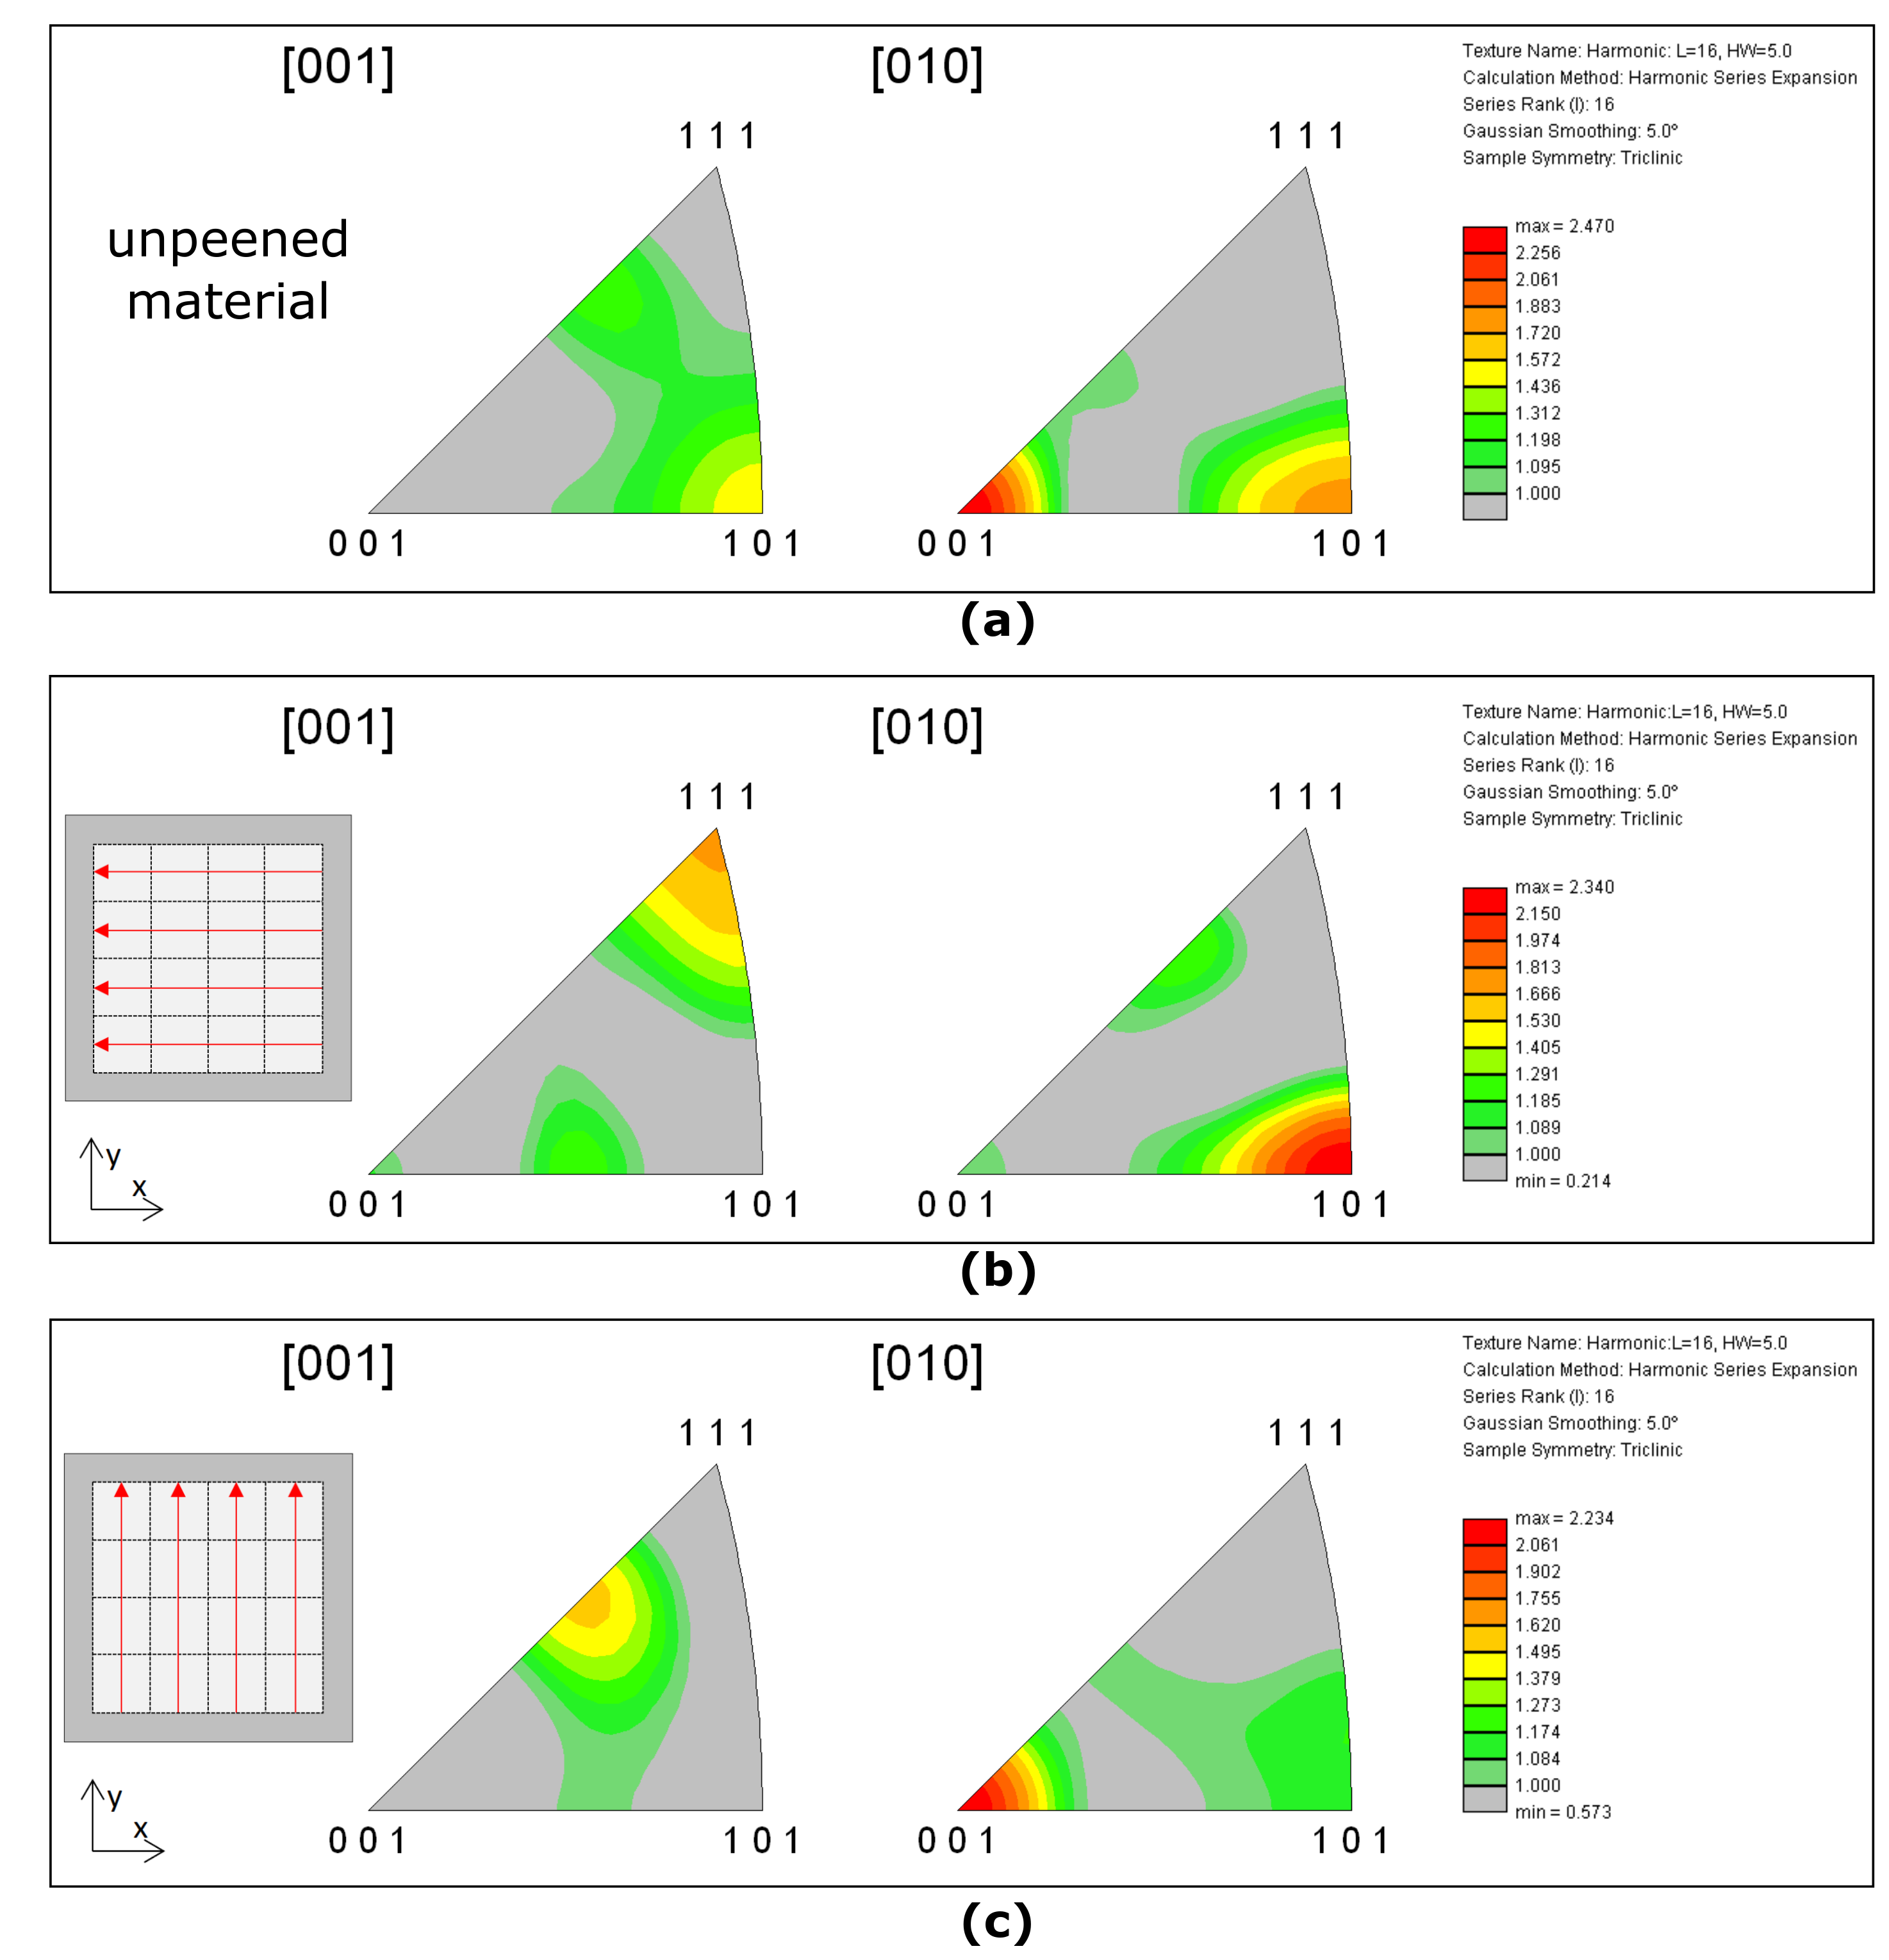
2.3. Determining Local Orientation via EBSD

The crystal orientations of rolled AA2024-T3clad within unpeened materials as well as LP treated regions close to the sheet surface are investigated using a scanning electron microscope (SEM) (JSM-6490LV with EBSD by EDAX, Jeol Ltd., Tokyo, Japan) combined with EBSD in order to clarify the question of how the crystal orientations of AA2024-T3clad have been changed by the LP treatment. The EBSD analysis is performed for an unpeened material as well as for two areas treated with one LP sequence at 1.5 J, where one was peened with the advancing direction parallel and the other one orthogonal to the rolling direction (RD). The specimens are prepared by means of multi-stage grinding and subsequent final polishing whereby the prepared plane was defined by the rolling direction and the direction of material thickness. The LP-treated samples are cut in the center of the peened areas. The specimens are analyzed at 30 kV, a beam current of 0.25 nA, an emission current of 78 μ A, a magnification of 300×, a working distance of 14 mm, a step size of 0.70 μ m, and a sample tilt of 70 . The area directly below the clad layer is analyzed in order to generate the inverse pole figures. Consequently, the clad layer is not included in the analysis with the inverse pole figures. The calculation of [001] and [010] inverse pole figures to determine the crystal directions was conducted on the basis of the generalized spherical harmonic expansion (GSHE) method and an assumed triclinic sample symmetry. [001] corresponds to the transverse direction (TD) and [010] to the thickness direction, the normal direction of the rolled AA2024-T3clad sheet.

3. Results and Discussion

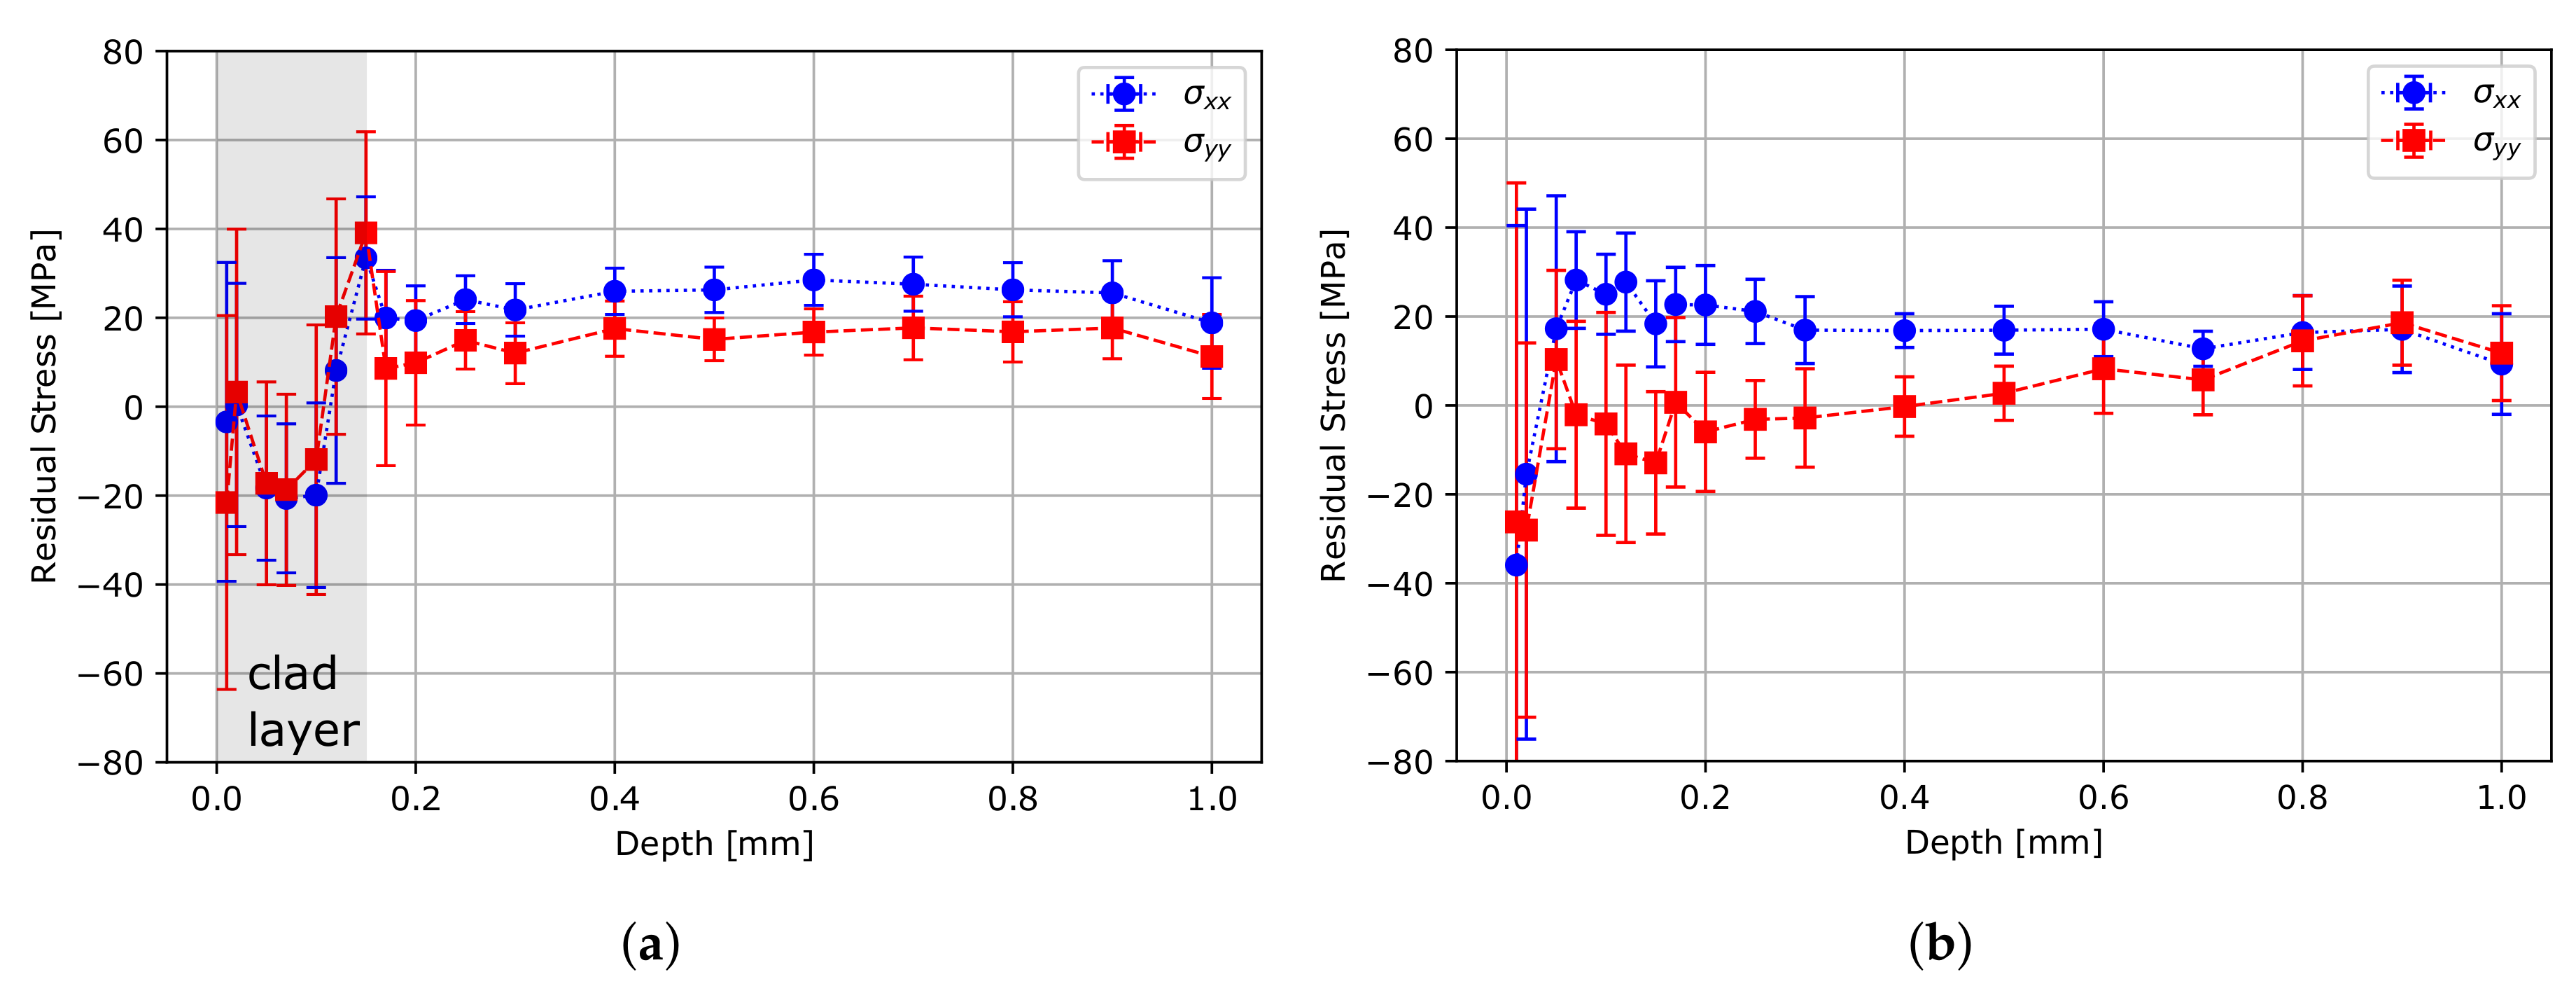
3.1. Residual Stresses in Base Material

The residual stress profiles for the unpeened AA2024-T3clad and AA2024-T3 (milled clad layer) specimens are given in Figure 2. Near the surface, both specimens show a relatively high standard deviation, whereas the milled specimen shows an even larger variation which might be related to the milling process. With increasing depth, the deviation decreases strongly. For the AA2024-T3clad specimen, compressive residual stresses are measured within the clad layer. Deeper residual stresses are tensile in the order of 20 MPa with less than a 10 MPa difference between both in-plane stress components. The specimen AA2024-T3 without a clad layer shows slightly higher compressive residual stresses directly underneath the material surface, whereas stresses within the material are slightly lower than for AA2024-T3clad. The minimal differences in residual stresses in both unpeened specimens can be related to the milling process.

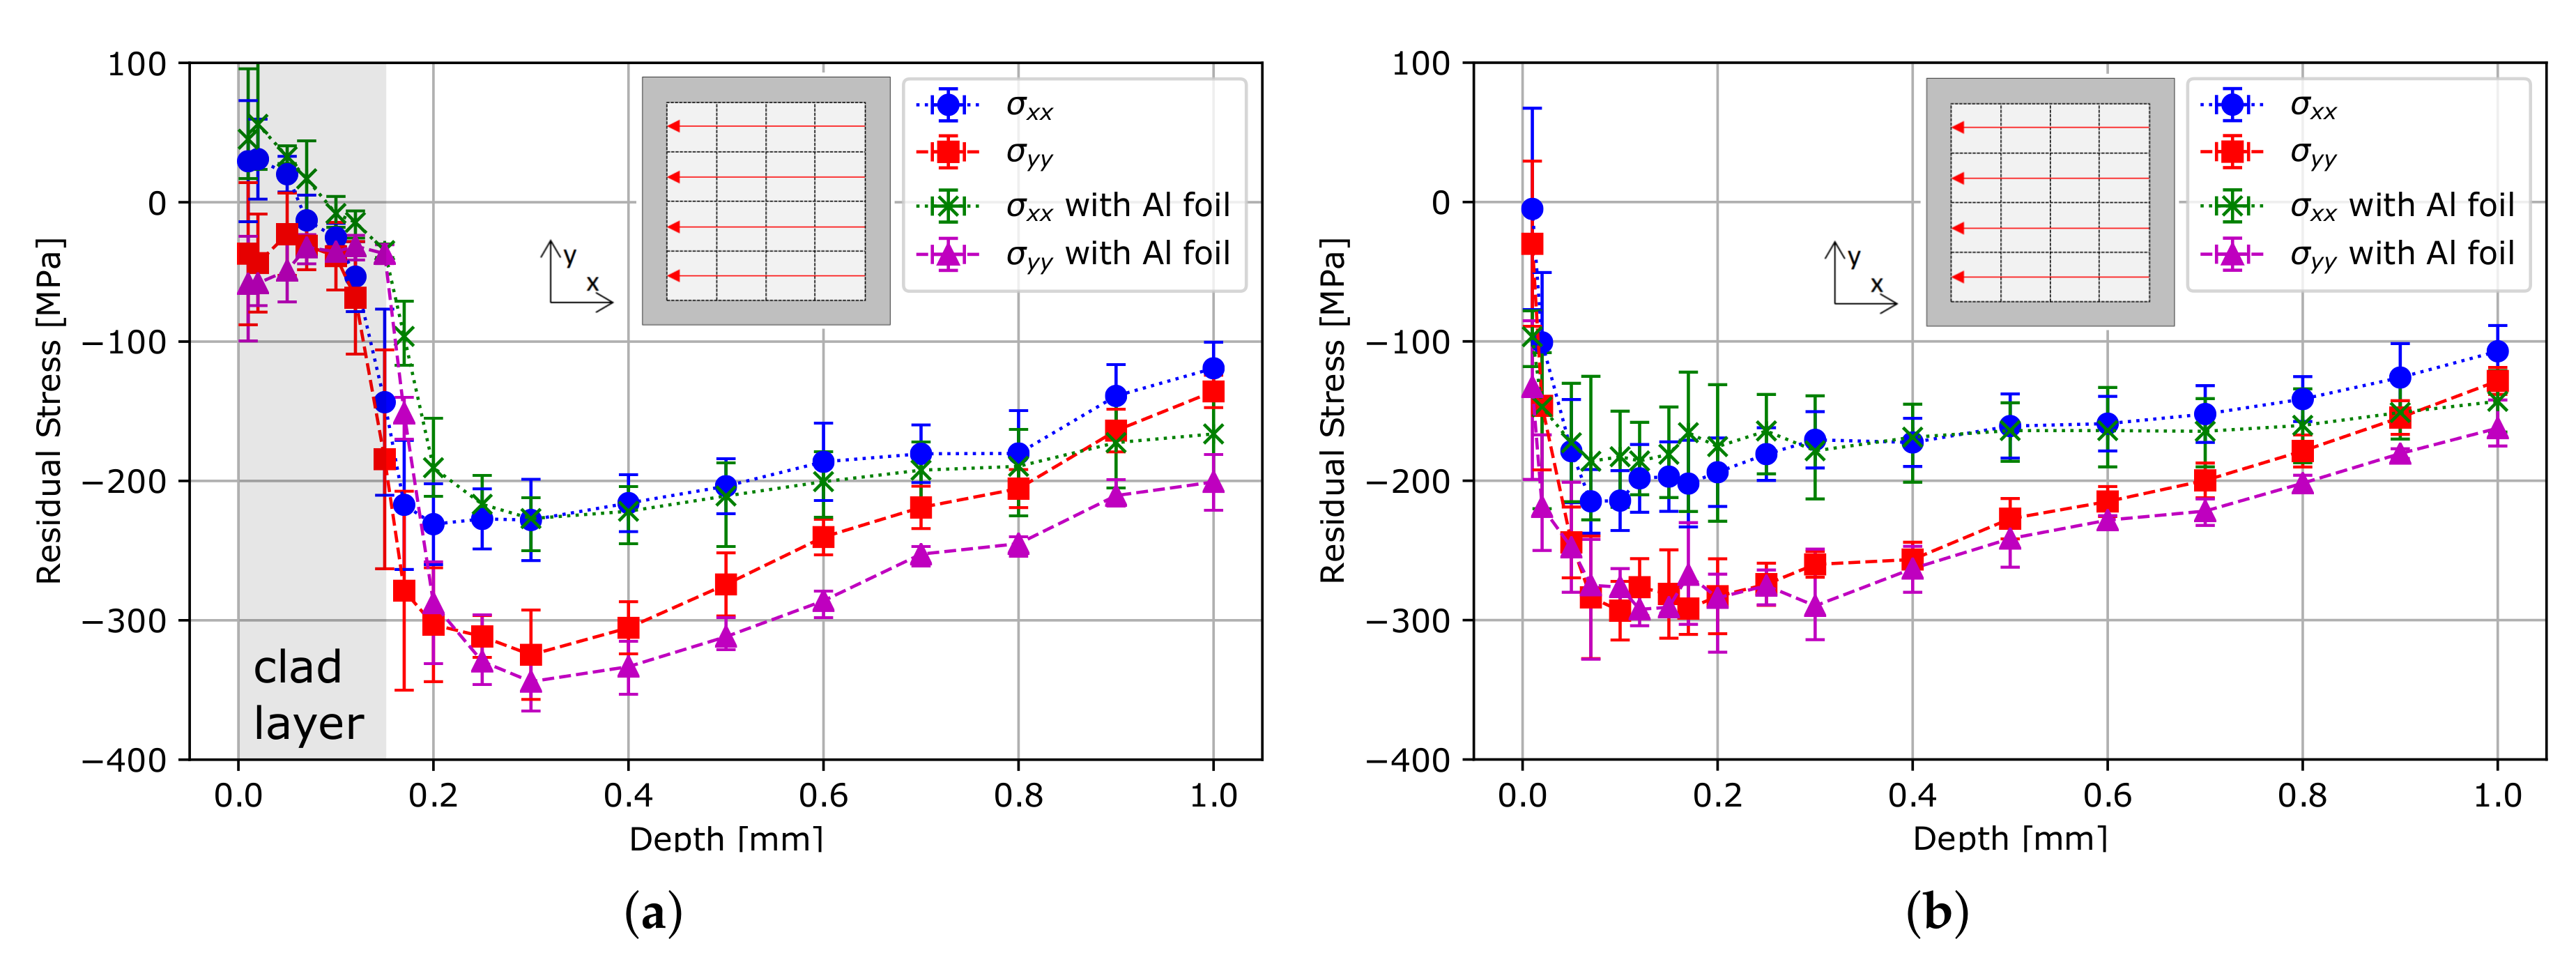
3.2. Influence of Clad Layer and Aluminum Foil

To investigate the influence of the clad layer, the specimens were peened parallel to the rolling direction. The resulting residual stresses show a non-equibiaxial profile (see Figure 3). The higher compressive residual stresses, σ y y , are orthogonal to the rolling direction. In comparison to AA2024-T3, AA2024-T3clad shows a different residual stress state near the surface. The clad layer led to an offset in the maximum residual stresses to a deeper depth, which corresponds to the clad layer thickness. The residual stresses within the clad layer are relatively low. Overall, the compressive residual stresses are slightly increased for AA2024-T3clad.
In industrial practice, an Al foil is often used. This leads to a better surface quality because the foil acts as thermal protection. Consequently, the energy input does not melt the surface of the material [23]. Slightly higher compressive residual stresses were measured for peening with Al foil of AA2024-T3 as well as AA2024-T3clad (see Figure 3). Especially for the measurement points in a depth larger than 0.4 mm, the differences are slightly more pronounced. Xu et al. [24] observed that a coating can increase the induced residual stresses, e.g., because of different absorption attributes of the laser energy. However, due to the fact that both the clad layer and foil consist of pure aluminum, no differences in absorption are expected. In this study, the increase detected is marginal compared to the absolute value of the residual stresses so that no significant influence of the Al foil on the residual stresses could be highlighted. Therefore, the effect is not discussed further.

3.3. Influence of Laser Pulse Pattern

The measurement results for different patterns and overlap, as presented schematically in Figure 1c–l, are compared to investigate the influence of the chosen laser pulse pattern on the residual stresses. Firstly, the effect of the chosen advancing direction, including row-wise changes, is discussed. This is followed by a discussion on the effect of overlap and, finally, peening with two sequences of orthogonal advancing directions.

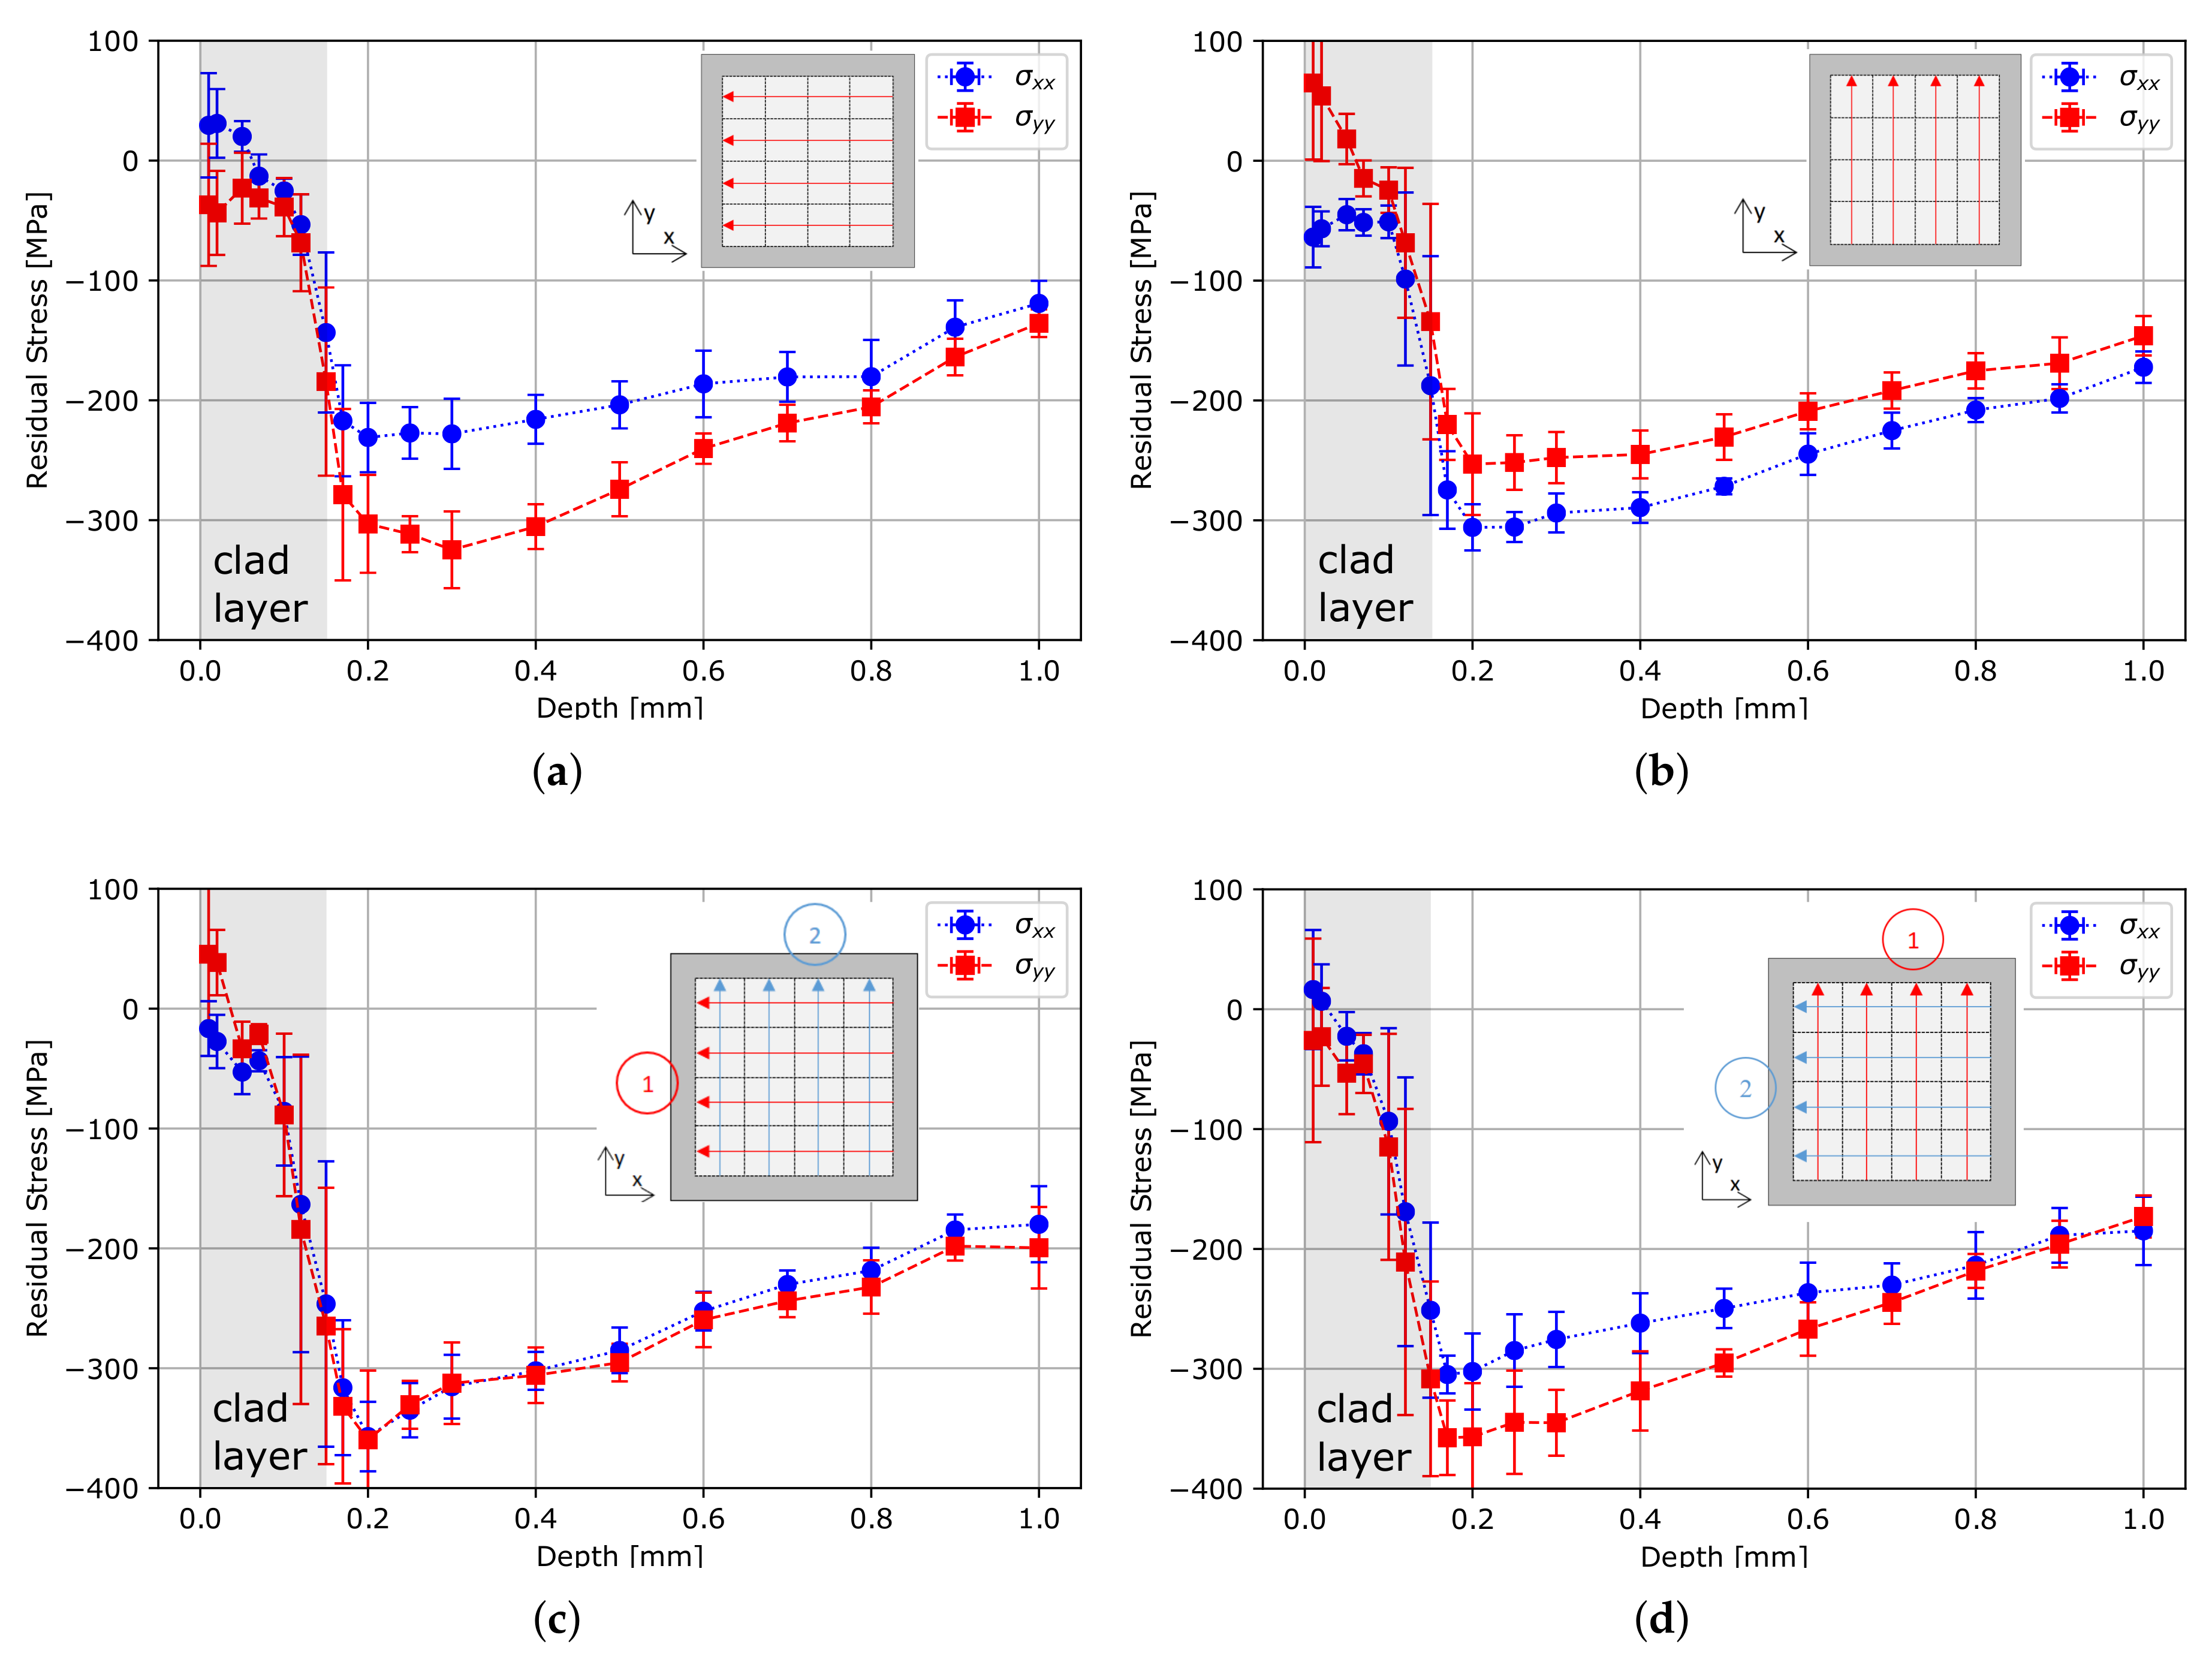
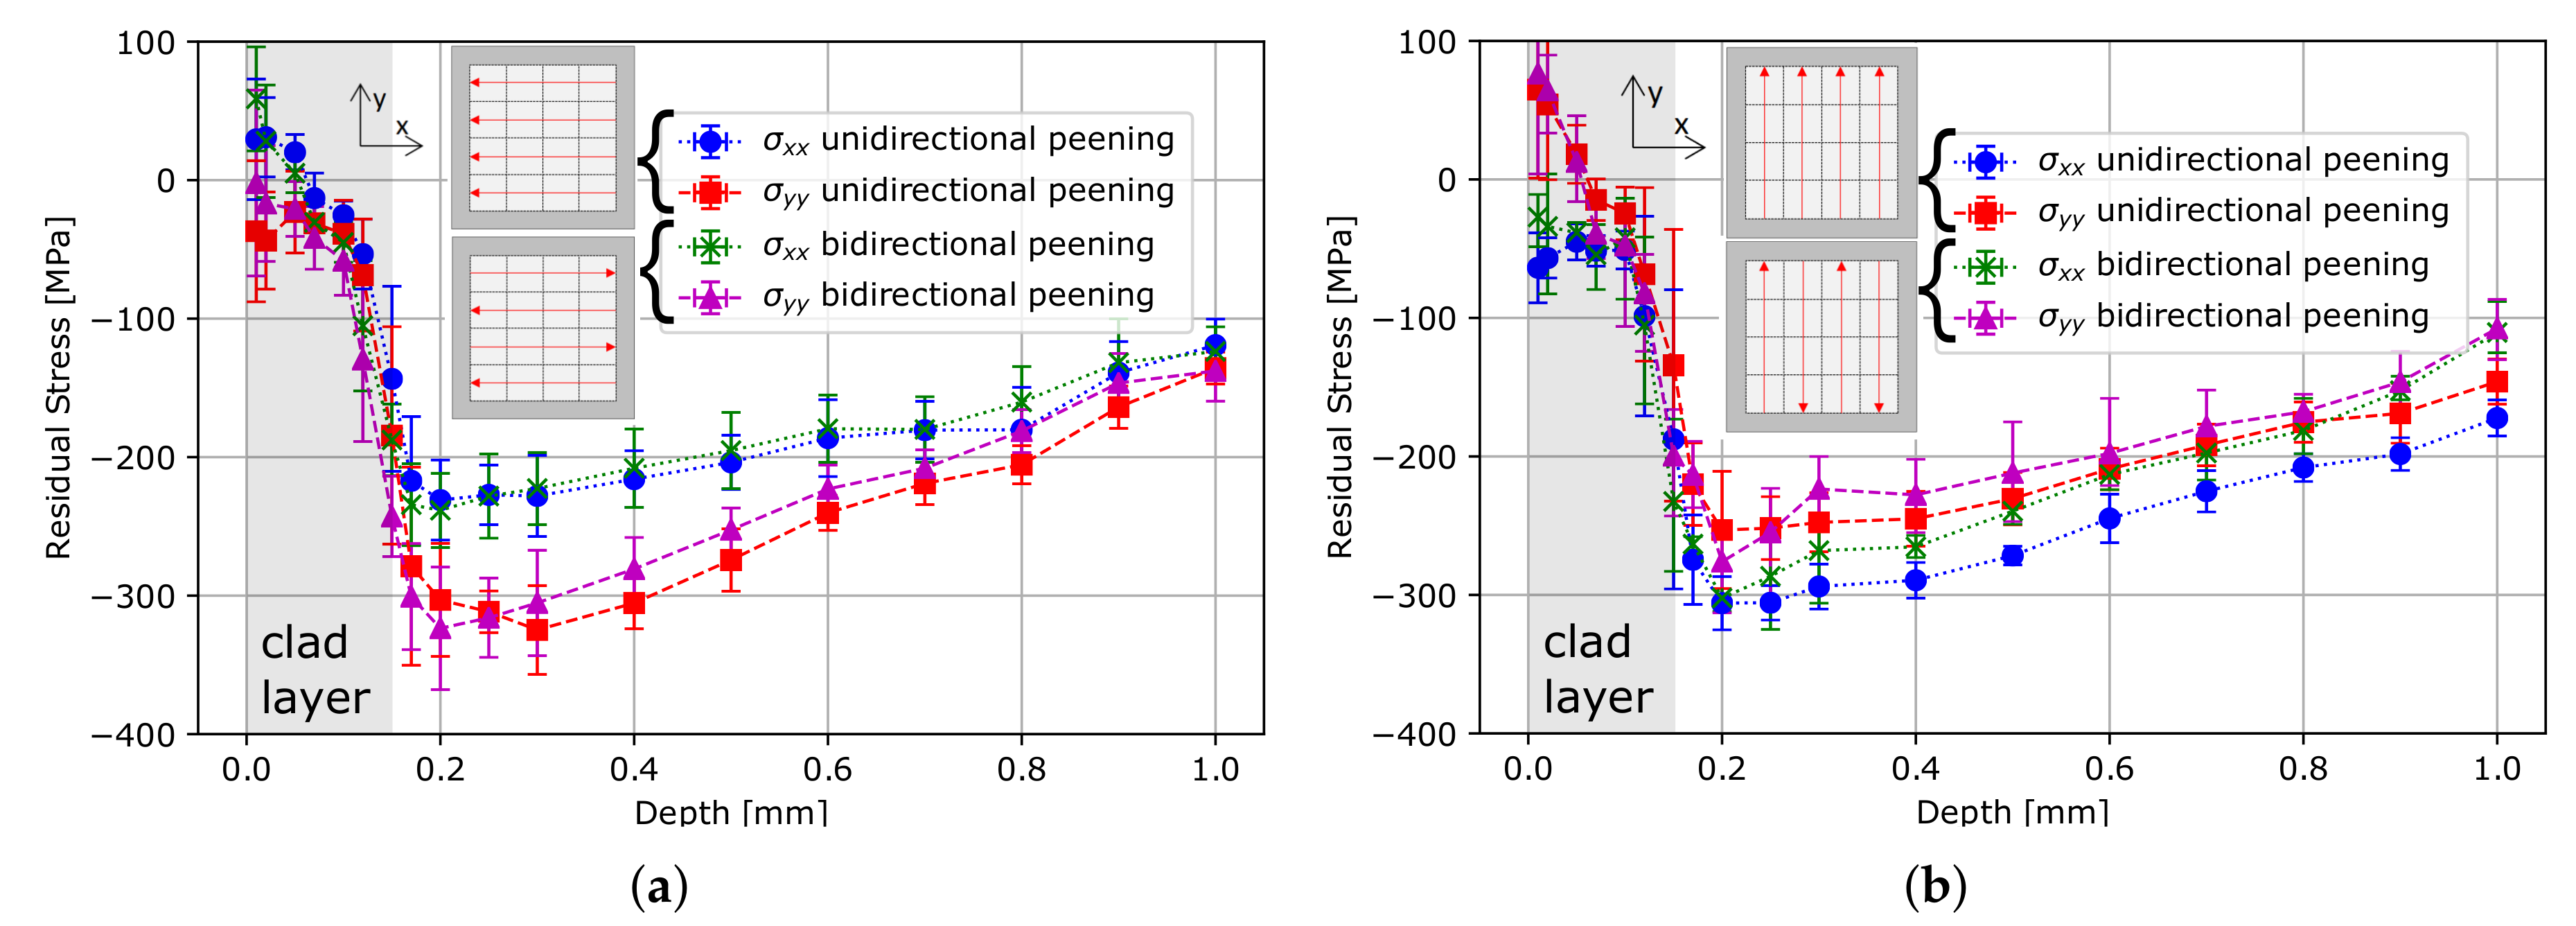
3.3.1. Influence of Advancing Direction

As already observed from the previous results, the residual stresses are non-equibiaxial for a single peening sequence where the stresses transversing to the advancing direction are larger than the parallel ones. The difference between both in-plane stress components is more pronounced for peening parallel to the rolling direction as compared to peening orthogonal to the rolling direction (see Figure 4a,b). The advancing direction determined which in-plane stress component dominates the residual stress profile. However, the absolute values of the maximum residual stresses as well as the values in a material depth of 1 mm are not significantly different for the two applied advancing directions. Especially for nonsymmetrical peening areas and structures, the choice of advancing direction could have an even more significant effect in this regard, which was seen in previous studies [14,15]. As illustrated in Figure 5, stress profiles for bidirectional peening (see Figure 1f,k) are not significantly different as compared to unidirectional peening (see Figure 1c,h). Therefore, a row-wise change in the advancing direction does not influence the resulting residual stress profile.
In order to correlate the observed residual stress profiles for different advancing directions to possible local orientation effects, EBSD measurements were performed. Unpeened AA2024-T3clad (see Figure 6) exhibits an orientation band between <1 0 1>//[001] and <1 1 2>//[001] whereby the crystal direction <1 0 1>//[001] is characterized by the highest axial intensity (see Figure 7a). In the normal direction, parallel to the material thickness, the crystal direction <0 0 1>//[010] is pronounced, followed by <1 0 1>//[001]. The incident laser beam mainly interacted with the (1 0 0) crystal planes at the beginning of the LP process.
The LP sequence parallel to the rolling direction leads to the formation of crystal directions such as <1 1 1>//[001], <1 0 2>//[001], and <0 0 1>//[001] (see Figure 7b). Furthermore, the crystal direction <0 0 1>//[010] parallel to the sheet normal direction shows a weakening whereas the axial intensity of <1 0 1>//[010] increased after the LP treatment. For instance, the weakening of <0 0 1>//[010] and the gain of <1 0 1>//[010] compared with orientations of the base material means a rotation around the [010] axis within 45 . The appearance of <1 1 2>//[010] having low axial intensity is the result of a split-up.
The LP sequence orthogonal to the rolling direction of the AA2024-T3clad sheet results in the formation of an orientation band between <1 1 2>//[001] and <1 0 2>//[001] (Figure 7c). This means a shift of the <1 0 1>//[001] crystal direction to <1 0 2>//[001] as well as an increase of axial intensity of the <1 1 2>//[001] crystal direction within the LP treated region. The <0 0 1>//[010] crystal direction has been retained, whereas the <1 0 1>//[010] showed a weakening compared to the base material and additionally a connection to <1 1 3>//[010].
The comparison to the base material shows that a significant change has taken place due to local plastic deformations induced by the propagating shock waves induced by LP. Kashaev et al. [25] reached a similar conclusion. However, different changes in local orientation were observed between the two applied advancing directions. The material seems to react differently depending on the choice of advancing direction which might be an explanation for the differences in the residual stress profiles. Especially, the weakening of initial axial intensities or pole densities seem to play a significant role. The results indicate that LP induced texture changes can be correlated to the development of misorientations within the microstructure as seen by the angle spreading of axial intensity distributions.

3.3.2. Influence of Overlap

The residual stress measurement results of the experiments with overlap are presented in Figure 8. The overlap rate was chosen to be 50 percent in one direction, as schematically shown in Figure 1d,e,i,j. An overlap of 50 percent, no matter if the overlap was parallel or orthogonal to the chosen advancing direction, led to a stronger non-equibiaxial residual stress state. The compressive stresses measured parallel to the advancing direction as well as the stress values at 1 mm depth were not influenced. The residual stresses orthogonal to the advancing direction were significantly higher for a peening with overlap than without. However, the reason for this observation is that the overall energy input the area receives is higher for peening with overlap, leading to increased residual stresses. The observed phenomenon agrees with the findings by Toparli and Fitzpatrick [13]. In this study, the effect of the overlap is stronger for a peening parallel to the rolling direction of the specimens (Figure 8b) than for peening orthogonal to the rolling direction (Figure 8c). The phenomenon that the non-equibiaxiality is more pronounced for peening parallel to the rolling direction was observed for all performed peening experiments. An overlap seems to intensify this effect. However, it should be noted that the measured residual stress values exceed 80 percent of the material’s yield strength. Consequently, the results can only be interpreted qualitatively; otherwise correction methods, such as those developed by Chupakhin et al. [22] for equibiaxial residual stress profiles, need to be adapted for the special application case.

3.3.3. Influence of Order of Different Shot Patterns

In this study, peening with two sequences means that the peening area is peened twice by advancing directions orthogonal to each other as schematically illustrated in Figure 1g,l. Figure 4c shows the residual stress profile for a specimen which was peened via an advancing direction parallel to the rolling direction and afterwards via an advancing direction orthogonal to the rolling direction. An equibiaxial stress profile was observed. In contrast, for a peening strategy where, first, the advancing direction is orthogonal and then the second one is parallel to the rolling direction, the stress state was non-equibiaxial (see Figure 4d). The stresses orthogonal to the rolling direction were higher compared to the ones parallel to the rolling direction. This is in contrast to the residual stress distribution only after the first sequence (see Figure 4a,b).
In accordance with the expectations, specimens peened with two sequences showed higher maximum residual stresses in comparison to one sequence peening. Comparing the stress profiles after two peening sequences (see Figure 4c,d) with the ones after one peening sequence (see Figure 4a,b), it was found that the compressive residual stresses orthogonal to the advancing direction of the second sequence were more significantly affected by the application of the second sequence than the parallel stresses. Therefore, the application of a second peening sequence influenced the stresses orthogonal to the chosen advancing direction, whereas the parallel stresses were hardly changed.
Overall, the measured residual stress profiles show that the order in which the advancing directions are applied on the surface is very important. The choice of peening pattern can control the stress value, the direction in which the highest stresses are induced, and by that, the difference between both in-plane stress components.

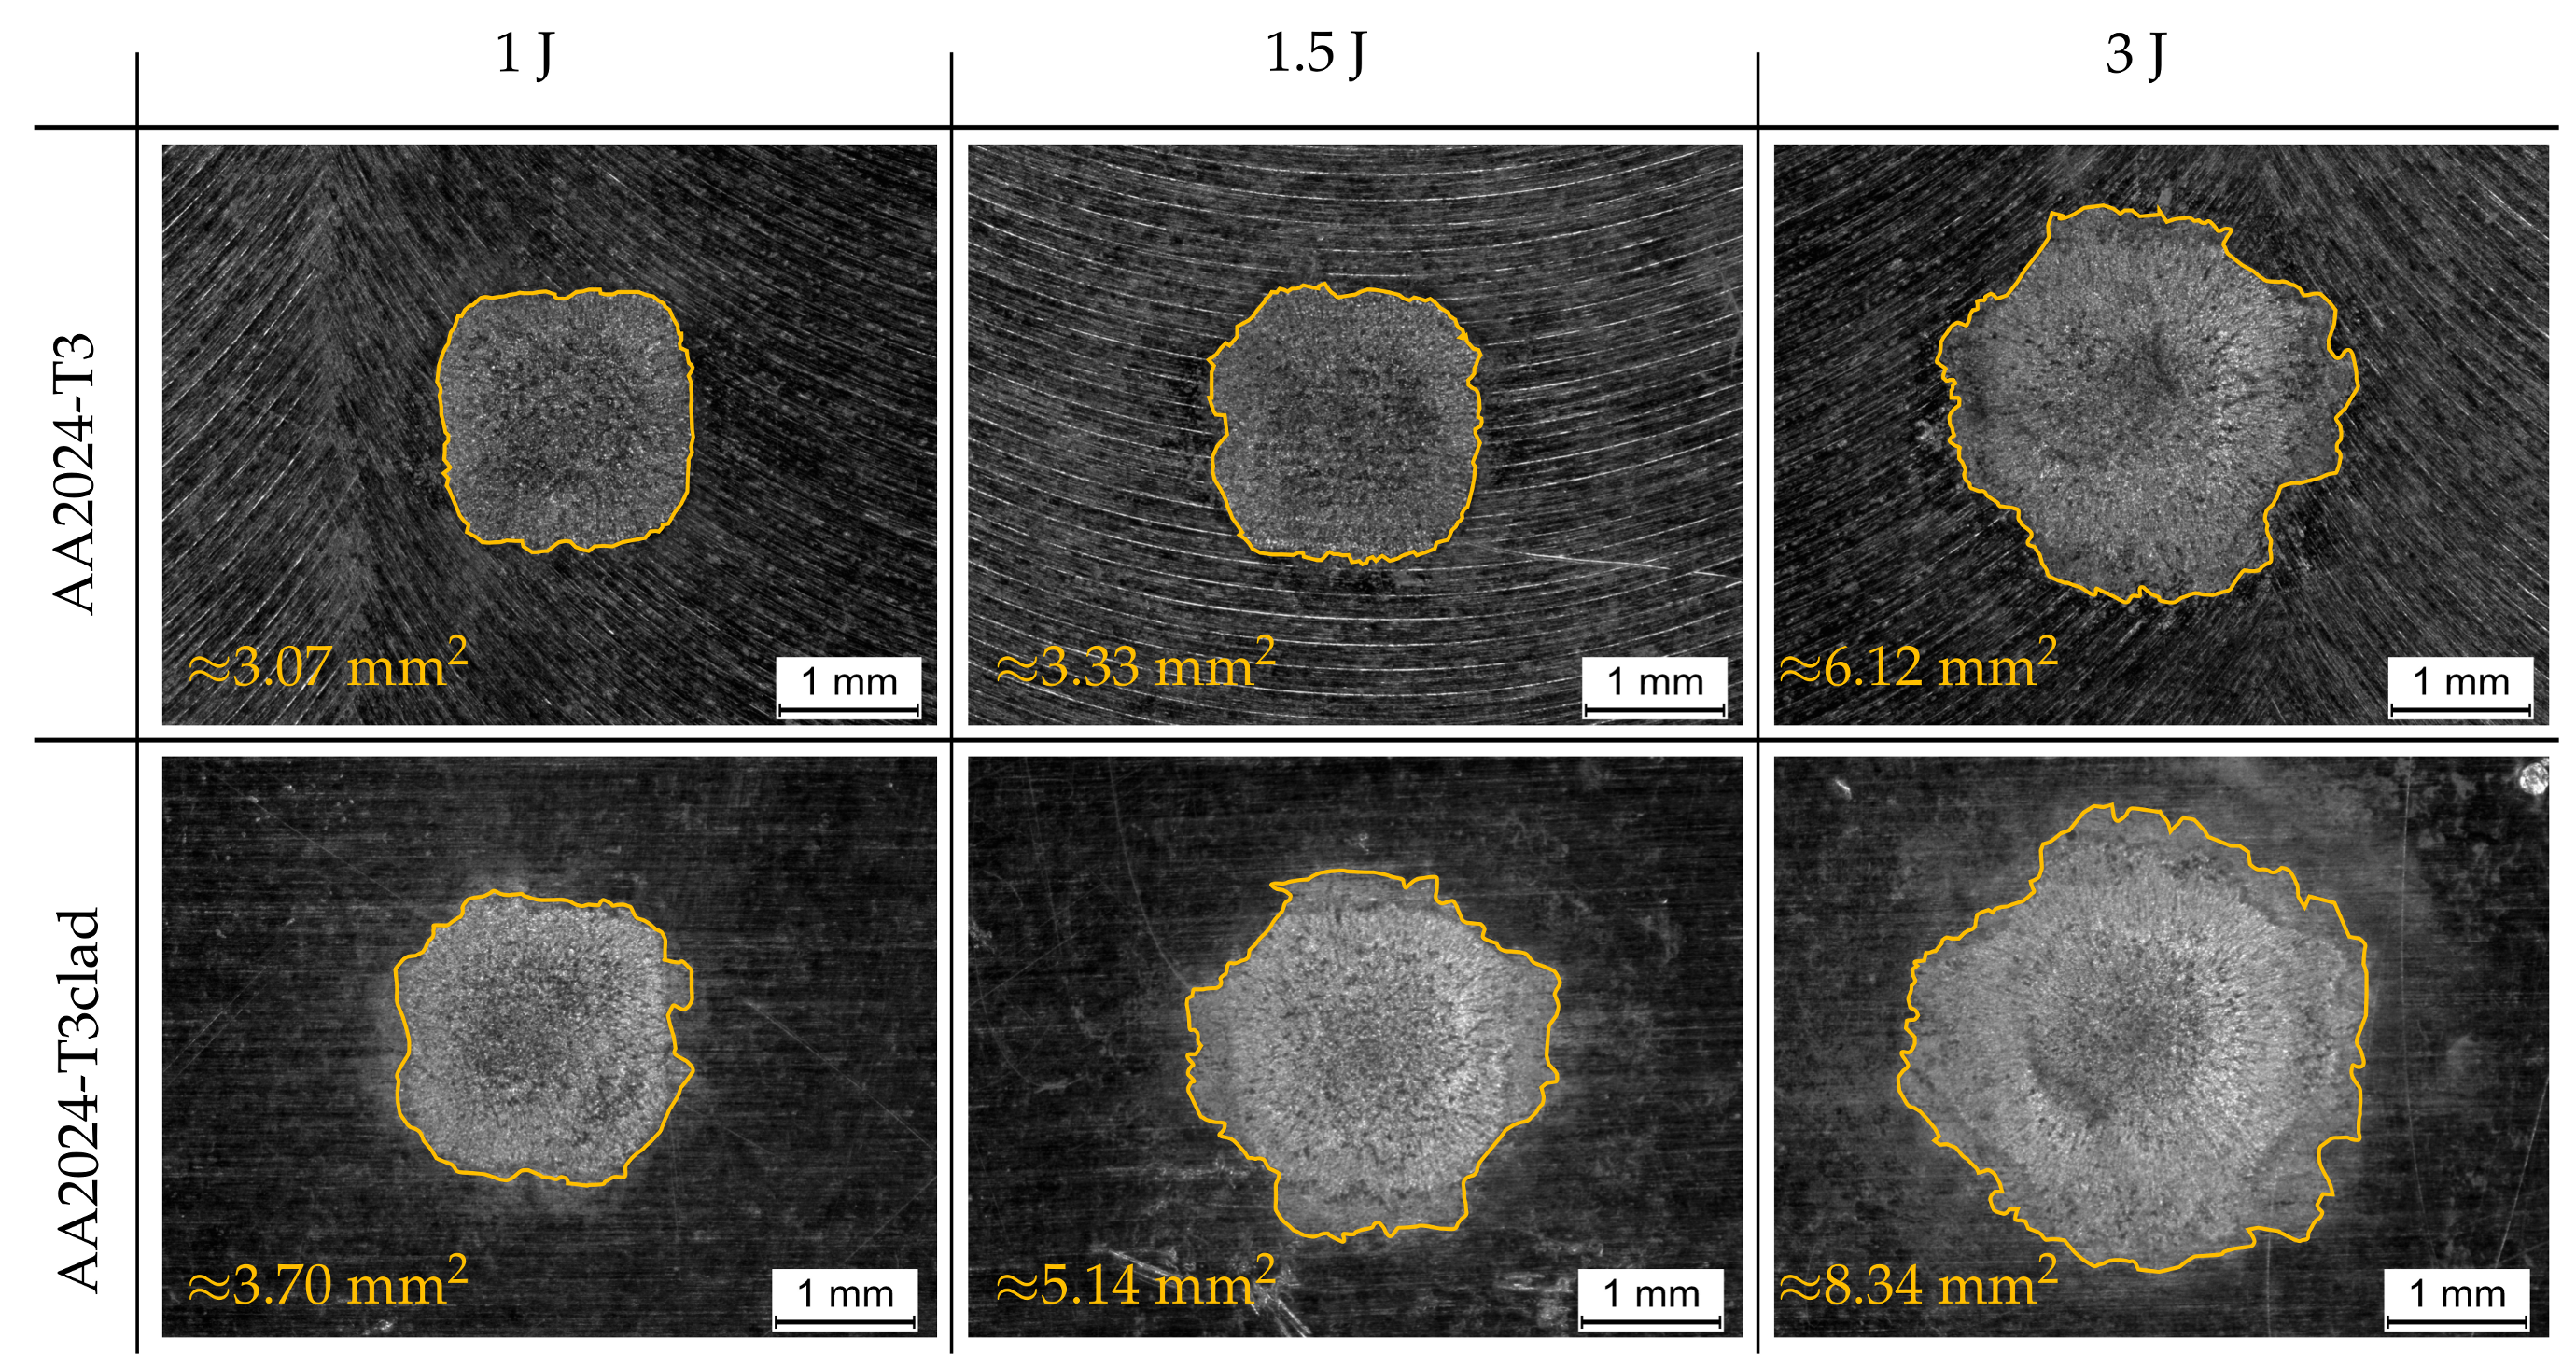
3.4. Influence of Laser Pulse Energy

In order to study the influence of the laser energy, first, single shots were investigated for AA2024-T3 and AA2024-T3clad specimens for laser pulse energies of 1 J, 1.5 J, and 3 J via light optical microscope (Leica DMI 5000M, Leica Microsystems GmbH, Wetzlar, Germany). The apparent influenced surface area by one single shot is significantly larger than the applied focus size of 1 mm × 1 mm, as illustrated by micrographs from the light microscope in Figure 9. For one shot with 1 J, the apparent influenced area is approximately 3.07 mm2 for AA2024-T3 and approximately 3.70 mm2 for AA2024-T3clad, indicating that the effect is slightly more significant for the cladded specimen. The micrograph obtained from scanning electron microscope (SEM) of the peened area for AA2024-T3clad (Figure 10) indicates that the affected surface area most probably represents molten surface material. The higher the applied laser energy, the larger is the apparent influenced area on the specimens’ surface by one single shot (see Figure 9). The shape of the influenced area is no longer a square. With increasing laser pulse energy, the influenced area of the single shot becomes more circular. Assuming that the influenced area correlates with the pressure affected area, this leads to overlapping effects even if the laser spots are positioned without overlap. Consequently, for higher laser energies, the overlap effect becomes more significant. This might be one reason for the increasing difference between both in-plane stress components (see Figure 11). Overall, higher laser pulse energies lead to higher compressive residual stresses at the depth of one millimeter, whereas the maximum value of compressive stresses does not seem to be affected significantly. In previous studies [8,10,11], it was observed that an increased energy density leads to deeper residual stresses which agrees with the results obtained by varying the energy input from 1 J to 3 J. However, the increase to 3 J did not lead to increased maximum residual stresses for the performed experiments. One aspect to consider in this regard is that the residual stresses induced by an energy input of 1 J are already close to the material’s yield strength, which is approximately 345 MPa for AA2024-T3 [26].
Experiments with increased energy input and experiments with overlap both showed the similar phenomenon of an increased difference between both in-plane stress components. The experiments with adjusted shot overlap of 50 percent qualitatively showed that the overlap rate is related to the non-equibiaxial stress profile, which agrees with the findings by Toparli and Fitzpatrick [13]. Therefore, a potential increase of the surface pressure-affected area related to the laser power density may influence the difference between both in-plane stress components. Increased laser pulse energy leads to a larger affected area, which might correlate with a different spatial pressure distribution. However, this effect is accompanied by an increased maximum pressure due to the increased pulse energy. These two effects superimpose for LP with increased pulse energies.
Besides the difference between both in-plane stress components, measurements for a higher laser power density show an increase in stress value at a 1 mm depth. This cannot be observed for the experiments with overlap in this study. We assume that the shape of the apparent influenced area is more circular at high energy densities and that the pressure distribution might not be uniform all over the affected area. Therefore, an increase in energy density could only be interpreted as a weak form of peening with overlap. In addition, as the experiments show a possible dependency of the difference between the stress components depending on the rolling direction, a possible anisotropic material behavior might be a mechanism to consider in explaining the difference between both in-plane stress components. Further investigation is needed for a substantiated interpretation of peening with high energy densities as a type of peening with overlap.
In summary, the overall energy input an area receives depends on pulse energy, overlap and number of sequences. Each aspect is crucial for the resulting residual stress distribution.

4. Conclusions

Residual stresses in the AA2024-T3clad and AA2024-T3 specimens for different peening strategies were investigated in this study. The effects of the clad layer, Al foil, choice of advancing direction, overlap as well as peening with two sequences on residual stress profiles were studied. The residual stresses were measured using the incremental hole-drilling technique, and for two shot patterns EBSD measurements were performed in order to study the local orientation changes exemplarily. Furthermore, the influence of one single shot with different energy impacts on the affected surface area was investigated. The conclusions of the study can be summarized as follows:
  • The clad layer influenced the stresses only within the clad layer and near the interface.
  • In this study, the use of an aluminum foil had no significant impact on the residual stresses. However, the effect of the LP process on the material surface is less severe for peening with Al foil.
  • Peening with one sequence led to a non-equibiaxial stress profile. The higher stresses were measured orthogonal to the chosen advancing direction. The residual stress profiles for an unidirectional peening strategy were not significantly different compared to bidirectional peening.
  • The EBSD analysis showed that the crystal orientation is different after the LP treatment with one peening sequence in comparison to the unpeened material. Depending on the choice of advancing direction, different crystal orientations were intensified. This finding indicates that the material reaction is different depending on the advancing direction. This observation possibly correlates with different residual stress profiles.
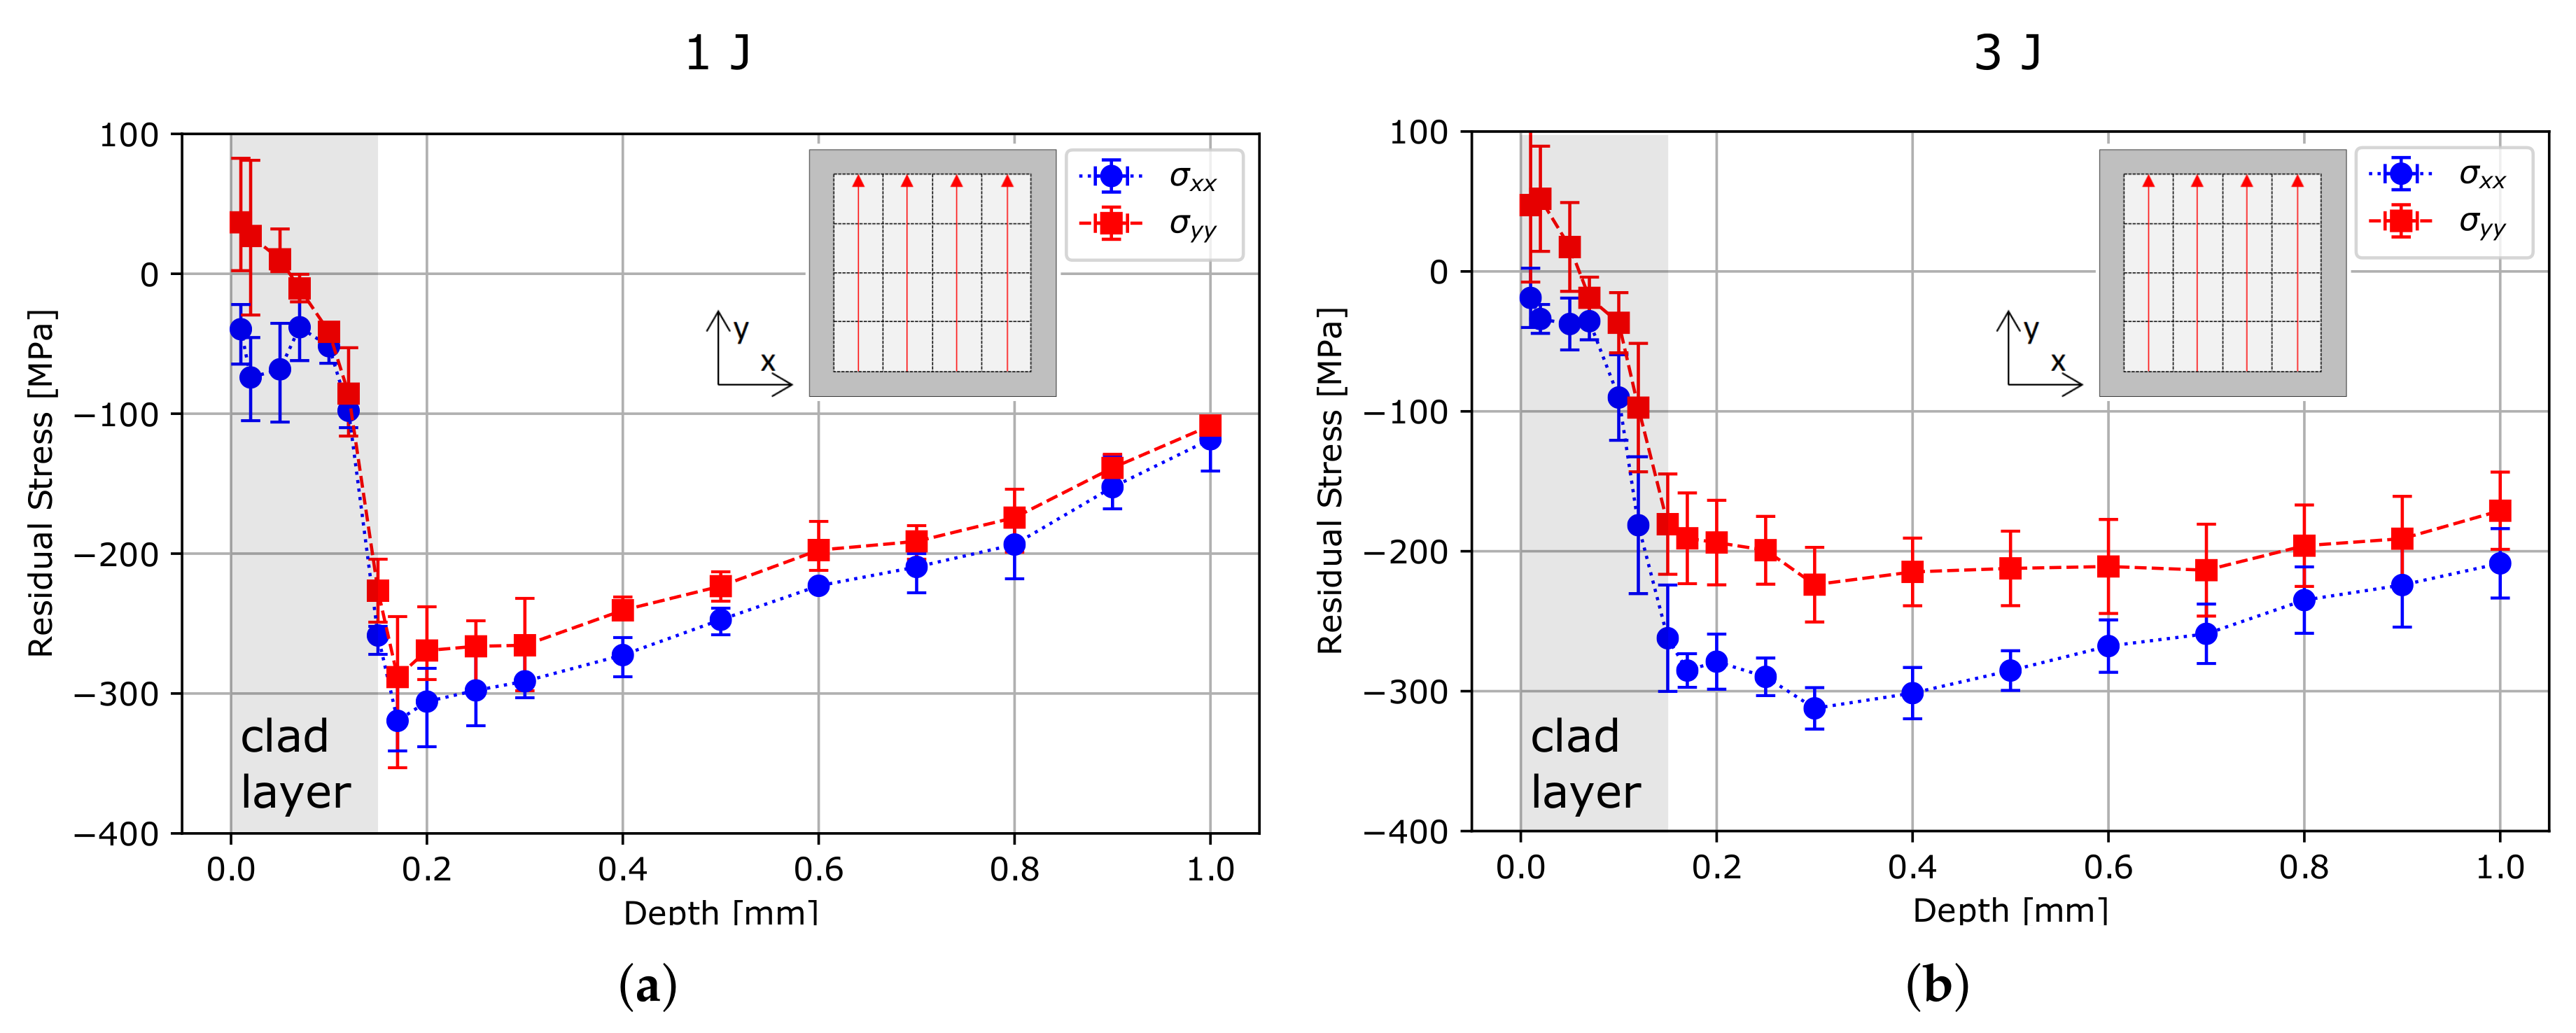
  • A shot overlap of 50 percent in one direction increased the residual stresses orthogonal to the advancing direction, leading to a more pronounced non-equibiaxial residual stress profile.
  • Peening with two sequences with different advancing directions chosen for each sequence can lead to an equibiaxial residual stress profile.
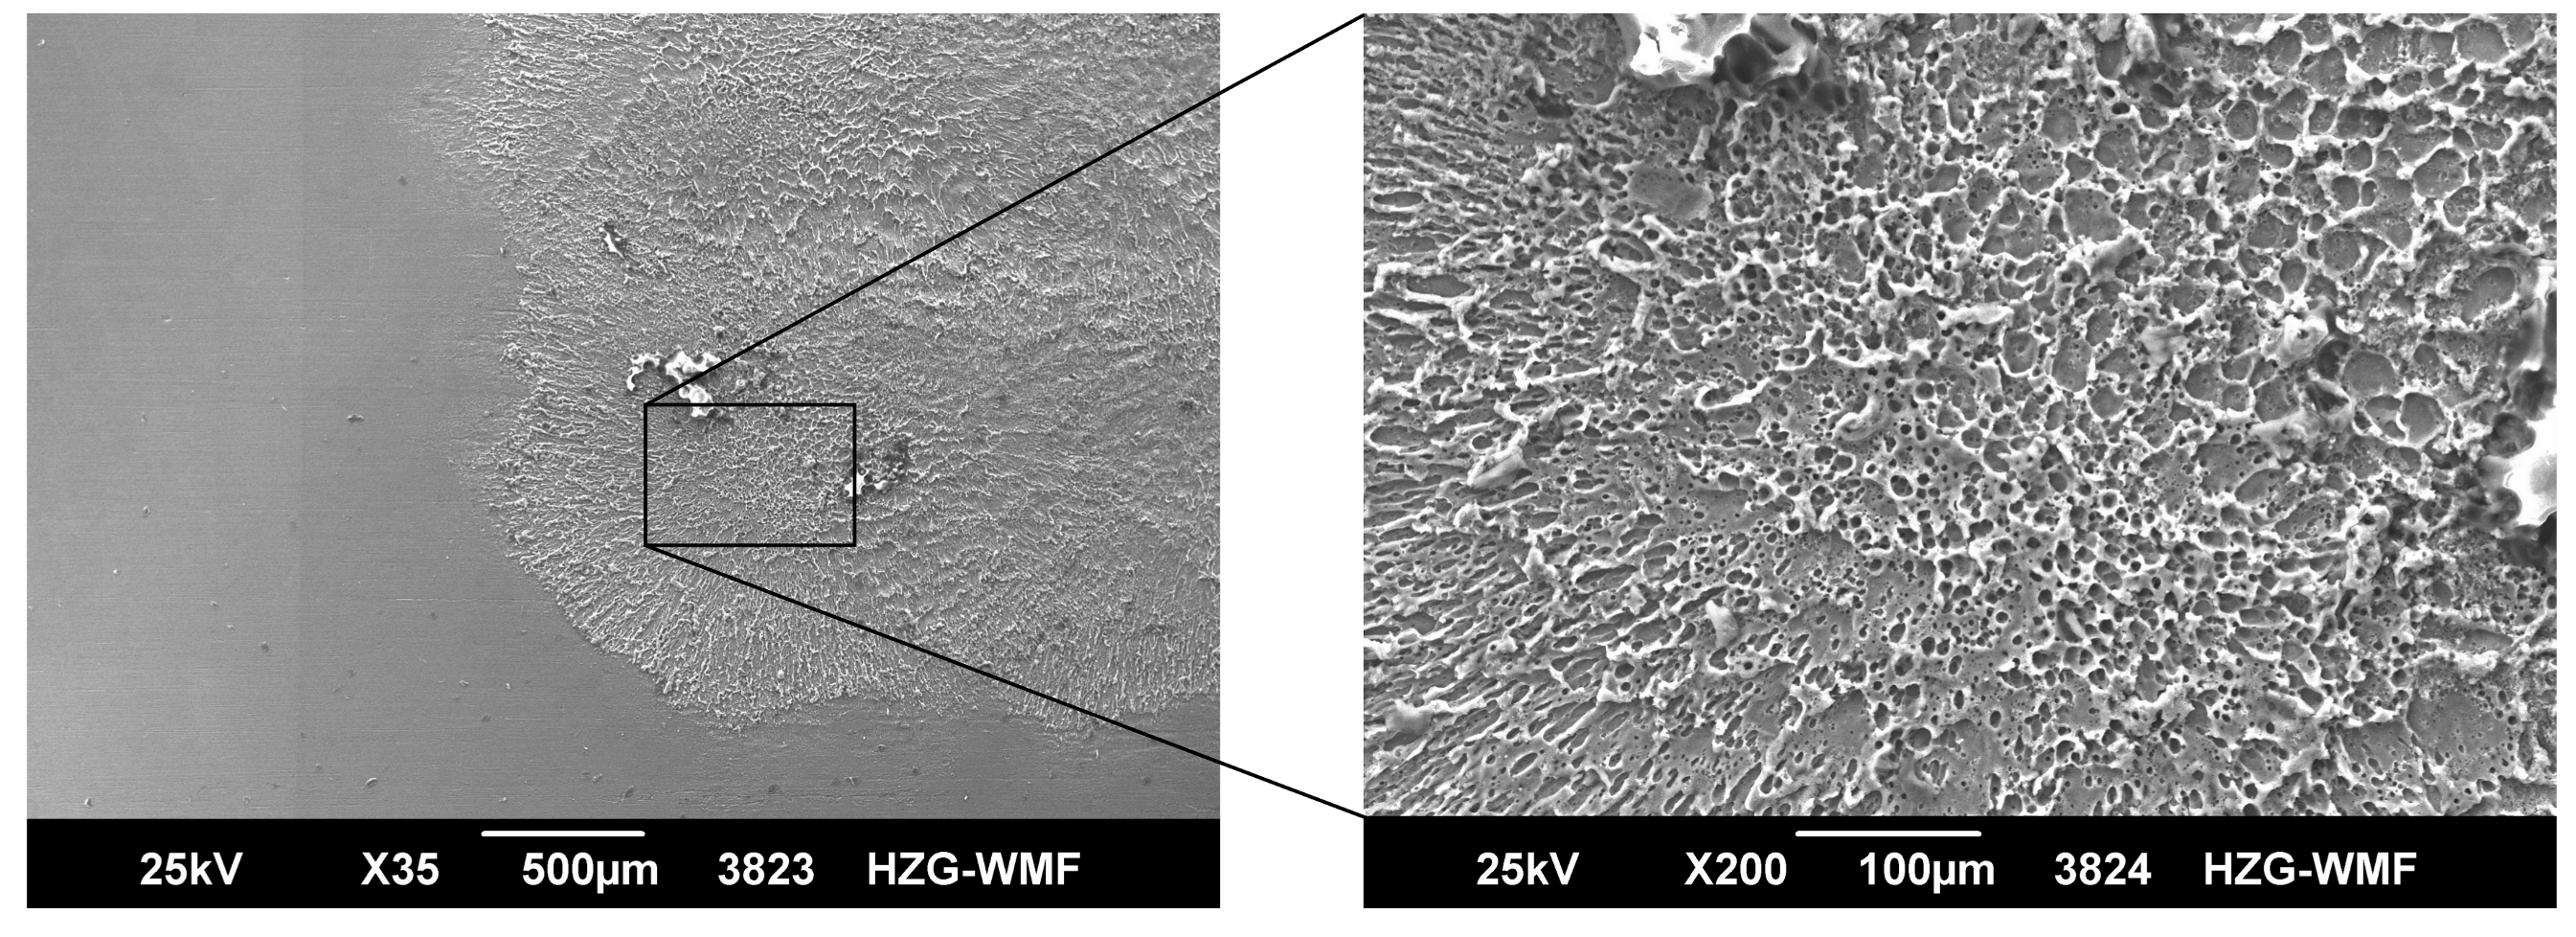
  • The investigation of single shots showed that the apparent influenced area on the surface of the specimens is significantly larger than the chosen focus size. Increasing laser energy led to an increase in the size of the affected surface area, which is more circular at high energy densities. If the energy input visually affects a larger area than the chosen focus size, a pressure overlap might occur and needs to be considered.

Author Contributions

Conceptualization, S.K. and B.K.; Methodology, S.K.; Investigation, Z.K.; EBSD investigation, V.V.; Resources, N.K.; Writing—original draft preparation, Z.K.; Writing—review and editing, Z.K., S.K., V.V., N.K. and B.K.; Visualization, Z.K.; supervision, B.K.

Funding

This research received no external funding

Acknowledgments

The authors would like to thank R. Dinse and F. Dorn for the preparation of the specimens.

Conflicts of Interest

The authors declare no conflict of interest.

References

  1. Dursun, T.; Soutis, C. Recent developments in advanced aircraft aluminium alloys. Mater. Des. 2014, 56, 862–871. [Google Scholar] [CrossRef]
  2. Reid, L. Sustaining an Aging Aircraft Fleet With Practical Life Enhancement Methods; Fatigue Technology: Tukwila, WA, USA, 2003. [Google Scholar]
  3. Ding, K.; Ye, L. (Eds.) Laser Shock Peening: Performance and Process Simulations; Woodhead Publishing in Materials; Woodhead: Cambridge, UK, 2006. [Google Scholar]
  4. Keller, S.; Horstmann, M.; Kashaev, N.; Klusemann, B. Experimentally validated multi-step simulation strategy to predict the fatigue crack propagation rate in residual stress fields after laser shock peening. Int. J. Fatigue 2019, 124, 265–276. [Google Scholar] [CrossRef]
  5. Clauer, A.H. Laser Shock Peening for fatigue resistance. In Proceedings of the Surface Performance of Titanium, Cincinnati, OH, USA, 7–9 October 1996; pp. 217–230. [Google Scholar]
  6. Warren, A.; Guo, Y.; Chen, S. Massive parallel laser shock peening: Simulation, analysis, and validation. Int. J. Fatigue 2008, 30, 188–197. [Google Scholar] [CrossRef]
  7. Sticchi, M.; Staron, P.; Sano, Y.; Meixer, M.; Klaus, M.; Rebelo-Kornmeier, J.; Huber, N.; Kashaev, N. A parametric study of laser spot size and coverage on the laser shock peening induced residual stress in thin aluminium samples. J. Eng. 2015, 2015, 97–105. [Google Scholar] [CrossRef]
  8. Hu, Y.; Gong, C.; Yao, Z.; Hu, J. Investigation on the non-homogeneity of residual stress field induced by laser shock peening. Surf. Coat. Technol. 2009, 203, 3503–3508. [Google Scholar] [CrossRef]
  9. Montross, C. Laser shock processing and its effects on microstructure and properties of metal alloys: A review. Int. J. Fatigue 2002, 24, 1021–1036. [Google Scholar] [CrossRef]
  10. Dorman, M.; Toparli, M.B.; Smyth, N.; Cini, A.; Fitzpatrick, M.E.; Irving, P.E. Effect of laser shock peening on residual stress and fatigue life of clad 2024 aluminium sheet containing scribe defects. Mater. Sci. Eng. A 2012, 548, 142–151. [Google Scholar] [CrossRef] [Green Version]
  11. Keller, S.; Chupakhin, S.; Staron, P.; Maawad, E.; Kashaev, N.; Klusemann, B. Experimental and numerical investigation of residual stresses in laser shock peened AA2198. J. Mater. Process. Technol. 2018, 255, 294–307. [Google Scholar] [CrossRef]
  12. Hu, Y.; Yao, Z.; Hu, J. 3-D FEM simulation of laser shock processing. Surf. Coat. Technol. 2006, 201, 1426–1435. [Google Scholar] [CrossRef]
  13. Toparli, M.B.; Fitzpatrick, M.E. Effect of Overlapping of Peen Spots on Residual Stresses in Laser-Peened Aluminium Sheets. Metall. Mater. Trans. A 2019, 50, 1109–1112. [Google Scholar] [CrossRef]
  14. Correa, C.; Ruiz de Lara, L.; Díaz, M.; Gil-Santos, A.; Porro, J.A.; Ocaña, J.L. Effect of advancing direction on fatigue life of 316L stainless steel specimens treated by double-sided laser shock peening. Int. J. Fatigue 2015, 79, 1–9. [Google Scholar] [CrossRef]
  15. Xu, G.; Luo, K.Y.; Dai, F.Z.; Lu, J.Z. Effects of scanning path and overlapping rate on residual stress of 316L stainless steel blade subjected to massive laser shock peening treatment with square spots. Appl. Surf. Sci. 2019, 481, 1053–1063. [Google Scholar] [CrossRef]
  16. Salimianrizi, A.; Foroozmehr, E.; Badrossamay, M.; Farrokhpour, H. Effect of Laser Shock Peening on surface properties and residual stress of Al6061-T6. Opt. Lasers Eng. 2016, 77, 112–117. [Google Scholar] [CrossRef]
  17. Correa, C.; Ruiz de Lara, L.; Díaz, M.; Porro, J.A.; García-Beltrán, A.; Ocaña, J.L. Influence of pulse sequence and edge material effect on fatigue life of Al2024-T351 specimens treated by laser shock processing. Int. J. Fatigue 2015, 70, 196–204. [Google Scholar] [CrossRef]
  18. Correa, C.; Peral, D.; Porro, J.A.; Díaz, M.; Ruiz de Lara, L.; García-Beltrán, A.; Ocaña, J.L. Random-type scanning patterns in laser shock peening without absorbing coating in 2024-T351 Al alloy: A solution to reduce residual stress anisotropy. Opt. Laser Technol. 2015, 73, 179–187. [Google Scholar] [CrossRef]
  19. Schajer, G.S. Advances in Hole-Drilling Residual Stress Measurements. Exp. Mech. 2010, 50, 159–168. [Google Scholar] [CrossRef]
  20. Steinzig, M.; Ponslet, E. Residual stress measurement using the hole drilling method and laser speckle interferometry Part I. Exp. Tech. 2003, 27, 59–63. [Google Scholar] [CrossRef]
  21. Ponslet, E.; Steinzig, M. Residual stress measurement using the hole drilling method and laser speckle interferometry Part III: Analysis technique. Exp. Tech. 2003, 27, 17–21. [Google Scholar] [CrossRef]
  22. Chupakhin, S.; Kashaev, N.; Klusemann, B.; Huber, N. Artificial neural network for correction of effects of plasticity in equibiaxial residual stress profiles measured by hole drilling. J. Strain Anal. Eng. 2017, 52, 137–151. [Google Scholar] [CrossRef]
  23. Peyre, P.; Fabbro, R. Laser shock processing: A review of the physics and applications. Opt. Quant. Electron. 1995, 27, 1213–1229. [Google Scholar]
  24. Xu, Y.Y.; Ren, X.D.; Zhang, Y.K.; Zhou, J.Z.; Zhang, X.Q. Coating Influence on Residual Stress in Laser Shock Processing. Key Eng. Mater. 2007, 353–358, 1753–1756. [Google Scholar] [CrossRef]
  25. Kashaev, N.; Ventzke, V.; Horstmann, M.; Chupakhin, S.; Riekehr, S.; Falck, R.; Maawad, E.; Staron, P.; Schell, N.; Huber, N. Effects of laser shock peening on the microstructure and fatigue crack propagation behaviour of thin AA2024 specimens. Int. J. Fatigue 2017, 98, 223–233. [Google Scholar] [CrossRef] [Green Version]
  26. Yang, J.M.; Her, Y.C.; Han, N.; Clauer, A.H. Laser shock peening on fatigue behavior of 2024-T3 Al alloy with fastener holes and stopholes. Mater. Sci. Eng. A 2001, 298, 296–299. [Google Scholar] [CrossRef]
Figure 1. (a) An illustration of the specimen dimensions with a schematic peening area; (b) a peened specimen after residual stress measurements; (cl) the schematic shot patterns used in this study: (cf) one peening sequence with an advancing direction parallel to the rolling direction: (c); (d) overlap in the advancing direction; (e) overlap orthogonal to the advancing direction; (f) a row-wise change in direction; (g) the application of two orthogonal shot patterns, first parallel and second orthogonal to the rolling direction; (hk) one peening sequence with an advancing direction orthogonal to the rolling direction: (h); (i) overlap in the advancing direction; (j) overlap orthogonal to the advancing direction; (k) a row-wise change in direction; (l) the application of two orthogonal shot pattern, first orthogonal and second parallel to the rolling direction.
Metals 09 00655 g001
Figure 2. The residual stress profile of unpeened materials: (a) AA2024-T3clad, the gray area indicates the clad layer; (b) AA2024-T3 (milled).
Metals 09 00655 g002
Figure 3. Laser Peening (LP) with and without Al foil: The advancing direction is chosen parallel to the rolling direction of the specimens: (a) AA2024-T3clad, the gray area indicates the clad layer; (b) AA2024-T3 (milled).
Metals 09 00655 g003
Figure 4. AA2024-T3clad: (a) one peening sequence with the LP advancing direction parallel to the rolling direction of the specimens; (b) one peening sequence with the LP advancing direction orthogonal to the rolling direction of the specimens; (c) two peening sequences with the first peening sequence advancing direction chosen parallel to the rolling direction and second peening sequence advancing direction chosen orthogonal to the rolling direction; (d) two peening sequences with the first peening sequence advancing direction chosen orthogonal to the rolling direction and the second peening sequence advancing direction chosen parallel to the rolling direction. The gray area indicates the clad layer.
Metals 09 00655 g004
Figure 5. LP with unidirectional and bidirectional advancing directions for AA2024-T3clad: (a) advancing direction parallel to the rolling direction; (b) advancing direction orthogonal to the rolling direction. The gray area indicates the clad layer.
Metals 09 00655 g005
Figure 6. Electron backscattered diffraction (EBSD) micrographs of unpeened AA2024-T3clad: the TD-direction is defined as the direction of the material’s thickness ([010]), and RD-direction is defined as the rolling direction ([100]).
Metals 09 00655 g006
Figure 7. Inverse pole figures of unpeened and peened AA2024-T3clad specimens: The [001] direction is orthogonal to the rolling direction; the [010] direction corresponds to the specimens’ thickness direction: (a) unpeened material; one peening sequence was applied where the advancing direction was parallel to the rolling direction (b) or orthogonal to the rolling direction (c).
Metals 09 00655 g007
Figure 8. Residual stress profiles of AA2024-T3clad after LP for different advancing directions by varying the overlap, parallel or orthogonal to the advancing direction of the peening: No overlap, as well as 50 percent overlap are considered. Advancing direction either parallel ((a) σ x x ; (b) σ y y ) or orthogonal ((c) σ x x ; (d) σ y y ) to rolling direction. The gray area indicates the clad layer.
Metals 09 00655 g008
Figure 9. Light optical micrographs for AA2024-T3clad and AA2024-T3 for single LP shots with a 1 mm × 1 mm squared laser focus with three laser energies: 1 J, 1.5 J, and 3 J. The size of the affected area on the specimens’ surface is indicated.
Metals 09 00655 g009
Figure 10. SEM micrographs of an AA2024-T3clad peened area applying two sequences by using a laser focus size of 1 mm × 1 mm and a laser pulse energy of 1.5 J. For the first sequence, the advancing direction was chosen to be orthogonal and, in the second sequence, parallel to the rolling direction (see Figure 1l). The surface area indicates molten surface material for the peened area.
Metals 09 00655 g010
Figure 11. Residual stress profiles for AA2024-T3clad specimens with the advancing direction chosen orthogonal to the rolling direction: (a) 1 J and (b) 3 J. The gray area indicates the clad layer.
Metals 09 00655 g011

