3.4. EIS Tests in SDW
The corrosion resistance of F3, F4, B1 (L and T), and B2 (L and T) in SDW was monitored by recording the EIS spectra at specific immersion times, during 150 days of immersion.
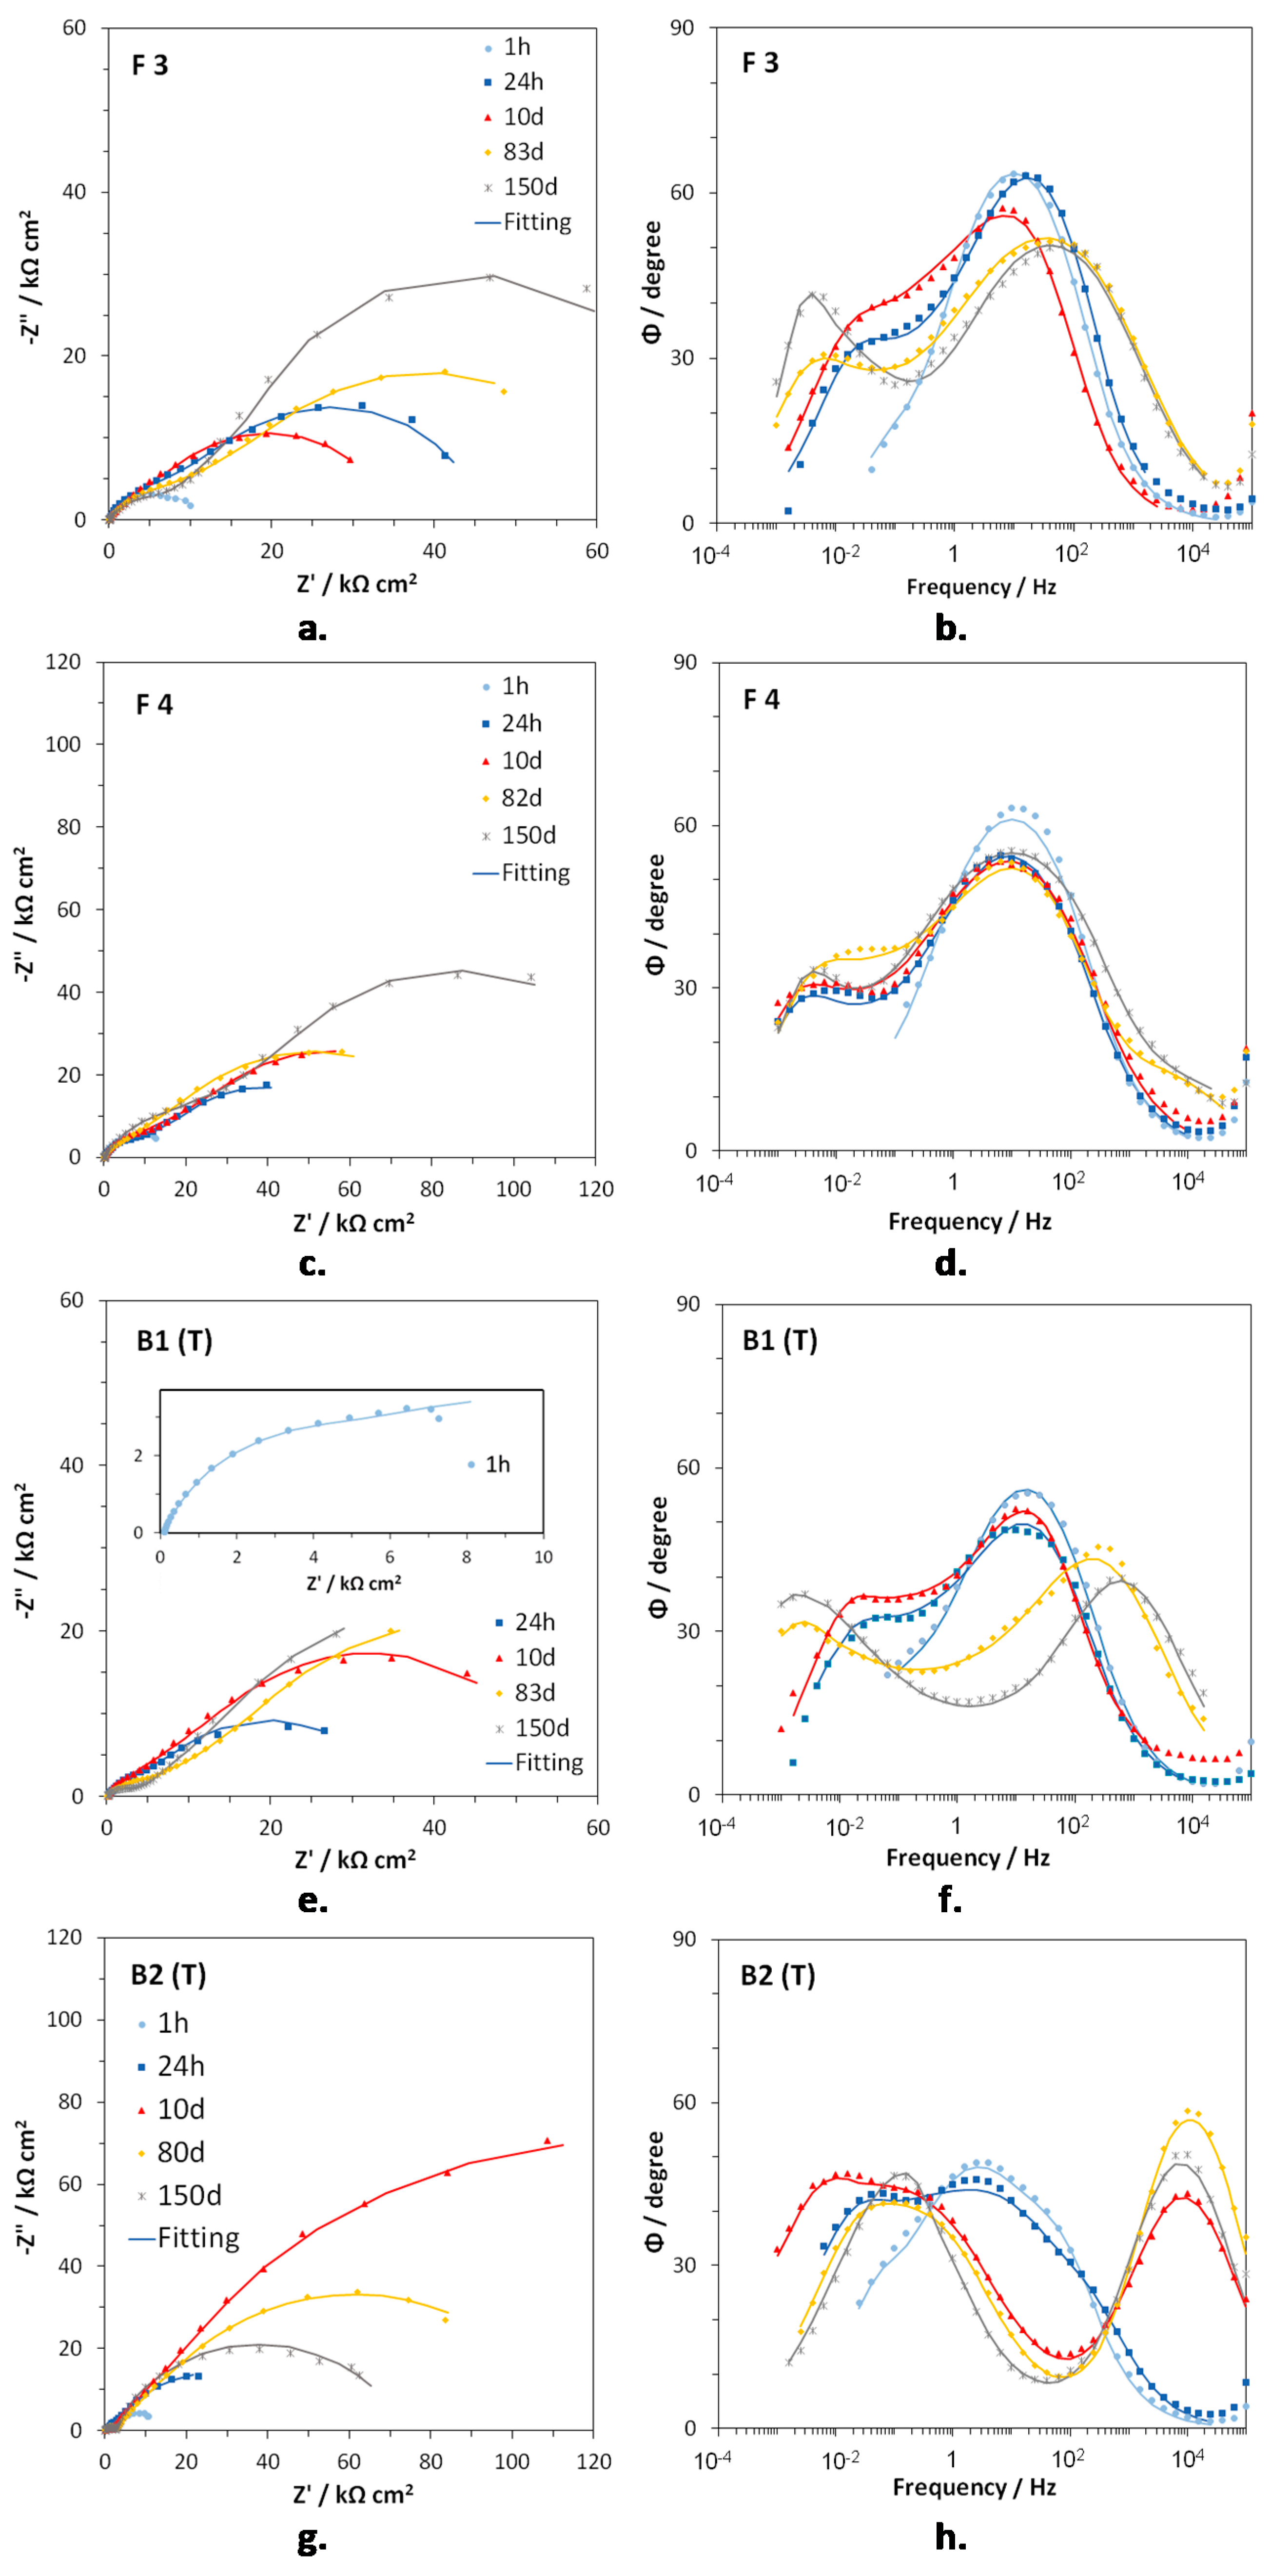
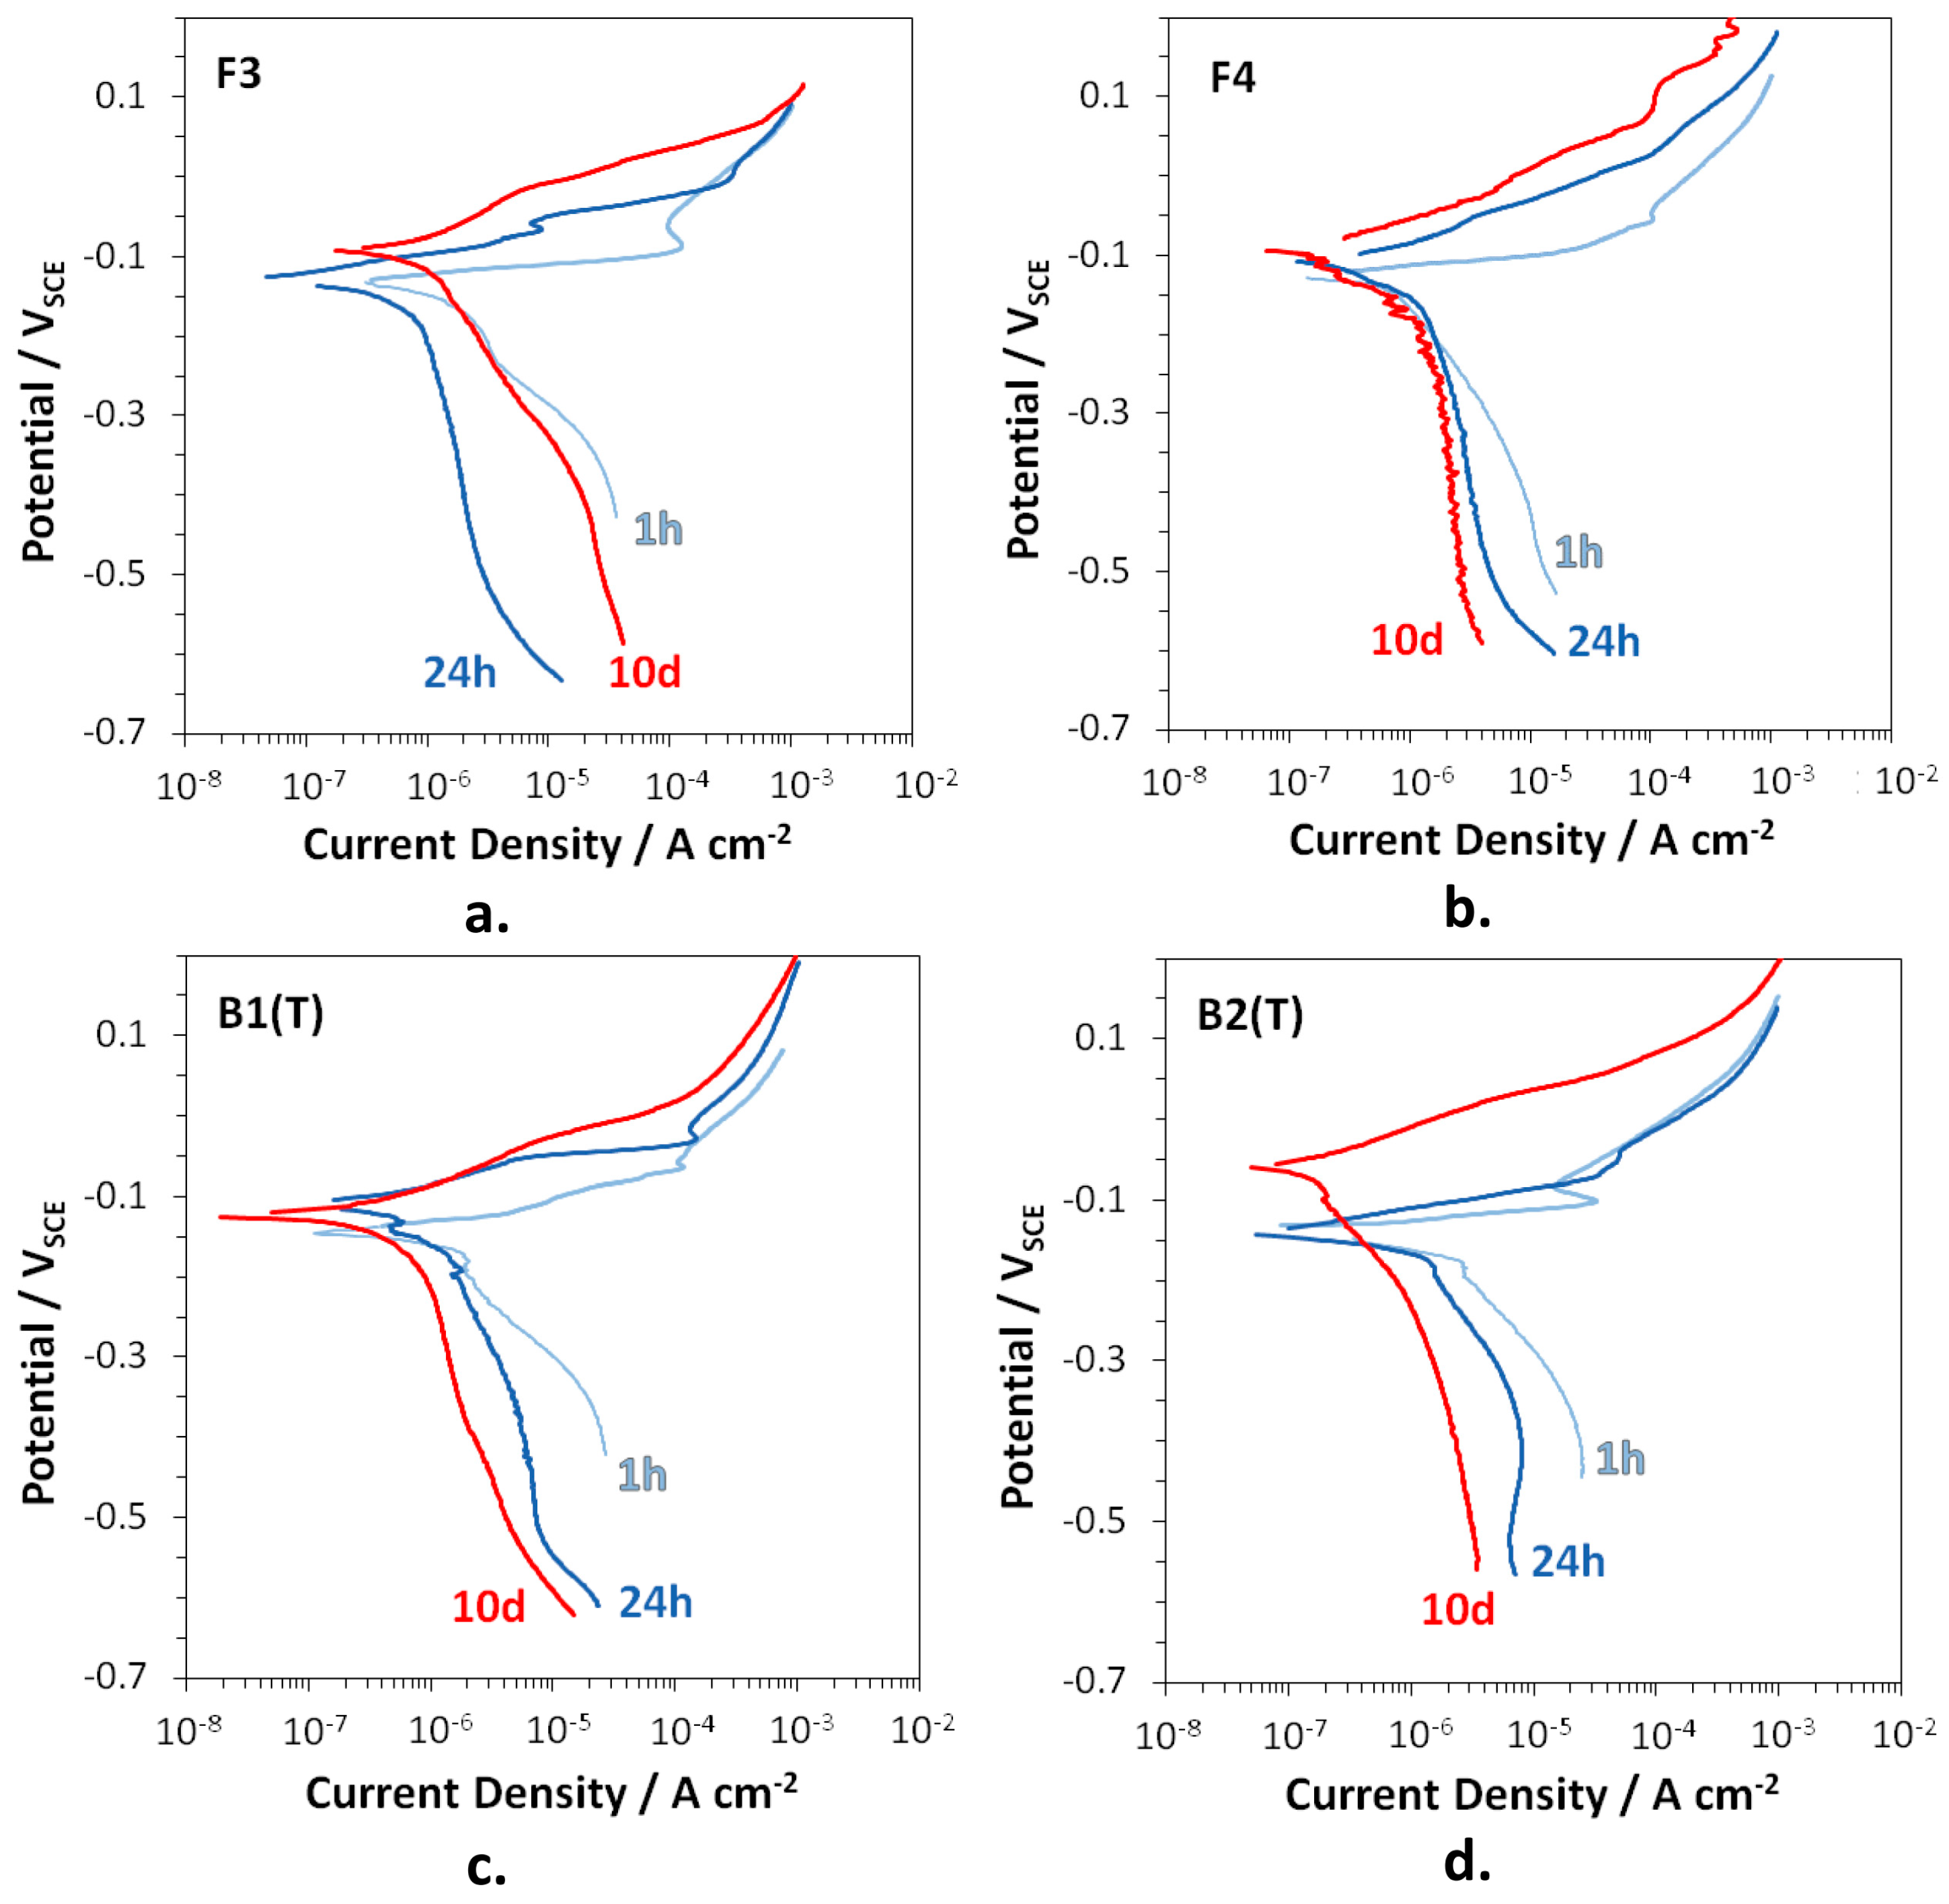
Figure 5a–h shows the EIS spectra of F3, F4, B1(T), and B2(T) in Nyquist and Bode (angle vs. frequency) forms, at specific immersion times. In F3 (
Figure 5a,b) and F4 (
Figure 5c,d), two time constants were detected at frequencies around 10 (medium frequency, mf, time constant) and 10
−2 Hz (low frequency, LF, time constant). The latter time constant was just a hint in the Bode plots after 1 h immersion. On F4 a third time constant centered at about 10
4 Hz (high frequency, HF, time constant) occurred at long immersion times (82 and 150 days). In the case of B1(T) samples, again only the MF (10
2–10 Hz) and the LF (10
−2–10
−1 Hz) time constants were detected after 1 h, 24 h, and 10 days of immersion, but just the beginning of the LF one was present after 1 h.
At longer immersion times, the hf time constant arose at 10
3 Hz, the MF time constant was scarcely evident and the LF time constant tended to shift to lower frequencies (10
−3 Hz), in comparison to those after short exposure times (
Figure 5d). B2(T) electrodes evidenced three times constants since the beginning of the immersion. The HF one tended to move from 10
2–10
3 Hz (after 1 and 24 h immersion) to 10
4 Hz (from 10 days on), while the mf and LF constants moved to lower frequencies at increasing immersion times (from 3–4 Hz to about 10
−1 Hz for the mf one and from 10
−1–10
−2 Hz to 10
−2 Hz or lower frequencies in the case of the LF one).
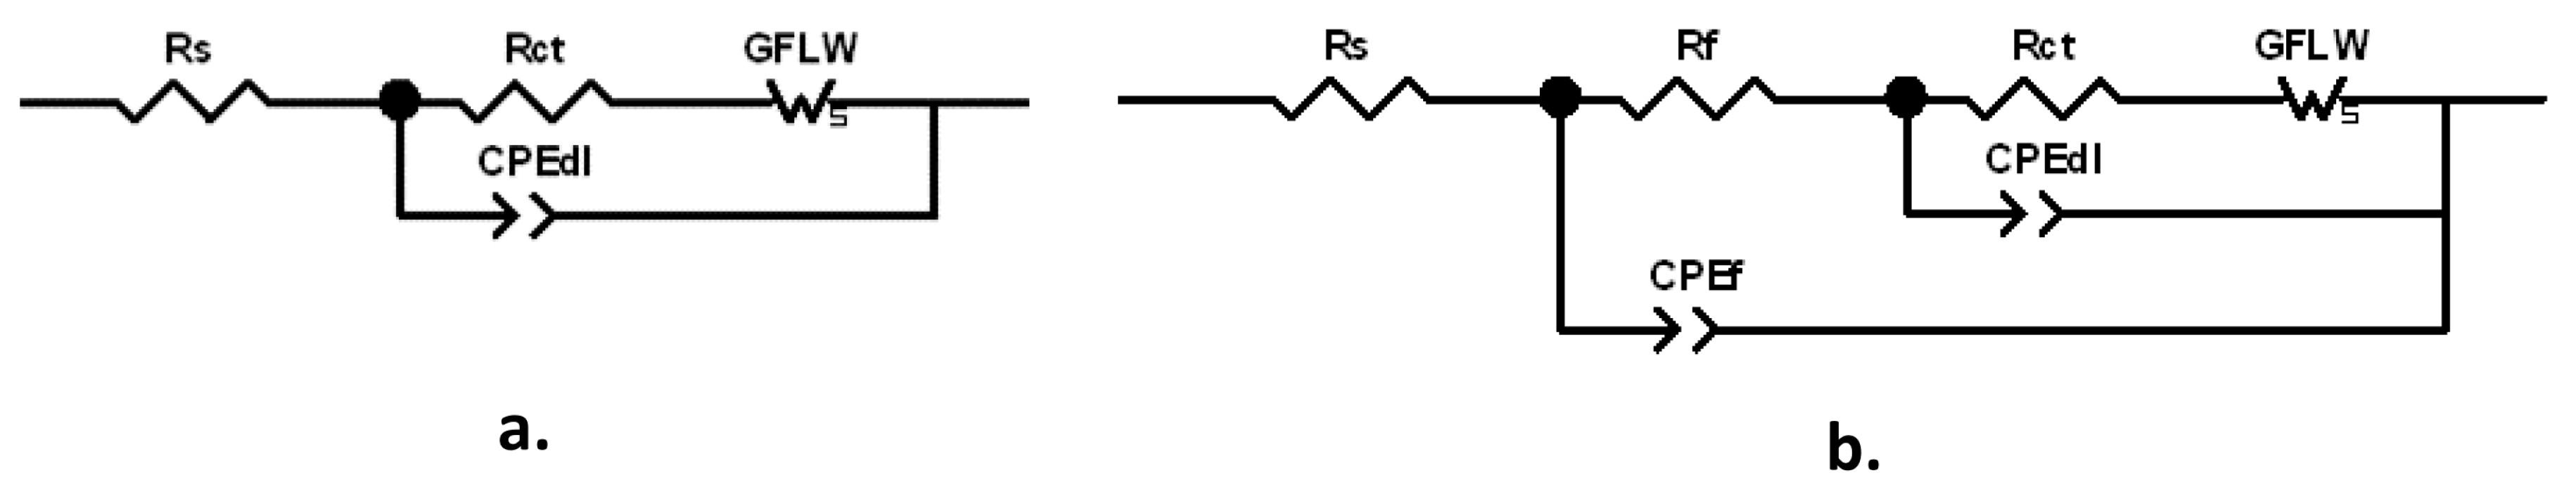
The spectra were fitted with the equivalent circuits (ECs) reported in
Figure 6a,b.
The former one, characterized by two times constants, can model a corrosion process with kinetics affected by both charge transfer and diffusion, while in the latter one, including three times constants, the corrosion process described in
Figure 6a occurs at the bottom of the pores of a surface corrosion product film. This latter EC, also including the parameters of the previous EC, is composed by the electrolyte resistance,
Rs, in series with two nested parallel R-CPE (Resistance-Constant Phase Element) couples. CPE is the Constant Phase Element, used instead of ideal capacitance to compensate for surface inhomogeneities, such as roughness, porosities and inclusions.
The analytical expression of the CPE impedance is:
where
ω = 2π
f is the angular frequency,
j = √(−1) is the imaginary unit,
Y is a frequency independent value and
n is a fit parameter with values in the range 0 ≤
n ≤ 1, which measures the element deviation from the ideal capacitive behavior (exhibiting
n = 1). For each R-CPE couple, the following general equation:
was used to convert the
Y parameters of the CPE elements into the associated capacitances (with
R being the corresponding couple resistance) [
34,
35,
36]. The
Rf–CPE
f couple described the dielectric properties of the surface corrosion product film (hf time constant), while
Rct–CPE
dl provided information about the charge transfer process at the metal/electrolyte interface (MF time constant). The previously quoted frequencies corresponding to the charge transfer process (MF time constant) and to the dielectric properties of the surface oxide film (HF time constant) are in agreement with those unequivocally attributed to these elements by erosion-corrosion tests carried out on brass in chloride solution [
37].
In order to fit the LF time constant attributed to diffusion, a generalized finite length Warburg (GFLW) element was introduced in series to the charge transfer resistance,
Rct. Its mathematical impedance expression is:
where
T is a time constant,
RW is a resistance, and
p is an exponent which can vary in the range 0 <
p < 1. For
p = 0.5,
T =
L2/
D, where
L is the thickness of the diffusion layer and
D is the diffusion coefficient [
38]. The ECs of
Figure 6 or quite similar ones (with a Warburg element instead of a GFLW one) were already used to interpret EIS spectra of brass exposed to cooling water and chloride solutions [
7,
39,
40,
41,
42].
The EIS fitting parameters for the spectra in
Figure 5 are reported in
Table 4,
Table 5,
Table 6 and
Table 7. The alloys indicated as dezincification resistant (B1(T) and B2(T)) resulted capable of forming a surface oxide film with a low but detectable protectiveness, particularly at long immersion times. In fact, increasing R
f values were achieved, while the generally low and decreasing
Cf (with final values of the order of magnitude of 10
−7–10
−8 F cm
−2) indicated a progressive increase in film thickness. No film was detected by EIS on F3 and only a small loop related to a surface film was found on F4 at long immersion times. Actually, on all alloys the corrosion process was largely dependent on the rates of charge transfer and particularly on mass transport, because even in the presence of measurable
Rf values,
Rct and especially
RW values were higher than
Rf by many orders of magnitude and their variations do not appear connected with the surface film protectiveness.
RW had a general tendency to increase with time on the studied brass alloys, except for B2(T) which showed a RW maximum at 10 days of immersion (197 kΩ cm2) and then a decrease to 70.3 kΩ cm2, at the end of the immersion time. Accordingly, the T parameter of the GFLW (the diffusion EC element) usually increased, suggesting that diffusion became slower with time, but on B2(T) it reached a maximum at 10 days (like RW) and then decreased significantly.
On B2(T), Rct had a trend similar to that of RW with a maximum of 67.0 kΩ cm2 at 10 days of immersion. Such a high maximum Rct value was not achieved in concomitance with a maximum of Rf, so excluding that it was connected to a reduced film porosity. On the other alloys, rather oscillating Rct values were detected, with the highest value of 28 kΩ cm2 obtained on F4 at 150 days of immersion, again independently from the surface film protectiveness. A possible explanation for the Rct oscillations could be the presence of a thin inner passive film, which underwent breakdown and subsequent heal events so justifying variations in charge transfer rate.
The analysis of
Cdl values in
Table 5,
Table 6,
Table 7 and
Table 8 evidenced that unexpectedly they often oscillated in phase with
Rct, that is, an increase in
Rct was usually accompanied by an increase in
Cdl. This trend is difficult to explain. A possible explanation could be connected to the presence of breakdown and heal events of the inner passive layer. In fact, after a breakdown event the accumulation of metal cations at the metal-electrolyte interface, allowed by the slow diffusion rates (as suggested by the high detected
RW values), could subsequently hinder further anodic dissolution, so justifying the presence of high
Rct in correspondence of high
Cdl values.
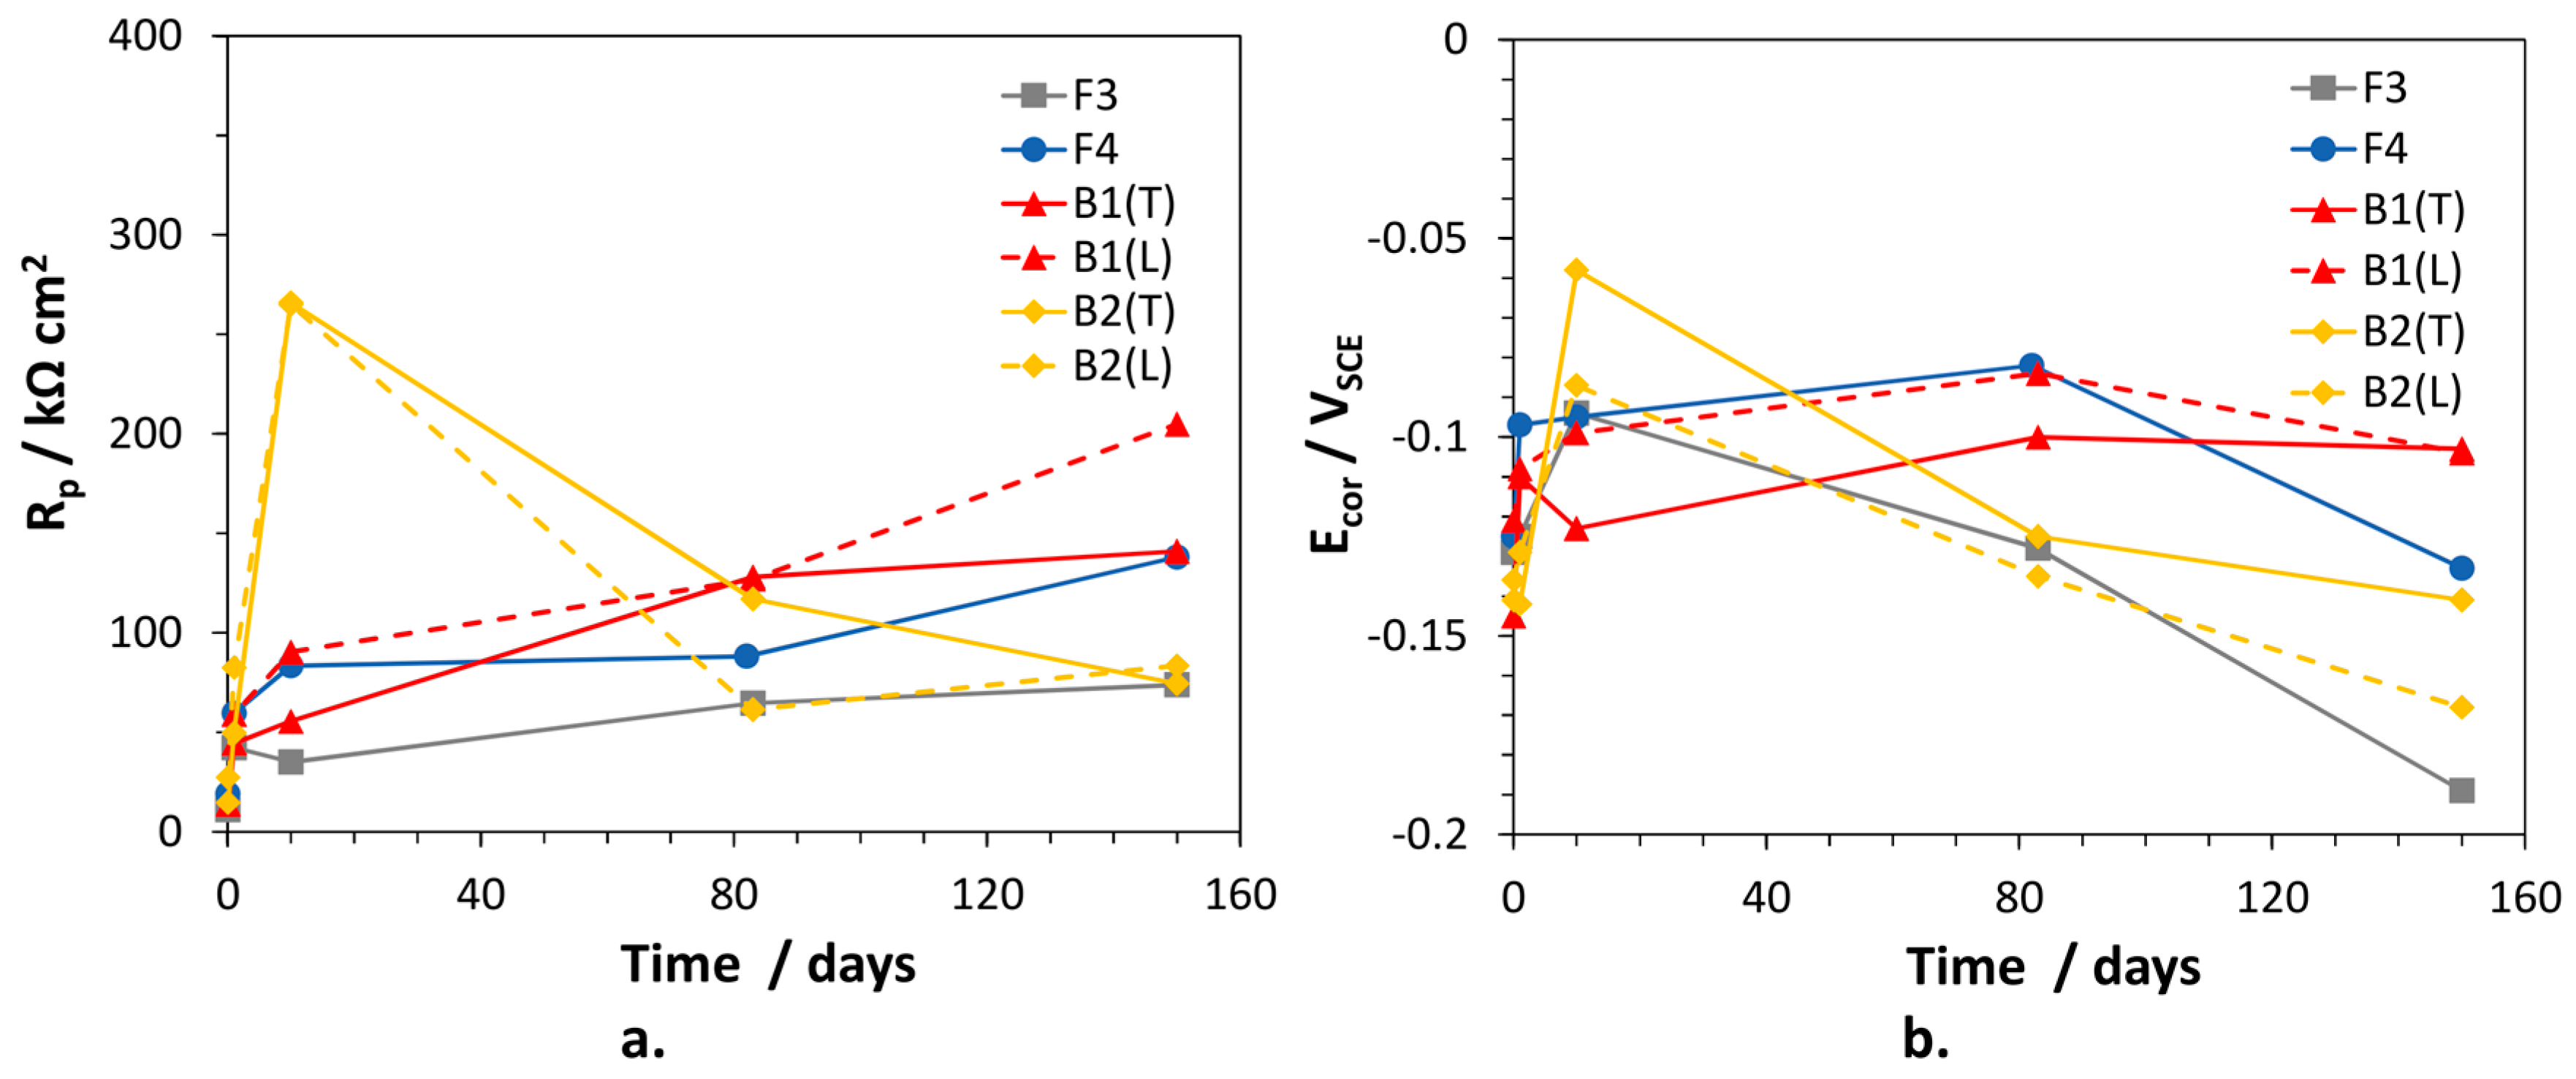
The polarization resistance values of the alloys, inversely proportional to the corrosion rates, were calculated as the sum:
and are collected in
Figure 7, together with the corresponding
Ecor values. In general, the alloys exhibited low initial
Rp values tending to increase with time. Only for B2(T),
Rp reached a maximum (266 kΩ cm
2) after 10 days of immersion, then decreased to rather low values (74.5 kΩ cm
2), suggesting an important loss of corrosion resistance. Interestingly, the time evolution of
Rp for B1(L) and B2(L) were similar to those of the corresponding (T) electrodes. In fact, also for B2(L),
Rp passed through a maximum at 10 days and then decreased significantly. B1(L) exhibited slightly higher corrosion resistance than B1(T). F3 was the least corrosion resistant alloy (lowest
Rp values), but at long immersion time the behavior of B2 electrodes overlapped that of F3. Between 80 and 150 days of exposure, the overall
Rp variations among traditional and dealloying-resistant alloys were quite limited, that is the highest and lowest values differed by a factor of 2–2.7.
The Ecor values of the alloys passed through a maximum (at 10 days of immersion for F3 and B2 electrodes; at about 80 days of immersion for the other alloys) and then became more active. In particular, on F3 and B2(L) samples, Ecor values as negative as −0.189 and −0.170 VSCE were achieved, respectively. More negative Ecor are expected to favor zinc (and silicon in the case of B2) over copper dissolution, so stimulating dealloying.

 ,
, 


