Abstract
Some α + β’ brass components of drinking water distribution systems in Morocco underwent early failures and were investigated to assess the nature and extent of the corrosion attacks. They exhibited different corrosion forms, often accompanied by extensive β’ dezincification. In order to offer viable alternatives to these traditional low cost materials, the corrosion behavior of two representative α + β’ brass components was compared to that of brass alloys with nominal compositions CuZn36Pb2As and CuZn21Si3P, marketed as dezincification resistant. CuZn21Si3P is a recently developed eco-friendly brass produced without any arsenic or lead. Electrochemical tests in simulated drinking water showed that after 10 days of immersion CuZn21Si3P exhibited the highest polarization resistance (Rp) values but after longer immersion periods its Rp values became comparable or lower than those of the other alloys. After 150 days, scanning electron microscope coupled to energy dispersive spectroscopy (SEM-EDS) analyses evidenced that the highest dezincification resistance was afforded by CuZn36Pb2As (longitudinal section of extruded bar), exhibiting dealloying and subsequent oxidation of β’ only at a small depth. Limited surface dealloying was also found on CuZn21Si3P, which underwent selective silicon and zinc dissolution and negligible inner oxidation of both α and κ constituent phases, likely due to peculiar galvanic effects.
Keywords:
brass; CuZn36Pb2As; CuZn21Si3P; corrosion; dezincification; simulated drinking water; EIS; SEM-EDS; long immersion 1. Introduction
Corrosion is an important technological economic and social problem which can be controlled after full knowledge of the alloy behavior under field conditions and proper choice of materials and design solutions [1,2,3]. In the case of brass corrosion, the large-scale use of these alloys in drinking water distribution systems for tube fittings, valves, and ancillaries may also determine human health concerns due to Pb and Cu release in drinking water [4,5,6].
Brasses are copper-zinc alloys that contain 5–40% Zn as the principal alloying element. Zinc concentrations up to 35% may dissolve in face-centered cubic (fcc) copper matrix to form a single solid solution (α brass). When an even higher zinc content is added, a zinc-rich β’ second phase also forms, characterized by body-centred cubic (bcc) lattice. Duplex α + β’ brasses are cheaper, easier to fabricate and exhibit higher mechanical strength than α brasses, but the zinc-rich β’ phase exhibits a higher tendency to dezincification corrosion that leaves a porous layer of copper, structurally weakening the component and leading to brittle failures [7,8,9].
Beside zinc, many other elements are present as both alloying additions to improve specific properties, and impurities. Up to 3%, lead additions improve the alloy machinability, while beyond this percentage lead has deleterious effects on casting properties, namely on shrinkage and hot tearing [9]. However, in low cost commercial brasses its content is often greater than this value, due to the lack of strict control on alloying and impurity contents. Lead is insoluble in copper-zinc alloys and during solidification it precipitates forming globules both at grain boundaries and within the matrix. It produces little effects or some improvement of the corrosion resistance of the alloy, depending on the specific environment and alloy compositions [10,11,12].
The pressure to have lead removed from commercial brasses pushed industry and research studies to propose alternative alloys, either with reduced lead content or lead-free, and characterized by good dezincification resistance [13]. Recently, Bi and Si were used as alternatives to lead in free-cutting-brass [8]. Non toxic bismuth can play the role of lead in machinability without adverse health effects [14], and proved to be neutral towards dezincification resistance of duplex and nearly all α brasses [10]. Lead-free silicon brass containing 3% Si and 0.05% P was reported to offer good machinability [15] and significant corrosion resistance, due to the formation of a protective silicon-rich surface film (a sublayer of copper and zinc oxides topped by a protective zinc silicate film, according to thermodynamic considerations [16]). It also exhibited dezincification resistance thanks to the electrochemical phosphorus cycle, analogous to that afforded by arsenic. Actually, both arsenic and phosphorus are reputed capable to limit copper redeposition by reducing Cu2+ ions to Cu+. As also reported for As3+, P3+ ion leaching can also be avoided by its reaction with Cu metal which brings it back to its elemental state [17,18]. The positive influence of arsenic, phosphorus, and antimony against dezincification was well documented in various aggressive environments, mainly on α brasses [10,19,20,21]. Arsenic showed some positive effects on α + β’ alloys too [10,22]. However, the toxicity of arsenic and antimony should represent a limit to their wide use [23,24].
Dezincification of α [25,26] and α + β’ brasses was also prevented by tin addition, in the latter alloys especially in the presence of nickel [27]. The formation of a protective surface SnO2 film was reputed as the origin of this beneficial effect [25,27]. Other elements inhibiting dezincification were aluminum which could improve brass corrosion behavior by forming a protective Al2O3 film [28] and niobium which operated by alloying with β’-phase to suppress the preferential dissolution of zinc and by forming a passivation layer that served as a barrier against chloride ions [29].
Most commercial brasses for drinking water distribution systems have an α + β’ structure due to their significant mechanical properties and easy forming capability, but they are often affected by an inadequate impurity control. Impurities of iron, manganese, nickel, and cobalt are usually detrimental to the alloy dezincification resistance [10]. All alloying elements change the stability range of the β’ phase; in particular, an increase in their content (except for nickel) shifts the range of existence of the β’ phase toward lower zinc content [28].
In the first part of this paper, the relevance of dezincification in some failed components of drinking water distribution systems in Morocco was evidenced. Then, the paper describes the results of tests performed to study the actual corrosion behavior and dealloying resistance of possible alternative alloys in comparison to two alloys selected among those of the failed service components. In the view of the importance of dezincification in the investigated components, the selected brass alloys were those characterized by the highest and the lowest dezincification resistance to the standard UNI EN ISO 6509 dezincification test. The alternative dezincification resistant alloys had nominal compositions CuZn36Pb2As and CuZn21Si3P of which the latter one is an interesting eco-friendly arsenic- and lead-free silicon brass, with still scarcely investigated corrosion behavior in drinking water [16,17]. The comparative tests used to assess the alloy corrosion resistance and to study the corrosion mechanism consisted of electrochemical tests (electrochemical impedance spectroscopy, electrochemical impedance spectroscopy (EIS), and polarization curve recording) carried out at different immersion times during 150 days of exposure to simulated drinking water (SDW). Moreover, surface investigations based on scanning electron microscope (SEM) observations, coupled to energy dispersive spectroscopy (EDS) analyses, were used to measure the dezincification depth and to further study the dealloying process.
2. Materials and Methods
Two types of brass samples were investigated, that is (i) forged brass components (F samples) including pipe fittings, connectors, and valves for drinking water distribution systems and (ii) bars (B samples). The first group included seven sample types (F1–7) extracted from drinking water distribution systems in Morocco after early failures (service lives from 8 months to 5 years). The quantitative chemical compositions of these samples obtained by optic emission spectrometry (OES) and their failure times are reported in Table 1. Samples F1–7 mainly have compositions in the range 54–57% Cu, 37–40% Zn, 2.3–4.6% Pb, and 0.5–1.4% Sn and exhibit significant Fe, Ni, and Si contents (up to 0.6%, 0.4%, and 0.08%, respectively).

Table 1.
Service lives (SL; y = years; m = months) and chemical compositions (in weight %) of the examined forged brass components. Compositions were obtained by optic emission spectrometry (OES).
The second group of samples comprised two dezincification resistant alloys in bars, with nominal composition CuZn36Pb2As (code B1) and CuZn21Si3P (code B2). Table 2 reports their composition evaluated by OES: both of them contain small or negligible Fe, Mn, and Ni amounts. Si is absent in B1, while in B2 the Si content is 3.3%.
Table 2.
Chemical compositions (in weight %) of dezincification resistant alloys, evaluated by OES. Nominal compositions of B1 and B2 are CuZn36Pb2As and CuZn21Si3P, respectively. (n.d. = not determined)
2.1. Standard Dezincification Test
Since in most failed components dezincification was detected as the main corrosion form or was associated to other types of corrosion attack, the standard UNI EN ISO 6509 dezincification test was performed to assess the dezincification resistance of all brass types and to select the alloys of failed components to be further investigated by electrochemical tests. The exposed sample surfaces (area about 1 cm2) were isolated by epoxy resin, prepared by grinding down to emery paper grade 500, washed by distilled water and degreased by alcohol. Then, vertically oriented surfaces were exposed to 1 wt. % CuCl2·2H2O solution for 24 h. B1 and B2 samples were prepared with both longitudinal (L) and transverse (T) orientation, because the bar microstructure was anisotropic.
2.2. Electrochemical Tests in Simulated Drinking Water
Electrochemical tests were performed in simulated drinking water (SDW), i.e., deionized water containing 400 ppm SO42− (4.2 mM), 400 ppm Cl− (11.2 mM), and 50 ppm NO3− (0.8 mM), as sodium salts. This solution complies with drinking water composition requirements, according to Moroccan standard NM 03.7.001. In fact, the sulfate and nitrate concentrations correspond to the maximum acceptance limits, while the chloride concentration is about one-half of the maximum accepted concentration (that is 750 ppm).
The electrodes were prepared by soldering a copper wire on the back of brass samples to ensure the electrical contact and then embedding them in epoxy resin (exposed surface area of 1 cm2). For electrochemical tests, the final polishing was performed with 1 μm diamond paste.
Electrochemical tests were carried out in a conventional thermostated three-electrode cell by using a PARSTAT 2273 potentiostat/galvanostat (Ametek, Berwyn, PA, USA), piloted by PowerSuite software (v. 2.58, Advanced Measurement Technology, Inc., Oak Ridge, TN, USA). The reference and auxiliary electrodes were a saturated calomel electrode (SCE) and a Pt sheet, respectively. All the potential values quoted in the text are referred to the SCE. At least two experiments were carried out under each experimental condition.
Nondestructive electrochemical impedance spectroscopy (EIS) tests were performed at specific immersion times on the two alloys from failed components with the highest and the lowest susceptibility to dezincification according to the standard UNI EN ISO 6509 and on samples extracted from bars, with both transverse and longitudinal orientation (samples B1 (T and L) and B2 (T and L)). The tests were carried out at the open circuit potential, during 150 days of immersion in SDW. During the tests, a voltage perturbation amplitude of 10 mV (rms) was applied, in the frequency range 104–10−3 Hz, with five points per frequency decade. EIS spectra were fitted by SAI ZView v.3.5c software (Scribner Associates Inc., Southern Pines, NC, USA), according to the most suitable equivalent circuit, as described in the text.
After selected immersion times, cathodic and anodic polarization curves were recorded at a scan rate of 0.167 mV/s on separated electrodes always starting from the corrosion potential (Ecor) and corrosion rates were evaluated by the Tafel method from the cathodic polarization curves.
2.3. Surface Observations
The microstructure of the alloys was investigated by a Leica DMRM optical microscope (OM) (Leica Microsystems GmbH, Wetzlar, Germany) observations and, in some cases, also by scanning electron microscope (SEM) (Zeiss EVO MA15 (Zeiss, Oberkochen, Germany)) analysis, after etching with 10 wt. % FeCl3 solution. OM observations and SEM-EDS (for EDS: Oxford Aztec energy dispersive X-ray spectroscopy system (Oxford, UK)) analyses (under an acceleration voltage of 20 kV) also permitted the characterization of the morphology and nature of the corrosion attacks, both on failed components and on samples exposed to SDW under free corrosion conditions.
3. Results
3.1. Microstructures of the Studied Materials
Samples F1–7 evidenced α + β’ microstructures containing dispersed Pb globules (as an example, the microstructures of F3 and F4 are shown in Figure 1). In F1–7, the α volume fractions ranged from 41% to 69% (calculated by image analysis software) and, due to the significant amounts of Fe, Mn, Ni, and Si impurities, also silicides of these metals were detected [29], better visible under SEM observation (not shown). α and β’ have a nominal atomic composition of Cu3Zn and CuZn, respectively [18].
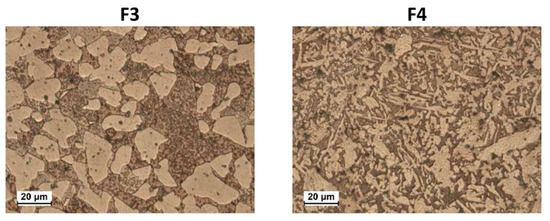
Figure 1.
Optical Microscope (OM) microstructures of etched F3 and F4 brass samples. They have α + β’ microstructures (α is the pale brown phase and β’ is the dark brown one).
Figure 2 shows the microstructures of B1 and B2 both in transverse (T) and longitudinal (L) sections. B1 showed an α fraction of 89% and in the figure the β’ phase is indicated by arrows. B2 exhibited comparable fractions of α (pale pink in Figure 2) and κ phase (grey colored Si-rich phase in Figure 2, with hexagonal lattice and nominal atomic composition Cu8Zn2Si [18]). This figure also evidences that in L sections of B1 and B2 samples, the β’ and κ phases are more continuous and elongated in the extrusion direction. In B2, SEM-EDS analysis also detected tiny particles of a third bright phase (Figure 3a), which was located at the grain boundaries and corresponded to the cubic γ phase with nominal composition Cu4ZnSi [18]. The compositions of α, κ, and γ phases (obtained by SEM-EDS as averages from at least six regions for each phase) are reported in Figure 3b. They result in good agreement with the expected values, except in the case of γ phase, where the low measured Si content was due to the small dimensions of this phase in comparison to the alloy volume analyzed under an acceleration voltage of 20 kV.
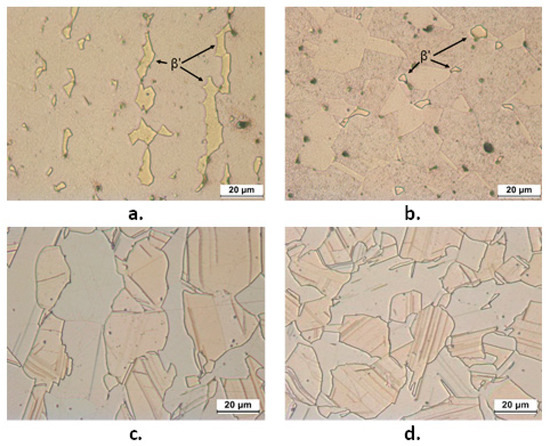
Figure 2.
OM microstructures of etched longitudinal (L) (a,c) and transverse (T) (b,d) sections from B1 (CuZn36Pb2As: a,b) and B2 (CuZn21Si3P: c,d) samples. In (a) and (b), α is pale brown and β’ (indicated by arrows) is yellowish. In (c) and (d), α is pale pink and κ is grey.
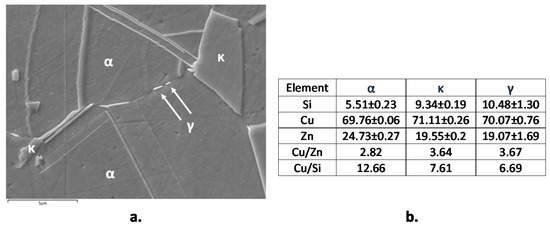
Figure 3.
Backscattered (BSD)-scanning electron microscope (SEM) micrograph of etched B2 (CuZn21Si3P) with indication of α, κ, and γ phases (a) and average SEM-energy dispersive spectroscopy (EDS) analysis (in atomic percentage) of the three phases (b).
3.2. Corrosion Forms Observed in Drinking Water Systems in Morocco
F1–7 components presented untimely corrosion attacks after relatively short permanence periods (from 8 months to 3 years) in contact with drinking water. Corrosion was essentially localized on the less corrosion-resistant Zn-rich β’ phase and in most cases, it caused dezincification or dezincification-favored corrosion forms.
As an example, Figure 4a,b shows plug and layer dezincification of the β’ phase, mainly detected in correspondence of crevices such as on threaded surfaces or under gaskets. Many components exhibited a selective attack with surface dissolution of the β’ phase which left a rough porous surface (Figure 4c,d). In some components, this selective attack tended to penetrate inside the material where occluded cell conditions could develop, likely determining relatively high chloride concentrations and low pH values and stimulating both β’ and α phase subsurface corrosion (Figure 4e,f).
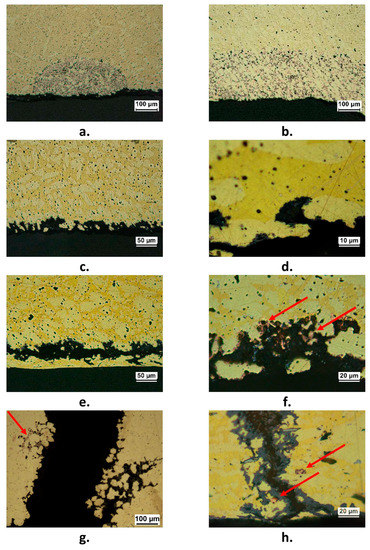
Figure 4.
Forms of corrosion attack detected in failed components; (a) plug dezincification (F2 component); (b) layer dezincification (F6 component); (c) and (d): selective corrosion attack with dissolution of the β’ phase (F3 component); (e) (F2 component) and (f) (F7 component): subsurface corrosion and dezincification; (g) and (h): cracks, accompanied by dezincification (F7 component). Arrows in (f–h) indicate porous copper produced by dezincification.
Three pipe fittings showed cracks accompanied by more or less extensive dezincification (Figure 4g,h). This could be due to the presence of Stress Corrosion Cracking (SCC), usually connected to residual stresses and presence of specific aggressive environments. Actually, SCC of various brass alloys was observed in sulfate solutions and drinking water installations [30,31,32].
3.3. Standard Dezincification Tests
In α + β’ samples, dezincification affected the less noble β’ phase. Therefore, given the relatively high β’ percentage in F1–7, these samples exhibited great average (dav) and maximum (dmax) dezincification depths (Table 3). F3 and F4 showed, respectively, the lowest and the highest dezincification resistance and were selected for testing during the long time immersions in SDW.
Table 3.
Average dezincification depths (dav) with standard deviations (σ) and maximum dezincification depths (dmax) after the standard UNI EN ISO 6509 dezincification test (24 h test).
As expected, B1 and B2 samples evidenced much better performances (Table 3). In the case of B1, mainly constituted by α phase, the addition of As in the range 0.06–0.09% efficiently protected the alloy by the so called “arsenic cycle” which prevents copper redeposition [19,20]. Similarly, an analogous “phosphorus cycle” is claimed to protect CuZn21Si3 alloy containing 0.05% P (B2) from corrosion [10,33]. The performances of B1 and B2 were better in the case of L samples because on these samples, the less noble β’ and κ phases were more discontinuous.
3.4. EIS Tests in SDW
The corrosion resistance of F3, F4, B1 (L and T), and B2 (L and T) in SDW was monitored by recording the EIS spectra at specific immersion times, during 150 days of immersion.
Figure 5a–h shows the EIS spectra of F3, F4, B1(T), and B2(T) in Nyquist and Bode (angle vs. frequency) forms, at specific immersion times. In F3 (Figure 5a,b) and F4 (Figure 5c,d), two time constants were detected at frequencies around 10 (medium frequency, mf, time constant) and 10−2 Hz (low frequency, LF, time constant). The latter time constant was just a hint in the Bode plots after 1 h immersion. On F4 a third time constant centered at about 104 Hz (high frequency, HF, time constant) occurred at long immersion times (82 and 150 days). In the case of B1(T) samples, again only the MF (102–10 Hz) and the LF (10−2–10−1 Hz) time constants were detected after 1 h, 24 h, and 10 days of immersion, but just the beginning of the LF one was present after 1 h.
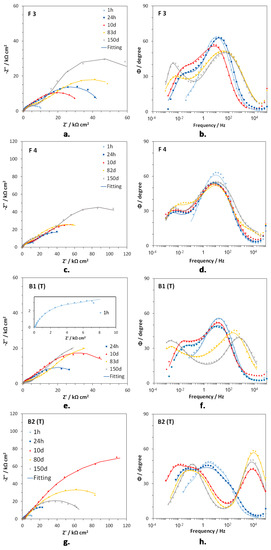
Figure 5.
Nyquist (a,c,e,g) and Bode (phase angle vs. frequency, b,d,f,h) plots obtained on F3 (a,b), F4 (c,d), B1(T) (e,f) and B2(T) (g,h), during immersions in Simulated Drinking Water (SDW).
At longer immersion times, the hf time constant arose at 103 Hz, the MF time constant was scarcely evident and the LF time constant tended to shift to lower frequencies (10−3 Hz), in comparison to those after short exposure times (Figure 5d). B2(T) electrodes evidenced three times constants since the beginning of the immersion. The HF one tended to move from 102–103 Hz (after 1 and 24 h immersion) to 104 Hz (from 10 days on), while the mf and LF constants moved to lower frequencies at increasing immersion times (from 3–4 Hz to about 10−1 Hz for the mf one and from 10−1–10−2 Hz to 10−2 Hz or lower frequencies in the case of the LF one).
The spectra were fitted with the equivalent circuits (ECs) reported in Figure 6a,b.
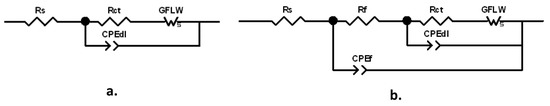
Figure 6.
Equivalent circuits (EC) used to fit the Electrochemical Impedance Spectroscopy (EIS) spectra: (a) two-time-constant EC; (b) three-time-constant EC.
The former one, characterized by two times constants, can model a corrosion process with kinetics affected by both charge transfer and diffusion, while in the latter one, including three times constants, the corrosion process described in Figure 6a occurs at the bottom of the pores of a surface corrosion product film. This latter EC, also including the parameters of the previous EC, is composed by the electrolyte resistance, Rs, in series with two nested parallel R-CPE (Resistance-Constant Phase Element) couples. CPE is the Constant Phase Element, used instead of ideal capacitance to compensate for surface inhomogeneities, such as roughness, porosities and inclusions.
The analytical expression of the CPE impedance is:
where ω = 2πf is the angular frequency, j = √(−1) is the imaginary unit, Y is a frequency independent value and n is a fit parameter with values in the range 0 ≤ n ≤ 1, which measures the element deviation from the ideal capacitive behavior (exhibiting n = 1). For each R-CPE couple, the following general equation:
was used to convert the Y parameters of the CPE elements into the associated capacitances (with R being the corresponding couple resistance) [34,35,36]. The Rf–CPEf couple described the dielectric properties of the surface corrosion product film (hf time constant), while Rct–CPEdl provided information about the charge transfer process at the metal/electrolyte interface (MF time constant). The previously quoted frequencies corresponding to the charge transfer process (MF time constant) and to the dielectric properties of the surface oxide film (HF time constant) are in agreement with those unequivocally attributed to these elements by erosion-corrosion tests carried out on brass in chloride solution [37].
In order to fit the LF time constant attributed to diffusion, a generalized finite length Warburg (GFLW) element was introduced in series to the charge transfer resistance, Rct. Its mathematical impedance expression is:
where T is a time constant, RW is a resistance, and p is an exponent which can vary in the range 0 < p < 1. For p = 0.5, T = L2/D, where L is the thickness of the diffusion layer and D is the diffusion coefficient [38]. The ECs of Figure 6 or quite similar ones (with a Warburg element instead of a GFLW one) were already used to interpret EIS spectra of brass exposed to cooling water and chloride solutions [7,39,40,41,42].
The EIS fitting parameters for the spectra in Figure 5 are reported in Table 4, Table 5, Table 6 and Table 7. The alloys indicated as dezincification resistant (B1(T) and B2(T)) resulted capable of forming a surface oxide film with a low but detectable protectiveness, particularly at long immersion times. In fact, increasing Rf values were achieved, while the generally low and decreasing Cf (with final values of the order of magnitude of 10−7–10−8 F cm−2) indicated a progressive increase in film thickness. No film was detected by EIS on F3 and only a small loop related to a surface film was found on F4 at long immersion times. Actually, on all alloys the corrosion process was largely dependent on the rates of charge transfer and particularly on mass transport, because even in the presence of measurable Rf values, Rct and especially RW values were higher than Rf by many orders of magnitude and their variations do not appear connected with the surface film protectiveness.
Table 4.
Electrochemical Impedance Spectroscopy (EIS) fitting parameters for F3.
Table 5.
EIS fitting parameters for F4.
Table 6.
EIS fitting parameters for B1(T).
Table 7.
EIS fitting parameters for B2(T).
RW had a general tendency to increase with time on the studied brass alloys, except for B2(T) which showed a RW maximum at 10 days of immersion (197 kΩ cm2) and then a decrease to 70.3 kΩ cm2, at the end of the immersion time. Accordingly, the T parameter of the GFLW (the diffusion EC element) usually increased, suggesting that diffusion became slower with time, but on B2(T) it reached a maximum at 10 days (like RW) and then decreased significantly.
On B2(T), Rct had a trend similar to that of RW with a maximum of 67.0 kΩ cm2 at 10 days of immersion. Such a high maximum Rct value was not achieved in concomitance with a maximum of Rf, so excluding that it was connected to a reduced film porosity. On the other alloys, rather oscillating Rct values were detected, with the highest value of 28 kΩ cm2 obtained on F4 at 150 days of immersion, again independently from the surface film protectiveness. A possible explanation for the Rct oscillations could be the presence of a thin inner passive film, which underwent breakdown and subsequent heal events so justifying variations in charge transfer rate.
The analysis of Cdl values in Table 5, Table 6, Table 7 and Table 8 evidenced that unexpectedly they often oscillated in phase with Rct, that is, an increase in Rct was usually accompanied by an increase in Cdl. This trend is difficult to explain. A possible explanation could be connected to the presence of breakdown and heal events of the inner passive layer. In fact, after a breakdown event the accumulation of metal cations at the metal-electrolyte interface, allowed by the slow diffusion rates (as suggested by the high detected RW values), could subsequently hinder further anodic dissolution, so justifying the presence of high Rct in correspondence of high Cdl values.
Table 8.
Corrosion potentials (Ecor) and corrosion current densities (icor) from the polarization curves.
The polarization resistance values of the alloys, inversely proportional to the corrosion rates, were calculated as the sum: and are collected in Figure 7, together with the corresponding Ecor values. In general, the alloys exhibited low initial Rp values tending to increase with time. Only for B2(T), Rp reached a maximum (266 kΩ cm2) after 10 days of immersion, then decreased to rather low values (74.5 kΩ cm2), suggesting an important loss of corrosion resistance. Interestingly, the time evolution of Rp for B1(L) and B2(L) were similar to those of the corresponding (T) electrodes. In fact, also for B2(L), Rp passed through a maximum at 10 days and then decreased significantly. B1(L) exhibited slightly higher corrosion resistance than B1(T). F3 was the least corrosion resistant alloy (lowest Rp values), but at long immersion time the behavior of B2 electrodes overlapped that of F3. Between 80 and 150 days of exposure, the overall Rp variations among traditional and dealloying-resistant alloys were quite limited, that is the highest and lowest values differed by a factor of 2–2.7.
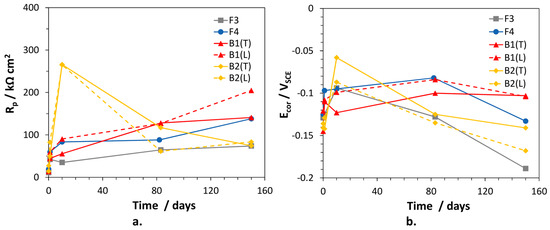
Figure 7.
(a) Polarization resistance (Rp) and (b) corrosion potential (Ecor) values measured on selected brass alloys in SDW.
The Ecor values of the alloys passed through a maximum (at 10 days of immersion for F3 and B2 electrodes; at about 80 days of immersion for the other alloys) and then became more active. In particular, on F3 and B2(L) samples, Ecor values as negative as −0.189 and −0.170 VSCE were achieved, respectively. More negative Ecor are expected to favor zinc (and silicon in the case of B2) over copper dissolution, so stimulating dealloying.
3.5. Polarization Curves
The polarization curves recorded on F3, F4, B2(T), and B3(T) after 1 h, 24 h, and 10 days of immersion in SDW are reported in Figure 8.
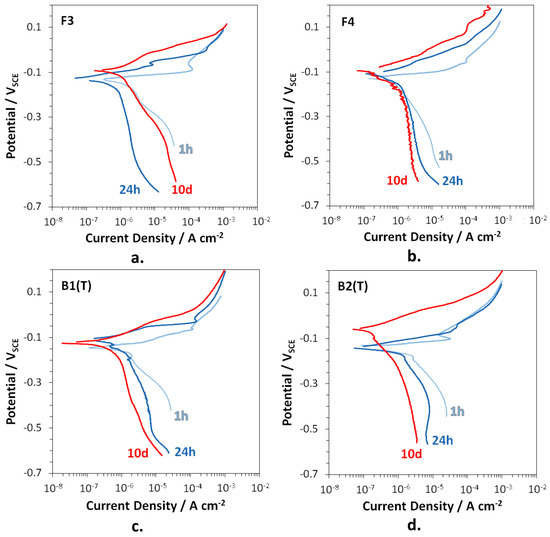
Figure 8.
Polarization curves recorded on F3 (a), F4 (b), B2(T) (c), and B3(T) (d), after 1, 24 h, and 10 days of immersion in SDW.
At 1 h of immersion, the anodic curves of all alloys showed low anodic slopes associated to an active corrosion behavior, while the much higher cathodic slopes suggested that oxygen reduction was largely under diffusion control. Therefore, corrosion of the studied brasses was essentially under cathodic control after short immersion periods. At longer immersion times, mass transport also affected the anodic process as indicated by the increase in the anodic slopes. Therefore, the diffusion of oxidized species inside dealloyed regions towards the electrode surface and from the surface to the solution bulk became slower with time. Under these conditions, corrosion underwent a mixed control with both the anodic and mainly the cathodic reaction largely depending on diffusion.
Table 8 collects the Ecor and corrosion current densities (icor) obtained from the polarization curves by the Tafel method. The icor values are in agreement with the trend of the Rp values in this same time interval (Figure 7). In fact, with the exception of F3, until 10 days of immersion icor continuously decreased (and Rp increased), because of a progressive shift of both the anodic and the cathodic curves to lower current densities. In the case of F3, after 10 days the cathodic currents and icor accelerated in comparison to those after 24 h, again in agreement with a slight decrease in Rp values.
3.6. Characterization of Corrosion Attack after 150 Day Immersions in SDW
At the end of 150 days of immersion, all specimens exhibited dezincification attacks. In the case of B1, the maximum dezincification depths for (T) and (L) specimens were about 300 µm (Figure 9a) and 50 µm (Figure 9b), respectively. The good corrosion resistance of B1(L) samples agreed with their relatively high Rp values in comparison to those measured on B1(T) (Figure 7). Figure 9a and b clearly evidence that dezincification affected the β’ phase. On B1(T), the β’ phase was elongated perpendicularly to the exposed surface so favoring penetration of the corrosion attack, while on B1(L) the corrosion attack was more limited, although solution penetration along the grain boundaries induced dezincification [18] and even oxidation of β’ grains at some distance from the exposed surface.
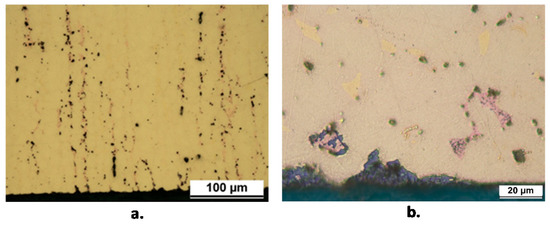
Figure 9.
Sections of B1(T) (a) and B1(L) (b) samples after 150 days of exposure to SDW. Dezincification is only localized on the β’ phase.
Figure 10 shows the SEM-EDS elemental mapping obtained on B1(T) cross sections. It confirms extensive oxidation of dezincified regions and reveals the penetration of chlorides well inside the dealloyed regions, with local concentrations up to 0.3 wt. %. Extensive plug dezincification of β’ phase was detected on F3 and F4, with maximum depths of about 170 and 100 µm, respectively. Chloride penetration and inner oxidation were detected as well.
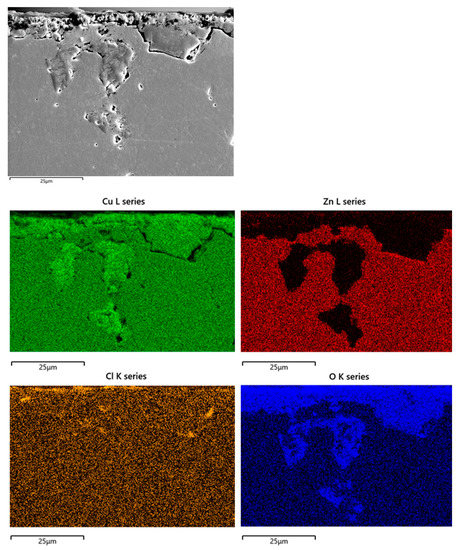
Figure 10.
SEM-EDS elemental maps obtained on sections of B1(T) after 150 days of exposure to SDW.
Figure 11 shows some cross sections of B2(T and L) obtained after 10 and 150 days. It shows that after 10 days corrosion initiates in correspondence of the κ phase (red arrows in Figure 11) and along grain boundaries (blue arrows in Figure 11). In fact, microelectrochemical tests showed that Si-rich κ and particularly γ phases are more active than α, so justifying the observed corrosion behavior [17].
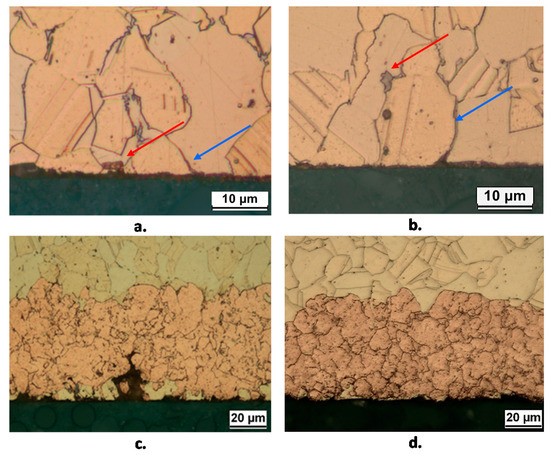
Figure 11.
Sections of B2(T) (a,c) and B2(L) (b,d) samples after 10 days (a,b) and 150 days (c,d) of exposure to SDW. Surface etching by 10 wt. % FeCl3 solution evidences the location of corrosion attack initiation with reference to the alloy microstructure: corrosion starts in correspondence with the κ phase (red arrows) and along grain boundaries (blue arrows).
At longer immersion times (Figure 11c,d), uniform dezincified layers were observed (maximum thickness about 60 µm), affecting both κ and α phases, with morphology and penetration depth independent of exposed surface orientation. The SEM-EDS elemental map on the cross section of a B2(T) sample after 150 days immersion in SDW is reported in Figure 12. In this sample, dealloyed regions contained only copper, negligible amounts of oxygen and silicon, and no chlorides, suggesting that on this alloy selective corrosion produced rather compact copper regions.
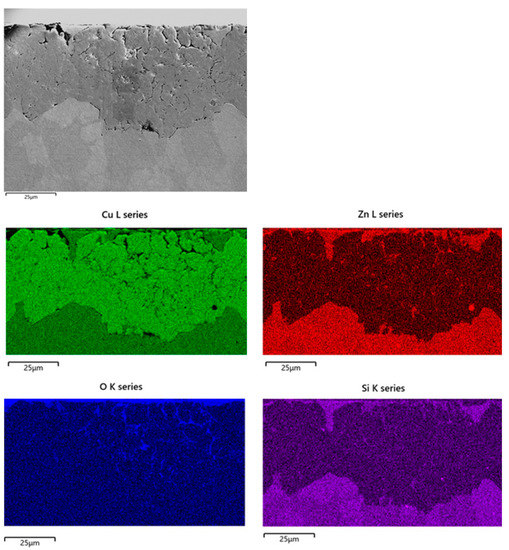
Figure 12.
SEM-EDS elemental maps obtained on sections of B2(T) after 150 days of exposure to SDW.
The SEM-EDS analyses of surface corrosion products on B1(T) specimens after 150 day immersions revealed the presence of significant surface arsenic concentrations (up to 0.69 wt. %), besides chlorine (up to 0.34 wt. %), oxygen, and sulfur (Figure 13a,b). This indicated the presence of surface chlorides, oxides, and perhaps sulfates and the incorporation of arsenate or arsenite among corrosion products [43]. On B2(T) (Figure 13c,d), SEM-EDS technique detected the same corrosion products (except arsenic species obviously), with addition of some silicates in agreement with literature information [16] and phosphates, as suggested by phosphorous concentrations up to 2.1 wt. %. Chloride concentrations reached 1.7 wt. %.
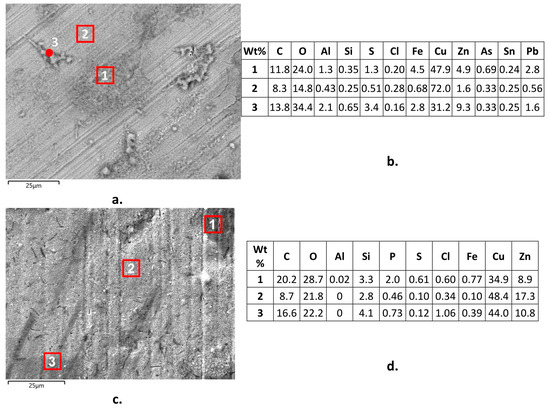
Figure 13.
Surface corrosion products (a,c) and their local SEM-EDS analyses (b,d) on B1(T) (a,b) and B2(T) (c,d) samples after 150 days of exposure to SDW.
The presence of As/Cu and P/Cu ratios in the corrosion products higher or much higher than those in B1 and B2 alloys, respectively, denoted an alloy depletion in these inhibiting elements, so contributing to explain the significant dezincification attacks of these alloys.
4. Discussion
The early failures detected on the F1–7 components of drinking water distribution systems in Morocco are mostly connected to their high contents of β’ phase, which undergoes dezincification and selective dissolution attacks (Figure 4). On three failed brass fittings, dezincification was also detected in concomitance with cracks, suggesting that dealloying favors crack propagation (Figure 4). The standard dezincification test UNI EN ISO 6509 confirmed the high susceptibility of F1–7 alloys to this corrosion form, while both CuZn36Pb2As (B1(L and T)) and CuZn21Si3P (B2(L and T)) proved to be much more resistant.
During immersions in SDW, arsenic alloying in B1 could prevent α phase dezincification but did not completely avoid selective zinc dissolution in β’ phase, in agreement with many other authors’ results [10,19,20,21]. The relatively high arsenic concentrations in surface corrosion products of B1(T) samples could have produced alloy depletion in this element and could contribute to decrease the alloy dezincification resistance. Instead, B1(L) confirmed an excellent overall dezincification resistance, because dezincification attack of β’ was detected only at a short distance from the exposed surface. On B1, the dezincified regions were composed of copper and oxidized copper with appreciable chlorine concentrations in the pores, suggesting easy solution penetration.
B2(T) and B2(L) showed quite similar corrosion behavior and proved to be more susceptible to dezincification than expected. In fact, although the maximum depth of dealloying attack was only slightly higher than that on B1(L), B2 samples exhibited complete dezincification of both α and κ. In this alloy too, the element capable to inhibit dealloying, that is phosphorous, was found to leach from the metal surfaces and resulted incorporated in the corrosion products at relatively high concentrations. In B2, selective dissolution initiated on the less noble κ phase and on grain boundaries (Figure 10) and then propagated to the α phase. This is in agreement with the low difference in practical nobility between these phases (50 mV) documented by other authors [17]. SEM-EDS analyses showed that the dealloyed regions produced from α and κ grains were constituted by pure copper with negligible zinc, oxygen, and silicon concentrations and no chlorine. Spreading of dealloying from κ to α grains could be due to the onset of a galvanic couple between the large copper areas produced by selective dissolution (acting as cathodic regions) and the α phase (acting as anodic region, due to its significant zinc and silicon contents which make it less noble than pure copper (Figure 3)). The absence of oxidized silicon species inside pure copper regions is surprising, because silicon is an active element which tends to oxidize to low solubility hydrated silicon oxides. The absence of this element inside dealloyed regions would suggest the occurrence of local solution alkalinization and silicate ion leaching, as a result of copper surface cathodic activity. Galvanic coupling would also justify the corrosion protection of copper from re-oxidation in dezincified regions.
The electrochemical tests showed that charge transfer and mainly mass transport controlled the corrosion rates of the studied brass. In particular, diffusion affected only the cathodic process at short immersion times, while with time it also slowed down the anodic reaction. In all cases, the surface films of corrosion products offered negligible if any protection from corrosion propagation, even in the case of B1 and B2 samples, where the surface film resistance reached the highest values (up to 2.9 kΩ cm2). In addition, also in these cases, the film resistance remained much smaller than the diffusion resistance, RW, by one or two orders of magnitude.
5. Conclusions
Early failures on α + β’ brass components of drinking water distribution systems in Morocco were analyzed. They consisted of severe corrosion attacks and cracks, often accompanied by significant dezincification. Dealloying or selective phase dissolution affected the β’ phase, present at high volume fractions (from 41% to 69%).
The corrosion behavior of two of these α + β’ alloys was compared to that of CuZn36Pb2As and CuZn21Si3P alloys marketed as dezincification resistant, during 150 day immersions in SDW. The electrochemical tests showed that at long immersion times, the general corrosion resistance of these alloys was similar, with polarization resistance values differing within a factor of 2–2.7.
Final dealloying depths on CuZn21Si3P (longitudinal and transverse sections of extruded bar) and CuZn36Pb2As (longitudinal section) were about 2–3 times lower than those on samples from failed components.
After 150 days of immersion in SDW, dezincification of CuZn36Pb2As and traditional alloys only affected the β’ phase, while on CuZn21Si3P dealloying produced zinc and silicon leaching from both α and κ phases. Dealloying started on the Si-rich κ phase and at grain boundaries, then it spread to α phase too, likely due to galvanic coupling with the nobler dealloyed copper regions.
Author Contributions
Conceptualization J.C., C.M., F.Z. and M.E.T.; investigation J.C., V.G., A.B.; resources I.M.; writing original draft J.C., C.M., F.Z. and M.E.T.
Funding
This research received no external funding.
Acknowledgments
The authors wish to thank the National Office of Electricity and the Potable Water, Rabat, Morocco for the cooperation and support during the starting of this research study.
Conflicts of Interest
The authors declare no conflict of interest.
References
- Koch, G.H.; Brongers, M.P.H.; Thompson, N.G.; Virmani, Y.P.; Payer, J.H. Chapter 1—Cost of corrosion in the United States. In Handbook of Environmental Degradation of Materials, 1st ed.; Elsevier: Amsterdam, The Netherlands, 2005; pp. 3–24. [Google Scholar]
- Brossia, S. Chapter 23—Corrosion of Pipes in Drinking Water Systems. In Handbook of Environmental Degradation of Materials, 3rd ed.; Elsevier: Amsterdam, The Netherlands, 2018; pp. 489–505. [Google Scholar]
- Zanotto, F.; Grassi, V.; Balbo, A.; Monticelli, C.; Melandri, C.; Zucchi, F. Effect of brief thermal aging on stress corrosion cracking susceptibility of LDSS 2101 in the presence of chloride and thiosulphate ions. Corros. Sci. 2018, 130, 22–30. [Google Scholar] [CrossRef]
- Latva, M.; Kaunisto, T.; Pelto-Huikko, A. Durability of the non-dezincification resistant CuZn40Pb2 brass in Scandinavian waters. Eng. Fail. Anal. 2017, 74, 133–141. [Google Scholar] [CrossRef]
- Pantazopoulos, G.A.; Toulfatzis, A.I. Failure analysis of a machinable brass connector in a boiler unit installation. Case Stud. Eng. Fail. Anal. 2013, 1, 18–23. [Google Scholar] [CrossRef]
- Mapelli, C.; Gruttadauria, A.; Bellogini, M. Analysis of the factors involved in failure of a brass sleeve mounted on an electro-valve. Eng. Fail. Anal. 2010, 17, 431–439. [Google Scholar] [CrossRef]
- Galai, M.; Choucri, J.; Hassani, Y.; Benqlilou, H.; Mansouri, I.; Ouaki, B.; Ebn Touhami, M.; Monticelli, C.; Zucchi, F. Moisture content and chloride ion effect on the corrosion behavior of fitting brass (gate valves) used as a connection of PVC’s conduits in aggressive sandy soil. Chem. Data Collect. 2019, 19, 100171. [Google Scholar] [CrossRef]
- Doostmohammadi, H.; Moridshahi, H. Effects of Si on the microstructure, ordering transformation and properties of the Cu 60 Zn 40 alloy. J. Alloys Compd. 2015, 640, 401–407. [Google Scholar] [CrossRef]
- Vilarinho, C.; Davim, J.P.; Soares, D.; Castro, F.; Barbosa, J. Influence of the chemical composition on the machinability of brasses. J. Mater. Process. Technol. 2005, 170, 441–447. [Google Scholar] [CrossRef]
- Davies, D.D. A Note on the Dezincification of Brass and the Inhibiting Effect of Elemental Additions; Copper Development Association Inc.: New York, NY, USA, 1993. [Google Scholar]
- Ismail, K.M.; Elsherif, R.M.; Badawy, W.A. Effect of Zn and Pb contents on the electrochemical behavior of brass alloys in chloride-free neutral sulfate solutions. Electrochim. Acta 2004, 49, 5151–5160. [Google Scholar] [CrossRef]
- Kumar, S.; Narayanan, T.S.; Manimaran, A.; Kumar, M.S. Effect of lead content on the dezincification behaviour of leaded brass in neutral and acidified 3.5% NaCl solution. Mat. Chem. Phys. 2007, 106, 134–141. [Google Scholar] [CrossRef]
- La Fontaine, A.; Keast, V.J. Compositional distributions in classical and lead-free brasses. Mater. Charact. 2006, 57, 424–429. [Google Scholar] [CrossRef]
- You, S.-J.; Choi, Y.-S.; Kim, J.-G.; Oh, H.-J.; Chi, C.-S. Stress corrosion cracking properties of environmentally friendly unleaded brasses containing bismuth in Mattson’s solution. Mater. Sci. Eng. A 2003, 345, 207–214. [Google Scholar] [CrossRef]
- Nobel, C.; Hofmann, U.; Klocke, F.; Veselovac, D.; Puls, H. Application of a new, severe-condition friction test method to understand the machining characteristics of Cu–Zn alloys using coated cutting tools. Wear 2015, 344–345, 58–68. [Google Scholar] [CrossRef]
- Nikolaychuk, P.A.; Tyurin, A.G. Thermodynamic evaluation of corrosion electrochemical behaviour of silicon brass CuZn17Si3. Inorg. Mater. 2013, 49, 457–467. [Google Scholar] [CrossRef]
- Seuss, F.; Gaag, N.; Virtanen, S. Corrosion mechanism of CuZn21Si3P in aggressive tap water. Mater. Corros. 2017, 68, 42–49. [Google Scholar] [CrossRef]
- Zhou, P.; Hutchison, M.J.; Erning, J.W.; Scully, J.R.; Ogle, K. An in situ kinetic study of brass dezincification and corrosion. Electrochim. Acta 2017, 229, 141–154. [Google Scholar] [CrossRef]
- Lucey, V.F. The mechanism of dezincification and the effect of arsenic. I. Br. Corros. J. 1965, 1, 9–14. [Google Scholar] [CrossRef]
- Lucey, V.F. The mechanism of dezincification and the effect of arsenic. II. Br. Corros. J. 1965, 1, 53–59. [Google Scholar] [CrossRef]
- Zou, J.Y.; Wang, D.H.; Qiu, W.C. Solid-state diffusion during the selective dissolution of brass: Chronoamperometry and positron annihilation study. Electrochim. Acta 1997, 42, 1733–1737. [Google Scholar] [CrossRef]
- Karpagavalli, R.; Balasubramaniam, R. Influence of arsenic, antimony and phosphorus on the microstructure and corrosion behavior of brasses. J. Mater. Sci. 2007, 42, 5954–5958. [Google Scholar] [CrossRef]
- Gebel, T. Arsenic and antimony: Comparative approach on mechanistic toxicology. Chem. Biol. Interact. 1997, 107, 131–144. [Google Scholar] [CrossRef]
- Copeland, R.C.; Lytle, D.A.; Dionysiou, D.D. Desorption of arsenic from drinking water distribution system solids. Environ. Monit. Assess. 2007, 127, 523–535. [Google Scholar] [CrossRef]
- Kondrashin, V.Y. To the Theory of Anticorrosion Alloying of Brasses. Prot. Met. 2005, 41, 138–145. [Google Scholar] [CrossRef]
- Tabrizi, U.; Parvizi, R.; Davoodi, A.; Moayed, M.H. Influence of heat treatment on microstructure and passivity of Cu–30Zn–1Sn alloy in buffer solution containing chloride ions. Bull. Mater. Sci. 2012, 35, 89–97. [Google Scholar] [CrossRef]
- Sohn, S.; Kang, T. The effects of tin and nickel on the corrosion behavior of 60Cu–40Zn alloys. J. Alloys Compd. 2002, 335, 281–289. [Google Scholar] [CrossRef]
- Pugacheva, N.B. Structure of commercial α + β brasses. Met. Sci. Heat Treat. 2007, 49, 67–74. [Google Scholar] [CrossRef]
- Hung, C.-Y.; Lin, C.-M.; Hsieh, C.-C.; Li, C.-C.; Wu, P.T.-Y.; Chen, K.-T.; Wu, W. A novel approach to improving resistance to dezincification of diphasic brass. J. Alloys Compd. 2016, 671, 502–508. [Google Scholar] [CrossRef]
- Kawashima, A.; Agrawal, A.K.; Staehle, R.W. Stress corrosion cracking of admiralty brass in nonammoniacal sulfate solutions. J. Electrochem. Soc. 1977, 124, 1822–1823. [Google Scholar] [CrossRef]
- Torchio, S. The stress corrosion cracking of admiralty brass in sulphate solutions. Corros. Sci. 1986, 26, 133–151. [Google Scholar] [CrossRef]
- Brandl, E.; Malke, R.; Beck, T.; Wanner, A.; Hack, T. Stress corrosion cracking and selective corrosion of copper-zinc alloys for the drinking water installation. Mater. Corros. 2009, 60, 251–258. [Google Scholar] [CrossRef]
- Zucchi, F.; Trabanelli, G.; Fonsati, M.; Giusti, A. Influence of P, As and Sb on the susceptibility to SCC of α-β’ brasses. Mater. Corros. 1998, 49, 864–869. [Google Scholar] [CrossRef]
- Monticelli, C.; Balbo, A.; Esvan, J.; Chiavari, C.; Martini, C.; Zanotto, F.; Marvelli, L.; Robbiola, L. Evaluation of 2-(salicylideneimino) thiophenol and other Schiff bases as bronze corrosion inhibitors by electrochemical techniques and surface analysis. Corros. Sci. 2019, 148, 144–158. [Google Scholar] [CrossRef]
- Bostan, R.; Varvara, S.; Găină, L.; Muresan, L.M. Evaluation of some phenothiazine derivatives as corrosion inhibitors for bronze in weakly acidic solution. Corros. Sci. 2012, 63, 275–286. [Google Scholar] [CrossRef]
- Brug, G.J.; van den Eeden, A.L.G.; Sluyters-Rehbach, M.; Sluyters, J.H. The analysis of electrode impedances complicated by the presence of a constant phase element. J. Electroanal. Chem. 1984, 176, 275–295. [Google Scholar] [CrossRef]
- Abedini, M.; Ghasemi, H.M. Corrosion behavior of Al-brass alloy during erosion—corrosion process: Effects of jet velocity and sand concentration. Mater. Corros. 2016, 67, 513–521. [Google Scholar] [CrossRef]
- Trabanelli, G.; Monticelli, C.; Grassi, V.; Frignani, A. Electrochemical study on inhibitors of rebar corrosion in carbonated concrete. Cem. Concr. Res. 2005, 35, 1804–1813. [Google Scholar] [CrossRef]
- Nagiub, A.; Mansfeld, F. Evaluation of corrosion inhibition of brass in chloride media using EIS and ENA. Corros. Sci. 2001, 43, 2147–2171. [Google Scholar] [CrossRef]
- Rochdi, A.; Kassou, O.; Dkhireche, N.; Touir, R.; El Bakri, M.; Ebn Touhami, M.; Sfaira, M.; Mernari, B.; Hammouti, B. Inhibitive properties of 2,5-bis(n-methylphenyl)-1,3,4-oxadiazole and biocide on corrosion, biocorrosion and scaling controls of brass in simulated cooling water. Corros. Sci. 2014, 80, 442–452. [Google Scholar] [CrossRef]
- Jie, H.; Xu, Q.; Wei, L.; Min, Y. Etching and heating treatment combined approach for superhydrophobic surface on brass substrates and the consequent corrosion resistance. Corros. Sci. 2016, 102, 251–258. [Google Scholar] [CrossRef]
- Žerjav, G.; Milošev, I. Corrosion protection of brasses and zinc in simulated urban rain Part I: Individual inhibitors benzotriazole, 2-mercaptobenzimidazole and stearic acid. Mater. Corros. 2015, 66, 1402–1413. [Google Scholar] [CrossRef]
- Pryor, M.J.; Giam, K. The Effect of Arsenic on the Dealloying of α-Brass. J. Electrochem. Soc. 1982, 129, 2157–2163. [Google Scholar] [CrossRef]


© 2019 by the authors. Licensee MDPI, Basel, Switzerland. This article is an open access article distributed under the terms and conditions of the Creative Commons Attribution (CC BY) license (http://creativecommons.org/licenses/by/4.0/).