Article

Effect of Temperature on the Corrosion Behavior of Biodegradable AZ31B Magnesium Alloy in Ringer’s Physiological Solution

by
Sebastian Feliu, Jr.
1,*,
Lucien Veleva
2 and
Federico García-Galvan
1
1
Surface Engineering, Corrosion and Durability Department, Centro Nacional de Investigaciones Metalúrgicas (CENIM-CSIC), 28040 Madrid, Spain
2
Applied Physics Department, Center for Investigation and Advanced Study (CINVESTAV-IPN), Unidad Merida, 97310 Merida, Mexico
*
Author to whom correspondence should be addressed.
Metals 2019, 9(5), 591; https://doi.org/10.3390/met9050591
Submission received: 22 April 2019 / Revised: 16 May 2019 / Accepted: 21 May 2019 / Published: 22 May 2019
(This article belongs to the Special Issue Surface Chemistry and Corrosion of Light Alloys)

Abstract

:
In this work, the corrosion behaviors of the AZ31B alloy in Ringer’s solution at 20 °C and 37 °C were compared over four days to better understand the influence of temperature and immersion time on corrosion rate. The corrosion products on the surfaces of the AZ31B alloys were examined by scanning electron microscopy (SEM), energy dispersive X-ray spectroscopy (EDS) and X-ray diffraction (XRD). Electrochemical impedance spectroscopy (EIS) provided information about the protective properties of the corrosion layers. A significant acceleration in corrosion rate with increasing temperature was measured using mass loss and evolved hydrogen methods. This temperature effect was directly related to the changes in chemical composition and thickness of the Al-rich corrosion layer formed on the surface of the AZ31B alloy. At 20 °C, the presence of a thick (micrometer scale) Al-rich corrosion layer on the surface reduced the corrosion rate in Ringer’s solution over time. At 37 °C, the incorporation of additional Mg and Al compounds containing Cl into the Al-rich corrosion layer was observed in the early stages of exposure to Ringer’s solution. At 37 °C, a significant decrease in the thickness of this corrosion layer was noted after four days.

1. Introduction

Magnesium (Mg) alloys are promising biomaterials for degradable implants, because Mg is biodegradable, non-toxic, and has similar mechanical properties to human bone [1,2]. Among the AZ series (aluminum and zinc), Mg alloy with 3% Al and 1%Zn (AZ31) is considered as the first choice for biomedical applications because of its reduced aluminum content, acceptable fatigue resistance, the absence of a significant amount of β-intermetallic phase on the grain boundary, and good corrosion resistance [1,2]. However, to obtain the most complete information on those factors that influence the degradation process of AZ31 alloys, it should be studied in physiological media.
It is known that an increase in temperature accelerates the corrosion rate of metals [3,4]. In most practical situations, it has been suggested that the corrosion rate doubles for each temperature increase of 10 °C, based on the Arrhenius equation [5,6,7]. In the specific case of magnesium (Mg) alloys tested in simulated body fluid (SBF), Kirkland et al. [6] reported approximately two-fold increases in corrosion rates for pure Mg, Mg–0.8Ca, and Mg–1Zn in Hank’s balanced salt solution (HBSS), between 20 °C and 37 °C (physiological temperature of the human body).
However, the temperature dependence of the corrosion rates of Mg and its alloys immersed in SBF is more complicated, and the microstructure, the presence and quantity of impurities [8] or second phases [9], and the differences in their activation with temperature [6] should be considered. Abidin et al. [9] compared the corrosion rates of high-purity Mg and Mg2Zn0.2Mn, ZE41, and AZ91 alloys after their exposure to Hank’s solution at 37 °C against those at room temperature. While the corrosion rates for high-purity Mg and Mg2Zn0.2Mn were independent of temperature, the corrosion rates for ZE41 and AZ91 at 37 °C were 6–9 times higher than those at room temperature. The accelerated corrosion of ZE41 and AZ91 has been attributed to the presence of microgalvanic cells that form between Mg and the second-phase precipitates [9], whose electrochemical activity increases with temperature [6]. Since NaCl is the main component of SBF, the migration and diffusion rates of the aggressive chloride ions are also dependent on temperature [10].
In addition to the accelerating effect of temperature on electrochemical reactions, an increase in temperature from room temperature to 37 °C can also alter the mechanism of the corrosion process [11,12]. Similar to what has been observed for Ti and Ti-based alloys exposed to Ringer’s solution [10], temperature is a critical factor influencing the pitting corrosion of Mg alloys, since its susceptibility to the development of pits and other forms of localized corrosion increases significantly with temperature [6,8,13].
It is also important to note that the degree of change in corrosion rate with temperature is dependent on the nature and content of alloying elements [6,14]. For pure Mg and a wide range of Mg alloys (including Mg–Ca, Mg–Zn, Mg–Mn, Mg–Zr, Mg–Ca–Zn, and Mg–Al–Zn) tested in minimum essential medium containing 10% fetal bovine serum (MEMFBS), Kirkland et al. [6] noted that AZ alloys (Mg–Al–Zn) exhibited much larger increases in corrosion rate with increasing temperature (e.g., 400–500% for AZ91 and AZ31 alloys) compared with the relatively small increases of 10–100% for the rest of the Mg alloys studied and pure Mg. On the other hand, Esmaily et al. [15] observed that during atmospheric corrosion testing, the effect of exposure temperature (ranging from −4 to 22 °C) on the corrosion rate of AZ alloys was directly proportional to the Al content. Thus, while in the case of AZ31 (3 wt% Al), increasing the temperature resulted in a 21% increase in corrosion rate, the corresponding increase was 92% for AZ91 (9 wt% Al). The formation of a very thin Al-enriched inner corrosion layer (~9 nm thick) on the surface of AZ91 at low temperatures (−4 and 4 °C) blocks the penetration of chloride ions; the breakdown of this layer at 22 °C plays a crucial role in this temperature effect. The presence of such Al-rich layers on corroded AZ alloys and their influence on the corrosion process is still a contentious issue [16]. Some studies [17,18,19] have reported Al enrichment within the corrosion layers formed on Mg alloys with high Al content (AZ80 or AZ91), but not in Mg–Al alloys with relatively low Al content, such as AZ31 [18,19]. However, other studies have detected such Al enrichment [20,21,22,23] in the corrosion layers formed on AZ31 alloys after exposure to atmospheric conditions or during immersion tests in chloride-containing media [21,22,23].
The aims of this study were to establish possible relationships between the Al enrichment in the corrosion layer formed on AZ31B alloy in Ringer’s solution and the corrosion rate to better understand the effect of increasing temperature (from 20 °C to 37 °C) on the differences in the chemical and protective characteristics of this layer, and to analyze the influence of temperature of the test solution on the occurrence of pitting corrosion in this alloy.

2. Materials and Methods

2.1. Material Preparation

Commercially available rolled sheets of AZ31B Mg alloy (Magnesium Elecktron Ltd., Manchester, UK), the composition of which is listed in Table 1, was used in this study. Square coupon specimens with sizes of 20 × 20 × 3 mm3 and 50 × 50 × 3 mm3 were cut. Prior to testing, the specimens were polished using abrasive SiC paper up to 2000 grit, finished to a mirror surface with 1 μm diamond paste, cleaned in ethanol (Sigma-Aldrich, St. Louis, MO, USA) via bath sonication, and finally dried using compressed air.

2.2. Electrolyte Solution

The electrolyte used for simulating the physiological fluid medium of the human body was Ringer’s solution, which was prepared using analytical grade reagents (Sigma-Aldrich, St. Louis, MO, USA) and deionized water with resistivity 18.2 MΩ·cm. The composition of Ringer’s solution was (in g/L) NaCl—8.36, KCl—0.30, and CaCl2—0.15, and the pH of the as prepared solution was 6.1 [24]. Experiments were run at temperatures of 20 °C and 37 °C. The lower temperature was simply room temperature, and was uncontrolled [10]; with temperature accuracy estimated to be ±2 °C. The experiments at the physiological temperature of 37 ± 1 °C were controlled using a thermostatic water bath (Ultrasons Medi-II, J.P. Selecta, Barcelona, Spain).

2.3. Characterization of Corrosion Products

The surface and cross-sectional morphologies of the corrosion layers were examined by both optical (Olympus BX-51, Olympus, Tokyo, Japan) and scanning electron microscopy (SEM, Jeol JSM 6500F, Jeol Ltd., Tokyo, Japan). The chemical compositions of the corrosion products were analyzed using energy dispersive X-ray spectroscopy (EDS, Oxford Instruments, Oxford, Oxfordshire, UK). Information about the pit geometry was obtained with a 3D microscope using white light interferometry (Leica, DCM8, Leica Micro-systems, Wetzlar, Germany).
Corrosion products on the surface of the AZ31B specimens were analyzed using low-angle X-ray diffraction (XRD, Bruker AXS D8 diffractometer, Bruker AXS, Karlsruhe, Germany) with Cu-Kα radiation in the 2θ range from 10 to 100° (incidence angle 1°, counting time 4 s per step, and angular resolution 0.03°).

2.4. Corrosion Rate Measurements

The corrosion rates of AZ31B alloys were estimated from mass loss and evolved hydrogen measurements. The exposed area was approximately 10.4 cm2, and specimens were immersed in approximately 500 mL of quiescent Ringer’s solution for a period of 4 days at 20 °C and 37 °C. To measure the volume of the hydrogen gas evolved during the corrosion test, the gas was collected using an inverted burette and funnel setup, where the volume of test solution displaced in the burette was measured. The hydrogen evolution rate, VH (mL cm−2 d−1), can be represented as the corrosion rate, PH (mm·year−1), according to Equation (1) [25]:
P H = 2.088 × V H
After immersion for 1, 2, and 4 days in Ringer’s solution at 20 °C and 37 °C, the corrosion layers formed on the surfaces of the AZ31B specimens were dissolved with an aqueous solution of 200 g/L CrO3 (Sigma-Aldrich, St. Louis, MO, USA) and 10 g/L AgNO3 (Sigma-Aldrich, St. Louis, MO, USA) for 10 min prior to weighing the specimens. The immersion tests were performed in triplicate to assess the repeatability of the experimental results.

2.5. Electrochemical Measurements

The corrosion behaviors of the AZ31B specimens were assessed by electrochemical impedance spectroscopy (EIS) measurements at open circuit potential (OCP) during immersion in Ringer’s solution at 20 °C and 37 °C. Electrochemical experiments were carried out with an Autolab PGSTAT30 (Metrohm, Herisau, Switzerland) potentiostat/galvanostat. A standard three-electrode cell was used, which consisted of saturated Ag/AgCl as the reference electrode (Fisher Scientific Accumet, Waltham, MA, USA), a Pt spiral as the counter electrode, and AZ31B Mg alloy as the working electrode (with an exposure area of 9 cm2). The spectra were acquired over a frequency range from 100 kHz to 10 mHz, using an RMS sinusoidal perturbation of ±10 mV with respect to the OCP. The electrochemical tests were performed in duplicate to ensure reproducibility. ZView software (3.0a Scribner Associates, Inc., Southern Pines, NC, USA) was used to fit the EIS spectra.

3. Results

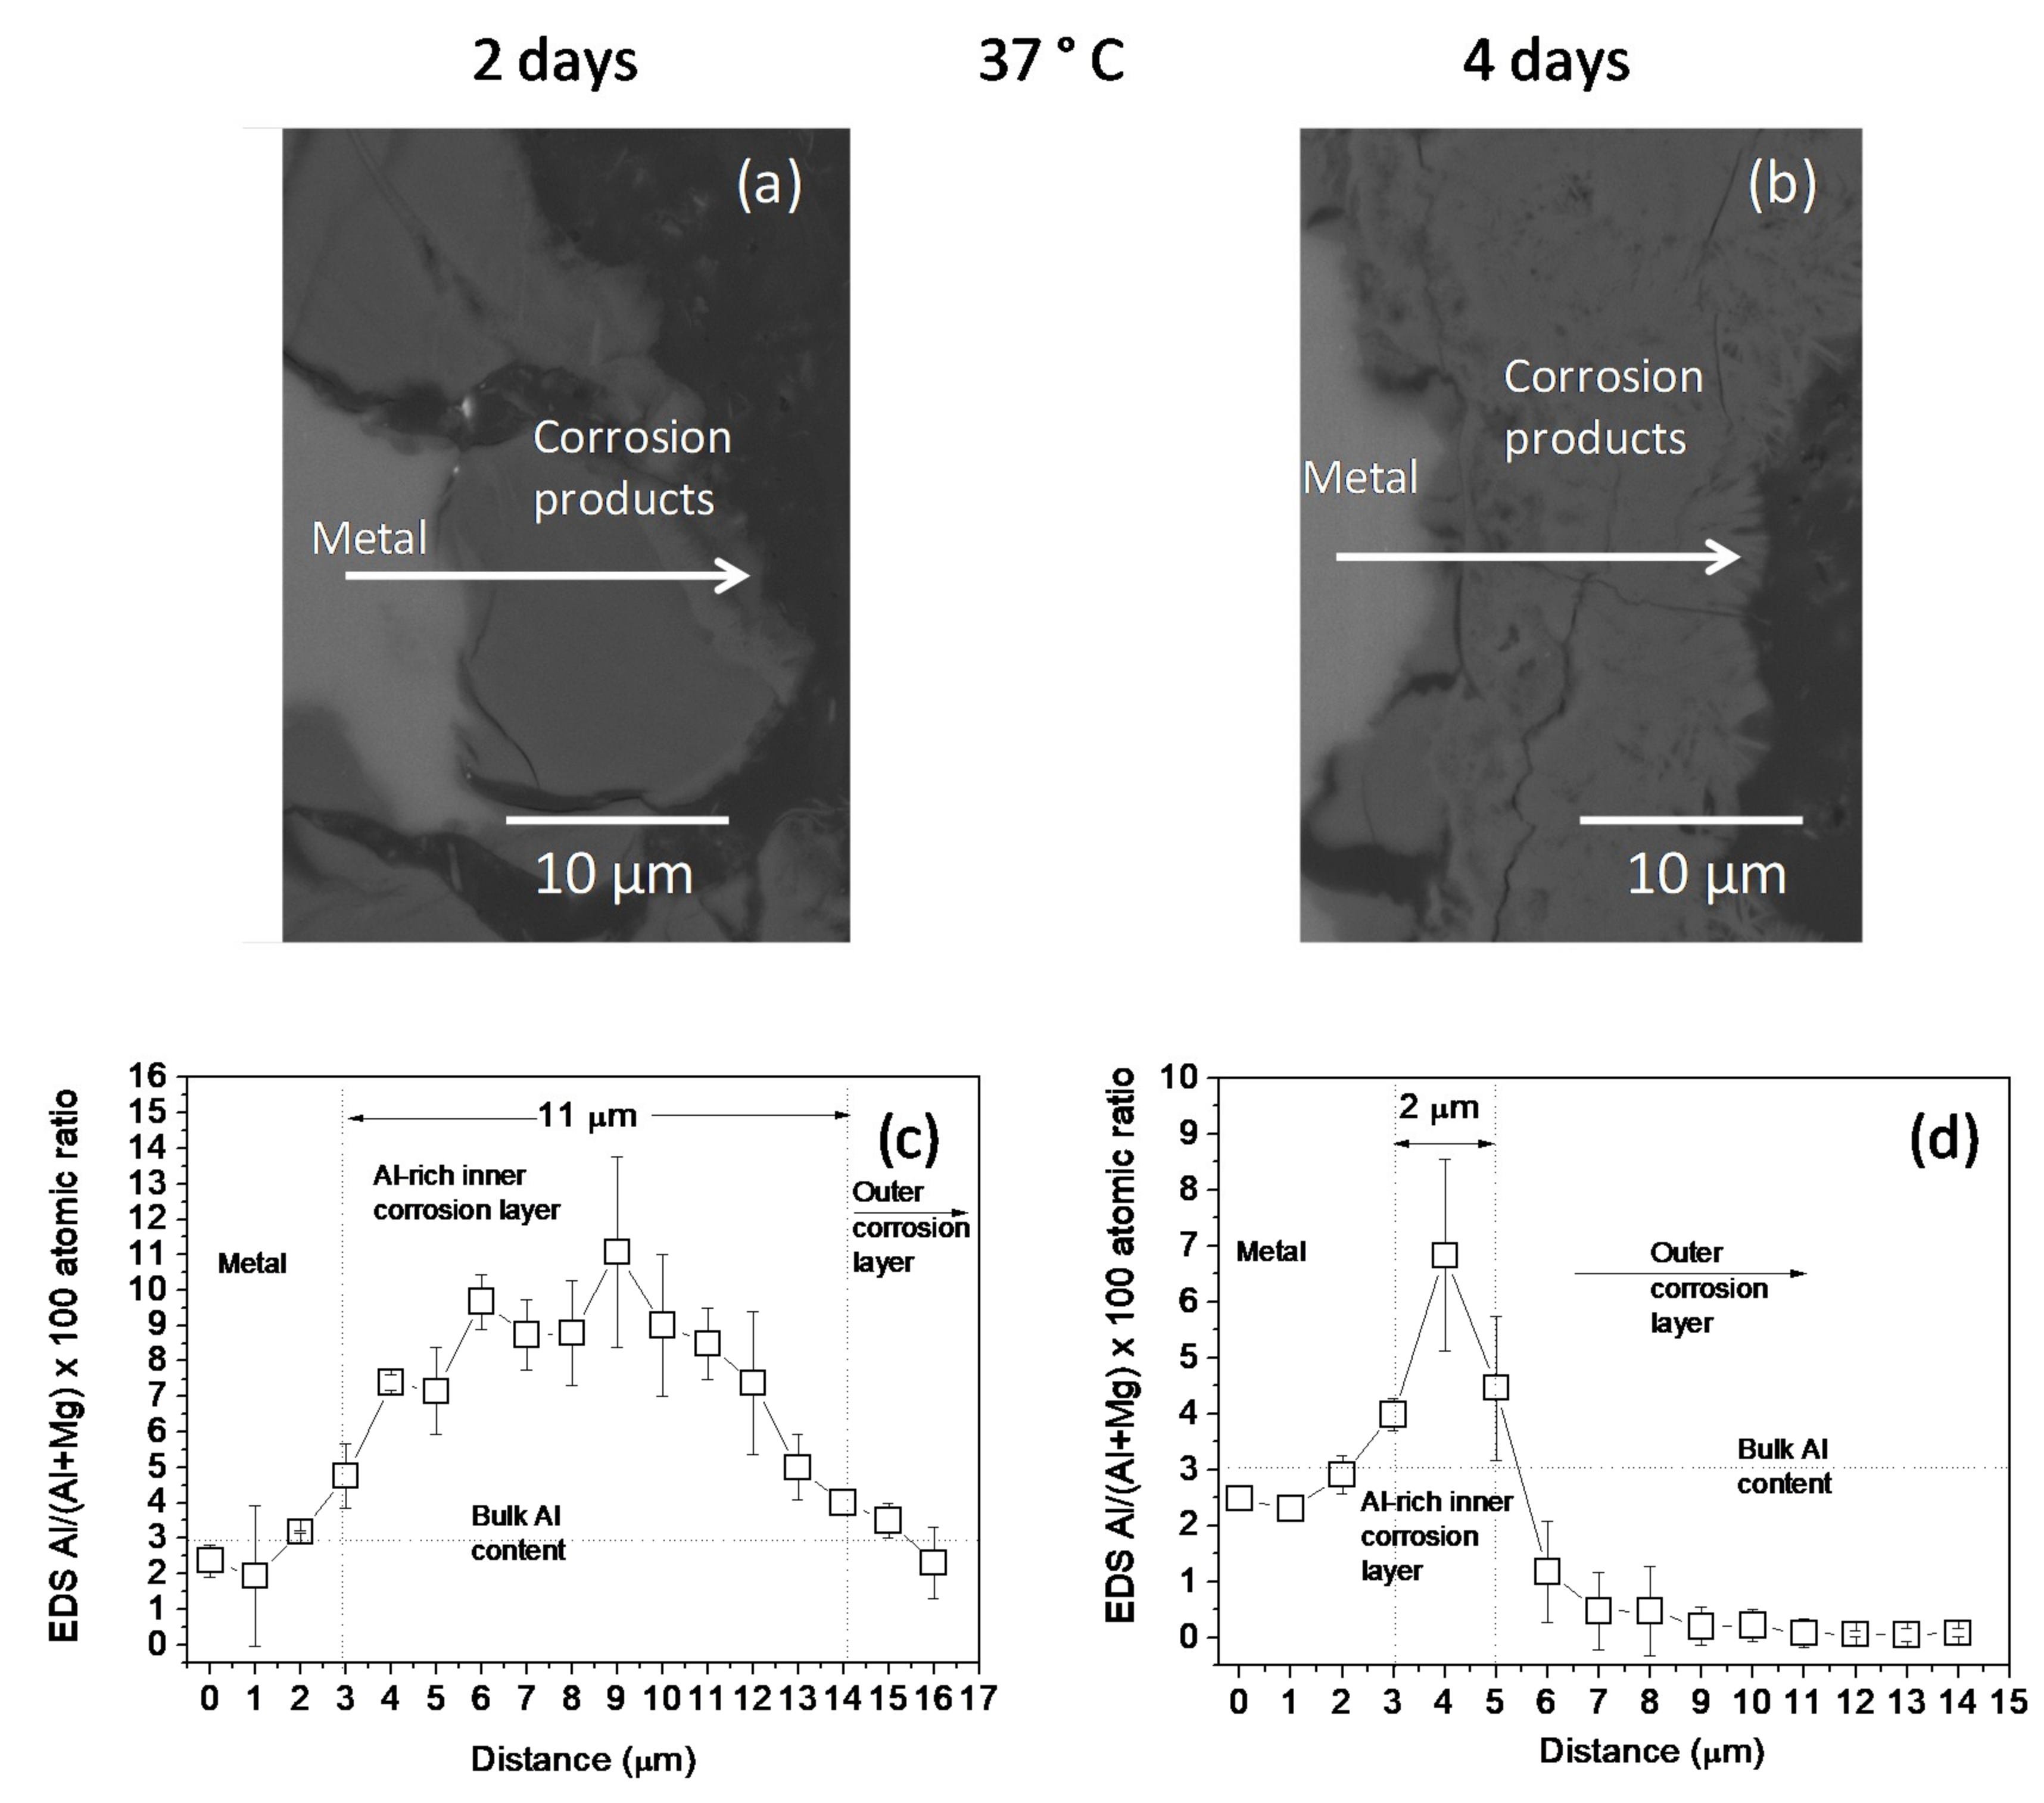
3.1. Surface and Cross-Sectional Corrosion Product Morphologies

Figure 1 compares the surface morphologies of the non-exposed AZ31B specimens and those following immersion for 2 and 4 days in Ringer’s solution at 20 °C and 37 °C. A small amount of Al–Mn intermetallic particles was observed for the non-exposed AZ31 specimens (Figure 1a). In contrast to the rather compact and homogeneous corrosion layer formed on the specimens immersed at 20 °C (Figure 1b,d) for 2 and 4 days, and at 37 °C for 2 days (Figure 1c), a wide pit with a diameter of ~200 μm was observed on the surface of the AZ31B specimen immersed for 4 days at 37 °C (Figure 1e).
The changes in the Al/(Al + Mg) at.% ratios, as measured by EDS, across the corrosion layers formed on the AZ31B specimens following immersion for 2 days and 4 days in Ringer’s solution at 20 °C and 37 °C are shown in Figure 2 and Figure 3, respectively. No significant difference was noted in the thickness of the Al-rich corrosion layer formed on the surface of the AZ31B specimens over the 4 days immersed at 20 °C (Figure 2c,d). In contrast, it is interesting to note the significant decrease in the thickness of the Al-rich layer on the corroded AZ31B specimen after 4 days of immersion in Ringer’s solution at 37 °C, compared to the value obtained for the specimen immersed for 2 days (Figure 3c,d).
The average atomic compositions of the corrosion layers formed on the surfaces of AZ31B specimens immersed in Ringer’s solution for 2 days at 20 °C and 37 °C, obtained by cross-sectional EDS analysis, are shown in Table 2. These analyses revealed a significant reduction in the atomic percentage of oxygen in the corrosion product layer, along with a significant Cl content (approximately 8 at.%), in the specimens immersed at 37 °C in comparison to the values obtained for the specimens immersed at 20 °C. These changes with temperature could suggest some degree of replacement of the oxygen-containing corrosion products by chloride species in the corrosion layers formed on the AZ31B specimens in Ringer’s solution.
The cross-sectional morphology, the Al/(Al + Mg) at.% ratios, and the Cl at.% obtained by EDS microanalysis across a pit formed on the AZ31B specimen after immersion for 4 days in Ringer’s solution at 37 °C are presented in Figure 4a–c, respectively. The analysis revealed that Cl and Al were enriched in the pit (Figure 4b,c). The similar composition gradients of Cl content and Al/(Al + Mg) at.% ratios obtained by EDS point analysis across the corrosion pit (Figure 4b,c) may be suggestive of some association of chloride with the Al.
Figure 5 shows a comparison between optical microscopy images of cross-sections of the deepest corrosion pits for the AZ31B specimens immersed in Ringer’s solution for 4 days at 20 °C and 37 °C. The increase in temperature led to very deep pitting corrosion (Figure 5b), to depths up to 912 µm, while at 20 °C this localized attack was less extensive (≈154 µm) (Figure 5a).
The 3D images in Figure 6 present the pit morphology of the AZ31B specimens immersed in Ringer’s solution for 4 days at 20 °C and 37 °C, after removal of the corrosion products. It can be seen that the depth and width of the pits formed at 37 °C are significantly greater (Figure 6b) than those formed at 20 °C (Figure 6a). The average depths and widths of the corrosion pits are given in Table 3. After immersion in Ringer’s solution for 4 days, the AZ31B specimens immersed at 37 °C had wider and deeper pits than those formed after immersion at 20 °C.

3.2. XRD Analysis

Figure 7 shows low-angle XRD patterns of the AZ31B specimens after immersion in Ringer’s solution at 20 °C and 37 °C for 2 days and 4 days. The spectra revealed that the corrosion product layer mainly consisted of Mg(OH)2. Significant metallic Mg-peaks were only detected in the XRD spectrum of AZ31B specimens immersed in Ringer’s solution for 2 days at 20 °C, because of the thinner corrosion layer, compared to those of the specimens immersed at 37 °C.

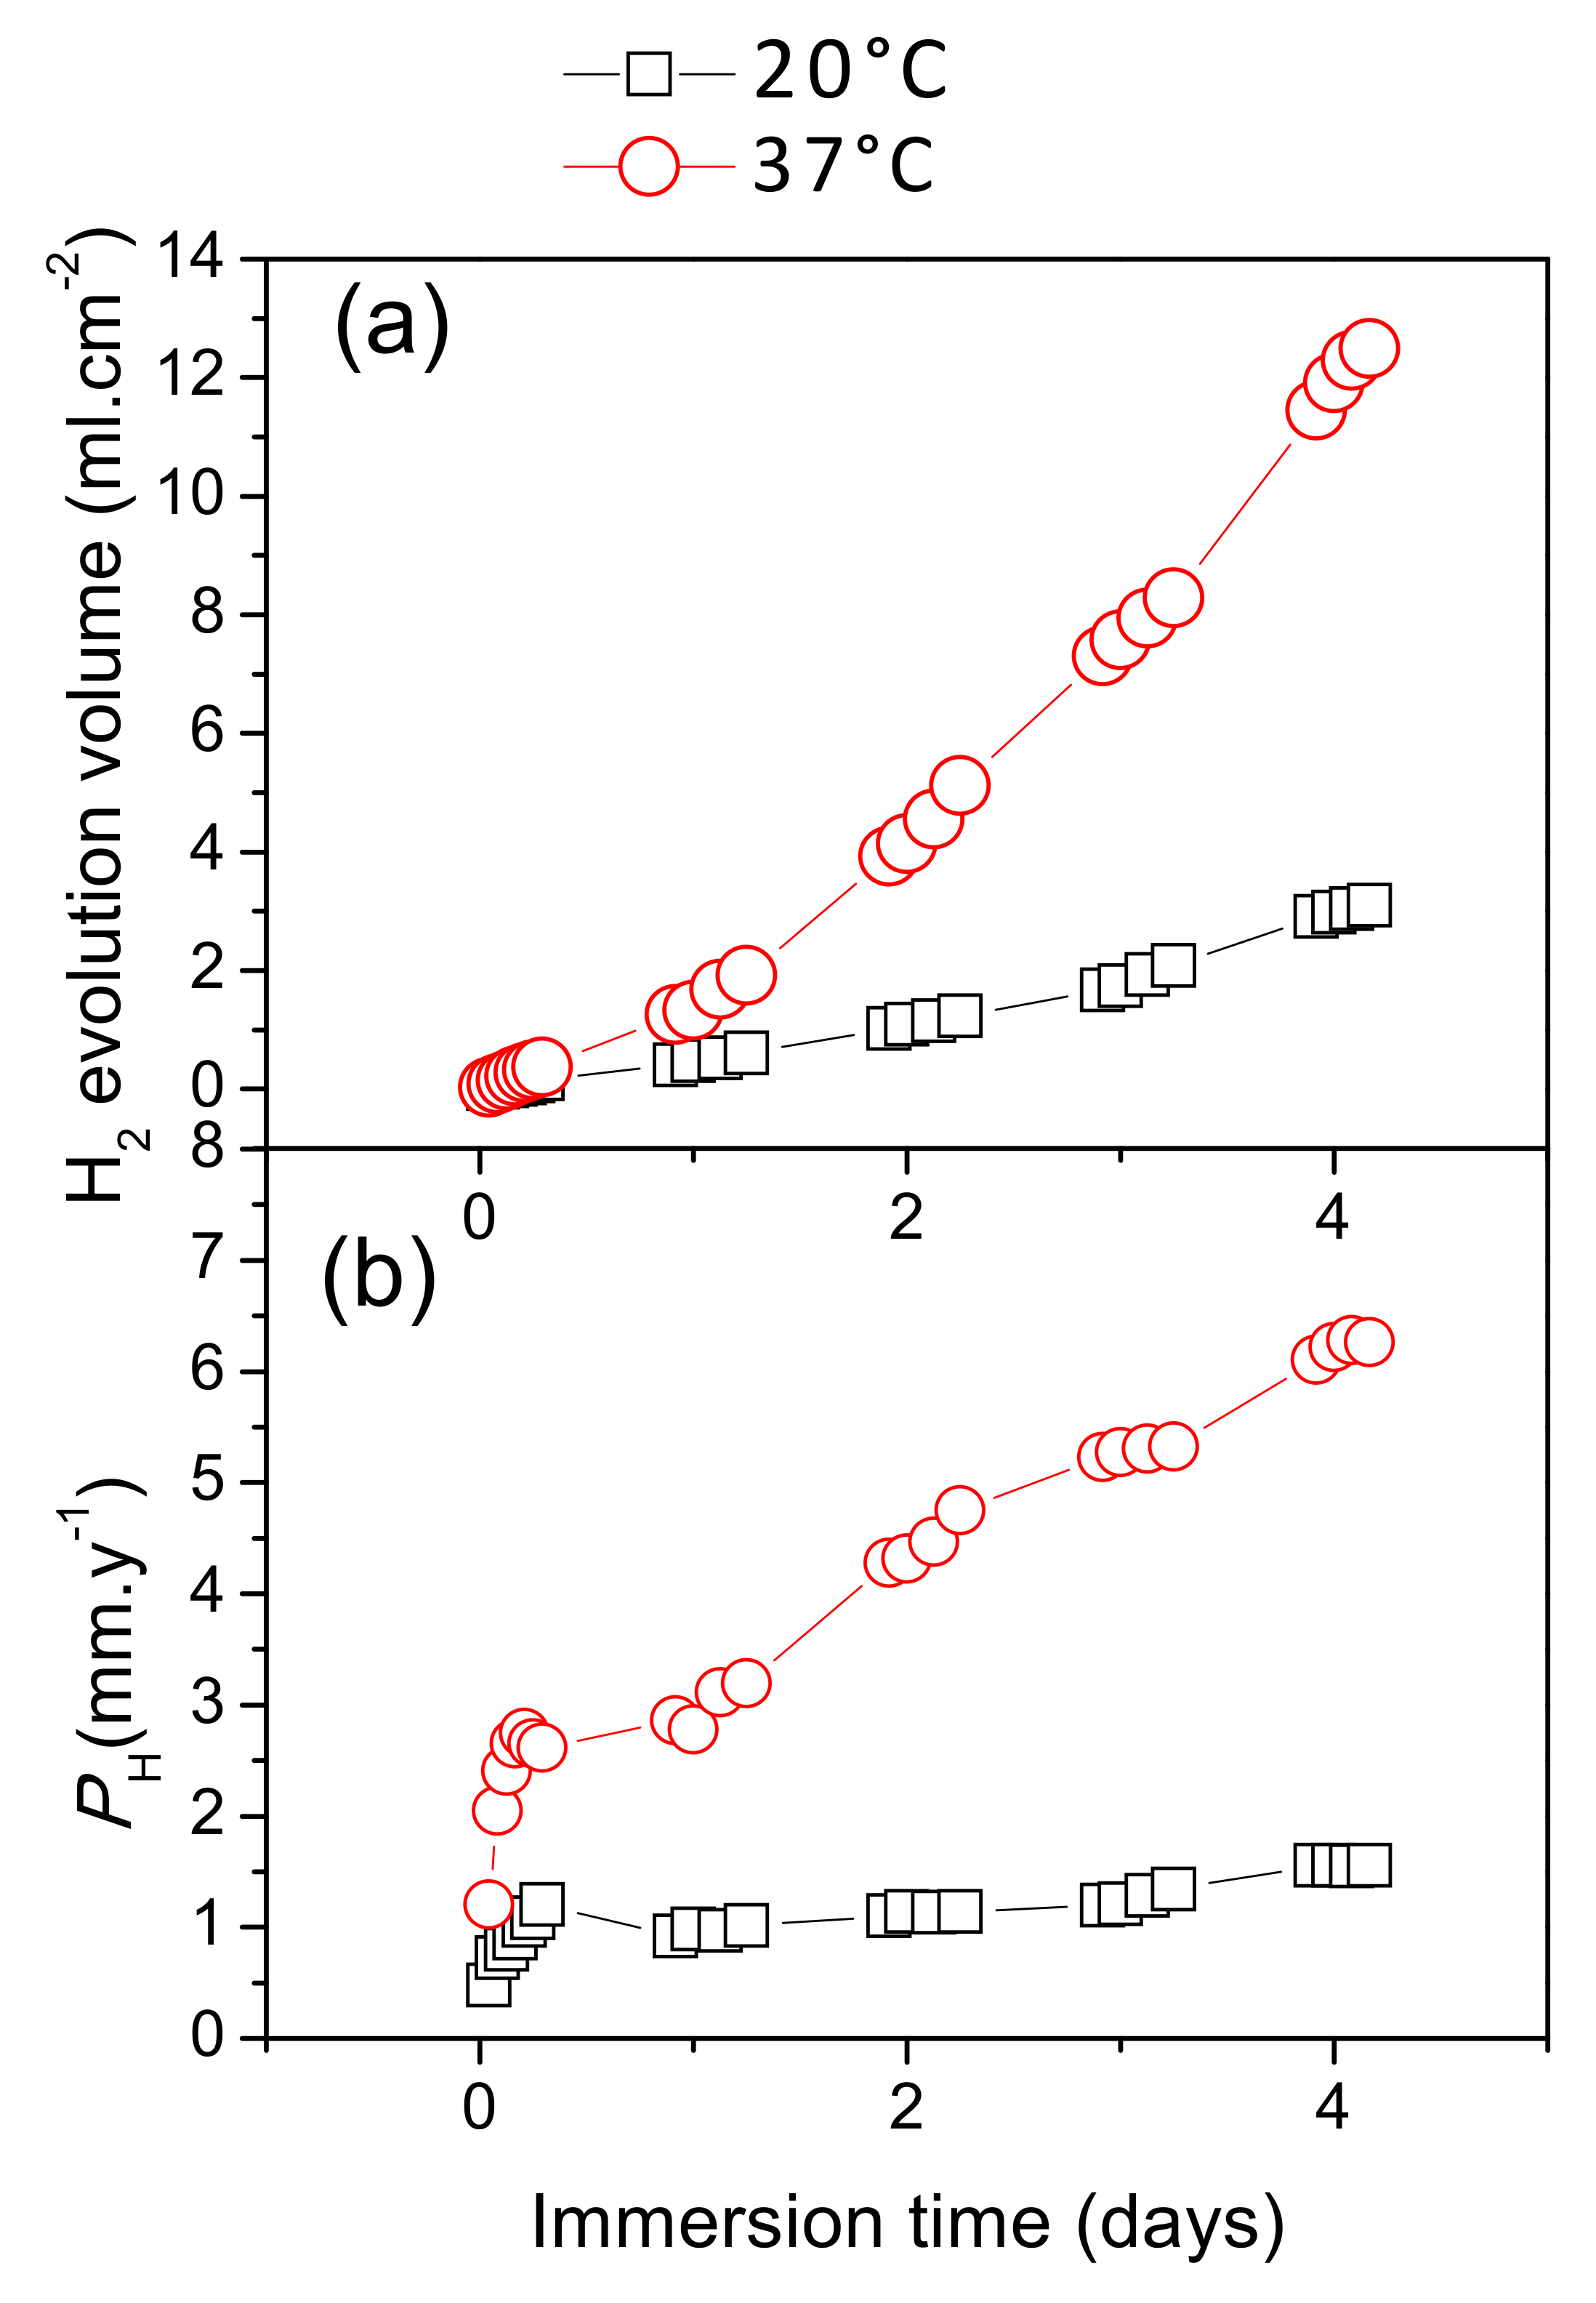
3.3. Hydrogen Evolution and Mass Loss Measurements

Figure 8 presents the differences in hydrogen evolution between the AZ31B specimens immersed for 4 days in Ringer’s solution at 20 °C and 37 °C. The results indicate that hydrogen evolution volume from the AZ31B specimens increased almost linearly over time when immersed at 20 °C, while at 37 °C there was a tendency to increase exponentially with immersion time (Figure 8a).
Figure 8b shows the corrosion rate, PH, calculated from the hydrogen evolution data (Figure 8a) and the immersion times using Equation (1). After 1 day of immersion at 20 °C, the AZ31B specimen showed a low corrosion rate, which remained essentially constant over the whole immersion period. In contrast, the corrosion rate of the specimen immersed at 37 °C continually increased over 4 days, and the final corrosion rate was approximately four times higher than that of the specimen immersed at 20 °C (Figure 8b).
Figure 9 shows the changes in corrosion rates, as determined from mass loss measurements, with increasing immersion time in Ringer’s solution at 20 °C and 37 °C. The corrosion rates at 37 °C were approximately 2.5 and 4 times higher after the first and fourth days of immersion, respectively, than those at 20 °C. It should be noted that a similar trend was determined from the hydrogen evolution data (Figure 8b).

3.4. EIS Diagrams

Figure 10 compares the Nyquist plots obtained for the AZ31B specimens immersed in Ringer’s solution at 20 °C with those at 37 °C, for several exposure times up to 4 days. All diagrams exhibited a capacitive loop at high frequencies (HF), the diameters of which became smaller with increasing immersion time. An inductive loop was observed at low frequencies. For the AZ31B specimens immersed at 37 °C, the size of the inductive loop decreased markedly (Figure 10), which may be as a consequence of diminished thickness of the Al-rich inner corrosion layer with immersion time (Figure 3). In contrast, there was no appreciable change in the size of the inductive loop for the AZ31B specimens immersed at 20 °C (Figure 10), when the thickness of the Al-rich inner corrosion layer remained constant over 4 days (Figure 2). These relationships suggest an influence of the composition and the thickness of formed corrosion layers on AZ31 surfaces on the degree of the inductive EIS response. A similar effect was reported in our previous study [26].
The EIS plots (Figure 10) were fitted with the electrical equivalent circuit (EEC), shown in Figure 11, which gave satisfactory results in our previous studies [23,26]. Rs corresponds to the electrolyte resistance, Rt is the charge transfer resistance, CPE1 is a constant phase element associated with the electrical double layer, L is the inductor, and R1 is the resistance of the inductive response.
Figure 12 shows the change in the fitted values of Rt with immersion time. After the first day of immersion, the Rt values of the AZ31B specimens immersed at 20 °C were approximately two or three times greater than those of the specimens immersed at 37 °C. The differences between the hydrogen volume data (Figure 8b) and Rt measurements (Figure 12) may be related to the different configuration of the exposed surface area of the specimens. For the hydrogen evolution measurements (used for the calculation rate of the corrosion process), square coupon specimens were entirely exposed to the aggressive solution and their edges (active areas) were not protected. However, for the electrochemical measurements of Rt, the exposed area was confined by means of a circular gasket, which protects the edges.

4. Discussion

4.1. Influence of Temperature on the Composition and Thickness of the Al-Rich Corrosion Layer Formed on the Surface of the Az31b Alloy in Ringer’s Solution

The XRD spectra (Figure 7) indicated that Mg(OH)2 was the main corrosion product formed on the surfaces of the AZ31B specimens immersed in Ringer’s solution. When immersed in an aqueous NaCl solution, it is generally accepted that the anodic dissolution of Mg and the cathodic evolution of hydrogen occur according to Equations (2) and (3) [27,28,29]:
Anodic   reaction :   Mg   Mg 2 + + 2 e
Cathodic   reaction :   2 H 2 O + 2 e 2 OH + H 2
The overall reaction can be expressed as:
Mg + 2 H 2 O Mg ( OH ) 2 + H 2
The significant increase in the Cl atomic percentage with increasing temperature, as observed by EDS (Table 2), in the corrosion layers formed after 2 days of immersion in Ringer’s solution may be related to the enhanced migration of chloride ions toward the metal/oxide interface at higher temperatures [10,13,30]. Similar chloride enrichment with temperature has been noted in the corrosion layers formed on AZ91 Mg alloy [15] and 2A02 Al alloy [30] during their atmospheric exposure in the presence of NaCl. The enrichment of chlorine in the corrosion layer is expected to enhance the conversion of the Mg(OH)2 corrosion product to soluble MgCl2, according to Equation (5):
Mg ( OH ) 2 + 2 Cl MgCl 2 + 2 OH
In addition to the accumulation of MgCl2 species, the interaction between Al enriched corrosion products on the AZ31B alloy [22,23] and Cl ions may generate AlCl3 compounds, according to Equation (6) [30]:
Al ( OH ) 3 + 3 Cl AlCl 3 + 3 OH
Accordingly, significant evidence of the presence of aluminum chloride salts was observed in the EDS point analysis of the corrosion products inside the pits on the AZ31B specimen immersed in Ringer’s solution at 37 °C for 4 days (Figure 4b,c). Similarly, in a previous work [26] investigating the same alloy in Ringer’s solution, significant amounts of aluminum oxychloride salts were found in the uniform corrosion layer after immersion for 2 days.
There have been previous reports on the formation of metal chlorides on magnesium alloys in contact with aqueous saline solutions whose growth at the metal/oxide interface resulted in the mechanical rupture of the corrosion layer [31,32] as a result of its greater molar volume [10,31]. In this study, the significant decrease in the thickness of the Al-rich layer observed on the AZ31B alloy immersed at 37 °C for 4 days (Figure 3) might be attributed to the breakdown and loss of this layer, which could be enhanced by the presence of chloride salts.

4.2. Relationship Between Corrosion Resistance and the Characteristics of the Al-Rich Inner Corrosion Layer

The hydrogen evolution volume over time (Figure 8), mass loss data (Figure 9), and EIS results (Figure 10 and Figure 12), provide complementary information about the influence of the composition/thickness of the Al-rich inner corrosion layer on the corrosion behavior of the AZ31B alloy surface in Ringer’s solution.
After 1 day of immersion, the hydrogen evolution and mass loss data obtained for AZ31B alloy immersed in Ringer’s solution at 37 °C (Figure 8b and Figure 9) revealed that the corrosion rate increased continuously throughout the immersion period, suggesting a progressive deterioration of the Al-rich inner corrosion layer. Further, the intensification of pitting corrosion in the specimen immersed at the higher temperature (Figure 5 and Figure 6) may be associated with the deterioration of this corrosion layer and the enhanced migration of Cl ions towards the anodic sites. These observations agree with the important reduction in thickness of the Al-rich inner corrosion layer formed on AZ31B alloy surfaces immersed at 37 °C for 4 days, as was revealed by EDS (Figure 3c,d). These results agree with previous findings of Esmaily et al. [15,16], regarding the temperature dependence of the corrosion rate of the AZ91D alloy under atmospheric conditions.
In contrast to the corrosion rates of the AZ31B specimens tested at 37 °C in Ringer’s solution, those rates corresponding to 20 °C (Figure 8b and Figure 9) remained unchanged over time and were much lower. SEM observations and EDS analysis (Figure 2) revealed significant Al enrichment in the corrosion layers formed on AZ31B alloy surfaces exposed over 4 days at 20 °C. These data suggest that the formation of the Al-rich inner corrosion layer on AZ31B alloy surfaces in Ringer’s solution may keep the development of corrosion at a lower level. This is consistent with previously reported results [18,19,23], which suggested that the presence of an Al-rich inner corrosion layer on Mg–Al alloys improves their corrosion resistance in corrosive media. Based on the present findings, it would seem that the approach of selecting alloying elements to self-produce enriched inner corrosion layers with enhanced barrier properties in contact with the different corrosive environments is a possible solution to improve intrinsic corrosion resistance of Mg alloys.

5. Conclusions

A four-fold increase in the corrosion rate of AZ31B alloy immersed in Ringer’s solution at 37 °C was measured, compared to that at 20 °C. Variations in the thickness and composition of the Al-rich inner corrosion layers, formed at both temperatures with immersion time, may reasonably explain the acceleration of the corrosion rate. The EDS data showed that the Al-rich inner corrosion layer on the AZ31B alloy exposed to Ringer’s solution at 20 °C retained its chemical composition and physical characteristics throughout the exposure to Ringer’s solution. The analysis of mass loss and hydrogen evolution data revealed that the Al-rich inner corrosion layer may act as an effective barrier, blocking the penetration of aggressive Cl ions and as well as improving the corrosion resistance of the AZ31B alloy. EDS analysis revealed a considerable chloride enrichment in the Al-rich inner corrosion layer on AZ31B alloy surface immersed in Ringer’s solution at 37 °C for 2 days. The formation of Mg and Al compounds containing chloride was closely associated with a significant reduction in the thickness of the Al-rich inner corrosion layer and the corresponding reduction of its protective properties. The decrease in the thickness of the Al-rich inner corrosion layer formed on the surface of the AZ31B alloy after 4 days immersed at 37 °C coincided with the intensification in pitting corrosion.

Author Contributions

F.G.-G. performed the preparation of samples and their corrosion tests. L.V. and S.F. discussed the results and wrote the manuscript with contributions from all authors. L.V. and S.F. conceived and supervised the project. All correspondence should be addressed to S.F.

Funding

This research was funded by the Spanish Ministry of Economy and Competitiveness (project MAT2015-65445-C2-1-R).

Conflicts of Interest

The authors declare no conflict of interest.

References

  1. Saikrishna, N.; Reddy, G.P.K.; Munirathinam, B.; Sunil, B.R. Influence of bimodal grain size distribution on the corrosion behavior of friction stir processed biodegradable AZ31 magnesium alloy. J. Magn. Alloys. 2016, 4, 68–76. [Google Scholar] [CrossRef] [Green Version]
  2. Song, Y.; Shan, D.; Chen, R.; Zhang, F.; Han, E.-H. Biodegradable behaviors of AZ31 magnesium alloy in simulated body fluid. Mater. Sci. Eng. C 2009, 29, 1039–1045. [Google Scholar] [CrossRef]
  3. LeBozec, N.; Jonsson, M.; Thierry, D. Atmospheric corrosion of magnesium alloys: Influence of temperature, relative humidity, and chloride deposition. Corrosion 2004, 60, 356–361. [Google Scholar] [CrossRef]
  4. Merino, M.C.; Pardo, A.; Arrabal, R.; Merino, S.; Casajus, P.; Mohedano, M. Influence of chloride ion concentration and temperature on the corrosion of Mg–Al alloys in salt fog. Corros. Sci. 2010, 52, 1696–1704. [Google Scholar] [CrossRef]
  5. Melchers, R.E. Effect of temperature on the marine immersion corrosion of carbon steels. Corrosion 2002, 58, 768–782. [Google Scholar] [CrossRef]
  6. Kirkland, N.T.; Birbilis, N. Magnesium Biomaterials: Design, Testing, and Best Practice; Springer New York: New York, NY, USA, 2014; pp. 40–43. [Google Scholar]
  7. Cai, Y.K.; Zhao, Y.; Ma, X.B.; Zhou, K.; Chen, Y. Influence of environmental factors on atmospheric corrosion in dynamic environment. Corros. Sci. 2018, 137, 163–175. [Google Scholar] [CrossRef]
  8. Song, G.L.; Atrens, A. Corrosion mechanisms of magnesium alloys. Adv. Eng. Mater. 1999, 1, 11–33. [Google Scholar] [CrossRef]
  9. Abidin, N.I.Z.; Atrens, A.D.; Martin, D.; Atrens, A. Corrosion of high purity Mg, Mg2Zn0.2Mn, ZE41 and AZ91 in Hank’s solution at 37 °C. Corros. Sci. 2011, 53, 3542–3556. [Google Scholar] [CrossRef]
  10. Burstein, G.T.; Liu, C.; Souto, R.M. The effect of temperature on the nucleation of corrosion pits on titanium in Ringer’s physiological solution. Biomaterials 2005, 26, 245–256. [Google Scholar] [CrossRef]
  11. Virtanen, S.; Milosev, I.; Gomez-Barrena, E.; Trebse, R.; Salo, J.; Konttinen, Y.T. Special modes of corrosion under physiological and simulated physiological conditions. Acta Biomater. 2008, 4, 468–476. [Google Scholar] [CrossRef]
  12. Bauer, S.; Schmuki, P.; von der Mark, K.; Park, J. Engineering biocompatible implant surfaces Part I: Materials and surfaces. Prog. Mater. Sci. 2013, 58, 261–326. [Google Scholar] [CrossRef]
  13. Frankel, G.S. Pitting corrosion of metals a review of the critical factors. J. Electrochem. Soc. 1998, 145, 2186–2198. [Google Scholar] [CrossRef]
  14. Kirkland, N.T.; Lespagnol, J.; Birbilis, N.; Staiger, M.P. A survey of bio-corrosion rates of magnesium alloys. Corros. Sci. 2010, 52, 287–291. [Google Scholar] [CrossRef]
  15. Esmaily, M.; Blucher, D.B.; Svensson, J.E.; Halvarsson, M.; Johansson, L.G. New insights into the corrosion of magnesium alloys—the role of aluminum. Scripta Mater. 2016, 115, 91–95. [Google Scholar] [CrossRef]
  16. Esmaily, M.; Svensson, J.E.; Fajardo, S.; Birbilis, N.; Frankel, G.S.; Virtanen, S.; Arrabal, R.; Thomas, S.; Johansson, L.G. Fundamentals and advances in magnesium alloy corrosion. Prog. Mater. Sci. 2017, 89, 92–193. [Google Scholar] [CrossRef]
  17. Phillips, R.C.; Kish, J.R. Nature of Surface Film on Matrix Phase of Mg Alloy AZ80 Formed in Water. Corrosion 2013, 69, 813–820. [Google Scholar] [CrossRef]
  18. Pardo, A.; Merino, M.C.; Coy, A.E.; Arrabal, R.; Viejo, F.; Matykina, E. Corrosion behavior of magnesium/aluminum alloys in 3.5wt.% NaCl. Corros. Sci. 2008, 50, 823–834. [Google Scholar] [CrossRef]
  19. Nordlien, J.H.; Nisancioglu, K.; Ono, S.; Masuko, N. Morphology and Structure of Oxide Films Formed on MgAl Alloys by Exposure to Air and Water. J. Electrochem. Soc. 1996, 143, 2564–2572. [Google Scholar] [CrossRef]
  20. Cui, Z.Y.; Ge, F.; Lin, Y.; Wang, L.W.; Lei, L.; Tian, H.Y.; Yu, M.D.; Wang, X. Corrosion behavior of AZ31 magnesium alloy in the chloride solution containing ammonium nitrate. Electrochim. Acta 2018, 278, 421–437. [Google Scholar] [CrossRef]
  21. Jang, Y.; Collins, B.; Sankar, J.; Yun, Y. Effect of biologically relevant ions on the corrosion products formed on alloy AZ31B: An improved understanding of magnesium corrosion. Acta Biomater. 2013, 9, 8761–8770. [Google Scholar] [CrossRef]
  22. Liao, J.S.; Hotta, M. Corrosion products of field-exposed Mg-Al series magnesium alloys. Corros. Sci. 2016, 112, 276–288. [Google Scholar] [CrossRef]
  23. Delgado, M.G.; Garcia-Galvan, F.R.; Llorente, I.; Perez, P.; Adeva, P.; Feliu Jr, S. Influence of aluminum enrichment in the near-surface region of commercial twin-roll cast AZ31 alloys on their corrosion behavior. Corros. Sci. 2017, 123, 182–196. [Google Scholar] [CrossRef]
  24. ISO 16428, Implants for Surgery—Test Solutions and Environmental Conditions for Static and Dynamic Corrosion Tests on Implantable Materials and Medical Devices. 2005. Available online: https://www.iso.org/standard/30280.html (accessed on 5 April 2019).
  25. Johnston, S.; Shi, Z.M.; Dargusch, M.S.; Atrens, A. Influence of surface condition on the corrosion of ultra-high-purity Mg alloy wire. Corros. Sci. 2016, 108, 66–75. [Google Scholar] [CrossRef]
  26. Veleva, L.; Fernandez-Olaya, M.G.; Feliu, S. Initial stages of AZ31B magnesium alloy degradation in ringer’s solution: Interpretation of EIS, mass loss, hydrogen evolution data and scanning electron microscopy observations. Metals 2018, 8, 933. [Google Scholar] [CrossRef]
  27. Song, G.; Song, S. A possible biodegradable magnesium implant material. Adv. Eng. Mater. 2007, 9, 298–302. [Google Scholar] [CrossRef]
  28. Witte, F.; Hort, N.; Vogt, C.; Cohen, S.; Kainer, K.U.; Willumeit, R.; Feyerabend, F. Degradable biomaterials based on magnesium corrosion. Curr. Opin. Solid State Mater. Sci. 2008, 2, 63–72. [Google Scholar] [CrossRef]
  29. Song, G.; Atrens, A. Understanding magnesium corrosion—A framework for improved alloy performance. Adv. Eng. Mater. 2003, 5, 837–858. [Google Scholar] [CrossRef]
  30. Cao, M.; Liu, L.; Fan, L.; Yu, Z.F.; Li, Y.; Oguzie, E.E.; Wang, F.H. Influence of Temperature on Corrosion Behavior of 2A02 Al Alloy in Marine Atmospheric Environments. Materials 2018, 11, 235. [Google Scholar] [CrossRef]
  31. Kish, J.R.; Hu, Y.; Li, J.; Zheng, W.; McDermid, J.R. Technical note: Examination of focused ion beam-sectioned surface films formed on AM60 B Mg alloy in an aqueous saline solution. Corrosion 2012, 68, 468–474. [Google Scholar] [CrossRef]
  32. Grogan, J.A.; Leen, S.B.; McHugh, P.E. A physical corrosion model for bioabsorbable metal stents. Acta Biomater. 2014, 10, 2313–2322. [Google Scholar] [CrossRef] [Green Version]
Figure 1. BSE (Back scattered electron) images of AZ31B specimen surfaces non-exposed (a) and immersed in Ringer’s solution for 2 days (b,c) and 4 days (d,e) at 20 °C (b,d) and 37 °C (c,e).
Metals 09 00591 g001
Figure 2. (a,b) BSE images and (c,d) variations in the Al/(Al + Mg) × 100 atomic ratio with the distance, according to quantitative energy dispersive X-ray spectroscopy (EDS) analysis of cross-sections of corrosion layers formed on AZ31B specimens after immersion in Ringer’s solution at 20 °C for (a,c) 2 days and (b,d) 4 days. Scatter bands shown in (c,d) represent the standard deviation of 3 measurements.
Metals 09 00591 g002
Figure 3. (a,b) BSE images and (c,d) variations in the Al/(Al + Mg) × 100 atomic ratio with the distance, according to quantitative EDS analysis of cross-sections of corrosion layers formed on AZ31B specimens after immersion in Ringer’s solution at 37 °C for (a,c) 2 days and (b,d) 4 days. Scatter bands shown in (c,d) represent the standard deviation of 3 measurements.
Metals 09 00591 g003
Figure 4. (a) BSE image of the cross-section of a pit formed on the AZ31B specimen after immersion in Ringer’s solution at 37 °C for 4 d. (b) Variations in (b) the Al/(Al + Mg) × 100 atomic ratio and (c) Cl atomic percentage with the distance according to quantitative EDS analysis.
Metals 09 00591 g004
Figure 5. Optical microscopy images of cross-sections of AZ31B specimens after immersion in Ringer’s solution for 4 days: at 20 °C (a) and (b) at 37 °C.
Metals 09 00591 g005
Figure 6. 3D analysis of pits in AZ31B specimen surfaces immersed in Ringer’s solution for 4 days, after removal of the corrosion products: at (a) 20 °C and (b) 37 °C.
Metals 09 00591 g006
Figure 7. Low-angle XRD patterns of AZ31B specimens after immersion in Ringer’s solution at 20 °C and 37 °C, for 2 days and 4 days.
Metals 09 00591 g007
Figure 8. Variations in corrosion of AZ31B specimens over 4 days of immersion in Ringer’s solution, as a function of temperature: (a) Hydrogen evolution volume; (b) corresponding corrosion rates, PH.
Metals 09 00591 g008
Figure 9. Variations in corrosion rates (mm·y−1) of AZ31B specimens as a function of temperature over 4 days of immersion in Ringer’s solution, obtained from mass loss measurements.
Metals 09 00591 g009
Figure 10. Nyquist plots of AZ31B specimens immersed for 1 h, 1 day, and 4 days in Ringer’s solution at 20 °C and 37 °C.
Metals 09 00591 g010
Figure 11. The equivalent circuit used for fitting experimental electrochemical impedance spectroscopy (EIS) plots of AZ31B specimens immersed in Ringer’s solution at 20 °C and 37 °C.
Metals 09 00591 g011
Figure 12. Variations in charge transfer resistance (Rt) values as a function of immersion time, obtained from fitting of the EIS plots of AZ31B specimens immersed in Ringer’s solution at 20 °C and 37 °C.
Metals 09 00591 g012
Table 1. Chemical composition (in wt.%) of AZ31B Mg alloy (X-ray fluorescence analysis).
ElementMgAlZnMn
wt%95.83.01.00.2
Table 2. EDS atomic composition of cross-sections of corrosion layers formed on AZ31B specimens after immersion for 2 days in Ringer’s solution at 20 °C and 37 °C. Average values from 10 spectra are shown.
Exposure TemperatureO (at.%)Mg (at.%)Al (at.%)Cl (at.%)Zn (at.%)
20 °C64 ± 433 ± 42.3 ± 0.20.0 ± 0.10.2 ± 0.2
37 °C47 ± 239 ± 34.2 ± 0.68.1 ± 11.8 ± 0.4
Table 3. Average size of corrosion pits formed in AZ31B specimen surfaces after immersion in Ringer’s solution for 4 days at 20 °C and 37 °C. Average values from 4 different areas are shown.
TemperatureAverage Pit Depth (µm)Average Pit Width (µm)
20 °C105 ± 57256 ± 45
37 °C470 ± 3251857 ± 405

