Abstract
Due to absence of any supporting die, the free surfaces in incremental sheet forming (ISF) experience uneven deformation. This results in rough surfaces, possibly leading to the reduced service life of components. Therefore, it is necessary to analyze and quantify the effects of the application of strain on the free-surface roughness. Moreover, in order to control roughness, both on the free surface and the opposite contact surface, the nature of correlation between the two types of roughnesses needs to be identified by classifying the significance of different process conditions. The present work is a fundamental study to address these points. A series of specimens are produced by subjecting a metallic sheet to a range of ISF strains (13% to 98%). These specimens are then subjected to a number of characterization tests, namely roughness, uniaxial tension, and residual stress tests. The results reveal that the mean free-surface roughness increases non-linearly as the normal strain (stretching + bending) on the free surface increases (where strain state on the surface is as follows: ɛ1 = 0, ɛ2 > 0, γmax = ɛ2 and 1 and 2 are principal directions). The roughness also increases, although linearly, with the post-forming sheet strength, residual stress, and forming force, thereby showing that strain hardening has a direct influence on the roughness in a way that sheet strengthening is achieved at the cost of surface quality. The surface morphology reveals that the free surfaces contained orange peel, slip lines, and micro-voids, with density increasing with strain application, thus indicating the possible influence of tensile stresses on free surface deformation and roughening at an increasing degree with strain. Further analysis of roughness results discloses that the free-surface roughness and the contact-surface roughness are inversely related, because the responses of the two to ISF processing were mutually exclusive. Based on the obtained results, future research directions are also discussed.
1. Introduction
Incremental sheet forming (ISF) is an advanced sheet forming process economically suitable for producing small-scaled batches for aerospace (e.g., noses and cones), biomedical (e.g., customized implants like human leg and skull), and automotive (e.g., car body panels and flanges) parts [1,2,3]. The forming tool in this process traverses the peripherally clamped sheet in an incremental fashion to produce a 3D geometry. One surface of the sheet makes contact with the tool (called the contact surface) while the opposite surface does not make any contact and remains free (regarded as a free surface).
Due to absence of back support, the free surfaces in metal forming endure uneven deformation, resulting in the production of rough components. This free-surface roughness consequently promotes strain localization and leads to the premature failure of components during service [4,5]. Therefore, the production of smoother surfaces has been a matter of concern for the industrial and research community [6,7,8,9].
The surface roughness in the innovative ISF process has been given considerable attention. However, most of the works have been focused on analyzing the roughness of contact surfaces [10,11,12,13,14,15,16]. Limited efforts have been spent on understanding the roughening behavior of the free surface (s). In this regard, Hamilton showed that the free-surface roughness of an aluminum sheet is controlled by a shape factor [17]. Moreover, the equivalent roughness reduces with increasing the shape factor.
Past studies on traditional forming processes have revealed that the value of forming strain (s) applied on a sheet has a significant effect on the free-surface roughness and, further, the degree of this effect depends on the type of forming process [6,7,8,9]. The free surface in ISF experiences localized stretching and bending loads [18], as a result of which tensile stresses are imparted on the surface, potentially inducing defects (e.g. voids, orange peel, etc.) in the surface. These defects can adversely influence the texture and roughness of the surface. Moreover, the density of defects will increase with the strain value, consequently severing the roughness. As the roughness affects the service performance of components, it is imperative to know how, if any, the strain magnitude affects the roughness and surface defects.
Besides affecting the component life, the roughness also influences strain localization and, thus, the formability of a component. Therefore, it has been a worthy exercise to incorporate information from strain roughness relation (s) into deformation models in order to precisely model the process and sheet failure [4,5]. For this reason, the nature of the relationship between the ISF strain and free-surface roughness also needs to be known to be helpful later in process modeling. The literature published on the traditional forming processes points out that the plastic deformation also affects many other quantities, like post-forming sheet strength and residual stress [6,19,20,21]. Knowing the correlations between these quantities and ISF-induced free-surface roughness can further deepen the process understanding.
From the service life and aesthetics viewpoint, it is important to control the roughness on both free and contact surfaces. For this purpose, it is necessary to identify how the roughness values on the two surfaces are correlated. Furthermore, the process conditions that control the roughness should be identified to clarify if the influential parameters and the nature of their effects are identical or different for the two surfaces.
In order to realize their enhanced performance, the laminates of different metals are joined together (regarded as a composite sheet) for specific applications. As this trend is gaining increasing popularity, a composite sheet metal is employed as an experimental material in the present study. The particular composite chosen is Cu/Steel/Cu, as it has a number of applications in the automotive (e.g., radiator), electronics (e.g., stampings), defense (e.g., bullets), and nuclear (e.g., reactor) areas, wherein its performance (i.e., service life) is likely to be affected by the surface roughness [22].
In the present study, systematic investigations are performed to address the aforementioned points. The sheet is deformed over a range of strains (13% to 98%). A series of tests, namely roughness, residual stress, and tension tests, are performed on the formed samples. The correlations between the free-surface roughness and other mentioned quantities are drawn in order to identify the nature of and to quantify their effects on the roughness. The morphology of the surfaces is observed using a scanning electron microscope and an optical microscope. From the collected data, the free-surface roughness and the contact-surface roughness are found to be in mutual opposition. Therefore, efforts are also spent to identify the effects of various process conditions for the two types of roughnesses, with the objective to simultaneously control roughness both on the free and contact surfaces. The presented results, although basic in nature, prove beneficial to understanding free-surface roughening and process mechanics and also provide a guideline to control two roughnesses simultaneously.
2. Experimental Methodology
2.1. Experiments
The material employed in this study was a tri-layered sheet. This sheet was fabricated through cold rolling of Cu (yield strength of 110 MPa) and DDQ Steel (yield strength of 136 MPa) laminates with the stacking sequence of Cu/Steel/Cu. The final thickness of the layered sheet was 1 mm, wherein the thickness of each Cu layer was about 0.05 mm. The mean roughness of the rolled sheet was about 0.97 µm, as measured across the rolling direction. The composition, structure, and properties of the as received layered sheet are shown in Figure 1.
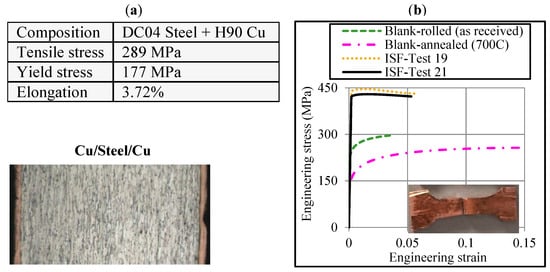
Figure 1.
Test material: (a) Composition and structure and (b) stress-strain curves.
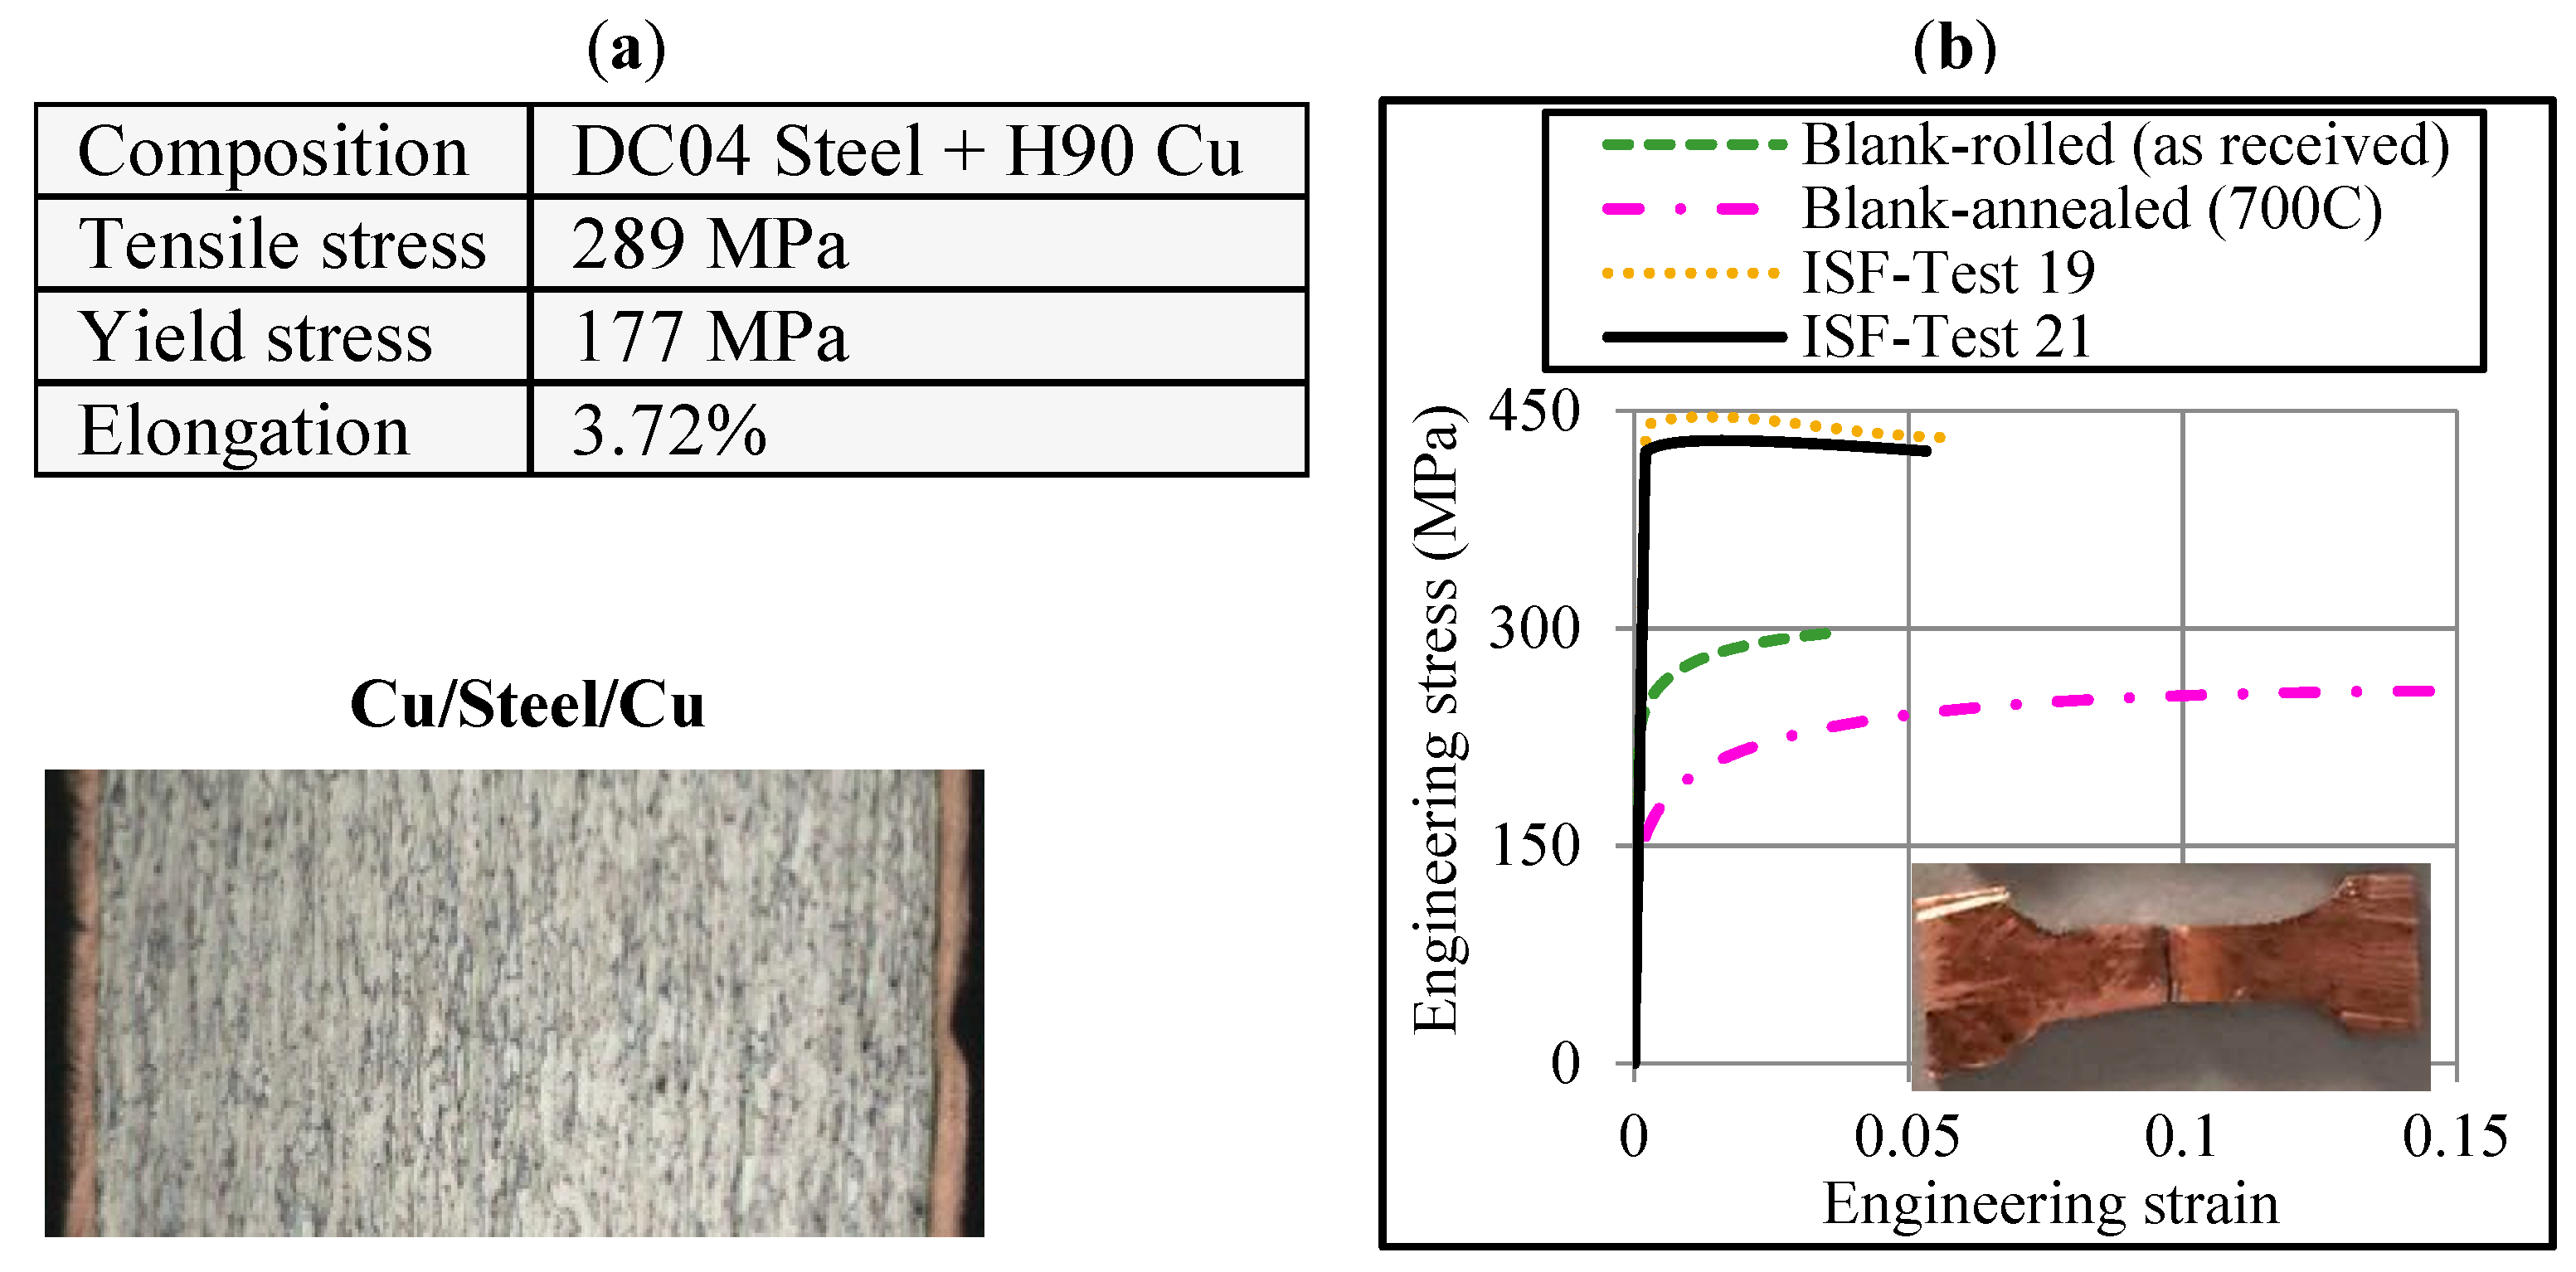
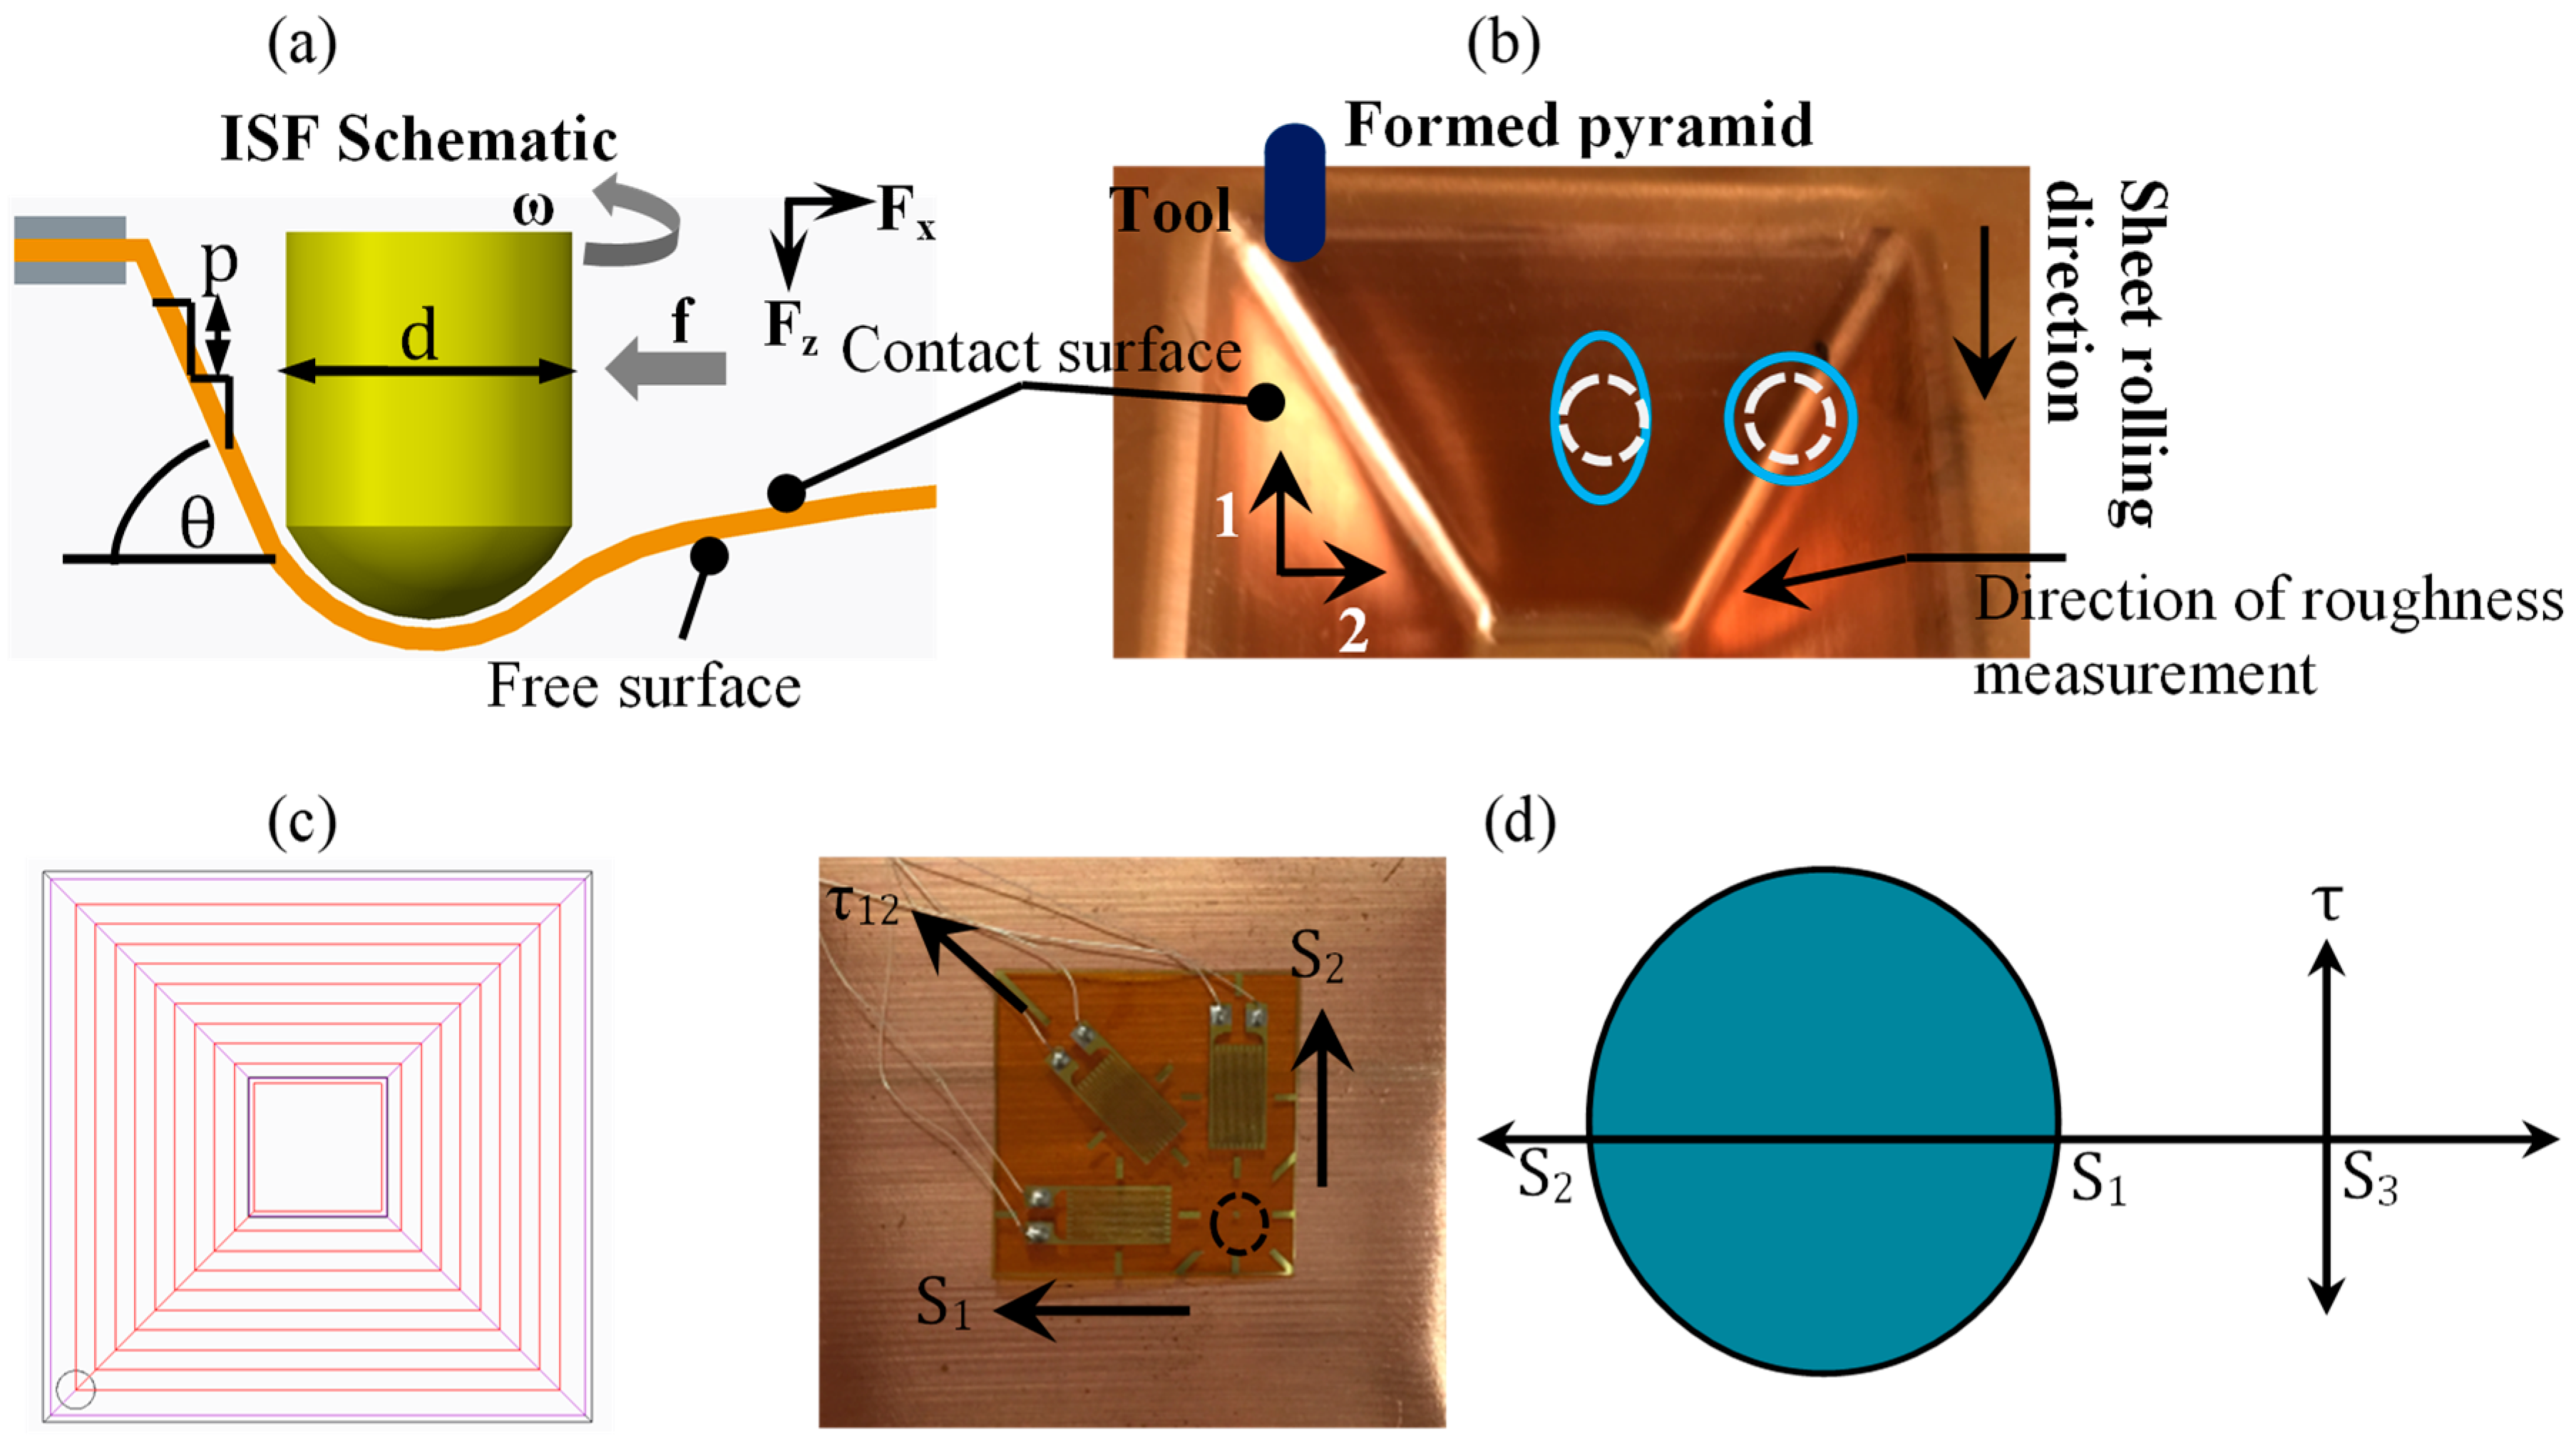
Figure 2 shows the schematic of ISF process with different parameters and definitions of free and contact surfaces. The plastic straining in ISF mainly depends on some parameters, such as the tool diameter (d), forming angle (θ), and step size (p) [3]. The tool rotation (ω), feed rate (f), and initial tensile stress of the material (σ) affect the forming force, heat generation, and work hardening [10,11,13] and, thus, these might also influence the surface deformation and, hence, the free-surface roughness. Moreover, literature reports them as important parameters for having influence on the roughening of the contact surfaces, as they can affect friction at the tool/sheet interface [10,11,12,13,14,15]. Therefore, it was considered mandatory to take these parameters into account in order to adequately compare the two types of roughnesses, one of the objectives mentioned earlier.

Figure 2.
Forming and stress measurement: (a) ISF Schematic, (b) a formed geometry with the state of strain, (c) the tool path, and (d) the measurement of residual stress along with the state of residual stress.
The design of experiments (DoE) is a statistical approach that has been frequently applied in sheet metal forming to analyze the process parameters effects and for finding optimum process conditions for single or multiple objectives [23,24]. This approach was therefore applied for the present investigations. The test plan was formulated adopting the D-Optimal Response Surface Method [25] and using the Design Expert-10 statistical package. The reason for choosing said approach is that it can address two of the present roughness related objectives, as follows: Quantification of strain effects and classification of the individual parameter’s effects. Table 1 shows the test plan. There are 38 runs, whereby each of the process parameters is varied over five levels and five replicates are incorporated to consider the repeatability (or noise effect). In this plan, the high limits of the forming angle, tool diameter, and step size were set according to the sheet formability. The high limits of the feed rate and spindle rotation were opted according to the machine specifications. The tensile stress of the as-received rolled sheet was set as the high limit of the initial sheet stress. To set four other levels of the stress, the sheet was annealed over a range of temperatures (i.e., 233 °C, 350 °C, 466 °C, and 700 °C). The annealing was carried out by holding the sheet blank for 2 h in the Carbolite furnace. The maximum temperature to which the sheet was exposed was 700 °C, as the Cu layer got delaminated from the steel on further increases in the temperature. Thus, in this study, the tensile stress of the unformed sheet ranged from 255 MPa to 289 MPa, as obtained in uniaxial tests, while the other related levels can be seen in Table 1.

Table 1.
The experimental plan and results.
The robustness of experimental design (Table 1) was evaluated by examining various indicators such as the degree of freedom (DoF) and variance inflation factor (VIF). It was ensured that the minimum DoF for pure error was 4 and that for lack-of-fit was 3 (6 in current design) [25]. The orthogonality of the design was tested by examining the value of VIF. A VIF value > 10 indicates that the parameter/term effects are slightly affected by multi-collinearity, thereby pointing towards a concern [25]. The serious issue occurs when VIF > 100. In the present design, its value ranged from 1.08 to 1.37 for free-surface roughness (primary response) and 1.14 to 2.6 for contact-surface roughness (secondary response). These VIF values suggest that the effects of the terms/parameters were calculated independently, to a reasonable degree, without being seriously affected by collinearity.
A pyramid with a base size of 110 mm × 110 mm and a slant length of at least 25 mm was employed as the test geometry (Figure 2b). This shape, except on the corners, dominantly experiences plane-strain stretching during ISF, as reported by several authors and reviewed in Jeswiet et al. [3]. To produce this shape, the sheet blank (140 mm × 140 mm) was clamped onto a rig and the forming was performed on a CNC milling machine using a spherical-end Steel tool of 55 HRC hardness. Prior to employing, the forming tool was polished with the diamond paste in order to prevent the tool roughness effect, if any, on the sheet surface. To reduce fiction at the tool/sheet interface, mineral oil was employed as a lubricant. The geometry and the tool path for forming were generated in NX CAD/CAM software. The distance between each two contours of the tool path was fixed (i.e., ≈step size) as shown in Figure 2c.
The force component, Fz, is a major deformation force that acts along a normal to the sheet plane. This force component is responsible for stretching the sheet in a downward direction [26,27]. To know if this force has any effect on roughening of the free surface, a load cell was placed on the forming rig for measurement.
A surface subjected to ISF may experience straining in two principal directions, namely transverse and longitudinal, denoted as 1 and 2, respectively, and defined in Figure 2b. Straining in the transverse direction occurs only when the curvature radius of the surface is small. The corner surface of the pyramid thus experiences biaxial straining (i.e., ɛ1 > 0, ɛ2 > 0), while the flat surface experiences straining only in single direction (i.e., ɛ1 = 0, ɛ2 > 0) [3]. Since the latter state has been acknowledged as a dominant sate of strain in ISF, the present study performs an investigation(s) considering the latter scenario, as follows: ɛ1 = 0, ɛ2 > 0, ɛ2 = −ɛ3. The roughness and other quantities (e.g., thickness, stress, and force) were, therefore, measured on the flat side of the pyramid.
The roughness tests on the flat surfaces of formed pyramids were performed utilizing a Perthometer and employing a stylus travel of 6 mm. The roughness was measured in the longitudinal direction (i.e., 2 as defined earlier) because, due to experiencing strain, this direction had greater roughness than the transverse direction. The arithmetic mean of the roughness, which has been reported to have a consistent relation with the surface deformation in the traditional forming processes [4,5,6,7,8,9], was determined using the following relation:
where Ra is the arithmetic mean roughness, Y is the individual measured peak height, and L is the sampling length.
The post-forming tensile properties of the sheet were determined by performing uniaxial tension tests following the ASTM E8-M standard. The tensile samples from the flat sides of pyramids were cut using a wire EDM and by maintaining the long axis along the longitudinal direction (i.e., 2 as defined earlier). To prevent heat effects of wire cutting on metallurgical properties, the cutting feed was kept low (i.e., 15 mm/min) and the cutting was also performed in the presence of cutting oil. Moreover, the cut edges were ground with sand paper before performing the tensile test on the sample. The samples were stretched to fracture on the Instron universal testing machine at a strain rate of 2 mm/min. As evidence, two representative tensile curves from the formed sheet (i.e., Test 19 and Test 21), along with those of unformed sheet, are presented in Figure 1b.
To determine residual stresses in the formed samples, hole drill tests were performed following the ASTM E837-13a standard. For this purpose, a wide strip (38 mm × 38 mm) was wire cut from the flat side of each formed pyramid and a strain gauge rosette composed of 3 strain gauges was attached to the contact surface using epoxy (Figure 2d). The drilling into each rosette was performed utilizing a drilling rig and a drill bit with a diameter of 0.8 mm. The strains released during drilling (for each increment of 0.05 mm) were recorded on the Juhang JH-30 data acquisition system. These strains were later converted into the corresponding in-plane stresses, assuming a plane state of stress, as shown in Figure 2d, and using the appropriate relations as explained elsewhere [28]. The in-plane stresses measured include S1, S2, and τ12, where S1 and S2 are the principal stresses and τ12 is the shear stress. However, τ12, being very small in magnitude (i.e., 5 MPa on average), was not considered for the present roughness analysis.
The morphology of the unformed and formed surfaces was observed using the Hitachi 3400 Scanning Electron Microscope (SEM, Hitachi, Tokyo, Japan) and the CMM- 22E Optical Microscope. For this purpose, the samples were cut into 10 mm × 10 mm sizes, using a wire EDM machine, and were cleaned with alcohol.
In order to consider variation in the experimental results, a number of replicates were included in the test plan (Table 1). Based on the results, the standard deviations were calculated, as shown in Table 2.
Table 2.
Maximum standard deviations in various experimental results.
2.2. Strain Measurement
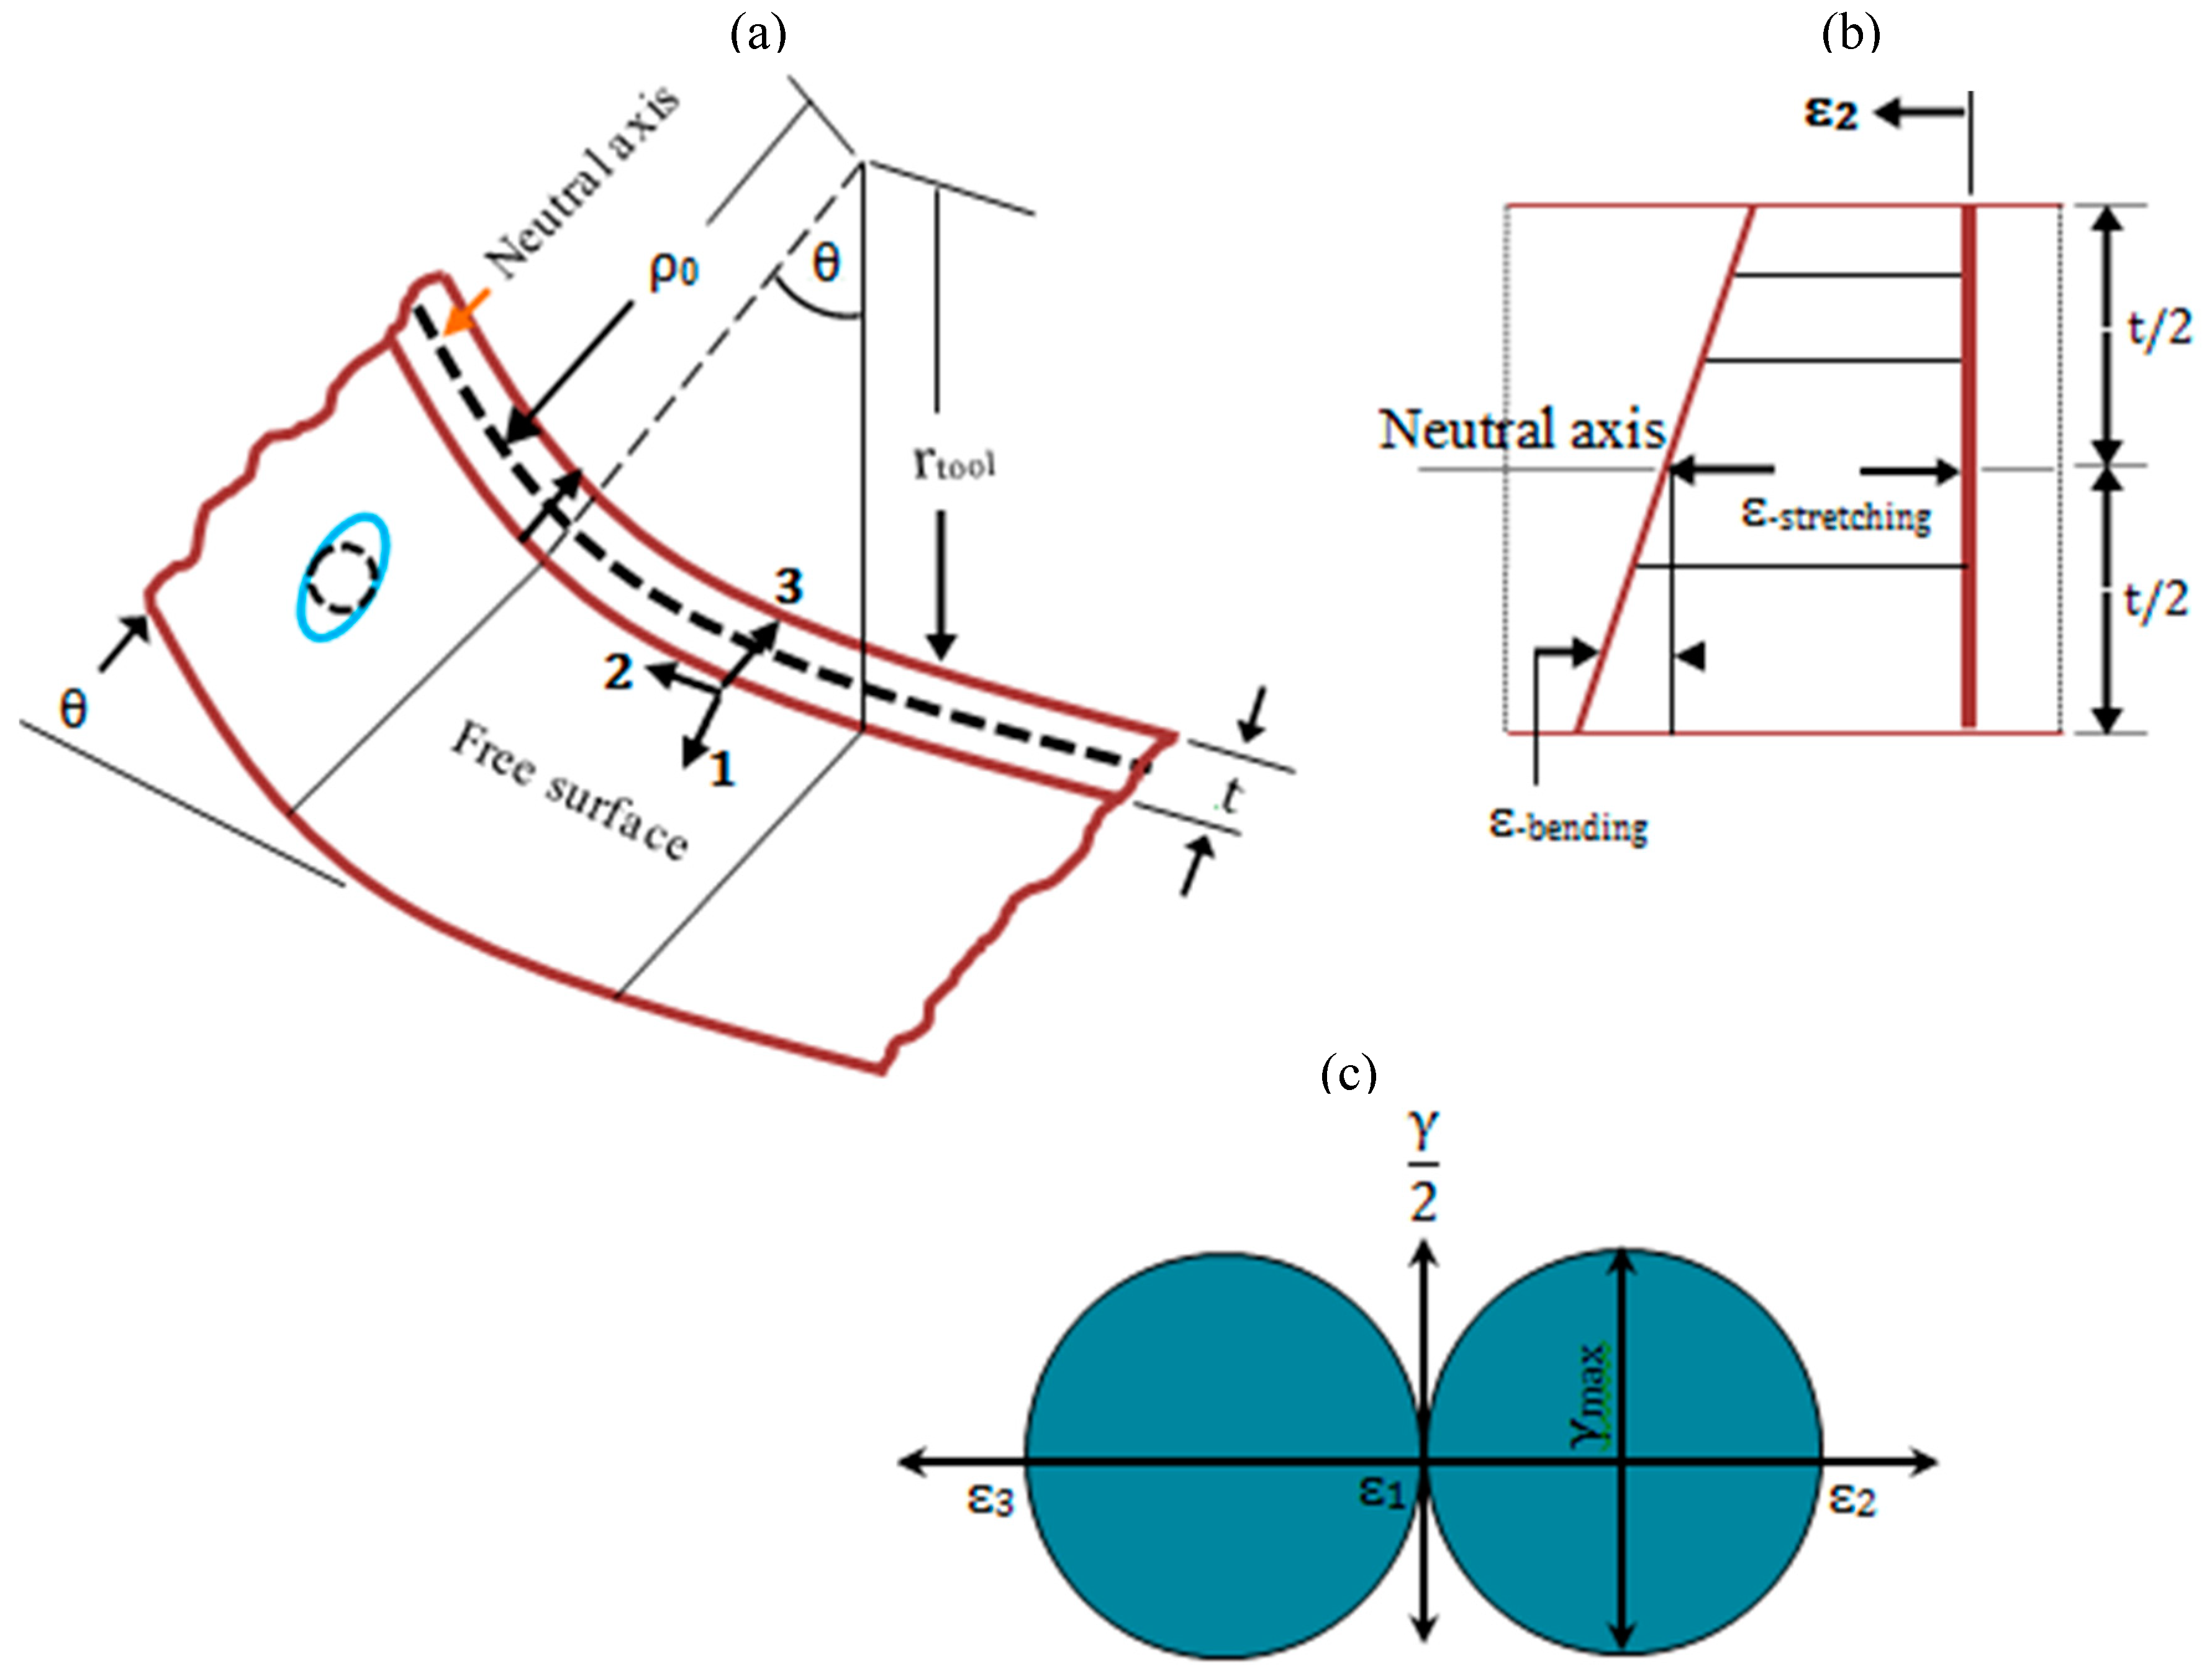
A sheet material in ISF endures combined bending and stretching loads [18]. Figure 3 shows a schematic of a deformed section of a flat side of the pyramid, along with strain state on the free surface and through-thickness distribution of a normal strain, ɛ2. Due to these loads, the strain, ɛ2, can be obtained as detailed in Fang et al. [18] and is given as follows:
where

Figure 3.
Schematic of a flat section of the pyramid deformed under combined bending and stretching loads in ISF: (a) Deformed section, (b) through-thickness distribution of normal strain, and (c) the state of strain on the flat section of pyramid.
- ɛ2 is the principal surface strain in longitudinal direction;
- ɛ3 is the principal thickness strain;
- is the curvature radius of neutral surface;
- is the arbitrary curvature radius of section ranging from rtool to (rtool + t);
- to is the thickness of unformed sheet;
- t is the thickness of formed sheet.
The above Equation (2) estimates longitudinal surface strain with an arbitrary radius, The maximum shear strain, , on the free surface can be given by the Mohr’s circle, as shown in Figure 3c and given as follows:
The above Equation (3) follows that the maximum shear strain and the longitudinal principal strain are equal in magnitude, although these act on two different axes 45° apart. Therefore, only one of these two will be used to show the influence of strain on surface roughening in ISF. Furthermore, as the strain acts on the surface, it will be regarded as applied ISF surface strain (ɛ-ISF) hereafter.
The unknown t in Equation (1) was determined doing thickness tests on the formed surfaces. A small piece was cut from each surface and was measured in thickness with a vernier caliper at an accuracy of ±0.01 mm. All other factors in Equation (1) are known values. In the current study, the ISF strain on the free surface ranged from 13% to 98%.
3. Results
3.1. Influence of ISF Strain on Free-Surface Roughness
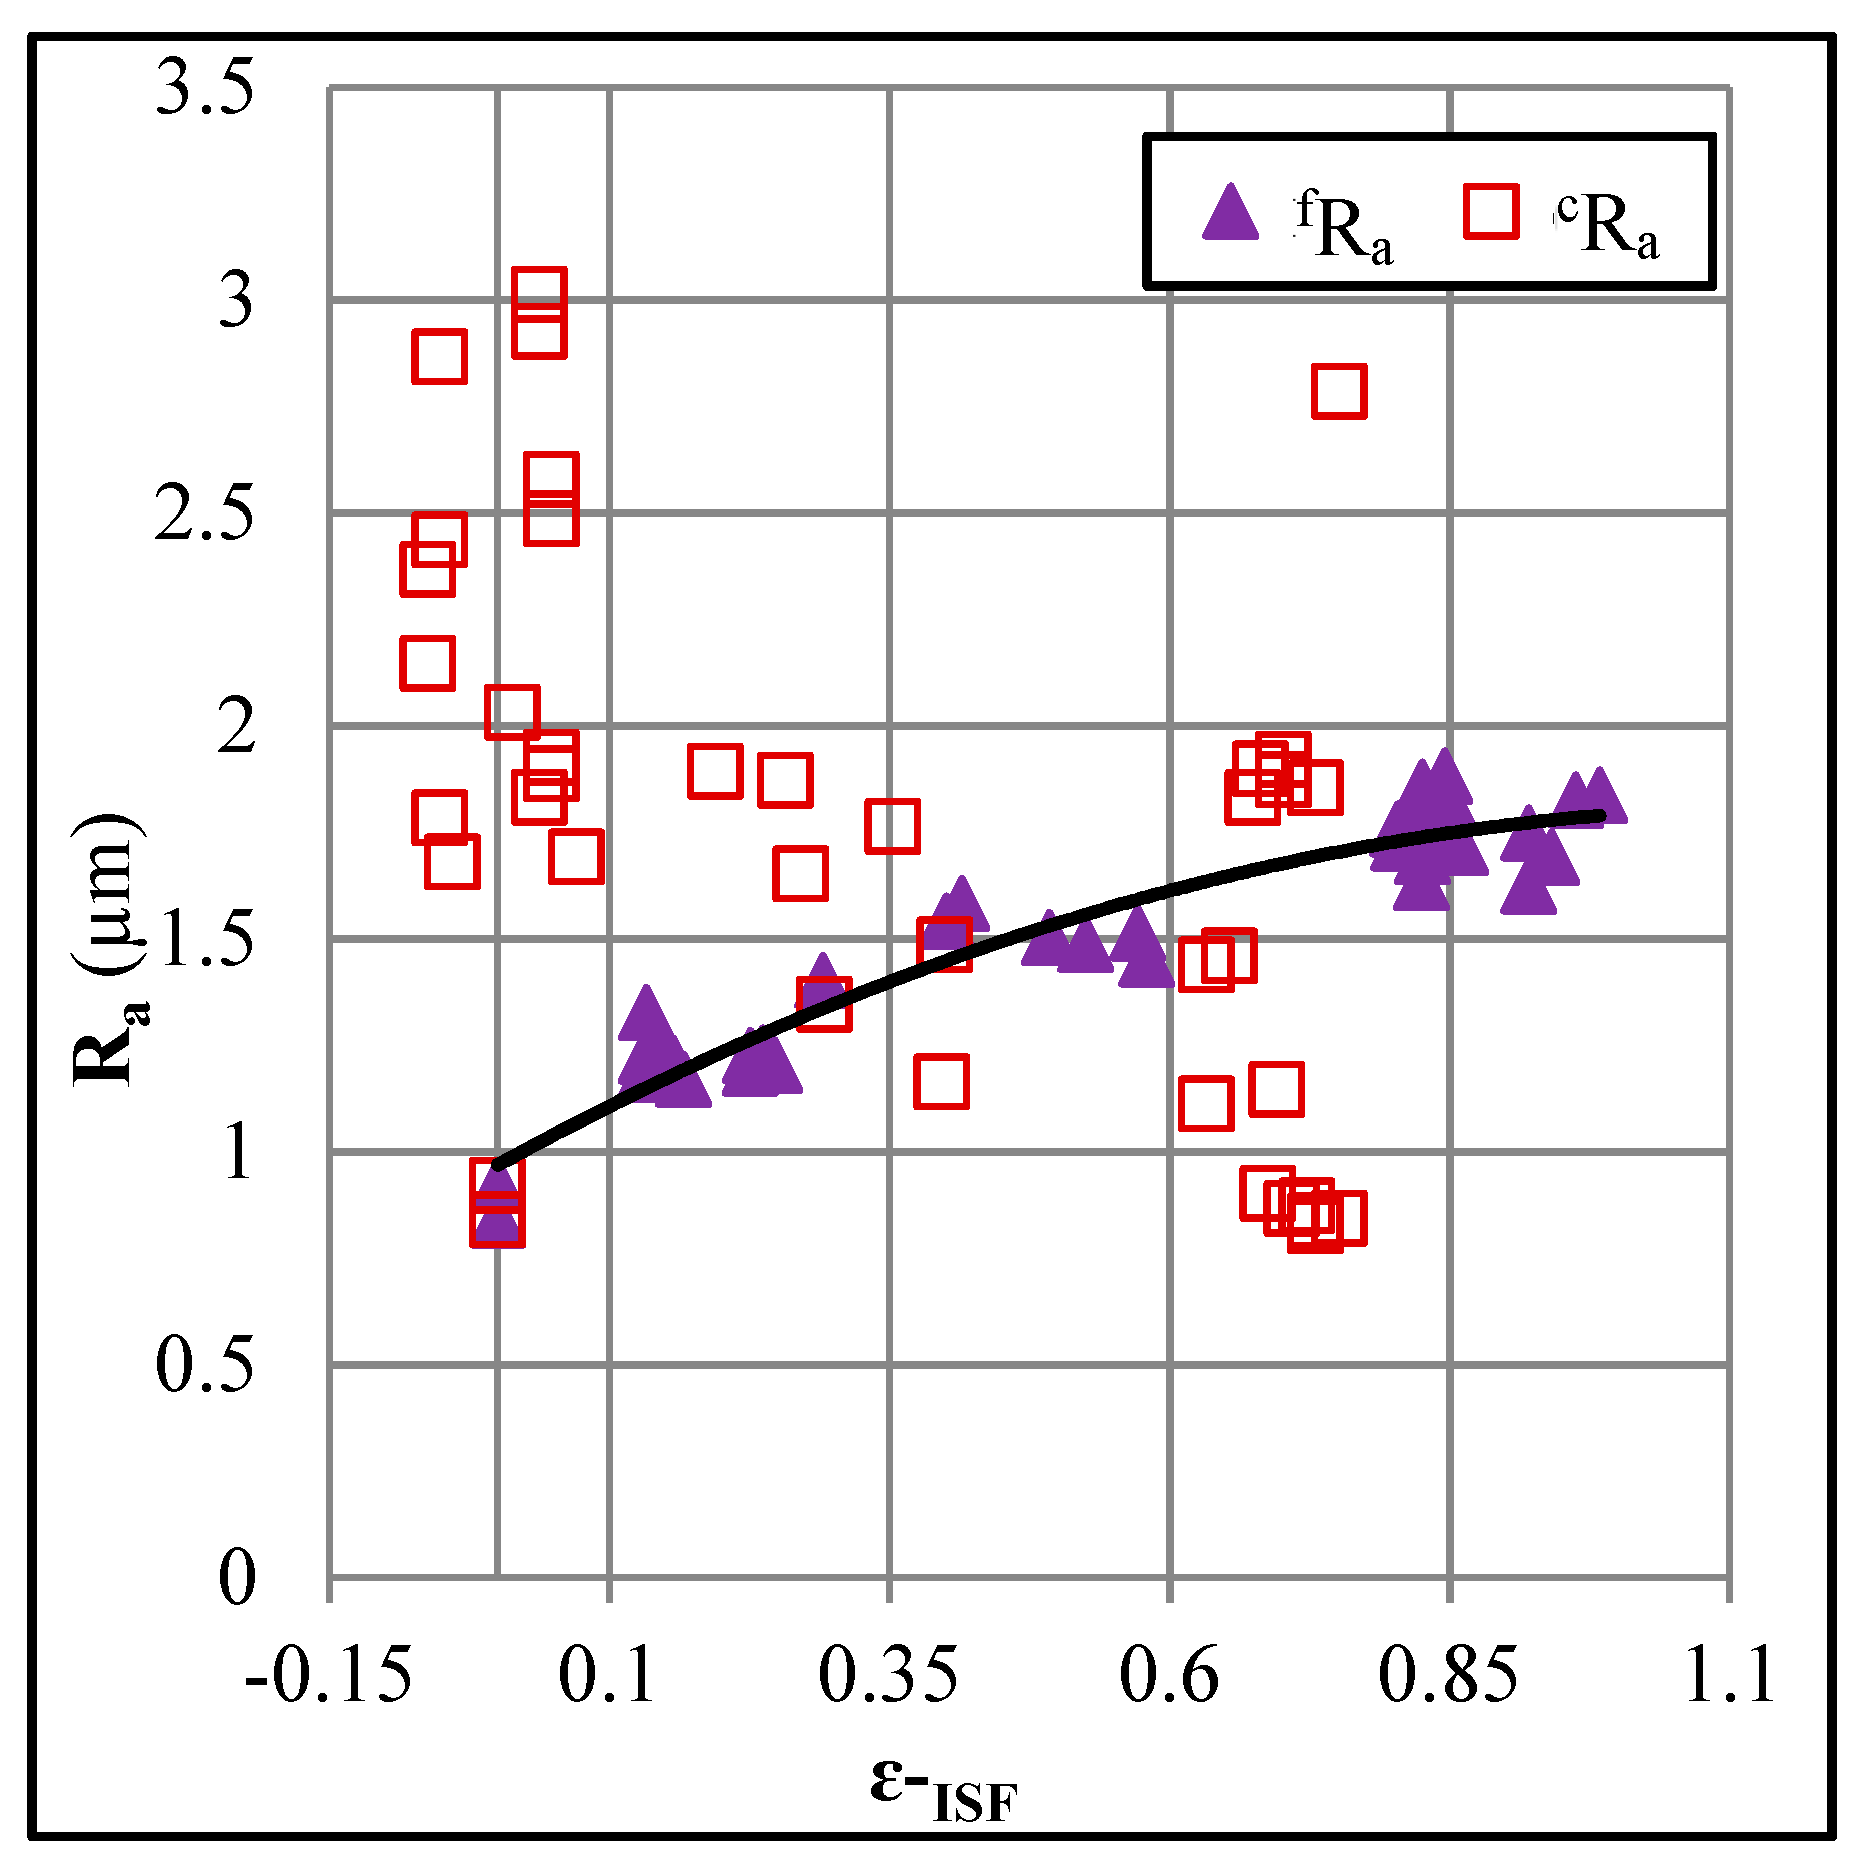
The arithmetic mean of the roughness adequately represents the effect of plastic deformation on free-surface roughening in the traditional forming processes [4,5,6,7,8,9]. Therefore, this measure was adopted in the current study. Figure 4 presents a relationship between the ISF surface strain and the mean roughness, fRa, of the free surface. As can be noticed, the mean roughness constitutes a consistent relation with the ISF strain. The value of fRa increases from 1.17 µm to 1.88 µm (about 60% increase) as the surface strain increases from 13% to 98%. The nature of correlation between the roughness and plastic strain has been a matter of debate in the metal forming processes, for it affects the modeling accuracy of a process. Some researchers claim a linear while others, depending on the type of process, claim a non-linear correlation [5,6,7,8]. In the ISF of Cu/Steel sheet, this correlation has been turned to be a non-linear, as defined by the following polynomial:
fRa = −0.62 ɛ-ISF2 + 1.45 ɛ-ISF + 0.97.
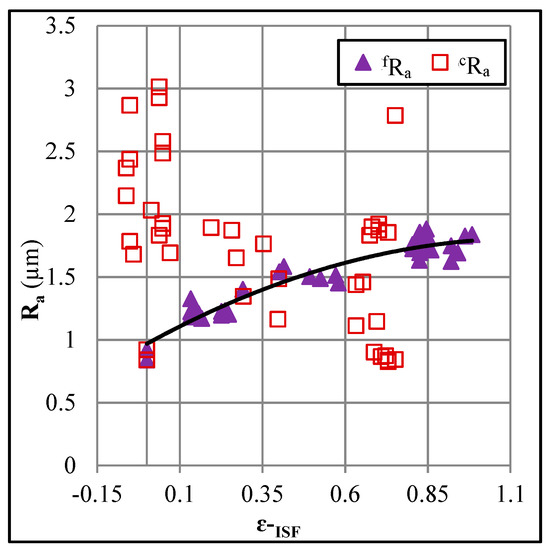
Figure 4.
Correlation between the mean roughness and ISF strain.
The R2 (correlation factor) value for the above quadratic relation is high (i.e., 92%), which means that the data points are well fitted to the fit function. Furthermore, the behavior of the roughness fRa as a quadratic function of the ISF strain is described accurately. The nature of the influence of applied strain on the free-surface roughness in ISF holds good agreement with that reported for the bending, stretching, and stretch-bending operations [4,5,6,7,8,9]. This is probably due to the reason that the ISF process has a common ground with these processes; for example, the absence of die and similarity in the deformation mechanisms that operate on the free surface (i.e., bending and stretching operate in ISF).
Quantifying the effect of ISF strain on the roughness, fRa, the application of 98% strain raises the roughness by about 109%, i.e., about 1.1% per unit strain. This roughness change, due to ISF, of Cu/Steel sheet is lower, as compared to 20% per unit strain in uni-axial stretching of AA5052 [8], and 76% per unit strain in each of stretching and tension-bending of A1100 [8,9]. This difference might be attributed to localized deformation of the ISF process in contrast to global deformation in the conventional stretching and bending processes.
Figure 5 depicts correlations between the roughness, fRa, and the post-forming yield stress of the Cu/Steel sheet. As can be seen in Figure 5a, the roughness linearly increases from 1.17 µm to 1.88 µm, with the post-forming yield stress (Y) increasing from 168 MPa to 430 MPa, thereby showing an obvious effect of strain hardening on surface roughening. This also reveals that material strengthening in ISF is achieved at the cost of surface quality and, further, for a given value of ISF strain, strength experiences a greater rise in comparison to roughness. Figure 5b presents a correlation between the roughness and % increase in Y (% ∆Y relative to parent sheet). The roughness increases from 1.17 µm to 1.88 µm as % ∆Y increases from 105% to 254%, which endorses the above finding that strain hardening influences roughening. A similar correlation was observed with the post-forming ultimate stress (% ∆U). The behavior of the roughness, fRa, as the function of the post-forming properties (U and Y) and work hardening (in terms of ∆Y and ∆U) in ISF can be described by the following linear formulas (R2 > 80%):
fRa = 404 Y – 292.4,
fRa = 307 ∆Y – 340,
fRa = 250 U + 0.5,
fRa = 94.5 ∆U + 103.7.
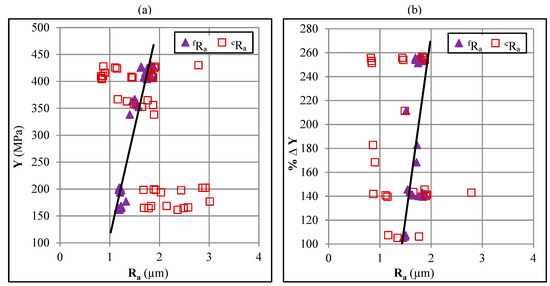
Figure 5.
Correlations between the mean roughness and post-forming yield strength: (a) Yield strength and (b) % increase in yield strength.
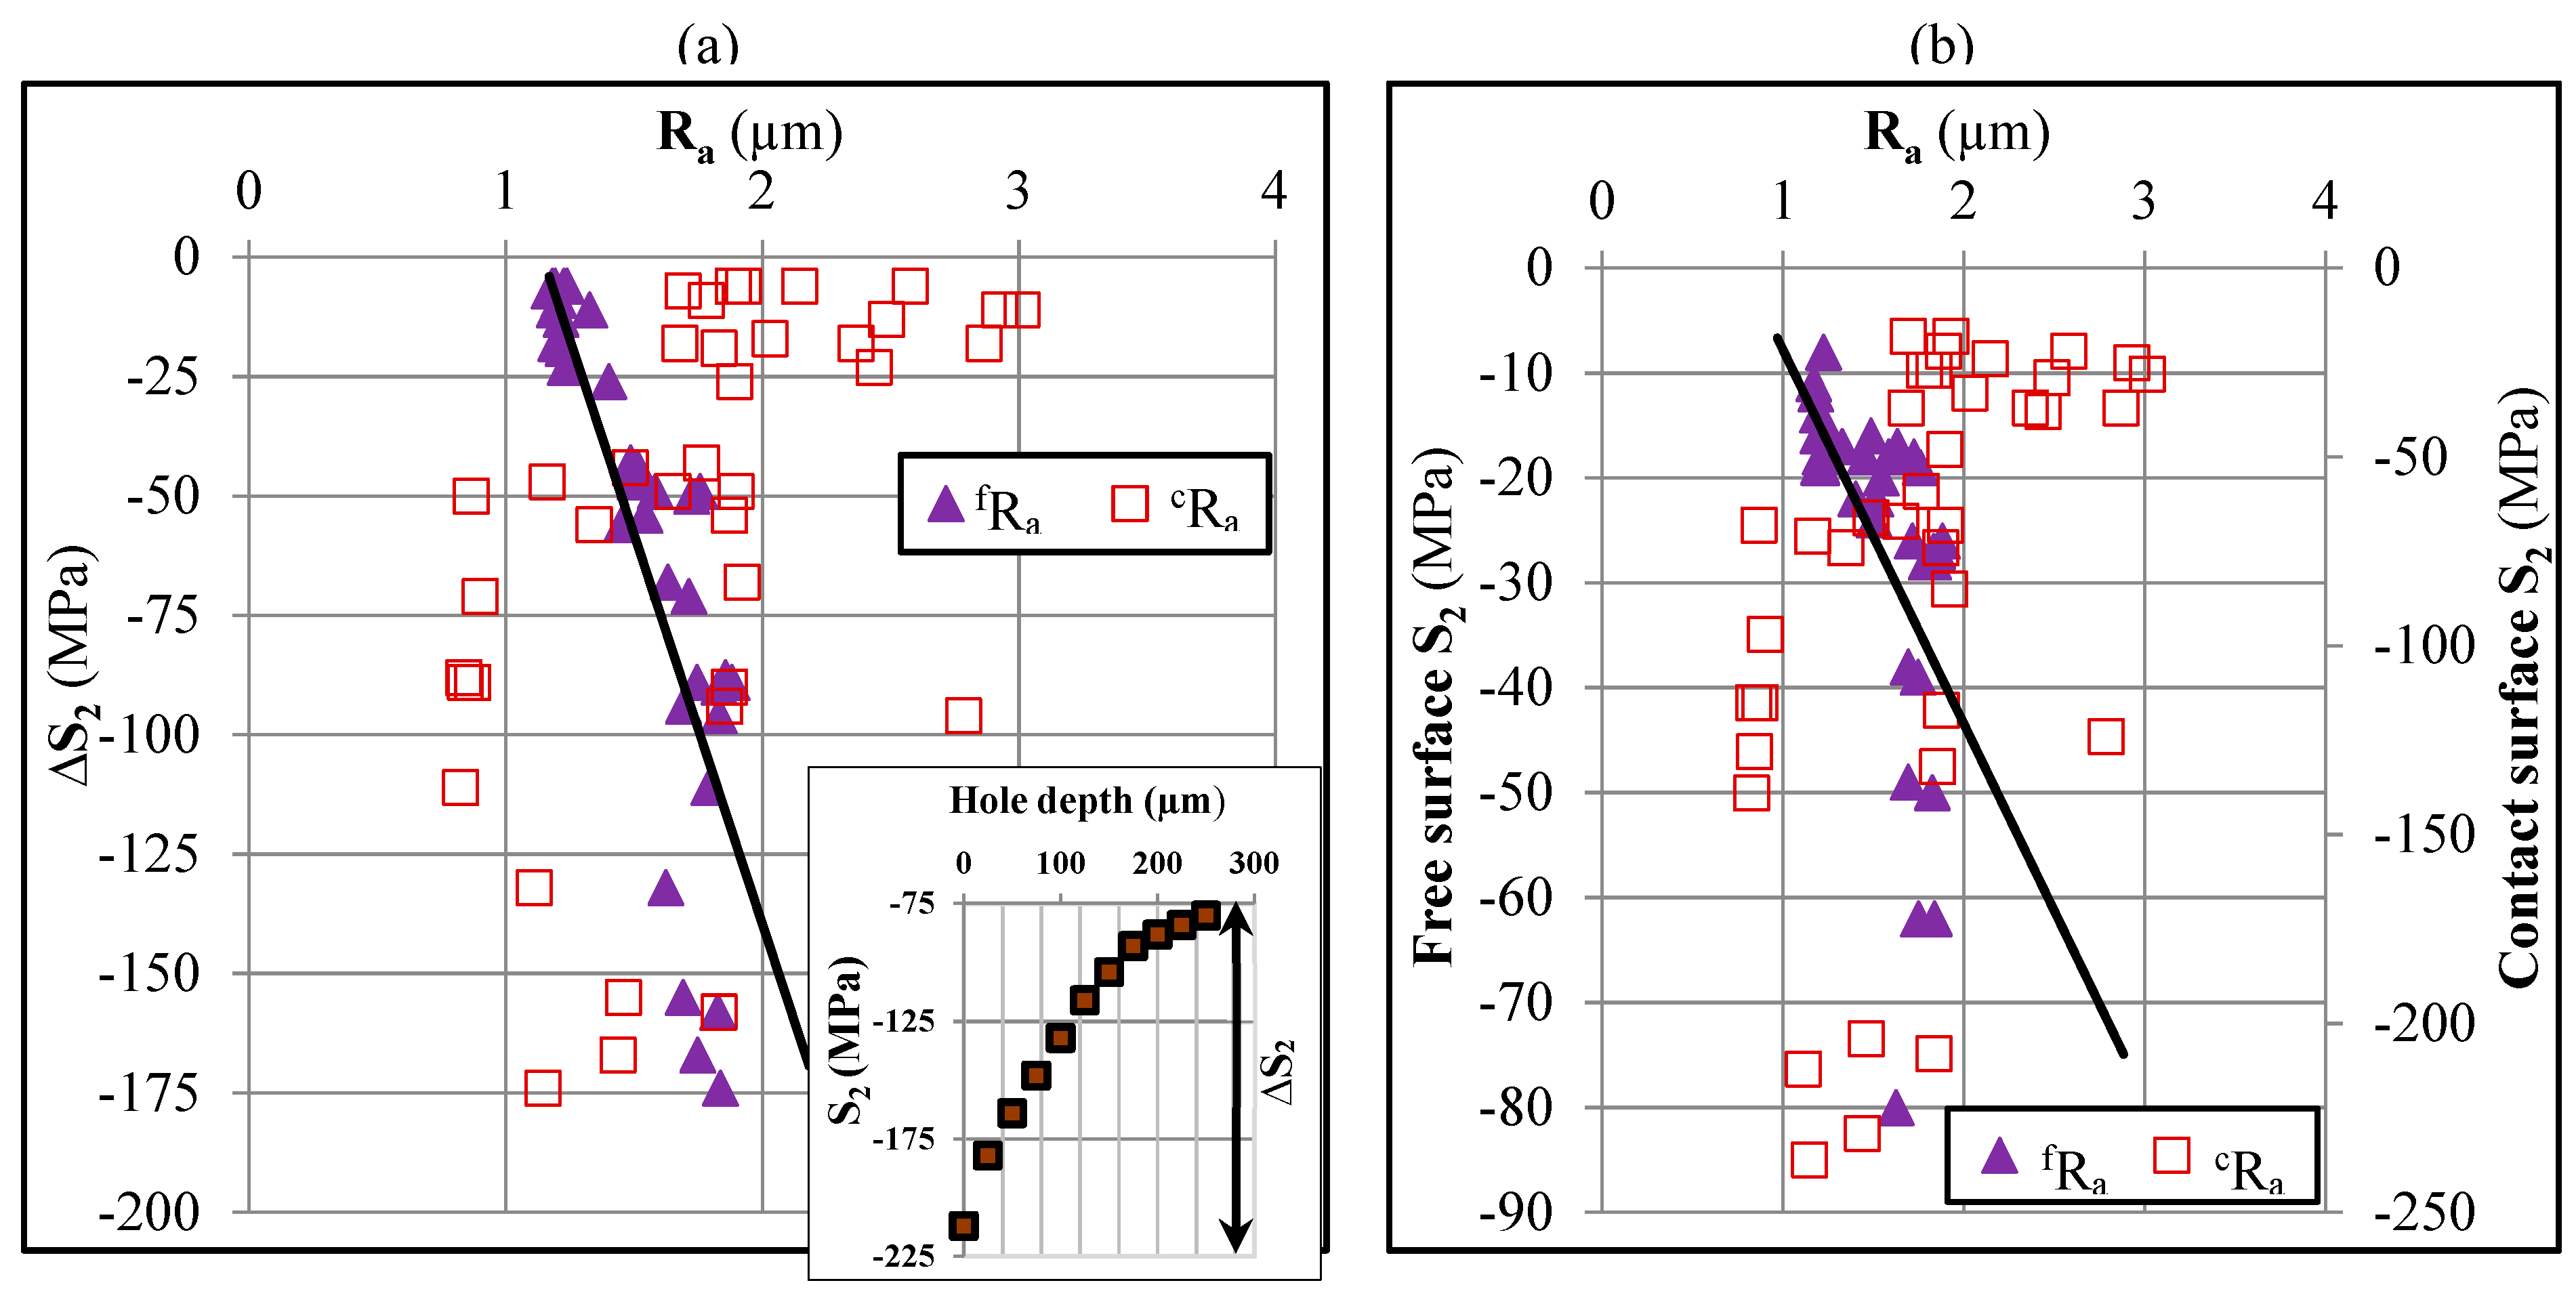
The stress and strain gradients have been reported to affect the free-surface roughness along with material strength in metal forming [21,29]. In the ISF process, besides stretching, a bending mechanism also operates and, as a result, a through-thickness stress gradient occurs [28,30]. In order to know how the stress gradient affects the free-surface roughness in ISF, the relationship between the gradient of residual stress, ∆S2 (where 2 refers to the longitudinal direction), and the roughness, fRa, was examined. The gradient refers to the difference of the two surface stresses, as illustrated with an inset in Figure 6a. A relation between the stress gradient and fRa is shown in Figure 6a. This is to observe that the roughness similarly increases with stress gradient, as it does with the post-forming sheet strength. Furthermore, an increase of 60% in roughness is accompanied by an increase of 1480% in the stress gradient, thereby pointing out that the roughening on the free surface was also influenced by bending, in addition to stretching. However, with the available data, it is not possible to isolate the two effects at present. The surface residual stress, S2 (both on free and contact surfaces), also holds a similar correlation with the roughness, i.e., roughness increases as the stress increases (Figure 6b). The stress gradient owing to better fit to the data points, however, constitutes a more consistent correlation. The behavior of the roughness, fRa, as a function of the residual stress in ISF can be defined by the following linear formulas (R2 > 80%):
fRa = 163.11 ∆S + 186.63,
fRa = −35.7 S2 + 27.9.
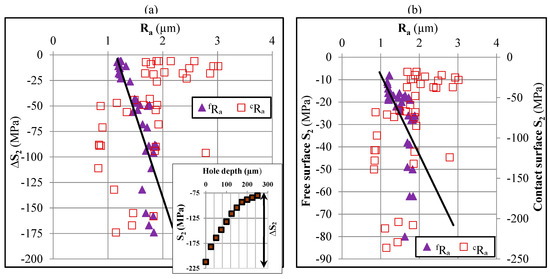
Figure 6.
Correlation between the mean roughness and in-plane residual stress: (a) Stress gradient and (b) surface stresses.
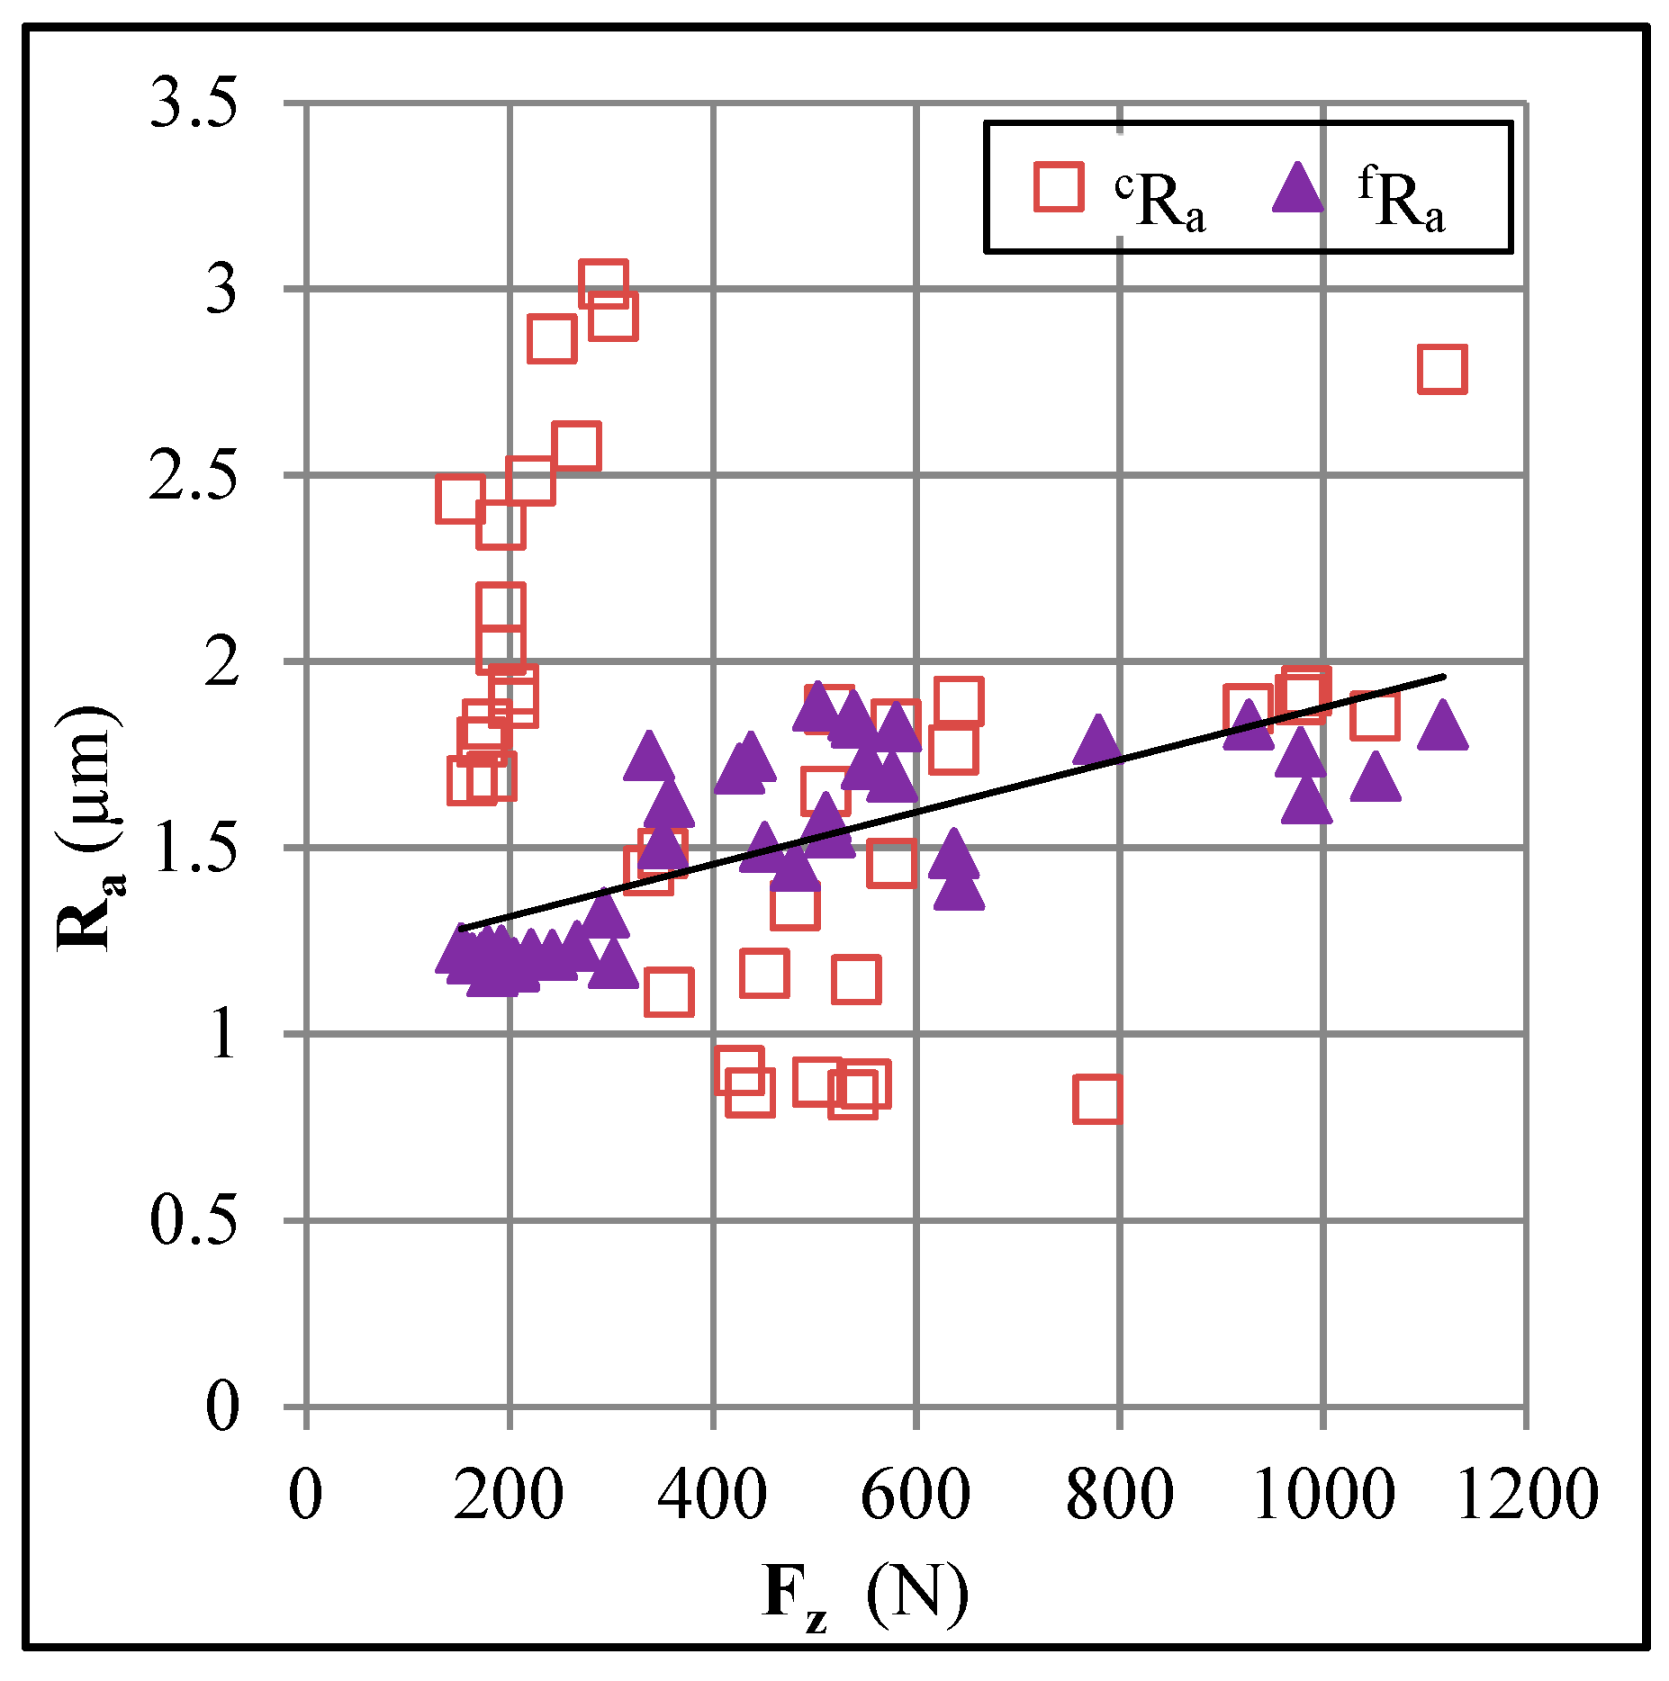
Figure 7 exhibits a relationship between the forming force, Fz, and the roughness, fRa. As expected, there is a consistent relationship between fRa and Fz, as follows: The value of fRa linearly increases as the magnitude of Fz increases. The behavior of the roughness, fRa, as a function of force, Fz, can be described by the following formula:
fRa = 0.0007 Fz + 1.18.

Figure 7.
Correlation between the mean roughness and forming force.
The R2 value (65%) of this relation is relatively low in comparison to those reported earlier. However, this value is reasonable for claiming that Fz affects the free-surface roughening in ISF. This finding is in agreement with the tension-bending operation, where it has been reported that the greater the applied force (or pressure) the greater the roughness will be [9].
In summary, according to Figure 4, Figure 5, Figure 6 and Figure 7, the nature of relationships between free-surface roughness and quantities like post-forming strength, stress gradient, and forming force are similar, thereby indicating a close correlation among these quantities and suggesting that roughening of the free surface in ISF occurred due to surface deformation. However, being local in nature, the effects on roughness in ISF are not as severe as in the traditional forming. Furthermore, an increase in roughness with strain hardening indicates that the surface deformation in ISF is accompanied by the formation of surface defects, which will be discussed in the subsequent section. In Figure 4, Figure 5, Figure 6 and Figure 7, the contact-surface roughness, cRa, is also presented, along with free-surface roughness, and it can be noticed that this roughness measure does not make any consistent relationships with any of the mentioned quantities.
These results, presented so far, can be helpful to obtain a trade-off in the roughness and mechanical properties of parts. More importantly, correlations, especially strain roughness (Equation (4)), can be incorporated into deformation models to enhance the modeling accuracy of the ISF process. Moreover, a mutual link among various quantities has been identified pointing to peculiar mechanics of the ISF process, further work on which can deepen the process understanding.
3.2. Surface Morphology
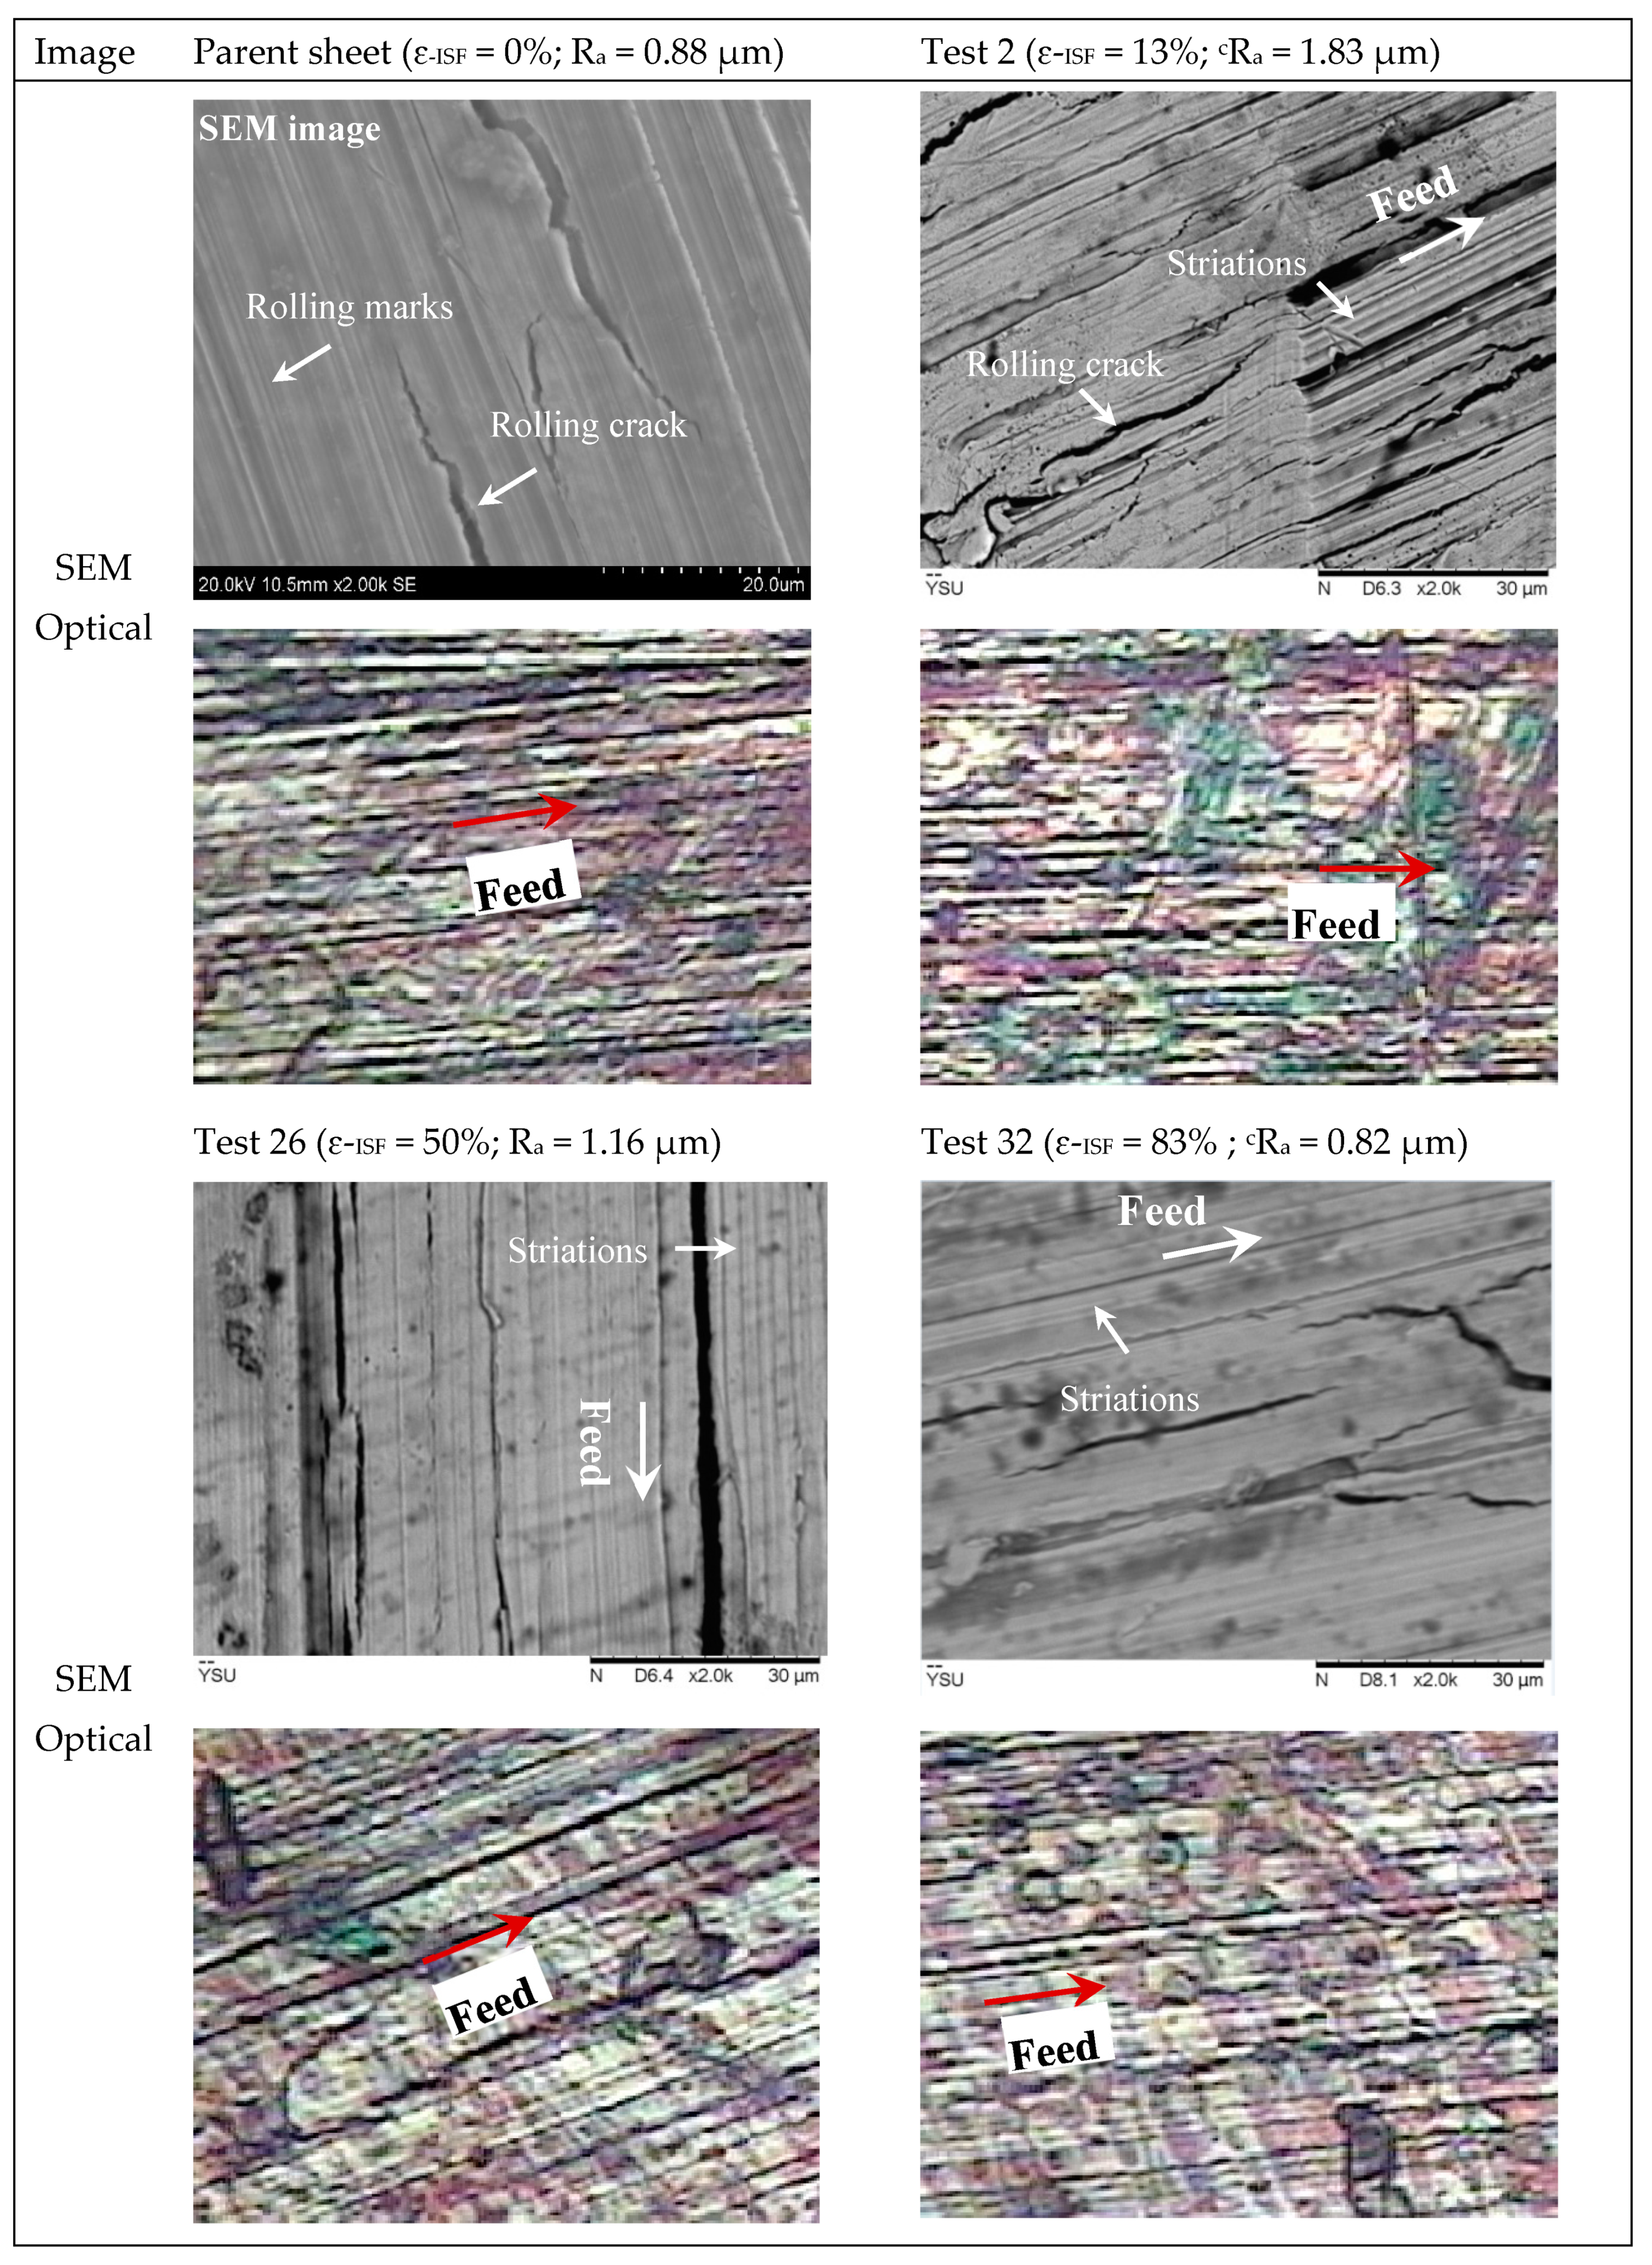
Figure 8 shows a representative set of free surface images of a formed sheet, along with those of an unformed sheet. These images were captured by observing the surfaces in the optical and SEM microscopes. From the optical and low magnification SEM images, the presence of orange peel can be observed. The high magnification SEM images show the occurrence of slip lines and micro-voids (up to 1 µm). Thus, the texture of the free surface contains orange peel, slip lines, and micro-voids. The slip bands in SEM images signify that the slip mechanism operated in random directions, leading to an uneven surface deformation, as expected. The density of various mentioned defects, along with roughness, increases (from 1.22 µm to 1.79 µm) as the ISF strain increases (from 13% to 83%), thereby endorsing an earlier point that the free-surface roughening in ISF occurred due to surface deformation and defects. The presence of voids suggests that the tensile state of stress, agreeing with the literature [3], prevailed on the free surface during ISF. Furthermore, an increase in defect density with strain explains the cause of the increase in surface roughening with strain hardening, as presented earlier in Figure 5.
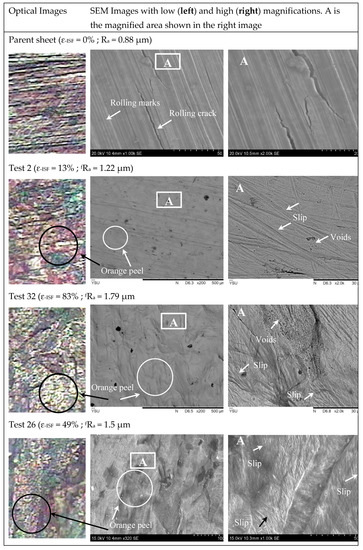
Figure 8.
Morphology of the representative free surfaces.
Although the principal focus of this study was to analyze the roughness of free surfaces, the morphology of some contact surfaces was also examined for the sake of comparison. As shown in Figure 9, there are striations and micro-cracks on the contact surfaces. The removal of bur was also observed during ISF. The micrographs of the unformed surface suggest that the micro-cracks originated while rolling. Thus, striations and bur seem to be the main after-effects of ISF, which the contact surfaces experienced. The severity of these two elements depend on the tool/sheet contact (or interaction) that further relies on the process conditions [31]. The effect of which on the contact-surface roughness will be discussed in the next section. In view of morphology and available results, it is possible to say that the roughening of contact surfaces happened due to sheet wear or abrasion. Further analysis on sheet wear was not carried out, as study of contact-surface roughness is not a primary objective of the present study.

Figure 9.
Morphology of the unformed surface and representative formed contact surfaces.
3.3. Significant Effects and Comparison Between the Free and Contact Surfaces from the Perspective of Roughness
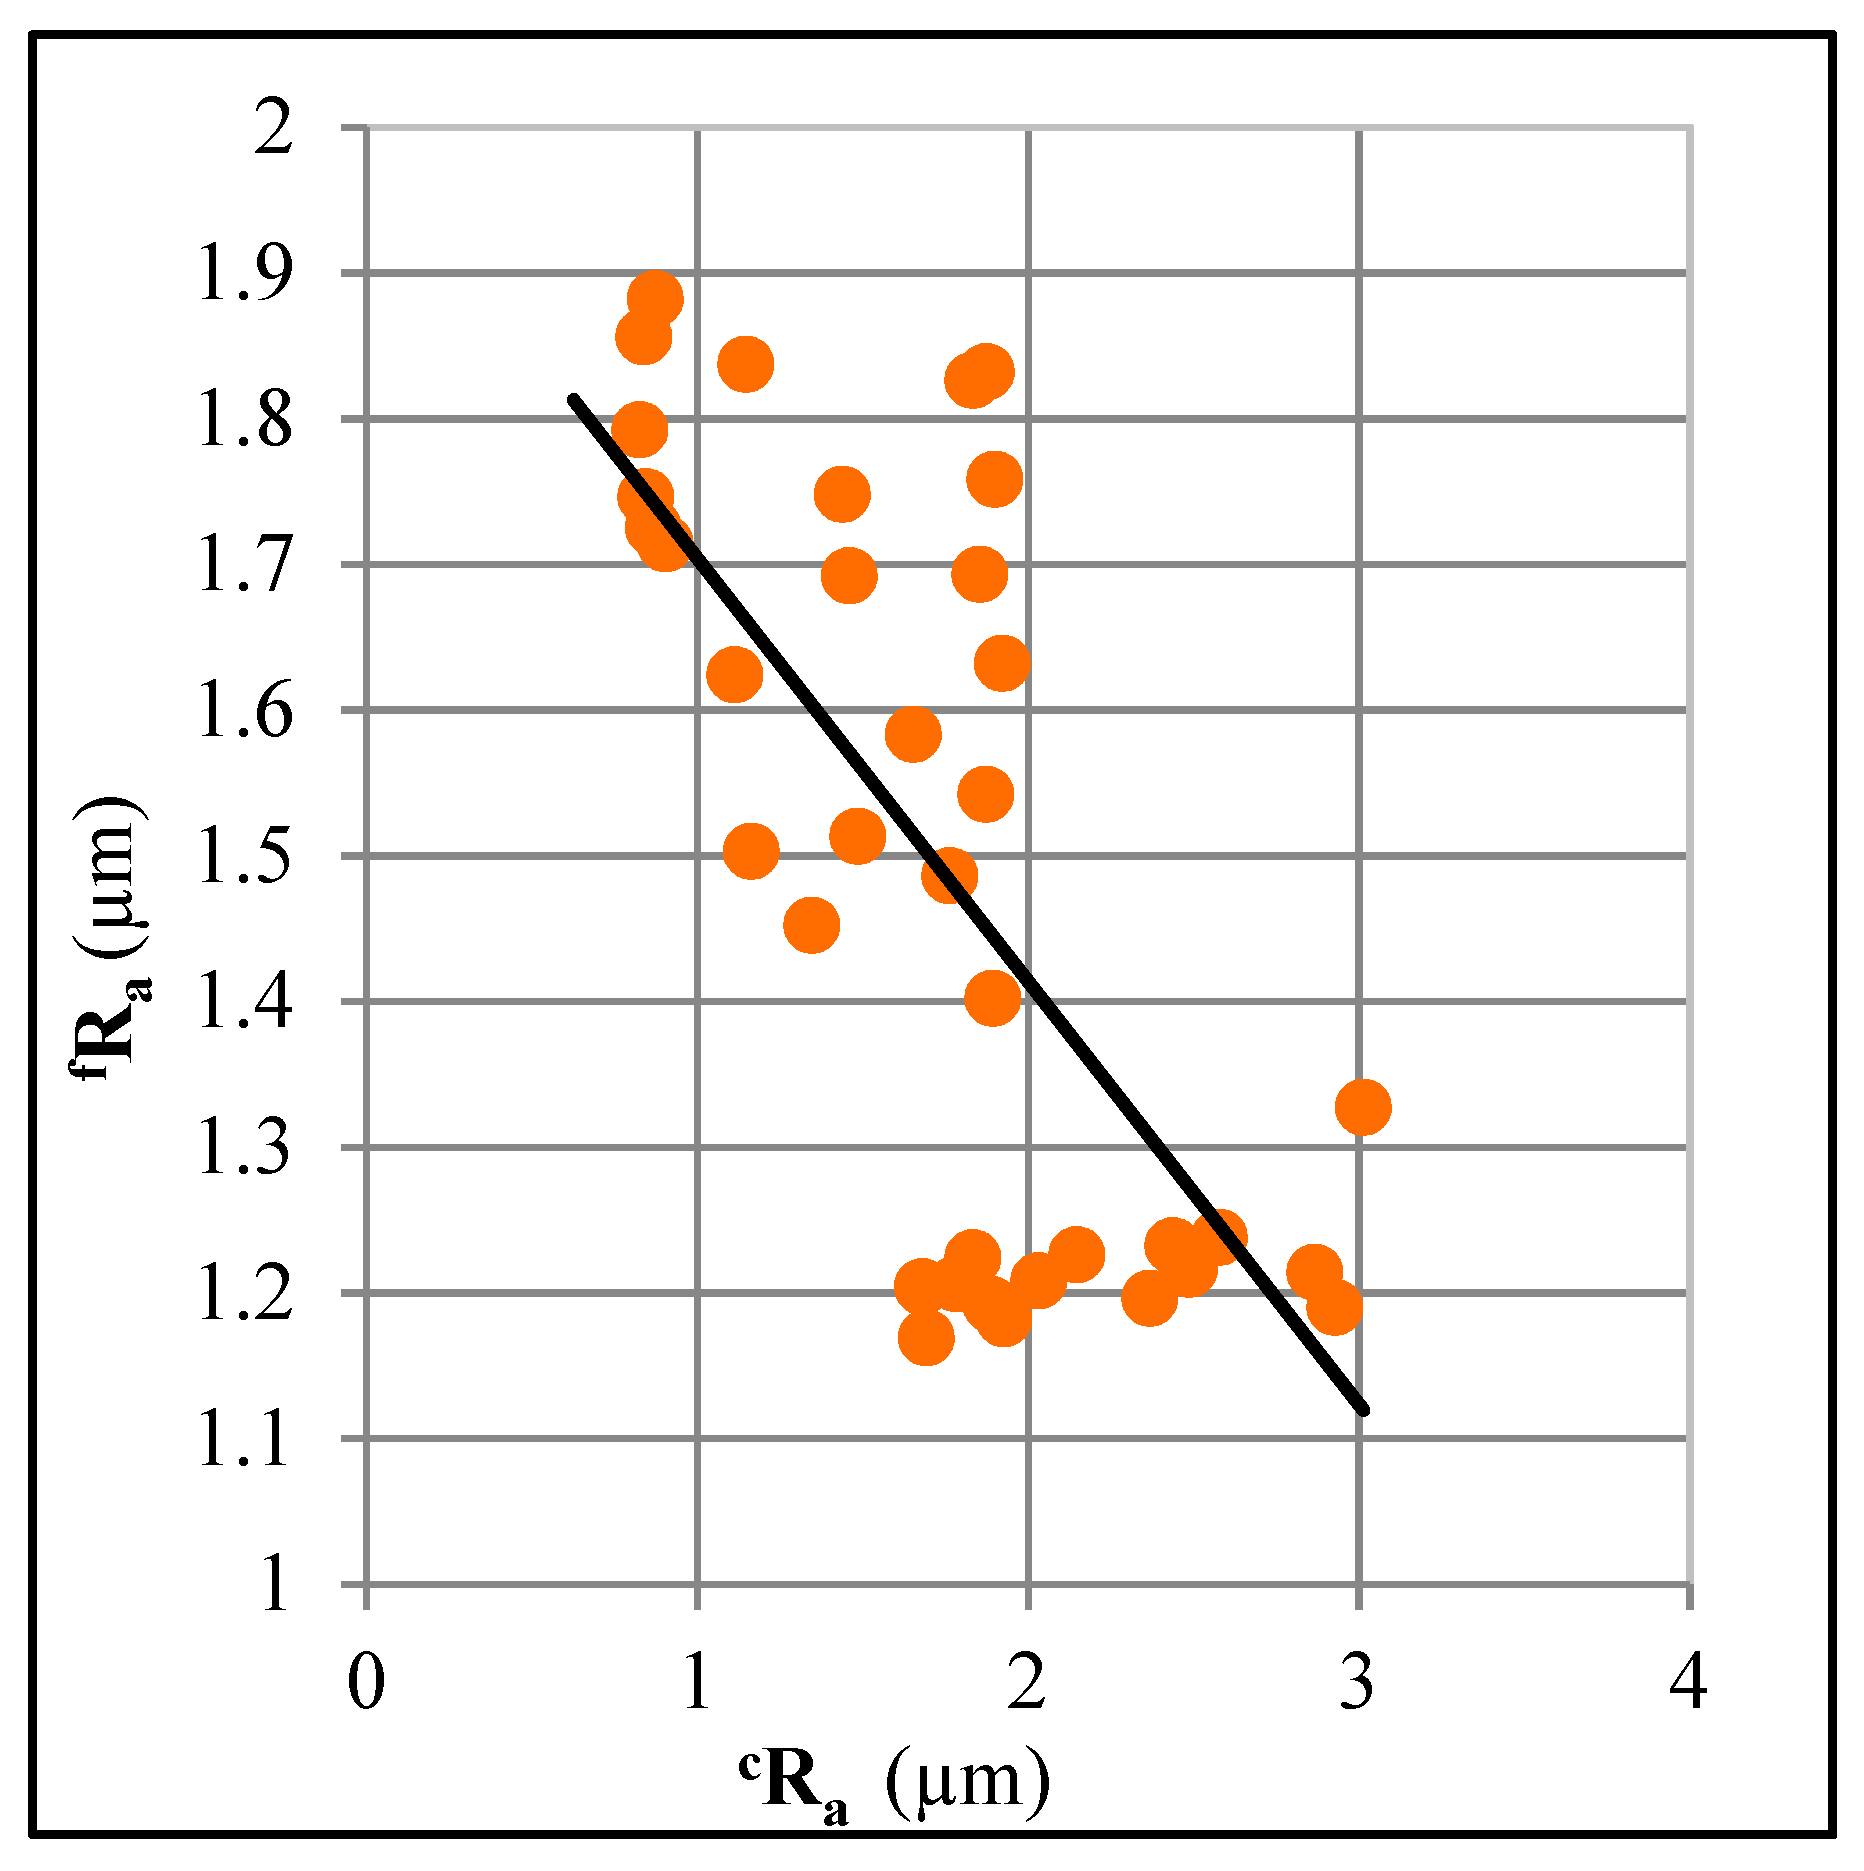
For the reasons of aesthetic and service life of components, roughness control is an important aspect of a forming process. As found before, the free surface and contact surface both experience roughening in the ISF process. However, this is not clear if the roughnesses of the two surfaces are directly or inversely related. The nature of the relation between the two is imperative to be identified in order to entirely control the surface quality of a component. Figure 10 draws a correlation between the two types of roughnesses and it can be noticed that an increase in one leads to a decrease in the other. The value of fRa ranges from 1.17 µm to 1.88 µm and that of cRa ranges from 0.83 µm to 3 µm. The roughness of the free surface in most of the tests is lower in comparison to that of the contact surface (Table 1). The mutual opposition in the two types of roughnesses suggests that one needs to be judicious while selecting process conditions in order to simultaneously control the two. This is only possible by sorting out the nature of effects of important process conditions for the two types of roughnesses.
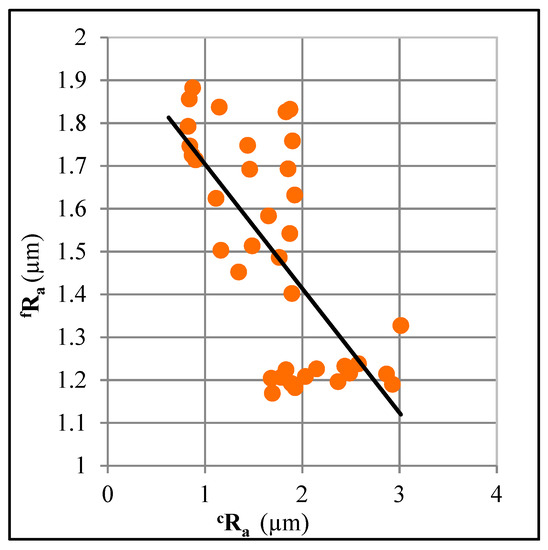
Figure 10.
Correlation between the free-surface roughness and contact-surface roughness.
The analysis of variance (ANOVA) is an established statistical tool that can help with sorting out different effects. Therefore, this analysis was performed on the roughness results listed in Table 1 using a statistical package Design Expert DX-10 (Stat-Ease, MN, USA). Table 3 presents the ANOVA results. The p-value provides a basis to decide if an effect is significant taking a criterion into account, as follows: p ≤ 0.05 (where p stands for probability). Accordingly, there are only three parameters (or effects) that influence the roughness, fRa. Whereas, all of the six considered parameters influence the roughness, cRa. Moreover, the forming angle, θ, is the most influential parameter for both fRa and cRa.
Table 3.
Identification of influential parameters for the roughness on free and contact surfaces.
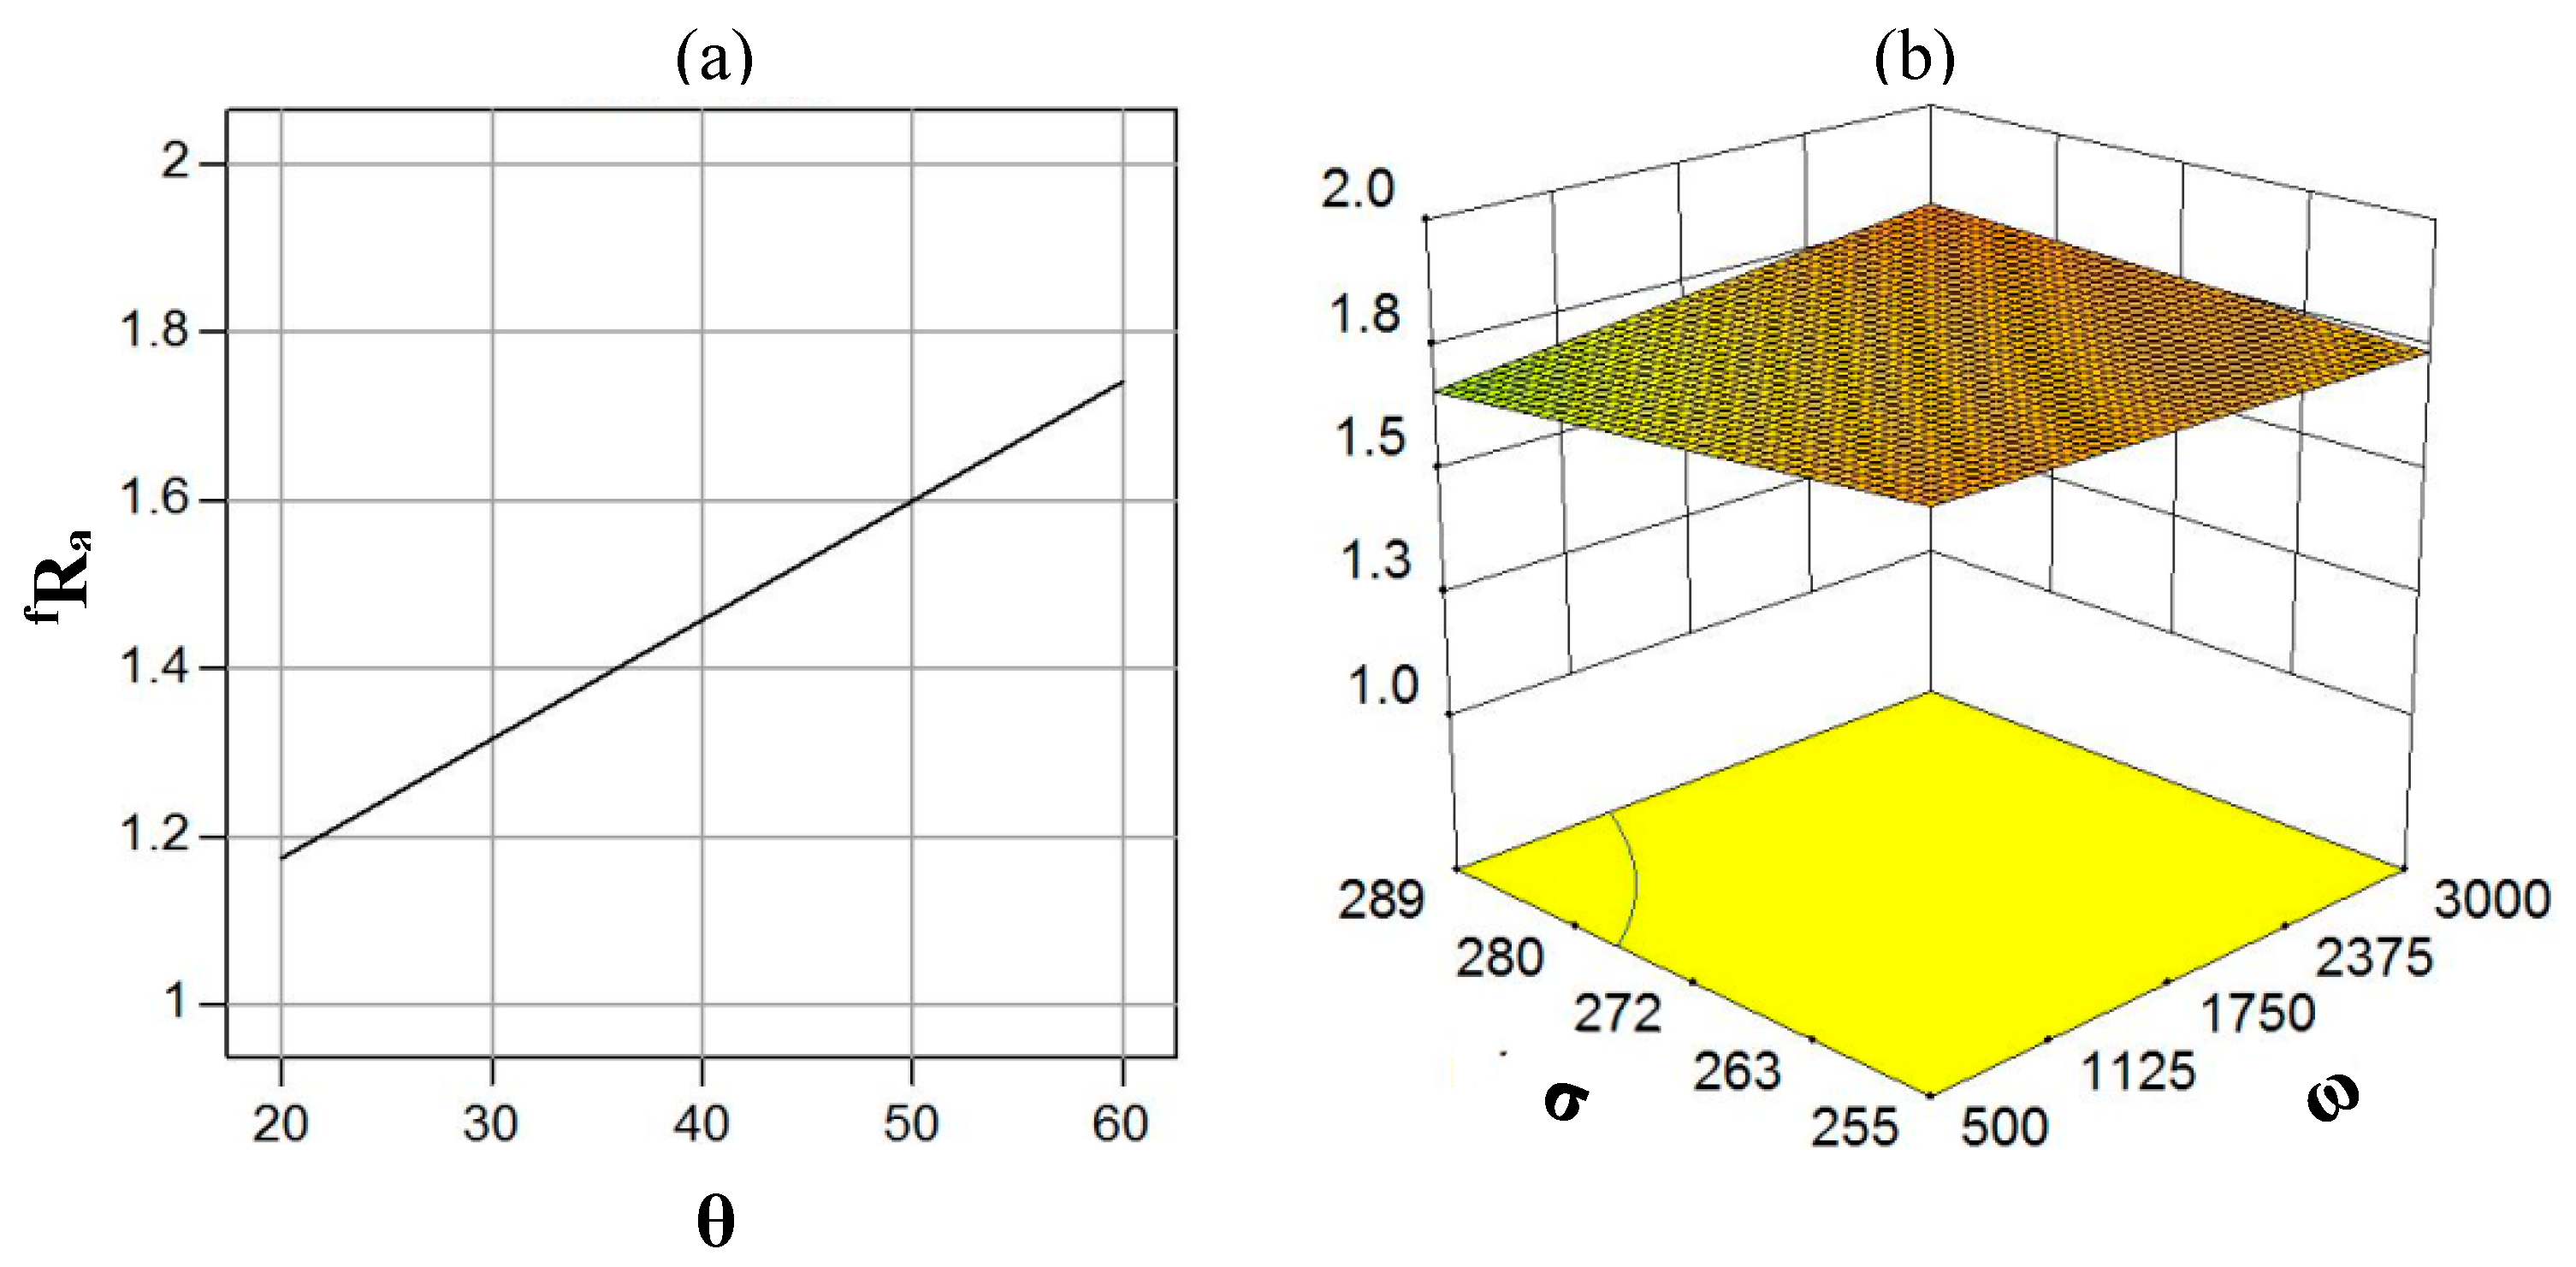
Figure 11 presents significant effects for the roughness fRa. The roughness sharply increases as the forming angle, θ, increases from 20° to 60°. A similar effect is observed with increasing the spindle rotation, ω (from 500 rpm to 3000 rpm), and the initial tensile stress, σ, of the sheet (from 255 MPa to 289 MPa). However, their influence is rather slight in comparison to that of the angle, θ. This can be attributed to the reason that the angle, θ, substantially affects the sheet thinning in ISF (t = to Cosθ), while the other parameters have a slight effect on thinning [3,18]. As a result, free surface deformation and the associated roughness, fRa, becomes more sensitive to a variation in angle than to a variation in the other parameters.
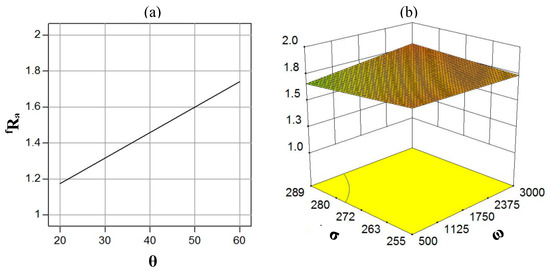
Figure 11.
Correlation between the free-surface roughness and process parameters: (a) Forming angle, and (b) Combined tensile stress and spindle rotation.
Figure 12 portrays significant effects for the roughness, cRa. Comparing the effects of angle, θ, on cRa and fRa, an increase in this parameter causes a decrease in cRa while an increase in this leads an opposing effect on fRa (see Figure 11c and Figure 12a) and, further, both effects are substantial, although opposing in nature. In fact, an increase in angle has two effects on a sheet, as follows: (1) The tool/sheet contact area increases, thereby reducing striations and improving surface finish on the contact surface [31], and (2) wall thinning increases [18], resulting in increased free surface deformation and, hence, the roughness. Figure 12c and Figure 11b show that the rotation ω has a substantial effect on cRa but its effect on fRa is trivial and, moreover, the nature of its effects on the two roughnesses are not alike. Regarding the initial stress, σ, its effects for both cRa and fRa are less significant but the nature of its effect on cRa depends extensively on the type/value of companion/interacting parameter.
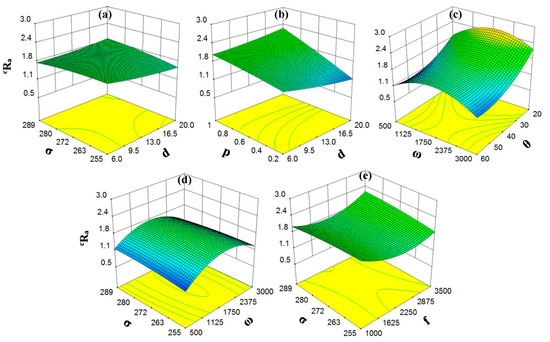
Figure 12.
Correlation between the contact-surface roughness and process parameters: (a) Combined tool diameter and tensile stress, (b) Combined step size and tool diameter, (c) Combined tool rotation and forming angle, (d) Combined tensile stress and spindle rotation, and (e) Combined feed rate and tensile stress.
As far as the effects of diameter, d, feed rate, f, and step size, p, are concerned, these parameters are unimportant for fRa, as indicated earlier in Table 3, while these substantially influence cRa. Furthermore, as observable from Figure 12, their effects on cRa are highly interactive in nature. For instance, the value of cRa reduces as the diameter, d, increases (from 6 mm to 20 mm), as long as step size p < 0.8 mm. However, if p > 0.8 mm, the same poses an inverse effect. Similarly, the effect of feed rate, f, depends on the value of step size, p, and that of the initial stress, σ, depends on the rotation, ω.
The results presented in Figure 10, Figure 11 and Figure 12 follow that the roughening responses of two surfaces (free and contact) to ISF processing are mutually opposite in most respects. Further, the roughness of contact surface extensively depends on the mutual interaction of various parameters. Therefore, in order to simultaneously control roughness on the two surfaces, a judicious set of parameters must be employed and the graphs presented in this study can act as process window for this purpose.
3.4. Roughness Comparison Among the Layered and Monolithic Sheets and Research Opportunities
The present study employed the Cu/Steel/Cu layered sheet as the test material. The Cu layer has low strength while the Steel layer has high strength, as shown in Figure 1. To know if this difference in the strength of contiguous layers affects the roughening degree of Cu on free surface, two tests with low (14%) and high (85%) strain levels were performed on the layered Cu/Steel/Cu sheet and on a monolithic Cu sheet. It was ensured that the monolithic and layered sheets were both formed using the same conditions and the Cu material in both types of sheets also had the same strength (i.e., yield strength of 147 MPa).
Table 4 presents the roughness results, in terms of % change in roughness due to ISF (% ∆fRa), for the layered and monolithic sheets. The value of % ∆fRa for the layered sheet is greater than that for the monolithic sheet, especially at large strain, thereby showing that the free Cu surface in the layered Cu/Steel/Cu sheet experienced greater roughening than that in the monolithic Cu sheet (e.g., 83% vs. 38% in Test 31). This finding suggests that a difference in the yield strengths of two adjoining metals in the layered sheet (i.e., Cu: 147 MPa and Steel: 175 MPa) is responsible for higher roughening on the free surface. This is to notice from Table 4 that the layered blank has a slightly lower initial roughness than the monolithic Cu blank and, therefore, bearing in mind that higher initial roughness leads to greater roughening during forming [7], the layered sheet should have experienced higher roughening than the monolithic sheet. However, in the present study, the layered sheet endured substantially greater roughening during ISF and, thus, provides another basis to claim that a difference in the strength of two bonded metals intensified free-surface roughening of the layered sheet during ISF. In order to ascertain this point, the free surfaces in the layered and monolithic sheets were analyzed for Test 31 (i.e., high strain). As shown in Figure 13, the free-surface texture in the layered sheet is rougher than that in the monolithic sheet, which testifies the above claim.
Table 4.
Comparison of free-surface roughness in the layered and monolithic sheets.
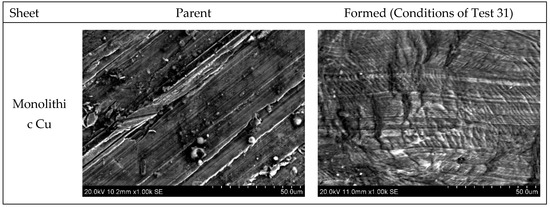
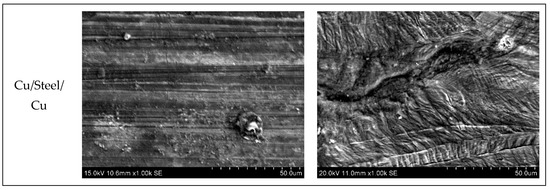
Figure 13.
Morphology of the monolithic and layered sheets.
For comparison, the roughness results of monolithic DCO4 Steel sheet are also presented in Table 4. Like the monolithic Cu sheet, the monolithic steel sheet also experiences lower roughening, in comparison to the layered sheet. These results imply that the free surface of the Cu layer being adjoined with the steel layer might have received redundant forming force during ISF in comparison to the forming force it requires as a monolithic sheet of same thickness. If steel has higher strength than Cu and F(St) and F(Cu) are the forces to deform the monolithic steel sheet and monolithic Cu sheet, respectively, F(St) > F(Cu) will hold, provided all other process conditions are kept fixed. When Cu and steel layers are joined to the equivalent thickness of a monolithic sheet(s) and subjected to ISF, the following force condition is likely to prevail:
where b is a factor by which the Cu layer in a bonded sheet will endure higher force, compared to what it will endure as a monolithic Cu sheet.
F(St) >Fapplied > F(Cu) or Fapplied > b F(Cu),
The above force condition will ultimately change the state of stress, thereby increasing the hydrostatic stress (σm) on the free Cu surface in comparison to the monolithic Cu sheet, i.e.,
where c is a factor by which σm in the Cu layer is greater than that in the monolithic Cu sheet.
Bearing in mind that the hydrostatic stress in ISF has a tensile nature on the free surface [32,33] and it promotes the formation of defects like orange peel, it is possible to infer that the free Cu layer (in Cu/Steel/Cu bonded sheet) experienced more surface defects resulting in rougher texture than texture in a monolithic Cu sheet due to enduring greater tensile hydrostatic stress. The textures shown in Figure 13, which were discussed earlier, witness this point. This hypothesis, however, needs to be validated in future by additionally conducting Finite Element Analysis.
The experimental results presented in this study offer first hand interesting information of its nature and suggest many new research opportunities on the roughness subject, which the authors will explore in the future in order to comprehend the knowledge.
- The strength difference in the two contiguous metallic layers (Cu and Steel) affects the free-surface roughness of the Cu layer of a bonded sheet, as found in the current study. This, according to Equations (12) and (13), happens because the low-strength Cu being attached with the high-strength steel possibly receives a redundant load, resulting in additional hydrostatic tension and surface defects (e.g., orange peel). However, this point requires validation for which efforts should be spent to analyze the forming forces and tensile stresses on the free surface considering layered and monolithic sheets. Moreover, this exercise should be repeated at varying strength differences.
- The type of material and initial roughness of the sheet affects the surface deformation, thereby affecting the free-surface roughness in metal forming [7]. Detailed studies must be carried out in this direction, with the purpose of developing a generalized process window to control roughness in ISF.
- During forming, a low strength sheet (Cu) was stacked below a high strength sheet (steel) in the present study. By inversing the stacking sequence, the strength difference in the two adjoining layers might not influence the load on the free surface and, thus, the free-surface roughness may remain insensitive to layering.
- Figure 4 depicts that the free-surface roughness increases with strain hardening (or post-forming strength) of the sheet in ISF, thereby pointing out that the mentioned roughening probably occurred due to a corresponding increase in the tensile stresses on the free surface during forming. This point needs to be ascertained. Moreover, the said hardening occurred due to the combined effect of bending and stretching strains. Thus, the two effects should be isolated in order to identify the most influential one.
- The tool path can affect the strain distribution and, thus, the roughness. This aspect should be explored in detail by considering various tool paths.
- A close association among various deformation quantities identified in this study points to the peculiar deformation mechanics of the ISF process. Further work in this direction can deepen the process understanding.
4. Conclusions
Due to absence of any back support, a free surface in ISF endures uneven deformation, thereby producing rough components. Since roughness adversely affects the service life of components, the effect of applying strain on the free-surface roughness was analyzed in the present study. Moreover, the nature of its relationship with the contact-surface roughness and several post-forming properties of the sheet was examined and the morphology of the surfaces was observed. The following important findings can be drawn from this fundamental study:
- The free-surface roughness increased non-linearly as the normal surface strain (stretching + bending with the following strain state on the surface: ɛ1 = 0, ɛ2 > 0, γmax = ɛ2) increased from 13% to 98%, thereby showing that the free-surface roughening in ISF occurred due to surface deformation. The roughness also increased with the post-forming sheet strength, residual stress, and forming force, thus indicating that strain hardening has a direct effect on roughening in ISF. This finding also reveals that material strengthening in ISF was achieved at the cost of surface quality, although the rise in sheet strength was high in comparison to that in roughness. These quantities were found to correlate closely, information from which can be extracted to incorporate into deformation models to improve the process modeling.
- The free-surface roughness and the contact-surface roughness were related inversely, as responses of the two roughnesses to ISF processing were mutually exclusive, in most respects, thereby pointing out a need to choose a judicious set of process conditions to produce components with low roughness on both surfaces. Therefore, the significance and nature of various process conditions for both types of roughnesses were analyzed/classified and presented in this study. The analysis disclosed that the forming angle amongst various parameters had the highest contribution.
- The surface morphology revealed that the free surfaces contained orange peel, slip lines, and micro-voids. Furthermore, the density of these features, along with the roughness, increased with the ISF strain, thus showing that the roughening of free surfaces in ISF occurred mainly due to surface deformation, possibly with a tensile state of stress, while the contact surfaces were observed to contain striations, thereby showing the influence of tool/sheet interaction.
- The present study offers a basic and first knowledge of its nature in the ISF process. Moreover, based on the obtained results, several new research directions were identified and discussed to further comprehend free-surface roughening in ISF.
Author Contributions
Conceptualization, G.H.; methodology, G.H. and K.G.; software, K.G.; validation, K.G., formal analysis, G.H.; investigation, G.H. and K.G.; resources, K.G.; data curation, G.H. and K.G.; writing—original draft preparation, G.H.; writing—review and editing, K.G.; visualization, G.H.; supervision, G.H.; project administration, K.G. and G.H.; funding acquisition, K.G.
Funding
The authors are thankful for the financial help and technical support that King Abdulaziz University (KSA) provided for this research work.
Acknowledgments
The technical support provided by GIK Institute of Engineering Sciences & Technology, Pakistan, is greatly acknowledged.
Conflicts of Interest
The authors declare no conflict of interest. The author (K.G.) from the funding institution took part in a number of activities as mentioned in above section “Authors Contribution”.
Symbols
| d | Tool diameter |
| θ | Forming angle |
| ω | Spindle rotation |
| f | Feed rate |
| σ | Pre-forming tensile stress of sheet |
| p | Step size |
| fRa | Mean free-surface-roughness |
| cRa | Mean contact-surface-roughness |
| YS | Post-forming yield strength |
| UTS | Post-forming tensile strength |
| ɛ-ISF | Applied ISF strain |
| Fz | Forming force in Z axis. |
References
- Jeswiet, J.; Micari, F.; Hirt, G.; Bramley, A.; Duflou, J.; Allwood, J. Asymmetric single point incremental forming of sheet metal. CIRP Ann. 2005, 54, 623–650. [Google Scholar] [CrossRef]
- Racz, S.G.; Breaz, R.E.; Tera, M.; Gîrjob, G.; Biris, G.; Chicea, A.L.; Bologa, O. Incremental forming of titanium Ti6Al4V alloy for canioplasty plates—Decision-making process and technological approaches. Metals 2018, 8, 626. [Google Scholar] [CrossRef]
- Jeswiet, J.; Adams, D.; Doolan, M.; McAnulty, T.; Gupta, P. Single point and asymmetric incremental forming. Adv. Manuf. 2015, 3, 253–262. [Google Scholar] [CrossRef]
- Stoudt, M.R.; Hubbard, J.B.; Iadicola, M.A.; Banovic, S.W. A study of the fundamental relationships between deformation-induced surface roughness and strain localization in AA5754. Metall. Mater. Trans. A 2009, 40, 1611–1622. [Google Scholar] [CrossRef]
- Stoudt, M.R.; Hubbard, J.B.; Leigh, S.D. On the relationship between deformation-induced surface roughness and plastic strain in AA5052—Is it really linear? Metall. Mater. Trans. A 2011, 42, 2668–2679. [Google Scholar] [CrossRef]
- Wu, P.D.; Lloyd, D.J.; Jain, M.; Neale, K.W.; Huang, Y. Effects of spatial grain orientation distribution and initial surface topography on sheet metal necking. Int. J. Plast. 2007, 23, 1084–1104. [Google Scholar] [CrossRef]
- Shi, Y.; Zhao, P.Z.; Jin, H.; Wu, P.D.; Lloyd, D.J. Analysis of surface roughening in AA6111 automotive sheet under pure bending. Metall. Mater. Trans. A 2016, 47, 949–960. [Google Scholar] [CrossRef]
- Al-Quershi, H.A.; Klein, A.N.; Fredel, M.C. Grain size and surface roughness effect on the instability strains in sheet metal stretching. J. Mater. Proc. Technol. 2005, 170, 204–210. [Google Scholar] [CrossRef]
- Azushima, A.; Sakuramoto, M. Effects of plastic strain on surface roughness and coefficient of friction in tension-bending test. CIRP Ann. 2006, 55, 303–306. [Google Scholar] [CrossRef]
- Gatea, S.; Ou, H.; McCartney, G. Review on the influence of process parameters in incremental sheet forming. Int. J. Adv. Manuf. Technol. 2016, 87, 479–499. [Google Scholar] [CrossRef]
- Echrif, S.B.M.; Hrairi, M. Significant parameters for the surface roughness in incremental forming process. Mater. Manuf. Process. 2014, 29, 697–703. [Google Scholar] [CrossRef]
- Hagan, E.; Jeswiet, J. Analysis of surface roughness for parts formed by computer numerical controlled incremental forming. Proc. Inst. Mech. Eng. J. Eng. Manuf. 2004, 218, 1307–1312. [Google Scholar] [CrossRef]
- Durante, M.; Formisano, A.; Langella, A.; Memola, F.; Minutolo, C. The influence of tool rotation on an incremental forming process. J. Mater. Process. Technol. 2009, 209, 4621–4626. [Google Scholar] [CrossRef]
- Baruah, A.; Pandivelan, C.; Jeevanantham, A.K. Optimization of AA5052 in incremental sheet forming using grey relational analysis. Measurement 2017, 106, 95–100. [Google Scholar] [CrossRef]
- Suresh, K.; Nasih, H.R.; Srinivasa, P.R.; Amit, K.G. Modeling and optimization of surface roughness in single point incremental forming process. J. Mater. Res. Technol. 2015, 3, 304–313. [Google Scholar]
- Azevedo, N.G.; Farias, J.S.; Bastos, R.P.; Teixeira, P.; Davim, J.P.; De-Sousa, R.S.J. Lubrication aspects during single point incremental forming for steel and aluminum materials. Int. J. Precis. Eng. Manuf. 2015, 16, 589–595. [Google Scholar] [CrossRef]
- Hamilton, K.; Jeswiet, J. Single point incremental forming at high feed rates and rotational speeds: Surface and structural consequences. CIRP Ann. 2010, 59, 311–314. [Google Scholar] [CrossRef]
- Fang, Y.; Lu, B.; Chen, J.; Xu, D.K.; Ou, H. Analytical and experimental investigations on deformation mechanism and fracture behavior in single point incremental forming. J. Mater. Process. Technol. 2014, 214, 1503–1515. [Google Scholar] [CrossRef]
- Marteau, J.; Bigerelle, M. Relation between surface hardening and roughness induced by ultrasonic shot peening. Tribol. Int. 2015, 83, 105–113. [Google Scholar] [CrossRef]
- Llaneza, V.; Belzunce, F.J. Study of the effects produced by shot peening on the surface of quenched and tempered steels: Roughness, residual stresses and work hardening. Appl. Surf. Sci. 2015, 356, 475–485. [Google Scholar] [CrossRef]
- Ulrik, B.; Norman, A.F. Strain gradient effects in surface roughening. Model. Simul. Mater. Sci. Eng. 2007, 15, S1–S12. [Google Scholar]
- Sasaki, K.; Burstein, G. The generation of surface roughness during slurry erosion-corrosion and its effect on the pitting potential. Corros. Sci. 1996, 38, 2111–2120. [Google Scholar] [CrossRef]
- Liu, Z.; Liu, S.; Li, Y.; Meehan, P.A. Modeling and optimization of surface roughness in incremental sheet forming using a multi-objective function. Mater. Manuf. Process. 2014, 29, 808–818. [Google Scholar] [CrossRef]
- Prates, P.A.; Adaixo, A.S.; Oliveira, M.C.; Fernandes, J.V. Numerical study on the effect of mechanical properties variability in sheet metal forming processes. Int. J. Adv. Manuf. Technol. 2018, 96, 561–580. [Google Scholar] [CrossRef]
- Anderson, M.J.; Whitcomb, P.J. RSM Simplified: Optimizing Processes Using Response Surface Methods for Design of Experiments; CRC Press: Boca Raton, FL, USA, 2004. [Google Scholar]
- Al-Ghamdi, K.A.; Hussain, G. Forming forces in incremental forming of a geometry with corner feature: Investigation into the effect of forming parameters using response surface approach. Int. J. Adv. Manuf. Technol. 2015, 76, 2185–2197. [Google Scholar] [CrossRef]
- Baharudin, B.T.H.T.; Azpen, Q.M.; Sulaima, S.; Mustapha, F. Experimental investigation of forming forces in frictional stir incremental forming of aluminum alloy AA6061-T6. Metals 2017, 7, 484. [Google Scholar] [CrossRef]
- Shi, X.; Hussain, G.; Butt, S.I.; Song, F.; Huang, D.; Liu, Y. The state of residual stresses in the Cu/Steel bonded laminates after ISF deformation: An experimental analysis. J. Manuf. Process. 2017, 30, 14–26. [Google Scholar] [CrossRef]
- Shao, C.W.; Zhang, P.; Zhu, Y.K.; Zhang, Z.J.; Tian, Y.Z.; Zhang, Z.F. Simultaneous improvement of strength and plasticity: Additional work-hardening from gradient microstructure. Acta Mater. 2018, 145, 413–428. [Google Scholar] [CrossRef]
- Jiménez, I.; Siller, H.R.; López, C.; Diabb, J.; Martinez-Romero, O.; Sandoval-Robles, J.A.; Mares, P.; Elías-Zúñiga, A. Investigation of residual stress distribution in single point incremental forming of aluminum parts by X-ray diffraction technique. Int. J. Adv. Manuf. Technol. 2017, 91, 2571–2580. [Google Scholar] [CrossRef]
- Durante, M.; Formisano, A.; Langella, A. Observations on the Influence of Tool-Sheet Contact Conditions on an Incremental Forming Process. J. Mater. Eng. Perform. 2011, 20, 941–946. [Google Scholar] [CrossRef]
- Al-Ghamdi, K.A.; Hussain, G. Threshold tool-radius condition maximizing the formability in SPIF considering a variety of materials: Experimental and FE investigations. Int. J. Mach. Tool Manuf. 2015, 88, 82–94. [Google Scholar] [CrossRef]
- Centeno, G.; Martínez-Donaire, A.J.; Bagudanch, I.; Morales-Palma, D.; Garcia-Romeu, M.L.; Vallellano, C. Revisiting formability and failure of AISI304 sheets in SPIF: Experimental approach and numerical validation. Metals 2017, 7, 531. [Google Scholar] [CrossRef]


© 2019 by the authors. Licensee MDPI, Basel, Switzerland. This article is an open access article distributed under the terms and conditions of the Creative Commons Attribution (CC BY) license (http://creativecommons.org/licenses/by/4.0/).