Article

Multi-Objective Optimization of Friction Stir Spot-Welded Parameters on Aluminum Alloy Sheets Based on Automotive Joint Loads

State Key Laboratory of Automobile Simulation and Control, Jilin University, Changchun 130022, China
*
Author to whom correspondence should be addressed.
Metals 2019, 9(5), 520; https://doi.org/10.3390/met9050520
Submission received: 12 April 2019 / Revised: 4 May 2019 / Accepted: 5 May 2019 / Published: 6 May 2019

Abstract

:
By controlling various friction stir spot-welded (FSSW) factors, two base sheets AA 5052-H32 and 6061-T6 were selected to bond similar and dissimilar metal joints while considering dissimilar configuration orders. The effects of weld parameters on the sheer strength and peel strength were separately developed into empirical models utilizing the integrated central composite matrix design and response surface methodology (RSM). Meanwhile, the finite element (FE) analysis of the multi-axis load-bearing characteristics for automotive solder joints during service was carried out. As a result, the weights of the shear and axial stress, accounting for 90.5% and 9.5% respectively, were employed to restrict the relationship between multiple target properties, and the resulting security strength was applied to determine the feasible domain in subsequent parametric optimization. In order to enable the optimal multi-axis capacities in accordance with the load mode, the genetic algorithm NSGA-II was chosen to compute the Pareto front and further determine the best compromise solutions. The obtained optimums corresponding to each joining condition were validated by confirmation runs, indicating that this coupled multi-objective optimization approach based on working conditions was beneficial to the targeted improvement of post-weld mechanical properties.

Graphical Abstract

1. Introduction

With increasing pressure of energy saving and emission reduction on the automotive industry, the demands for good-performance, high-reliability and lightweight components are getting more urgent [1]. For the whole vehicle, the heavy use of lightweight materials, especially aluminum alloys, becomes a major means to achieve weight reduction. Among them, AA 5052-H32 and 6061-T6 are widely applied in automobile bodies due to their excellent formability and high corrosion resistance [2]. Meanwhile, since the current autobody is assembled from a large number of sheet metal parts through 3000 to 5000 solder joints, a reasonable selection of spot-weld forming process becomes a prerequisite for ensuring high rigidity of the vehicle. However, aluminum and its alloys with poor weldability have significant physical and chemical differences with conventional steels. Thereby, the original resistance spot-welded (RSW) joints generally yield various unavoidable welding defects such as porosity, slag inclusion and solidification cracks due to the fusion welding method itself, deteriorating the weld quality and joint properties [3,4,5]. In contrast, as a solid-state modification process, friction stir spot weld (FSSW) covers the combined roles of metallurgy and mechanics to overcome the above inherent defects [6,7]. In addition, such promising process can effectively avoid the formation of excessive inclusions between overlapped sheets compared to other spot joining techniques such as screwing and riveting [8]. Although the process itself can achieve superior joints, improper selection of welding parameters can still result in inadequate strength and stiffness as well as failure risk during service. It is worth emphasizing that the process optimization targeted for specific working conditions during the use of joints has higher engineering value.
In terms of FSSW process, the evolution of the microstructure and the resultant degree of bonding depend on the thermal generation at contact interface and the superplastic flow of welded materials, and are further determined by significant parameters such as tool geometry, rotational speed, plunged depth by shoulder and dwell time [9,10,11]. Under the premise that other factors are unchanged, it can be considered that the selected depth directly determines the level of axial welding force, which is thus expressed by the former. Since the relationship between input parameters and mechanical results is complicated and non-linear, it is impractical for manufacturers to intuitively determine optimal parameters based on experience. To predict the optimum parameters and corresponding performance, a set of approximation methods are available. Tutar et al. [12] and Lakshminarayanan et al. [13] utilized L9 Taguchi orthogonal array to obtain optimal levels, followed by analysis of variance (ANOVA) to estimate individual importance of each parameter. The traditional Taguchi approach has limitations in solving the problems of multi-response optimization. The above limitation was overcome by combining the Taguchi method with grey relation analysis to achieve multi-objective optimization of friction stir welding (FSW) parameters [14]. Additionally, extensive literature [15,16,17] adopted response surface methodology (RSM) based on approximate models for parameter optimization, using Full-Factorial Design (FFD), Box-Behnken Design (BBD) or Central-Composite Design (CCD). The second-order regression expression proved to have a good prediction effect. In addition to these mathematical hypothesis-based methods, Artificial Neural Network (ANN) is also useful for modeling and prediction of FSW parameters. Its generalized learning means that it has a stronger ability to approximate nonlinear functions. Thereby, the genetic algorithm (GA) or particle swarm algorithm can be applied to search for the Pareto-optimal sets. Shojaeefard et al. [18] used an ANN–GA integrated approach based on finite element method (FEM) to investigate the correlations between FSW parameters and multiple output responses for AA5083 butt joints, and obtained the optimal parameter sets. Similarly, an ANN coupled with the particle swarm algorithm was proposed to establish the relationship between process parameters and mechanical properties, and the FSW parameters of dissimilar aluminum alloys (AA7075/AA5083) were further optimized [19]. Regarding the selection of optimization techniquesin the above literature surveys [18,19], the Technique for Order Preference by Similarity to the Ideal Solution (TOPSIS) was employed to determine the best compromise solution.
Although current studies have reported the applications of non-mathematical models and multi-objective algorithms, there is still a lack of integration of RSM and GA to achieve performance optimization on FSSW. In particular, the selection of the final solution from the Pareto front is extremely critical. Since the joints between automotive parts are typically subjected to unbalanced shear stress and peel stress, multi-axial mechanical capacities are required to provide sufficient safety reserves for different load forms. However, since the geometry and modified material distribution are symmetric along the central axis of the keyhole, the formed FSSW joints have significantly different crack resistance in the direction of lap plane and its normal direction. It is difficult to improve both at the same time through process optimization. In fact, different mechanical responses may be contradictory with each other. For example, the FSSW joint using AA7075-T6 was confirmed to own the maximum shear strength and peel strength at distinct discrete levels of weld parameters, respectively [20]. Hence, aiming at the optimal capacities in accordance with the load mode under application conditions, the restrictive relationship between multiple properties in parametric optimization process should be evaluated on the basis of loads and assigned different weights.
In present study, an integrated optimization approach using RSM and NSGA-II under the applicability constraints was introduced to optimize FSSW process parameters on automotive aluminum alloy sheets. Here, RSM was used to set up the empirical relationship between decision variables and multi-axis mechanical responses, while main effects and contribution rates of weld parameters on ultimate strength were analyzed. For targeted optimization, the non-uniform load characteristics of automotive joints were analyzed. Finally, the NSGA-II algorithm was employed to compute the non-dominated Pareto sets and further determine the unique optimal solution based on the calculated load component weights.

2. Materials and Methods

2.1. Materials Characterization

FSSW experiments were performed using rolled sheets of Al–Mg alloy 5052-H32 and Al–Mg–Si alloy 6061-T6, which have been extensively applied in automotive stamping parts and highly loaded structural elements. In order to test the eligibility of the original base metals, their elemental compositions were determined by Energy Dispersive Spectroscopy (EDS, INCA-X-Max, Oxford Instruments, Oxford, UK). EDS spectra were collected at 30 kV on the scanning electron microscope (SEM, EV018, ZEISS, Oberkohen, Germany). As a result, their chemical contents are listed in Table 1. Two types of automotive aluminum alloys were wire-cut into standard material test pieces and subjected to tensile tests. Table 2 shows the mechanical properties’ parameters after the measurements.
For the welded FSSW samples, to observe the degree of bonding and the evolution of the microstructure, two samples of similar 6061 and dissimilar 6061/5052 were cut along the central section of solder joint using a wire-cutting machine. The bonding interfaces were polished and then chemically etched with Keller’s reagent to reveal the post-weld microstructure, followed by local observations of the area adjacent to the lap plane using an optical microscope (OM, Imager-M2M, ZEISS, Oberkohen, Germany) as well as a SEM.

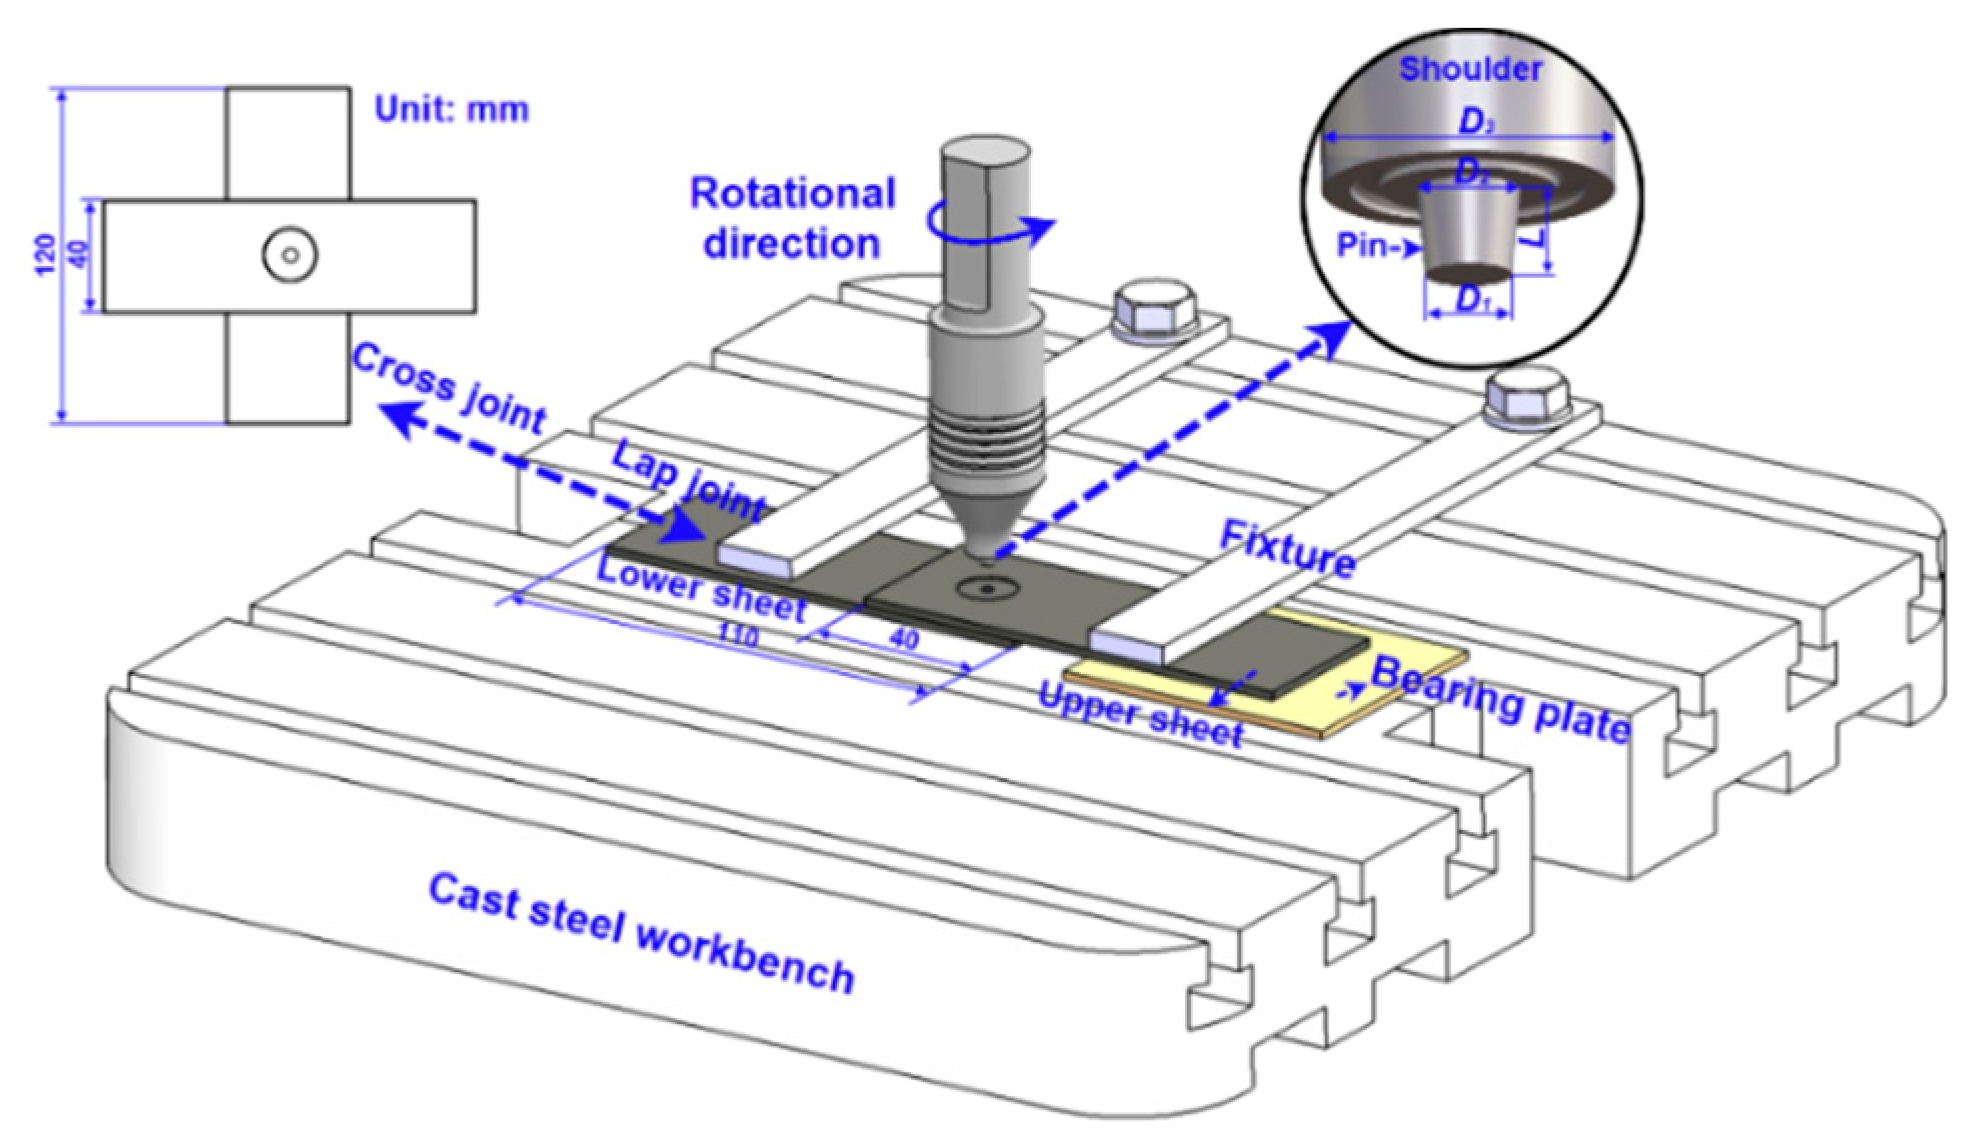
2.2. Experimental Setup

Prior to welding, a wire brush was used to clean the oxide layers of the lapped surfaces to prevent impurities from incorporating into the post-weld bond area. As shown in Figure 1, a CNC controlled FSW machine (FSW-LM-AM16, Beijing Seifost Technology Co., Ltd., Beijing, China) was employed to fabricate the lap and cross joints in the displacement control mode. The stir tool used was made of high speed steel HS6-5-2C and had a conical pin. The detailed dimensions of the tools and the welded workpieces are visible in Figure 1. Since the welded plates selected for this work were 1.0 mm and 2.0 mm thick, Table 3 lists the used tool specifications corresponding to the two combinations of lap thickness commonly applied in automobiles.
Further, room-temperature tensile tests were carried out on a universal testing machine (Jilin Guanteng Automation Technology Co., Ltd., Changchun, China) with 100 kN capacity as per ASTM-E8 standard [21]. The ultimate shear and peel strengths at a quasi-static rate of 1.5 mm/min were recorded on samples at five metal configurations (see Table 4 for details) using tensile shear specimens and cross-stretched specimens, respectively.

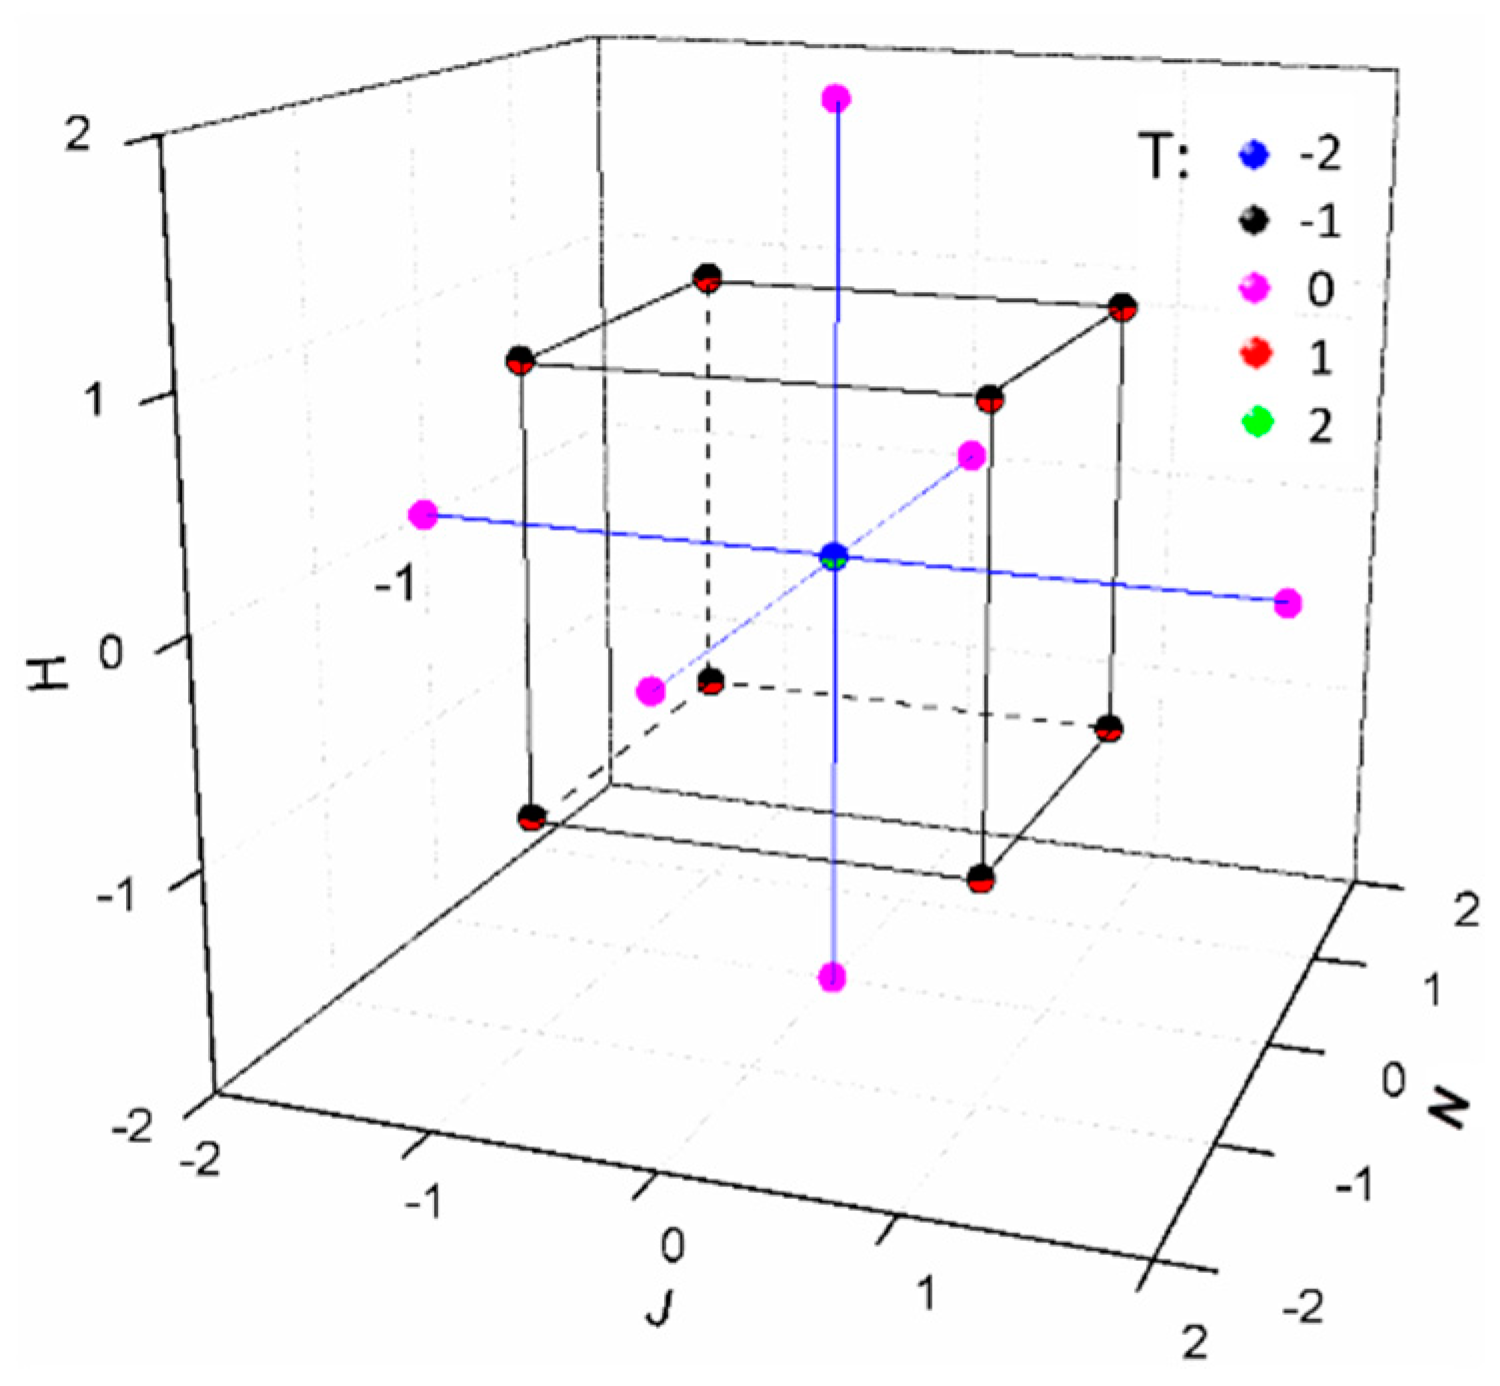
2.3. Experimental Design

According to the documents available, the predominant weld factors (input variables) affecting the performance of FSSW joints were identified as rotational speed (N), plunged depth by shoulder (H) and dwell time (T). In addition to these, the combination of the upper and lower plate materials and their thickness was classified as the structural factor of the joint (J). The purpose of setting this factor is to study the influence of the inherent properties of the original base metals on the joint performance; on the other hand, in the finally established four-factor model formula, the welding parameters corresponding to each joint type can be rapidly optimized by setting J to several fixed joint levels.
The working range of each process parameter was first estimated with reference to previous studies [9,10,12,20,22,23]. The lower limits of N and T were thus determined, and several trial weld runs were performed to further determine the upper limit of N by varying its value while keeping the remaining values constant. During this process, excessive N values that may result in visible weld defects and significantly low tensile shear fracture loads were excluded. Considering the quality and welding efficiency requirements on automotive assembly lines, the dwell time (T) was chosen to be below 5 s. In addition, since the margin of Al sheet thickness was 1.0 mm in this work, the plunged depth by shoulder (H) should be selected to be 0.5 mm or less. Table 4 presents the studied FSSW process factors, and their codes and actual levels. The upper and lower limits of the parameters were encoded as +2 and −2, and the codes at intermediate levels can be calculated from the linear conversion.
Due to the wide range of individual factors, a central-composite rotatable design matrix with 28 runs (see Table 5 for details) was established. The experimental matrix consists of a four-factor, full-factorial design with 24 points, eight start points and four center points. The four-dimensional distribution of these sampling points is presented in Figure 2. The star points can be associated with the full factor points by the following expressions:
starupper = base + (upperbaseα,
starlower = base − (baselowerα,
where base, lower and upper are respectively the center points at zero-level, low-level and high-level points for full-factorial design; α is a scale factor, and by adjusting its size, a matrix of different properties such as orthogonality and rotation can be obtained [24], this study takes α = 2 as a rotational matrix.
Thus, 28 trial runs were used to fit second-order regression polynomial Equation (3) for the two responses to predict the effect of the input variables on the evaluation indicators. The statistical significance of the terms in each regression equation was subsequently examined. Combined with the ANOVA, the linear, quadratic and bidirectional interactions of process factors on the lap shear strength (Ps) and peel strength (Pa) of FSSW joints could be obtained. To develop an adequate model, three replicate samples were tested for each condition and the indicator was calculated as the average of the replicates. Figure 3 shows the fabricated 56 joints without replicates.
Y = b 0 + b i x i + b i i x i 2 + b i j x i x j
where b0 is the average of the responses, bi, bii and bij are respectively the fitted coefficients of linear, quadratic and interactive terms.

3. Resultsand Discussion

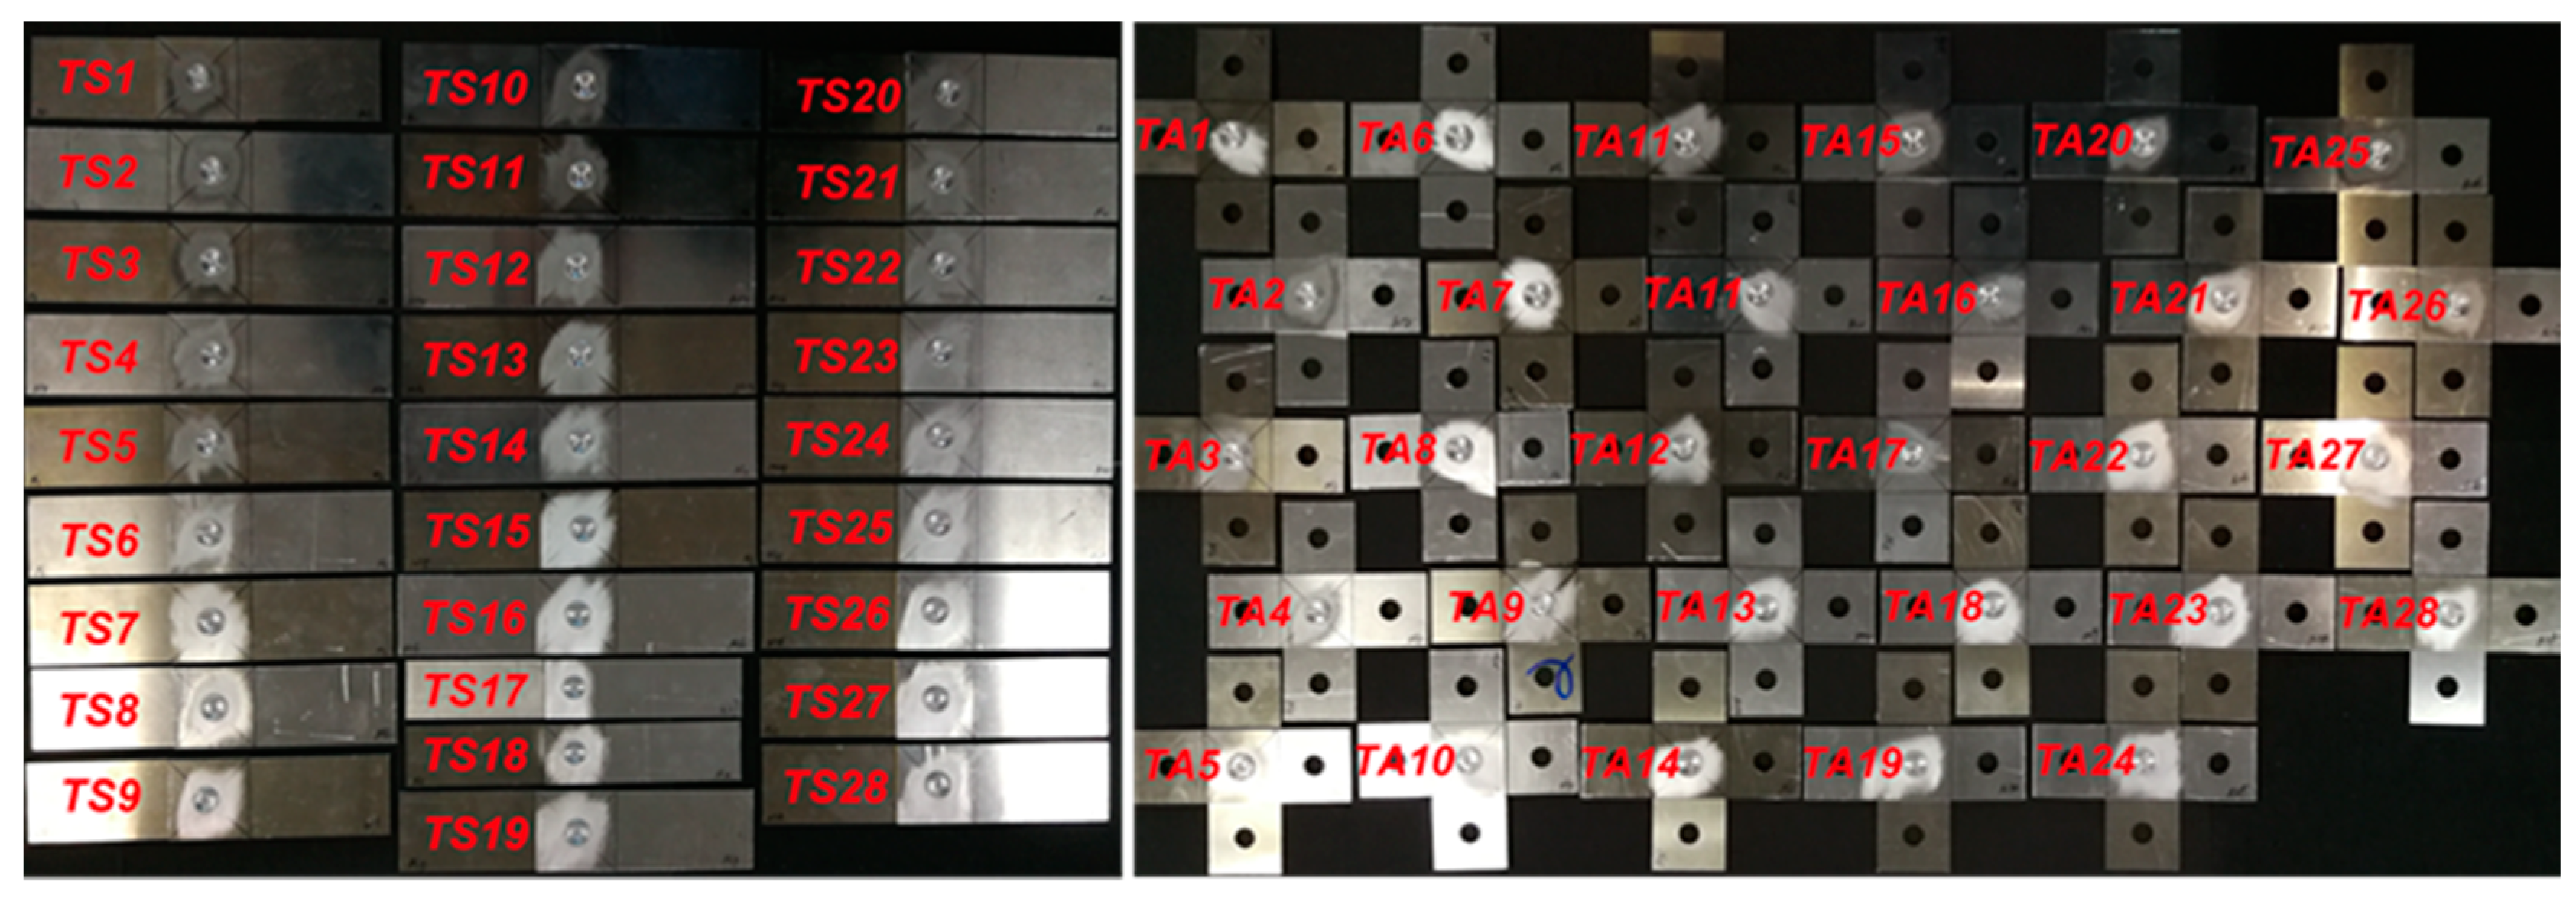
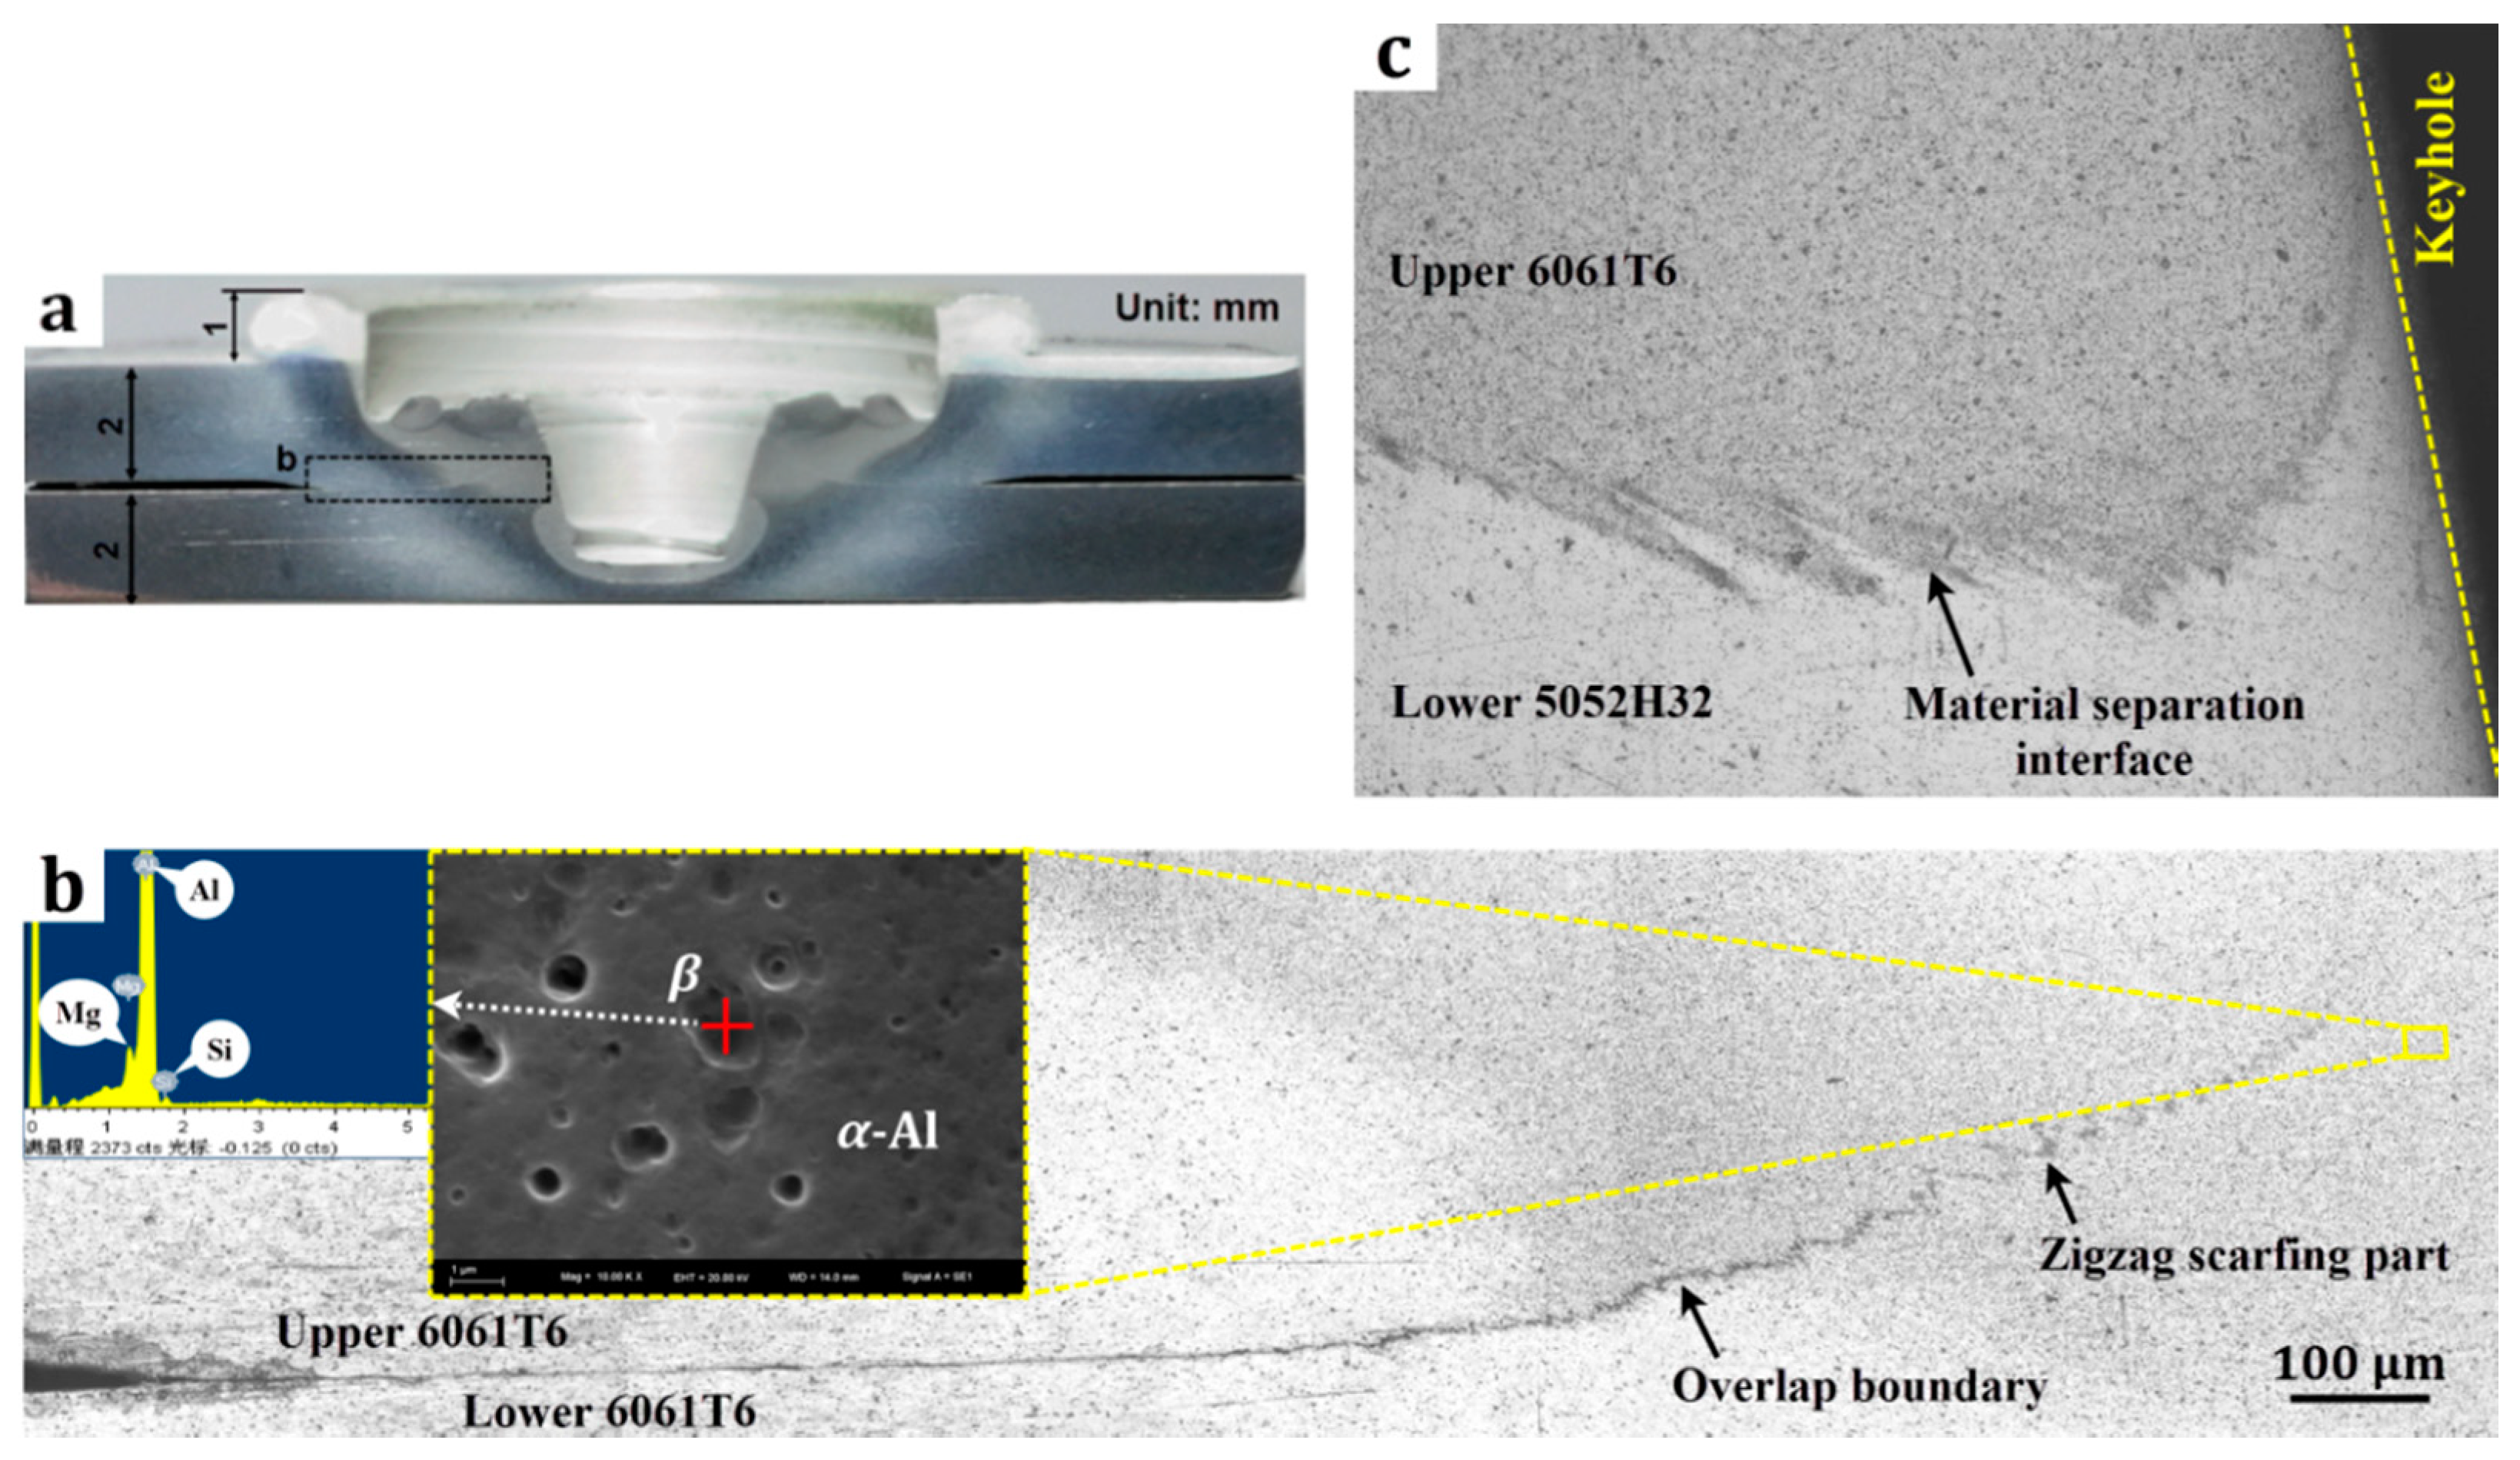
3.1. Microstructural Investigation of Bonding Interface

Microstructural analysis of two welded similar and dissimilar alloy samples was conducted to check the effectiveness and weld quality of the formed joints. Figure 4a displays the macroscopic appearance of the bonding interface of the similar AA 6061-T6 joint made at rotation speed of 1200 rpm, plunged depth of 0.3 mm and dwell time of 3 s. The existence of the keyhole caused by the typical FSSW process will undoubtedly weaken part of the bearing capacity due to the reduction of its bearing area. However, some studies [25,26] have also shown that the lap shear strength produced by the refill FSSW is not greatly improved due to its dependence on the size of the hook defect. As observed from Figure 4a, the visible lap boundaries between upper and lower plates gradually disappeared. Besides, it is well known that other fusion welds are generally accompanied by obvious thermal defects such as voids, cracks or distortion [5], which were not detected in this case, indicating a higher-quality joint was achieved.
In order to further observe the bonding transition and finer structure at interface, the post-weld microstructure adjacent to the lap plane was investigated. More detailed microscopic and EDS results are shown in Figure 4b. As the distance from the weld center decreased, the modified metal exhibits more precipitates with respect to the base metal (6061), which may be attributed to an increase in heat input and plastic deformation. It can be seen from the SEM image with a higher magnification for the completely bonded region that the modified structure was mainly constituted by a mass of α-Al and evenly dispersed β particles as well as several micropores. It is proved by the weight ratio of the elements that the main component of the second phase was Mg2Si. The above distribution phenomenon and its measurement result were jointly verified by Tao et al. [27] and Sun et al. [28]. Moreover, the up-curved hook portion of the lap boundary exhibits a zigzag scarfing feature. The above structural feature, on the other hand, facilitates the mechanical interlocking to reduce the drawback of its weak bonding.
Similarly, as shown in Figure 4c, the bonding state of the joint using dissimilar aluminum alloys was observed. Despite the obvious material separation, different grades of metal have achieved effective intercalation through fluidity. It can be foreseeable that these differences in microstructure will lead to different mechanical behaviors of formed joints using distinct material combinations, which will be investigated below.

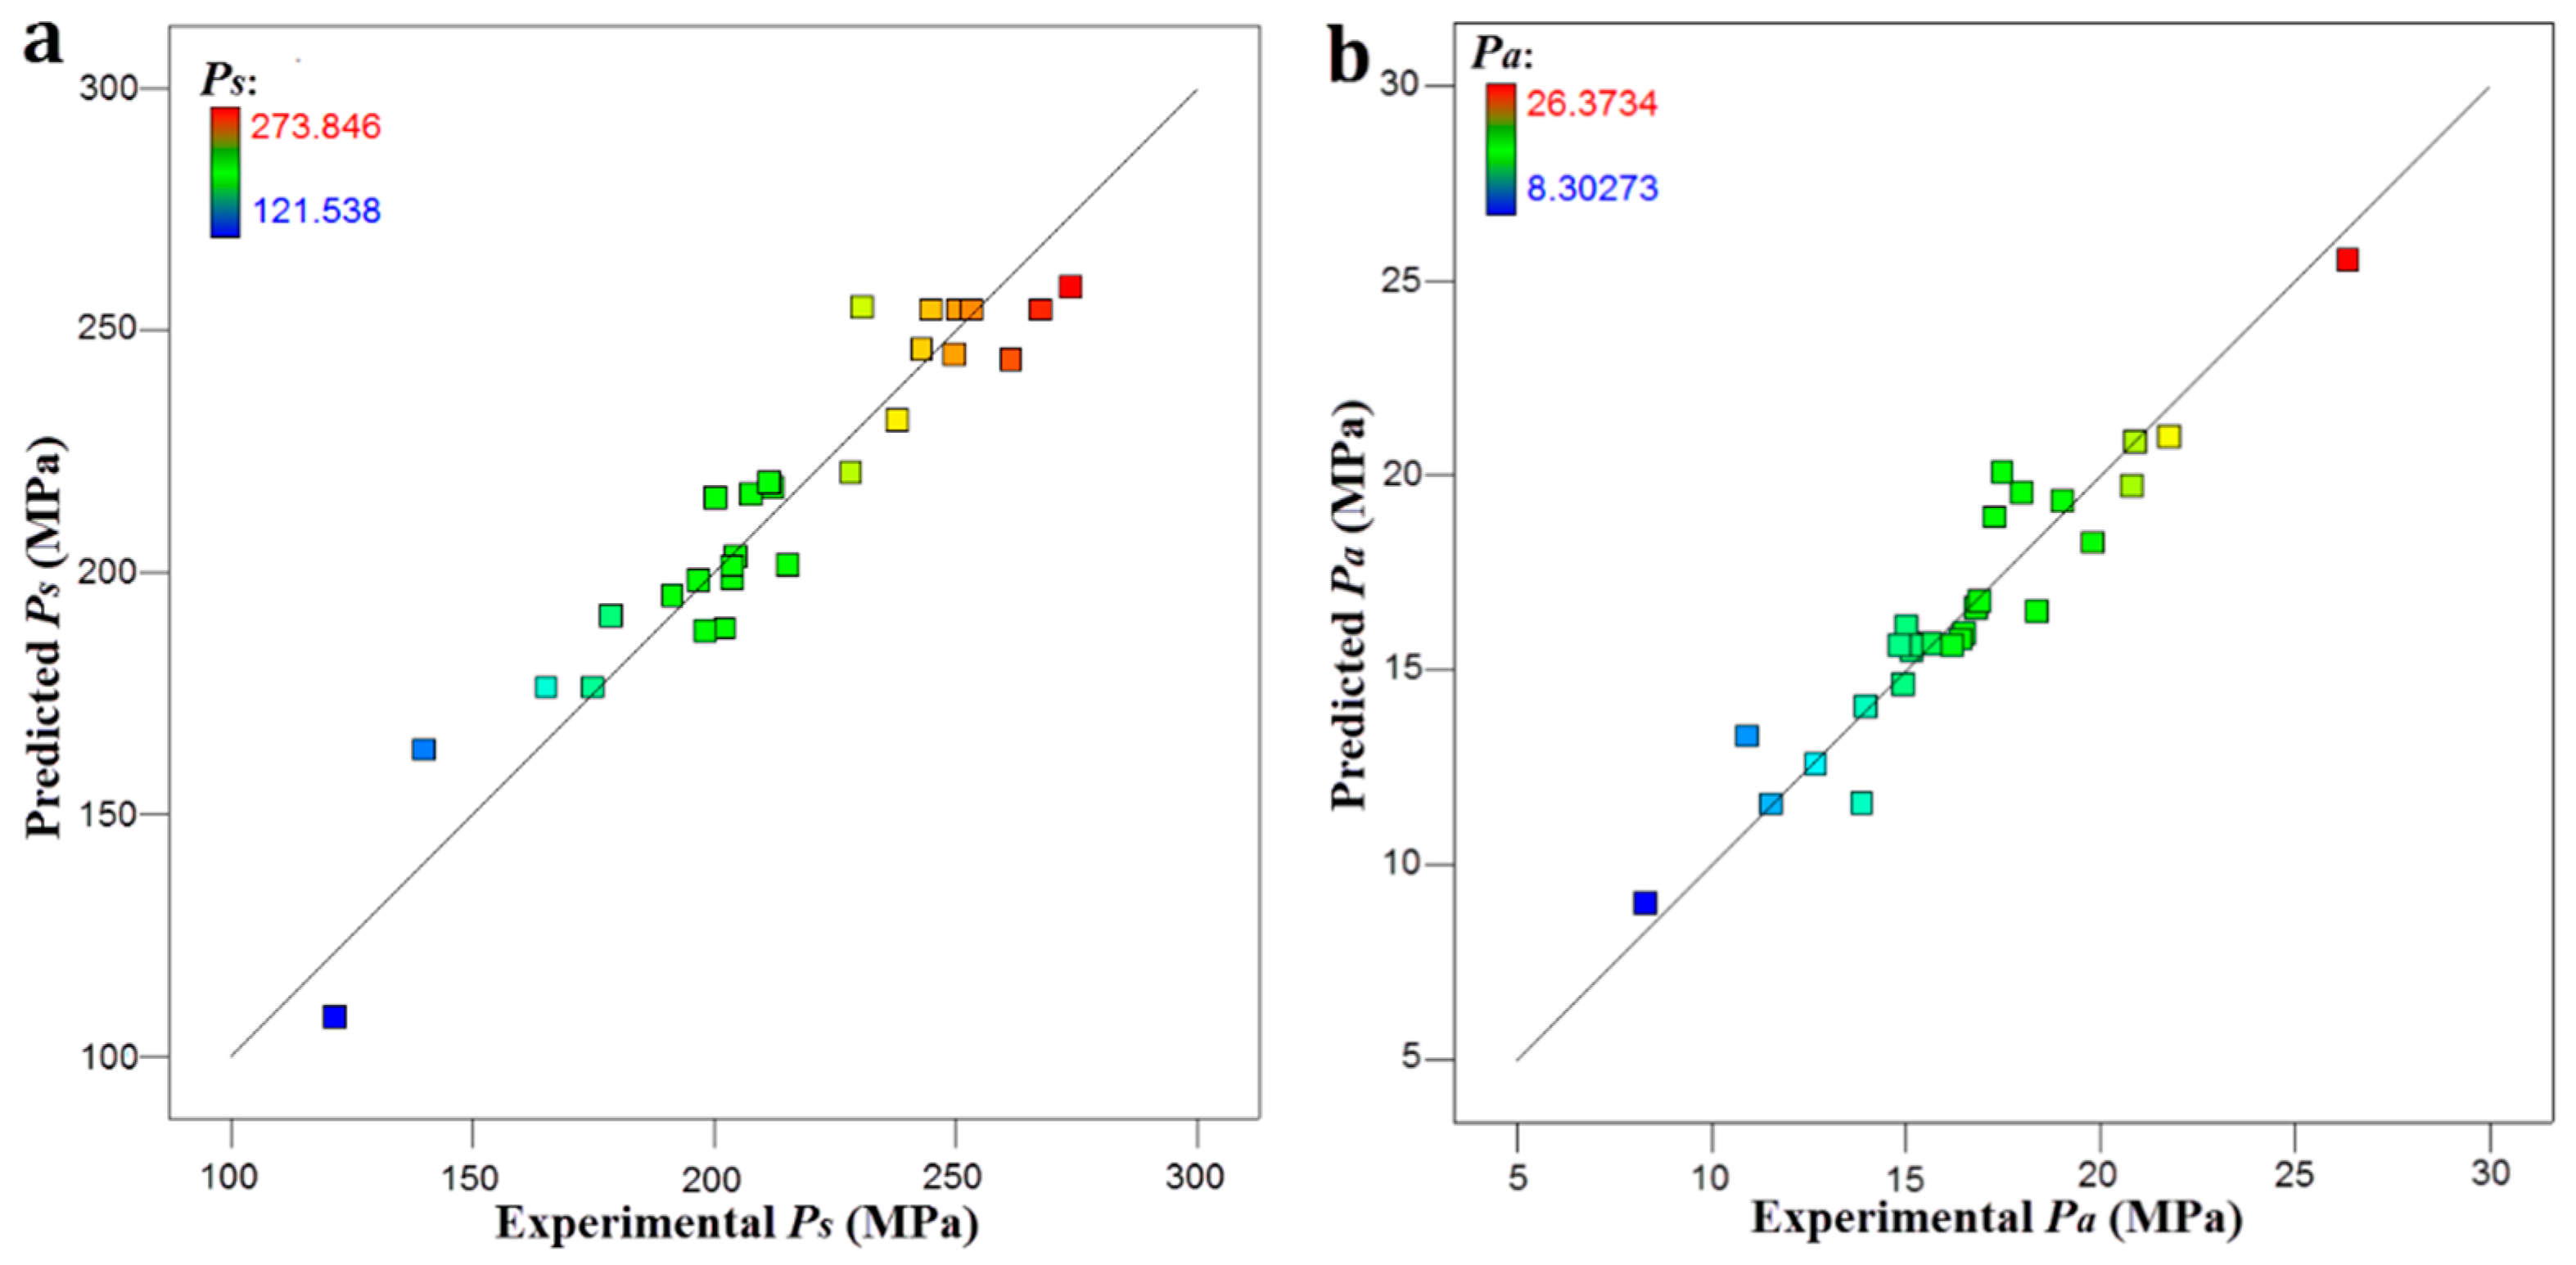
3.2. Modeling Using RSM

Using the 28 sets of experimental data given in Table 5, RSM was applied to develop the empirical relationship between process parameters and multi-axis strength. This procedure was conducted in the Design Expert software. Meanwhile, ANOVA was employed to test the significance of the models built. In this work, since the joint type (determined by the properties of welded plates) was incoordinate with the type of other factors studied, it was considered to have a greater impact on the results than other process parameters, causing indirect weakening of the significance level of the process. Therefore, the confidence level desired for the entire model was taken as 0.90 (general significance). Values greater than 0.10 indicate that the model terms are non-significant.
According to the ANOVA results of both response models shown in Table 6, in terms of Ps, the model F-value implies the model is significant and there is only a 0.02% chance that an F-value this large could occur due to noise. The very low probability value indicates the shear strength model is of high significance. From the perspective of goodness of fit, the value of determination coefficient (R2) greater than 0.9 and the adjusted R2 greater than 0.85 are generally acceptable, although the regression relation cannot account for 8.2% of variability or total deviation. Similarly, the regression model of peel strength has also proved to be generally significant, suggesting that both developed models are adequate to cover the design space. By checking the p-value of each model item to eliminate the non-significant items, the final multi-axis mechanical response expressions were attained as follows:
P s = 245.91 13.77 J 6.91 N + 13.32 H 7.42 T 28.25 J 2 5.17 H 2 4.64 T 2
P a = 15.51 + 0.64 J 1.49 N + 0.89 H + 1.01 J N + 1.07 J H 1.23 N H 1.32 J 2 + 1.75 N 2 + 0.68 H 2
In addition to the above statistical analysis, the contribution rate of each individual item to the responses is intuitively evaluated as listed in Table 6. As a result, the effect of the joint structure (J) on Ps is most significant with a positive contribution percentage of 77.1%, followed by plunged depth (H), dwell time (T) and rotation speed (N) in order. Whereas for Pa, the influence of rotation speed (N) is especially obvious, followed by J, H, and T. The above analysis demonstrates that the importance of individual process parameter to the bearing capacity of joints in different directions is completely inconsistent, further illustrating the necessity of multi-objective optimization to properly balance the effects of the two and find a compromise solution.
In order to verify the reliability of the models, the correlation between the predicted and experimental values is shown in Figure 5, indicating that the sample points approached the 45 degree central axis. This illustrates a good agreement between the predicted and actual values. To further test the models, another four sets of sample points were randomly selected to verify their accuracy. As per the relative error results of Table 7, the average error of Ps and Pa are 5.64% and 6.77%, and the maximum errors of Ps and Pa are 9.71% and 8.82%, respectively. In this study, the range of relative errors below 10% is acceptable. Therefore, the established RSM is a suitable approximation to the true relationship and can be used for predicting the multi-axis tensile strength of FSSW joints.

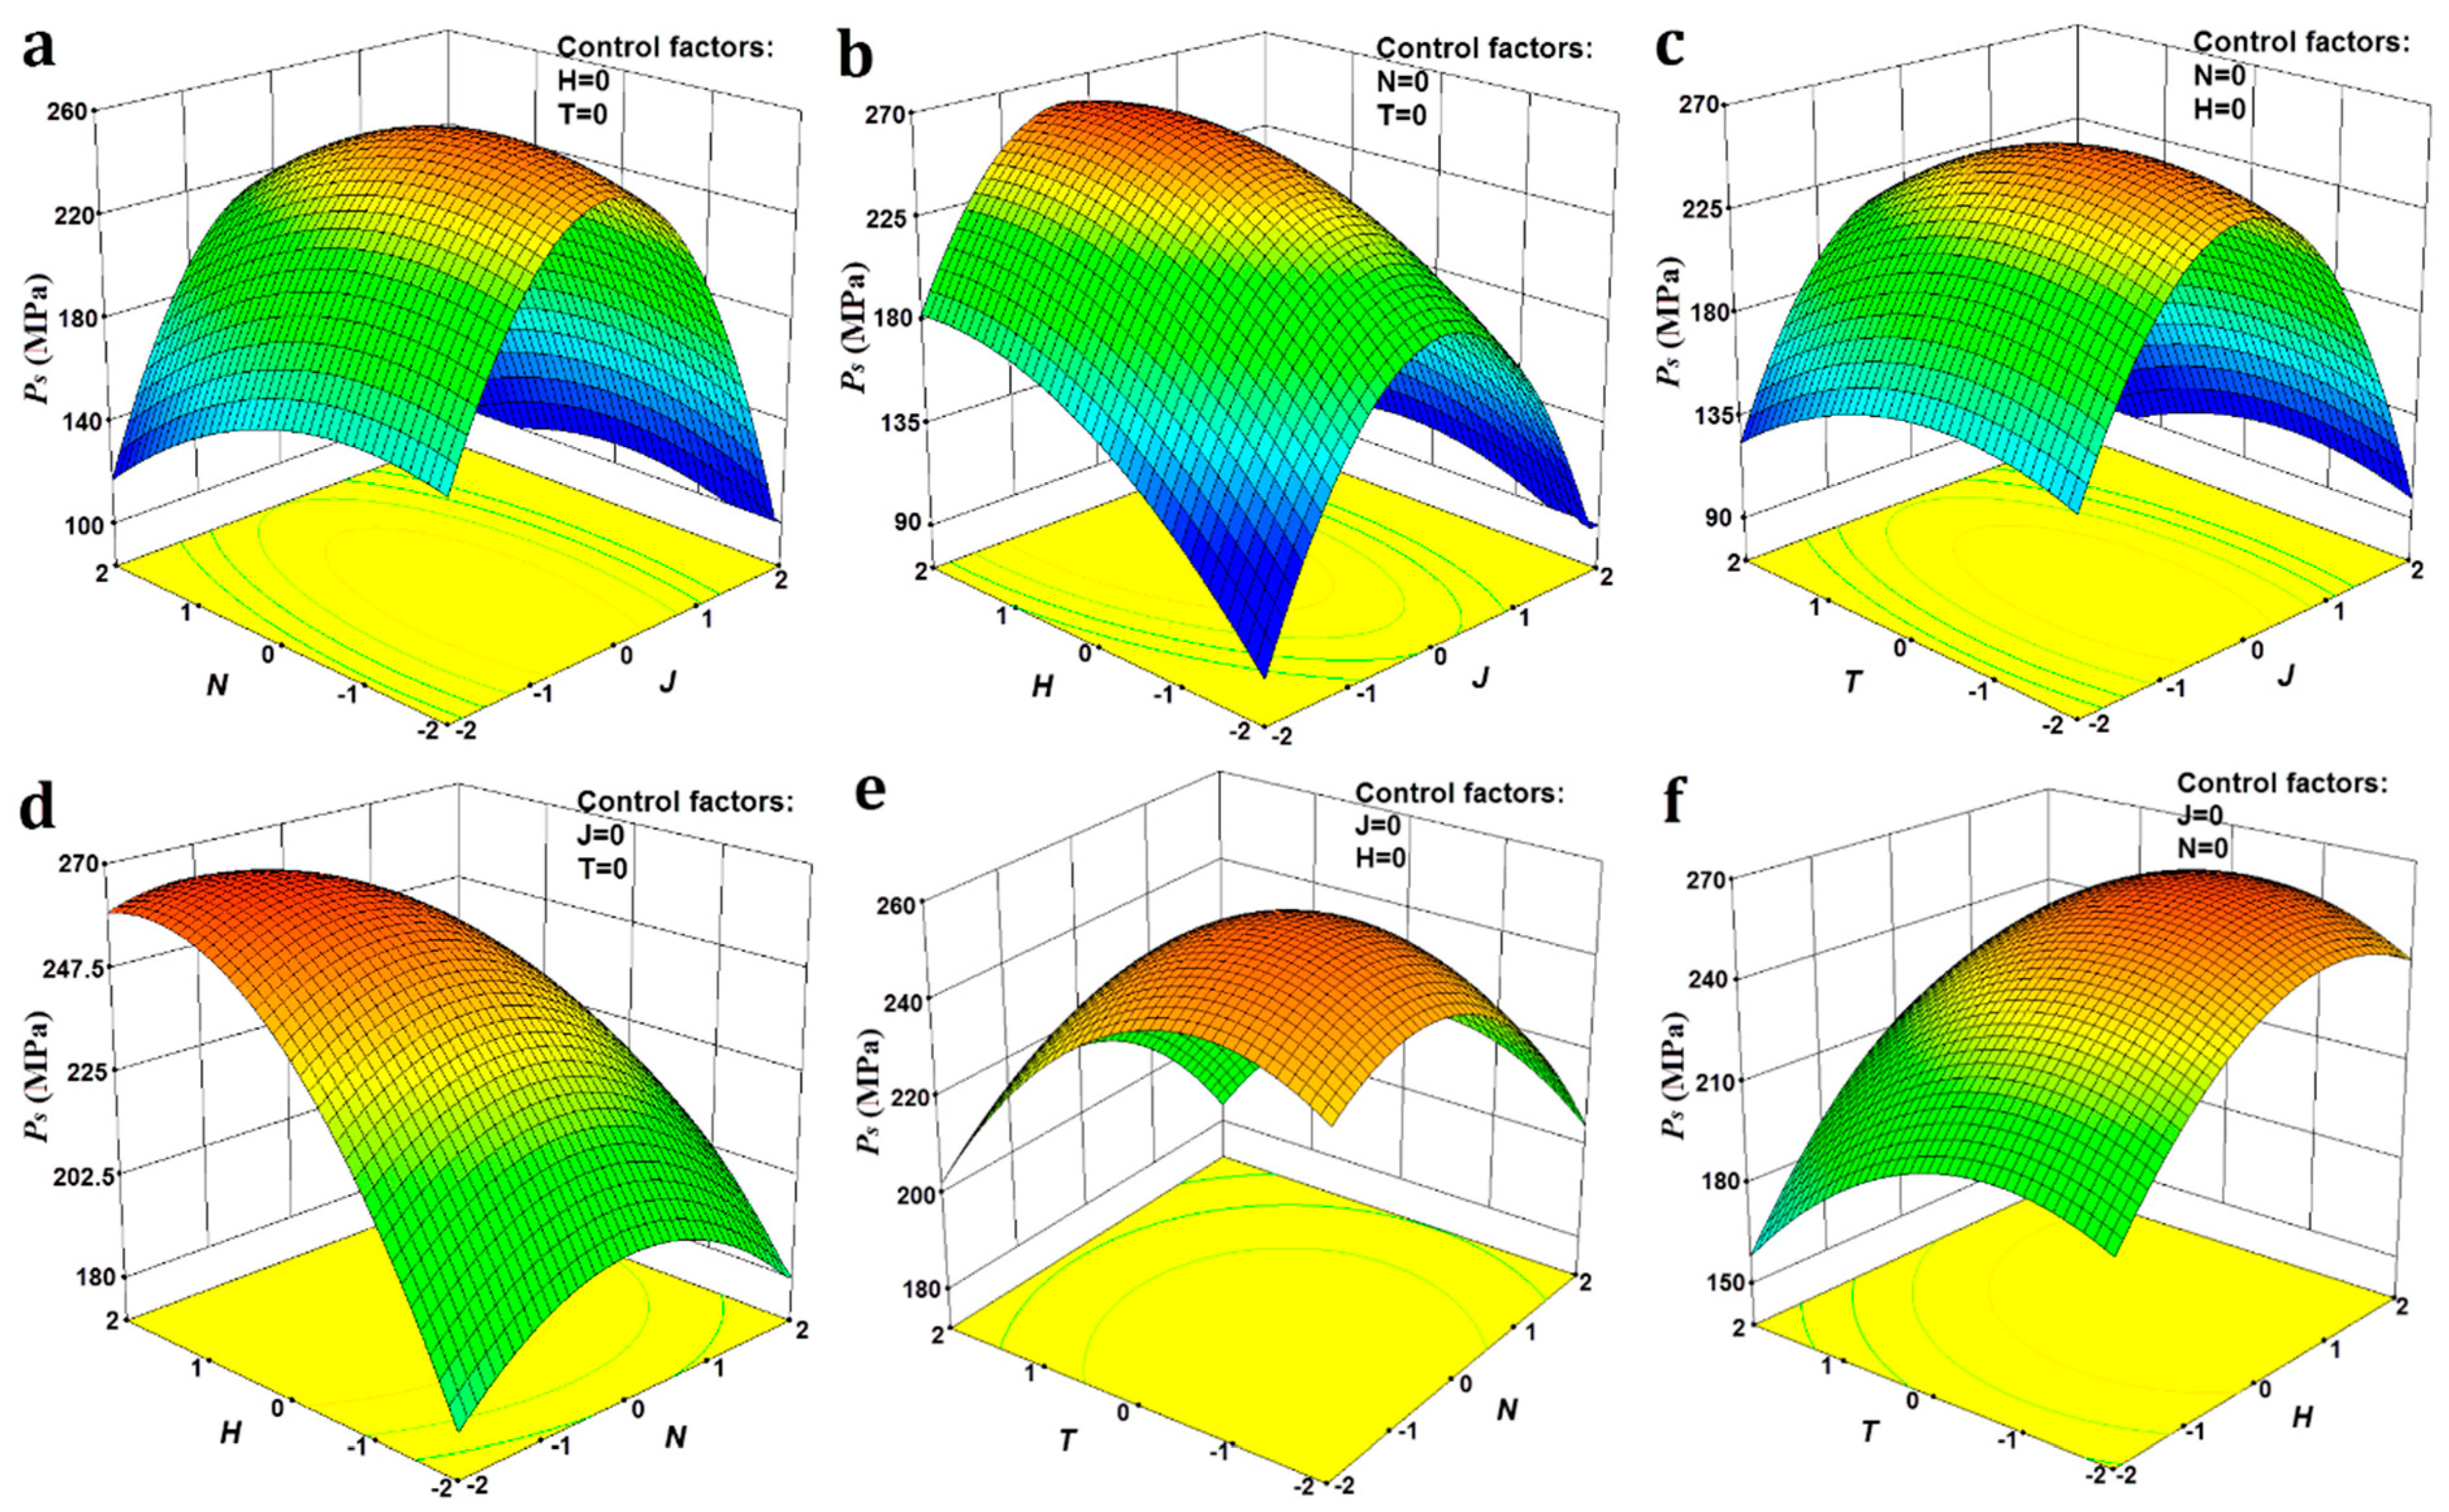
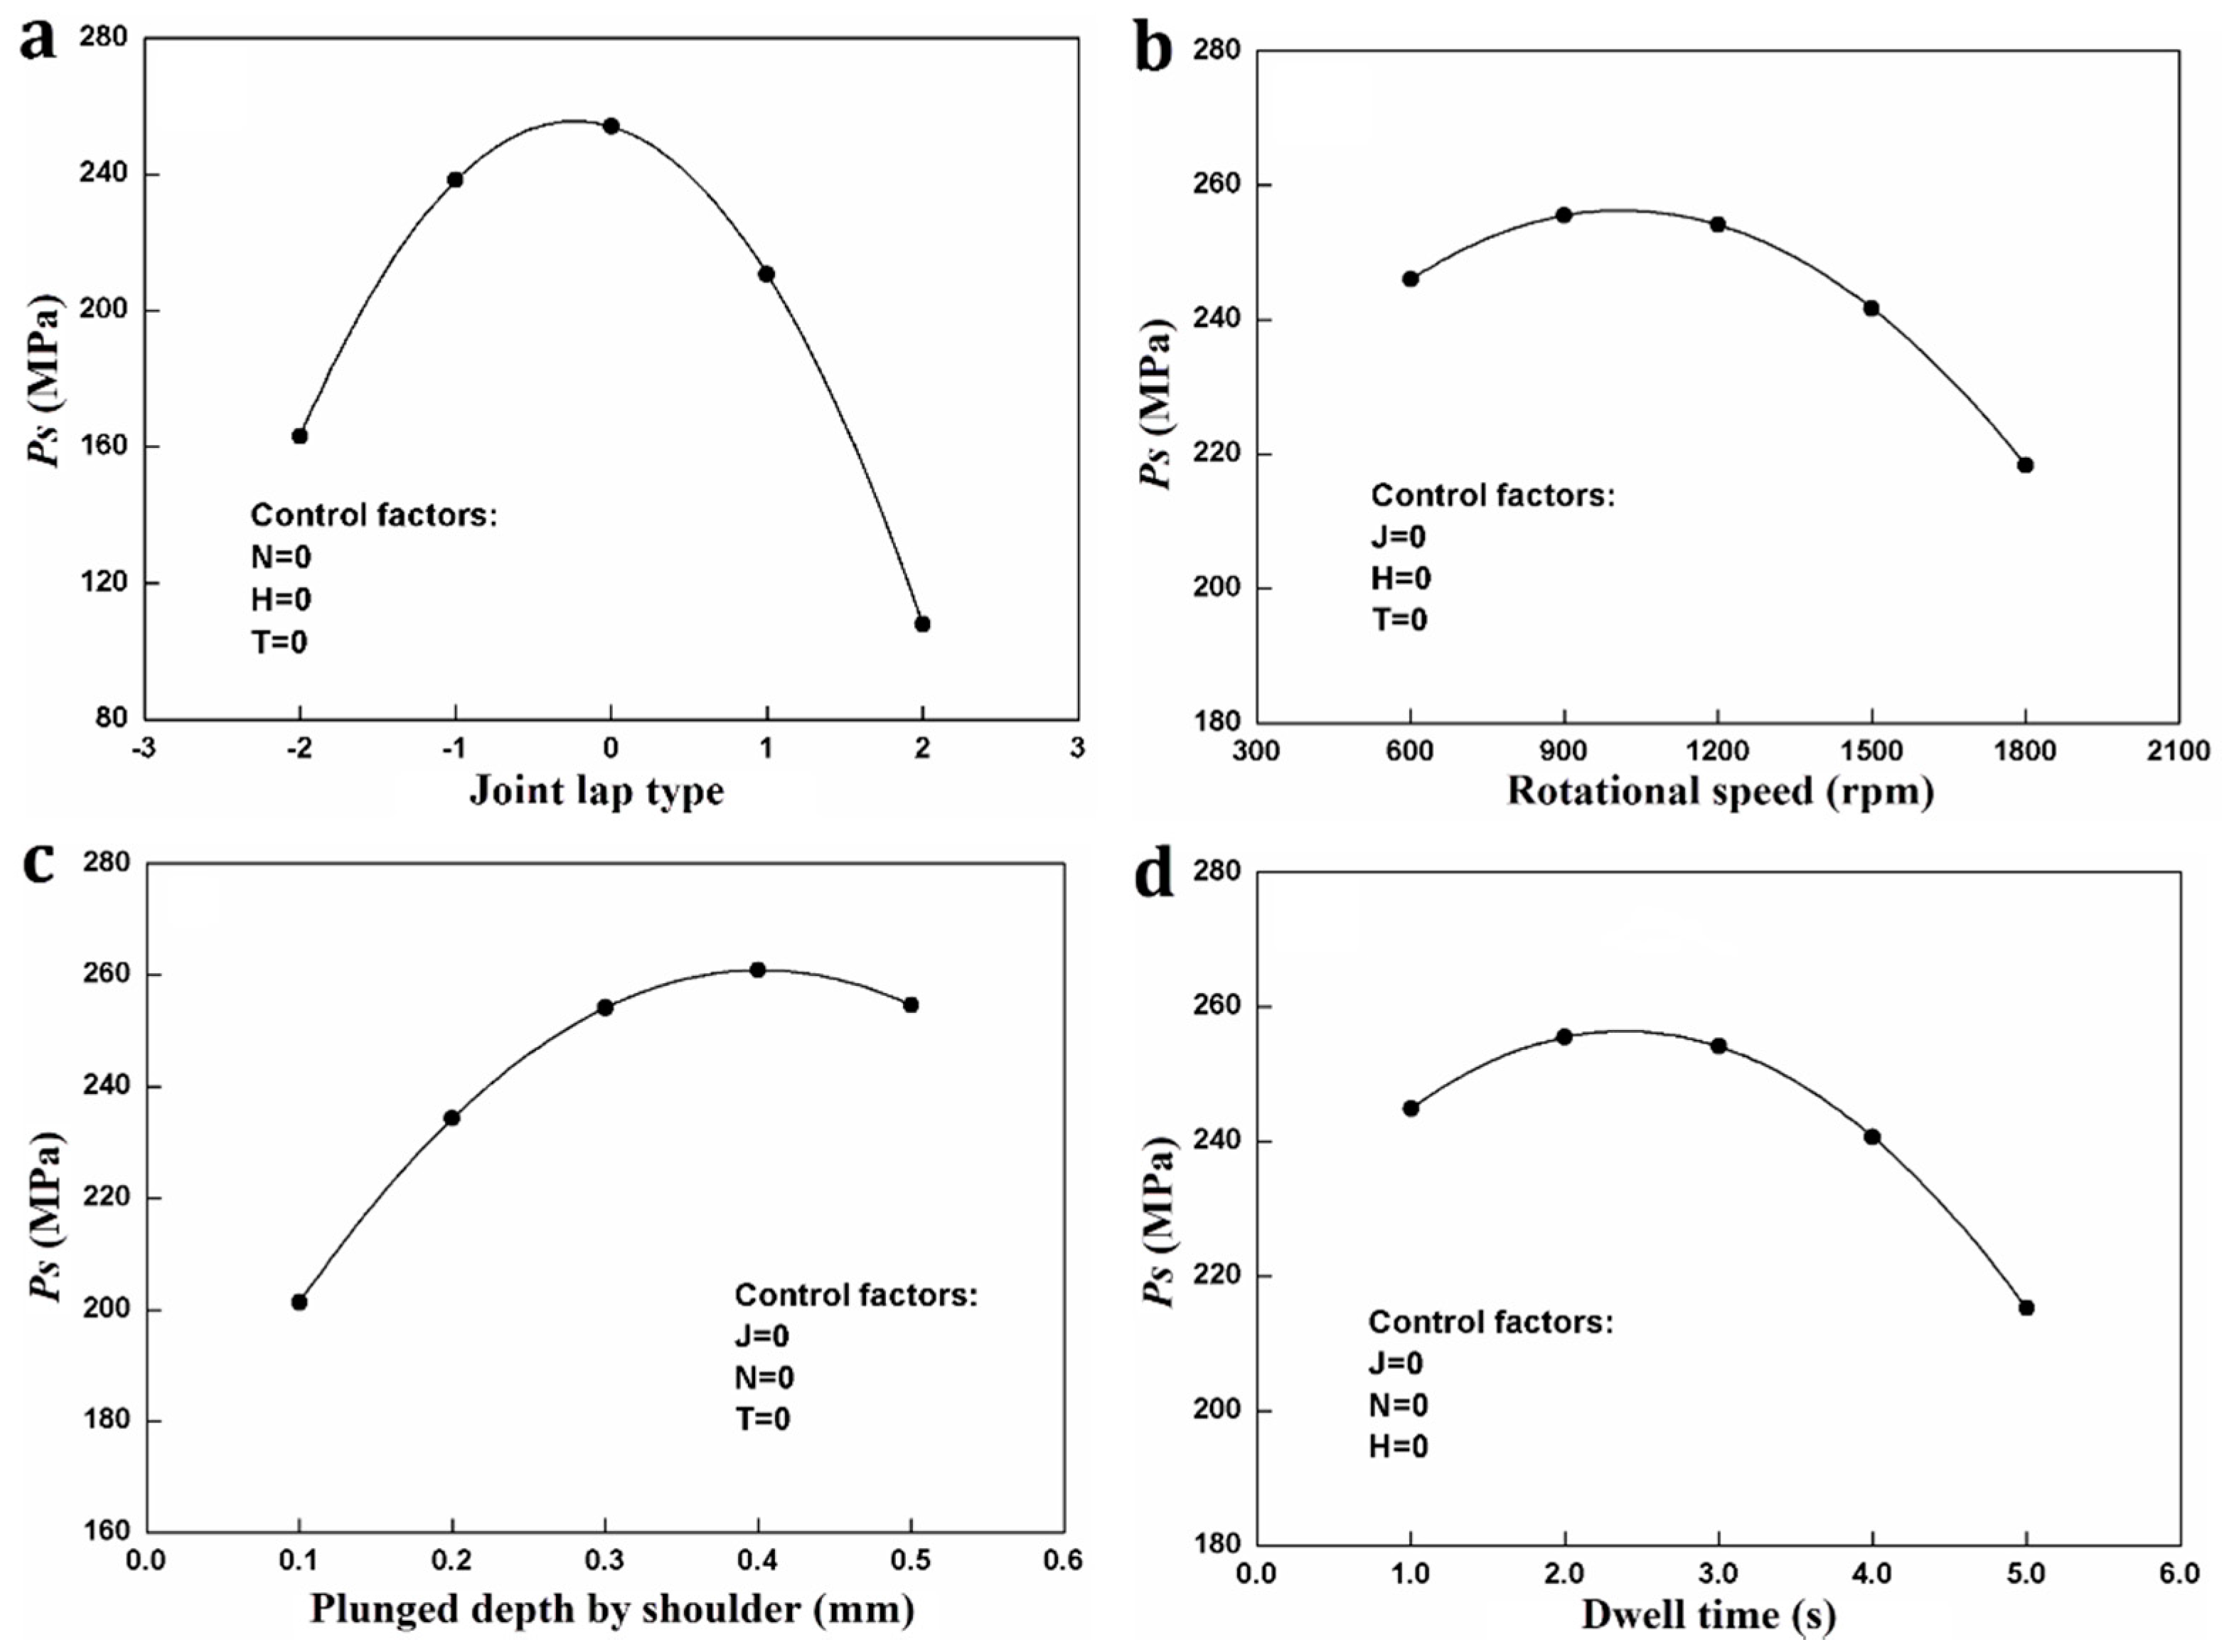
3.3. Effects of Process Parameters on Responses

Since the subsequent load analysis results in Section 4.2 below show that the automotive solder joints are mainly subjected to shear stress during service, this section focuses on the influence mechanism of FSSW welding parameters on the resulting shear strength. Figure 6 depicts the response surface plots developed for Ps. It is clear that all lower strength occurs at the extreme levels of every two independent variables, with the maximum appearing at the intermediate levels. This demonstrates the rationality of the range of study parameters selected. It can also be noted that the gradient as the values decrease is relatively larger, providing a smaller process window for industrial applications, which implies the importance of parameter optimization using DOE approaches rather than empirical selection.
The main effect plots of each process parameter on the average lap shear strength can be seen in Figure 7. As the value of each factor increases, the Ps first ascends and then descends from the middle of the factor interval. The results show that the form of the materials to be welded, including base metal strength and plate thickness, play a significant role in determining the tensile strength of welded joints. The Ps using the similar 2.0 mm plates typically reaches more than 80% of its corresponding raw material strength. Excessively high or too low process input variables will affect the amount of friction heat generated and the plastic fluidity together, which in turn affect the effective bond area and recrystallized grain size [29]. The above inferences are sufficient to demonstrate the significance of selecting proper parameters.

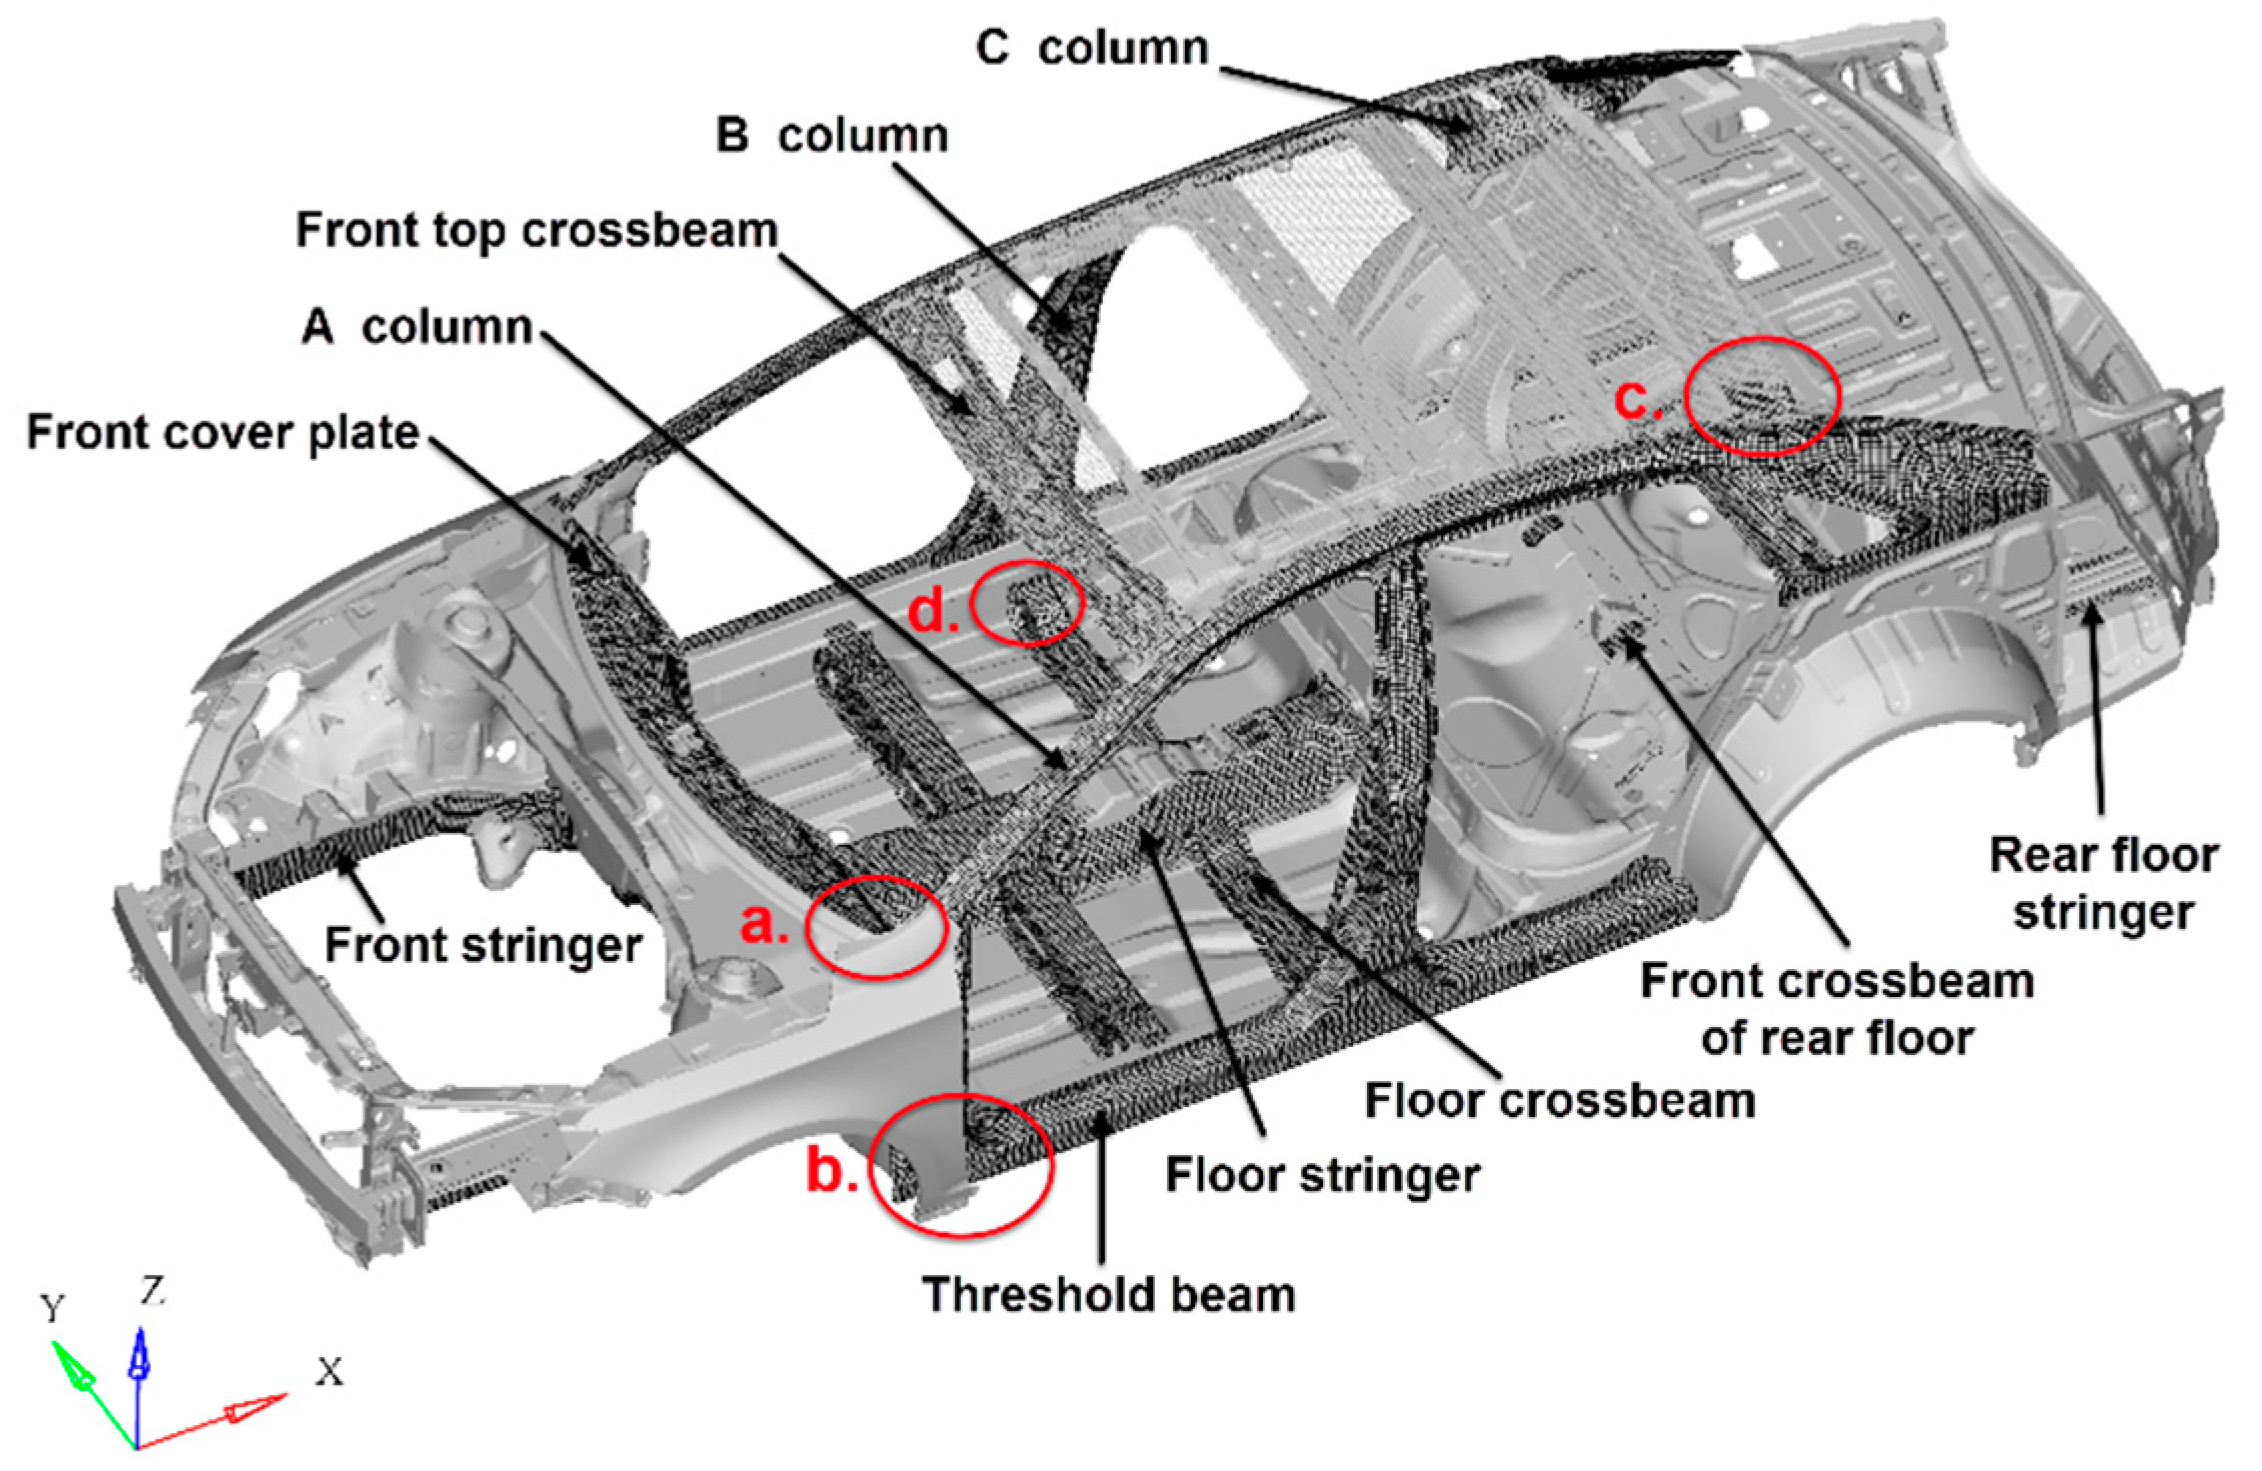
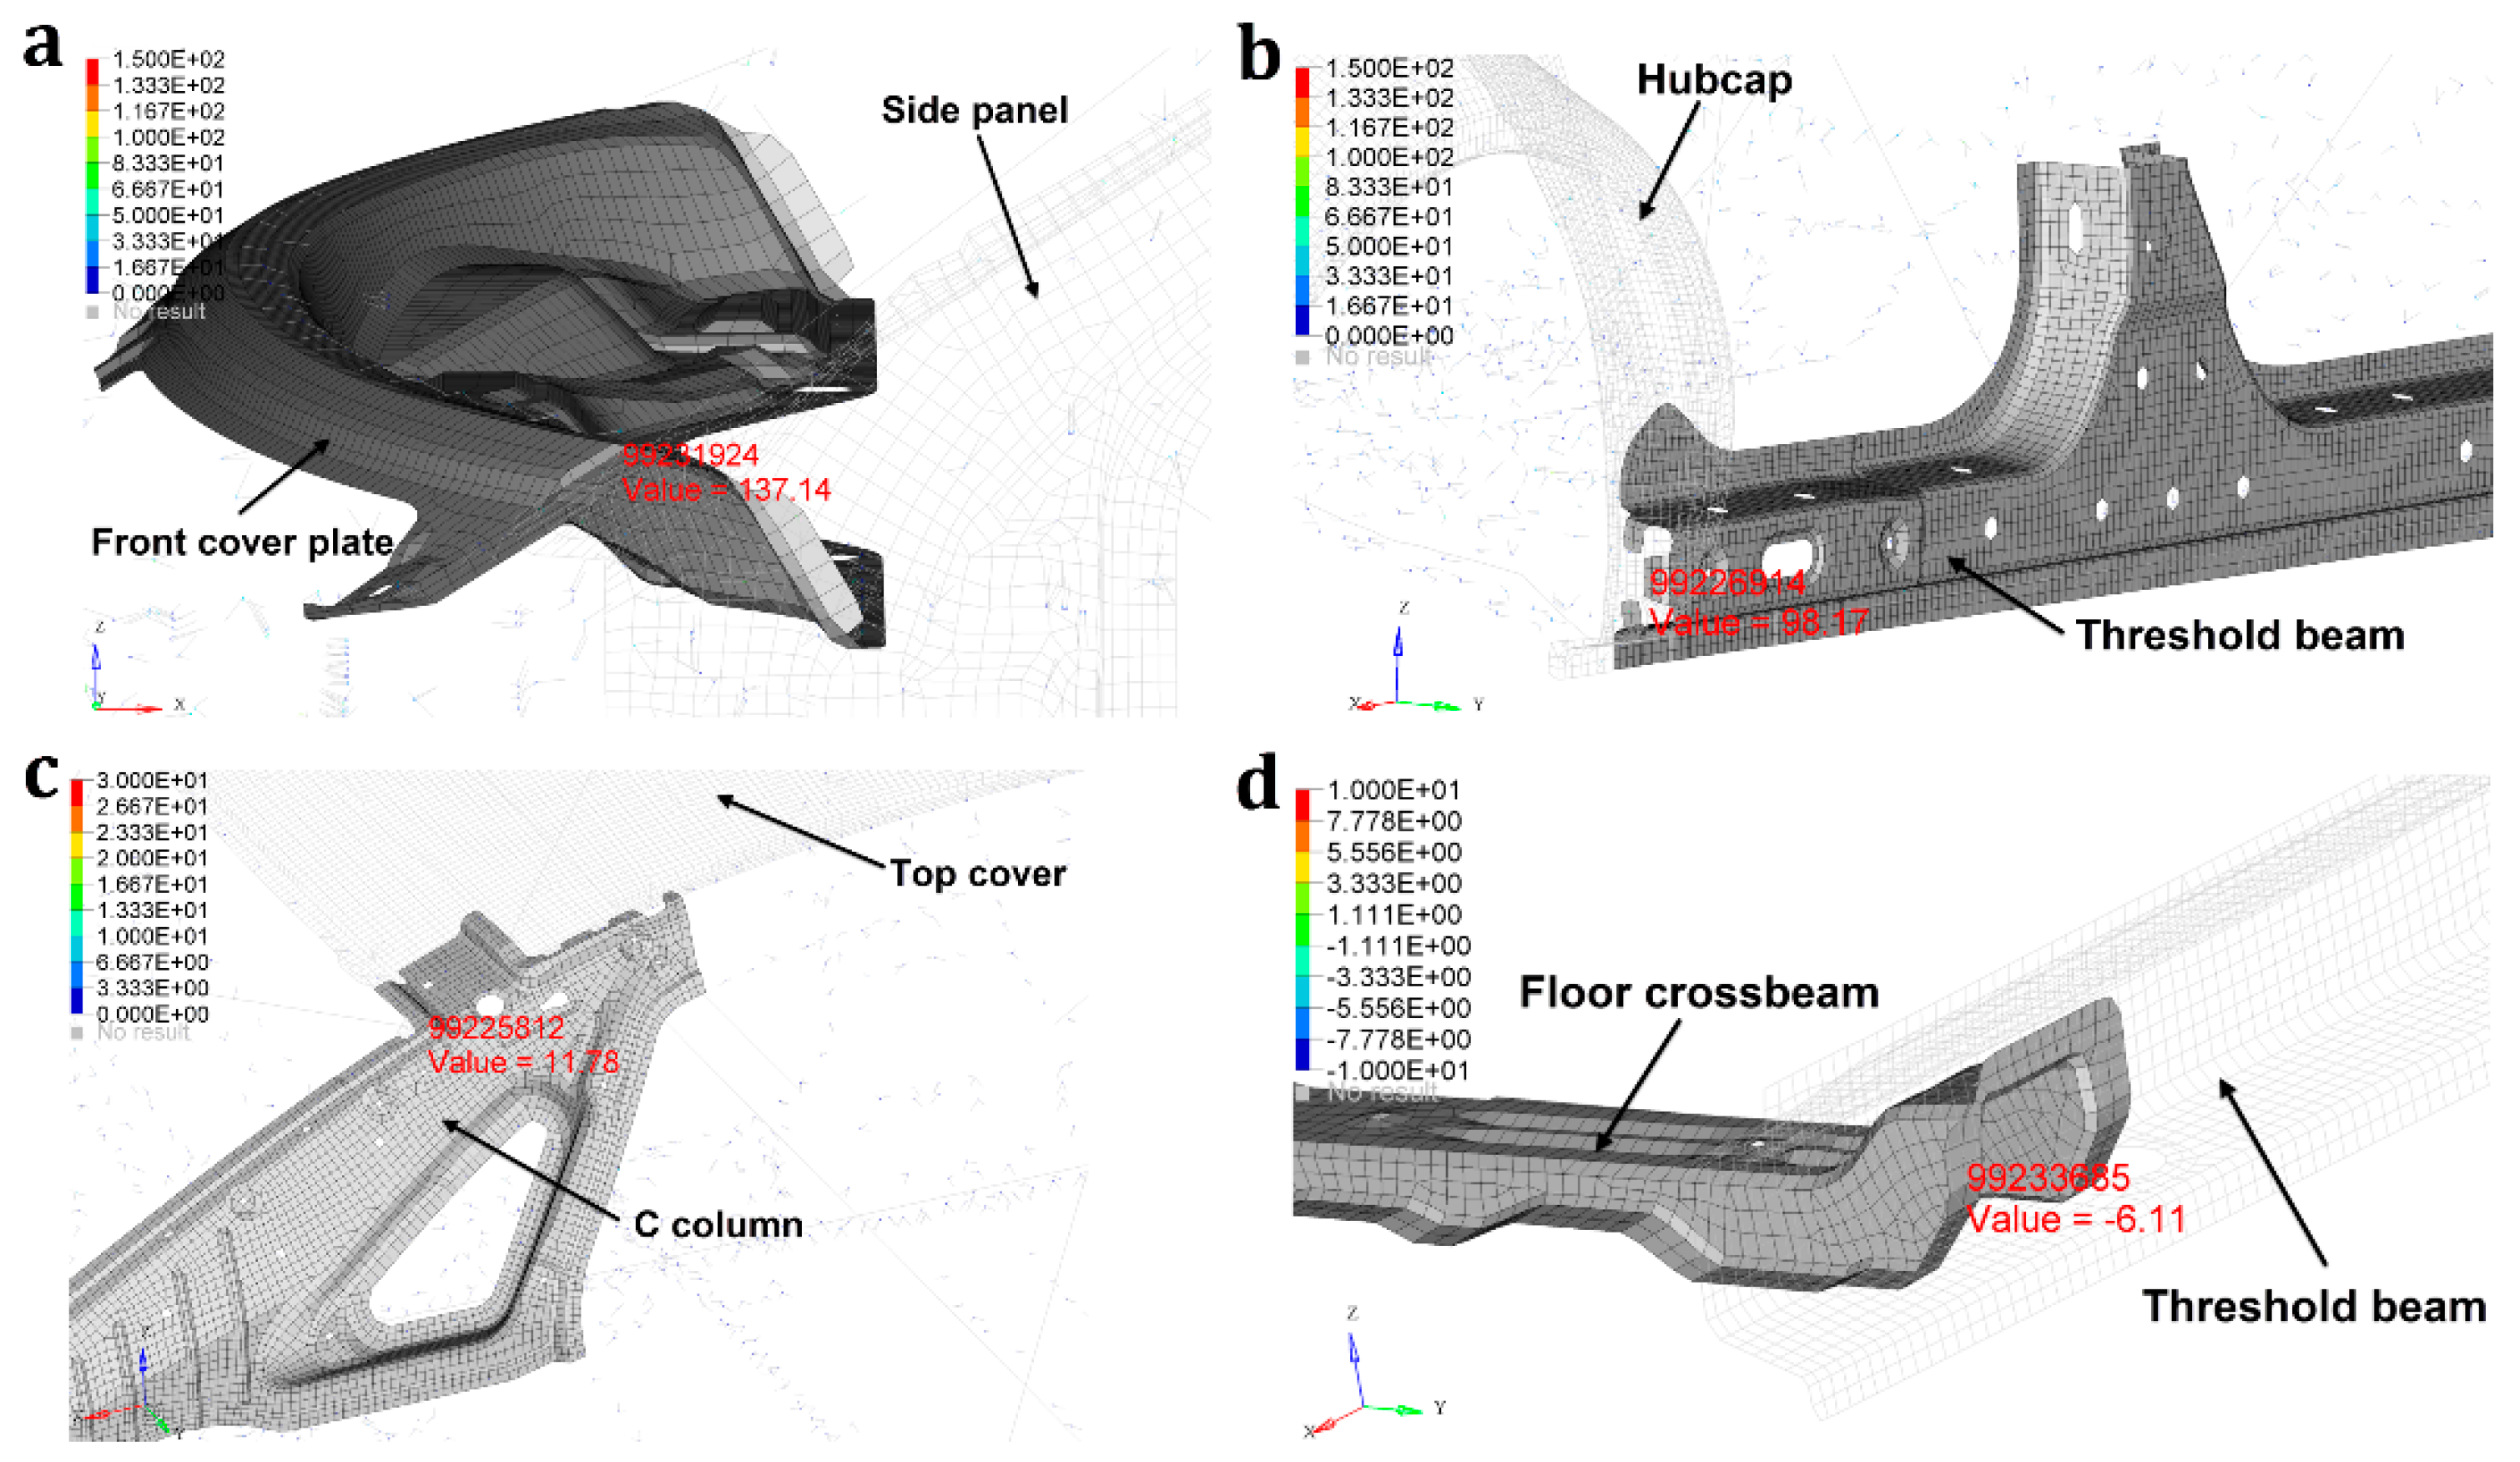
4. Loads Analysis of Automotive Joints

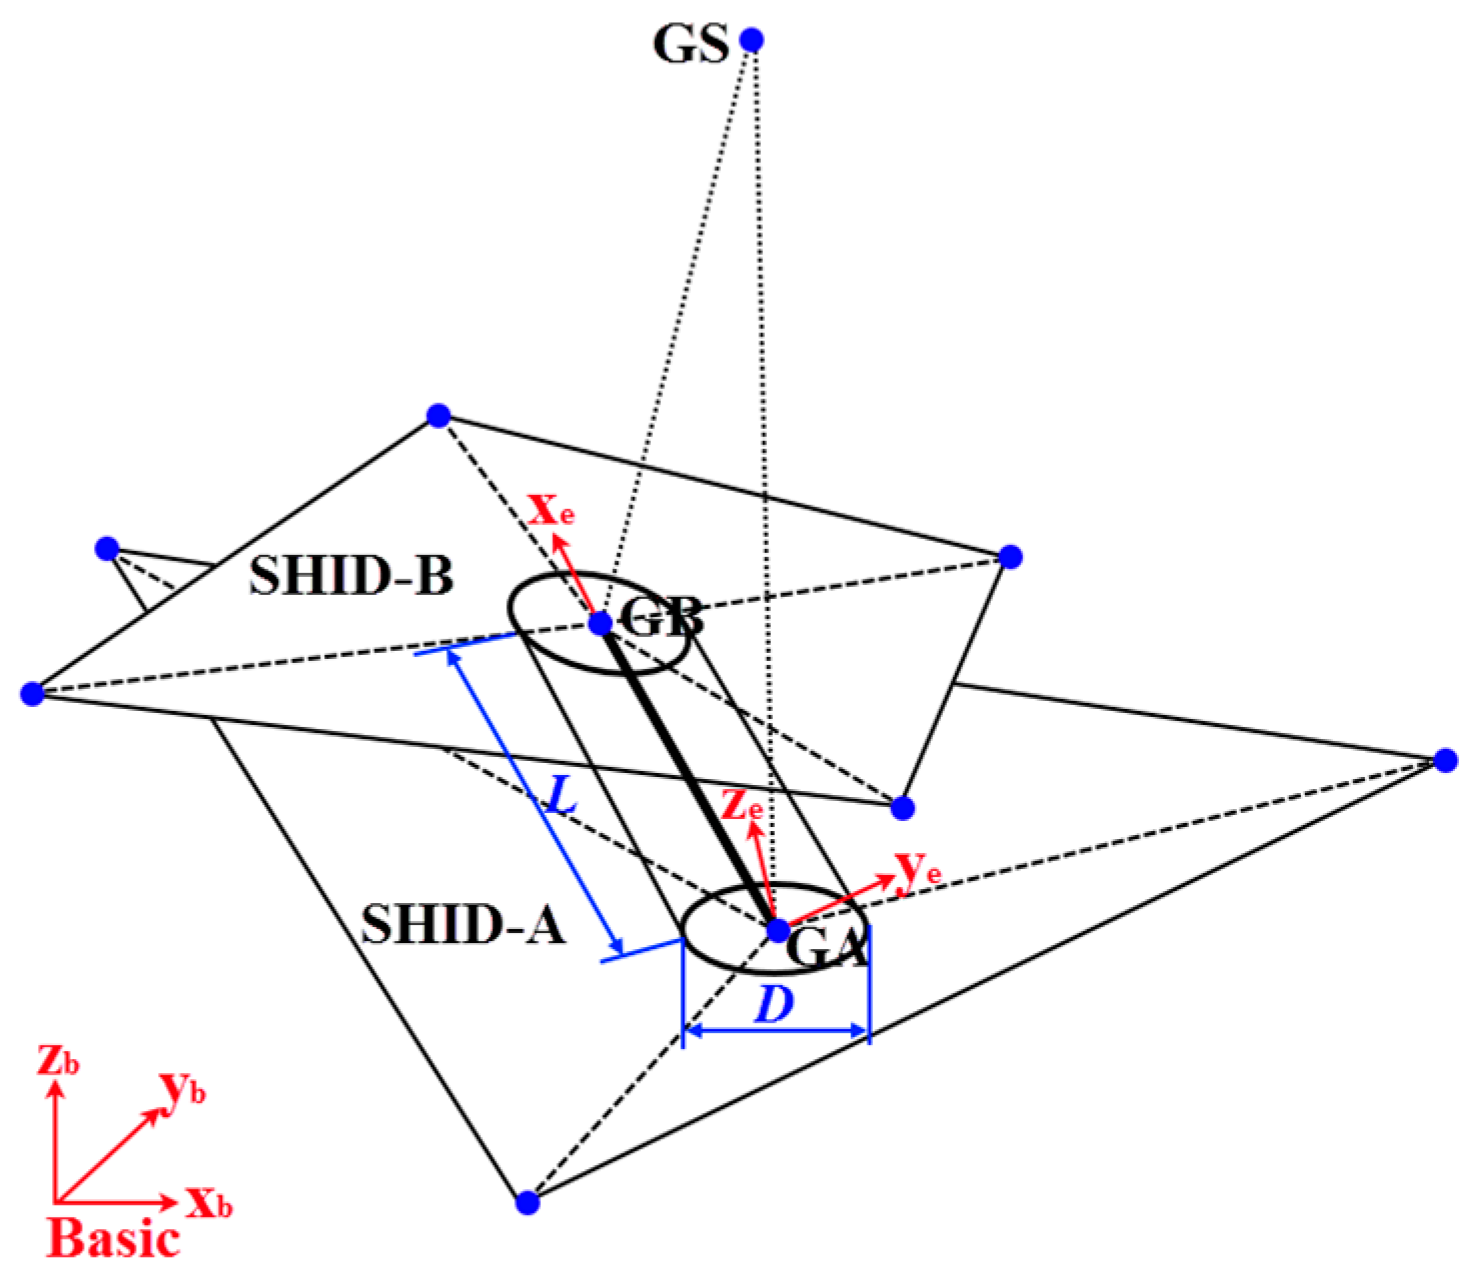
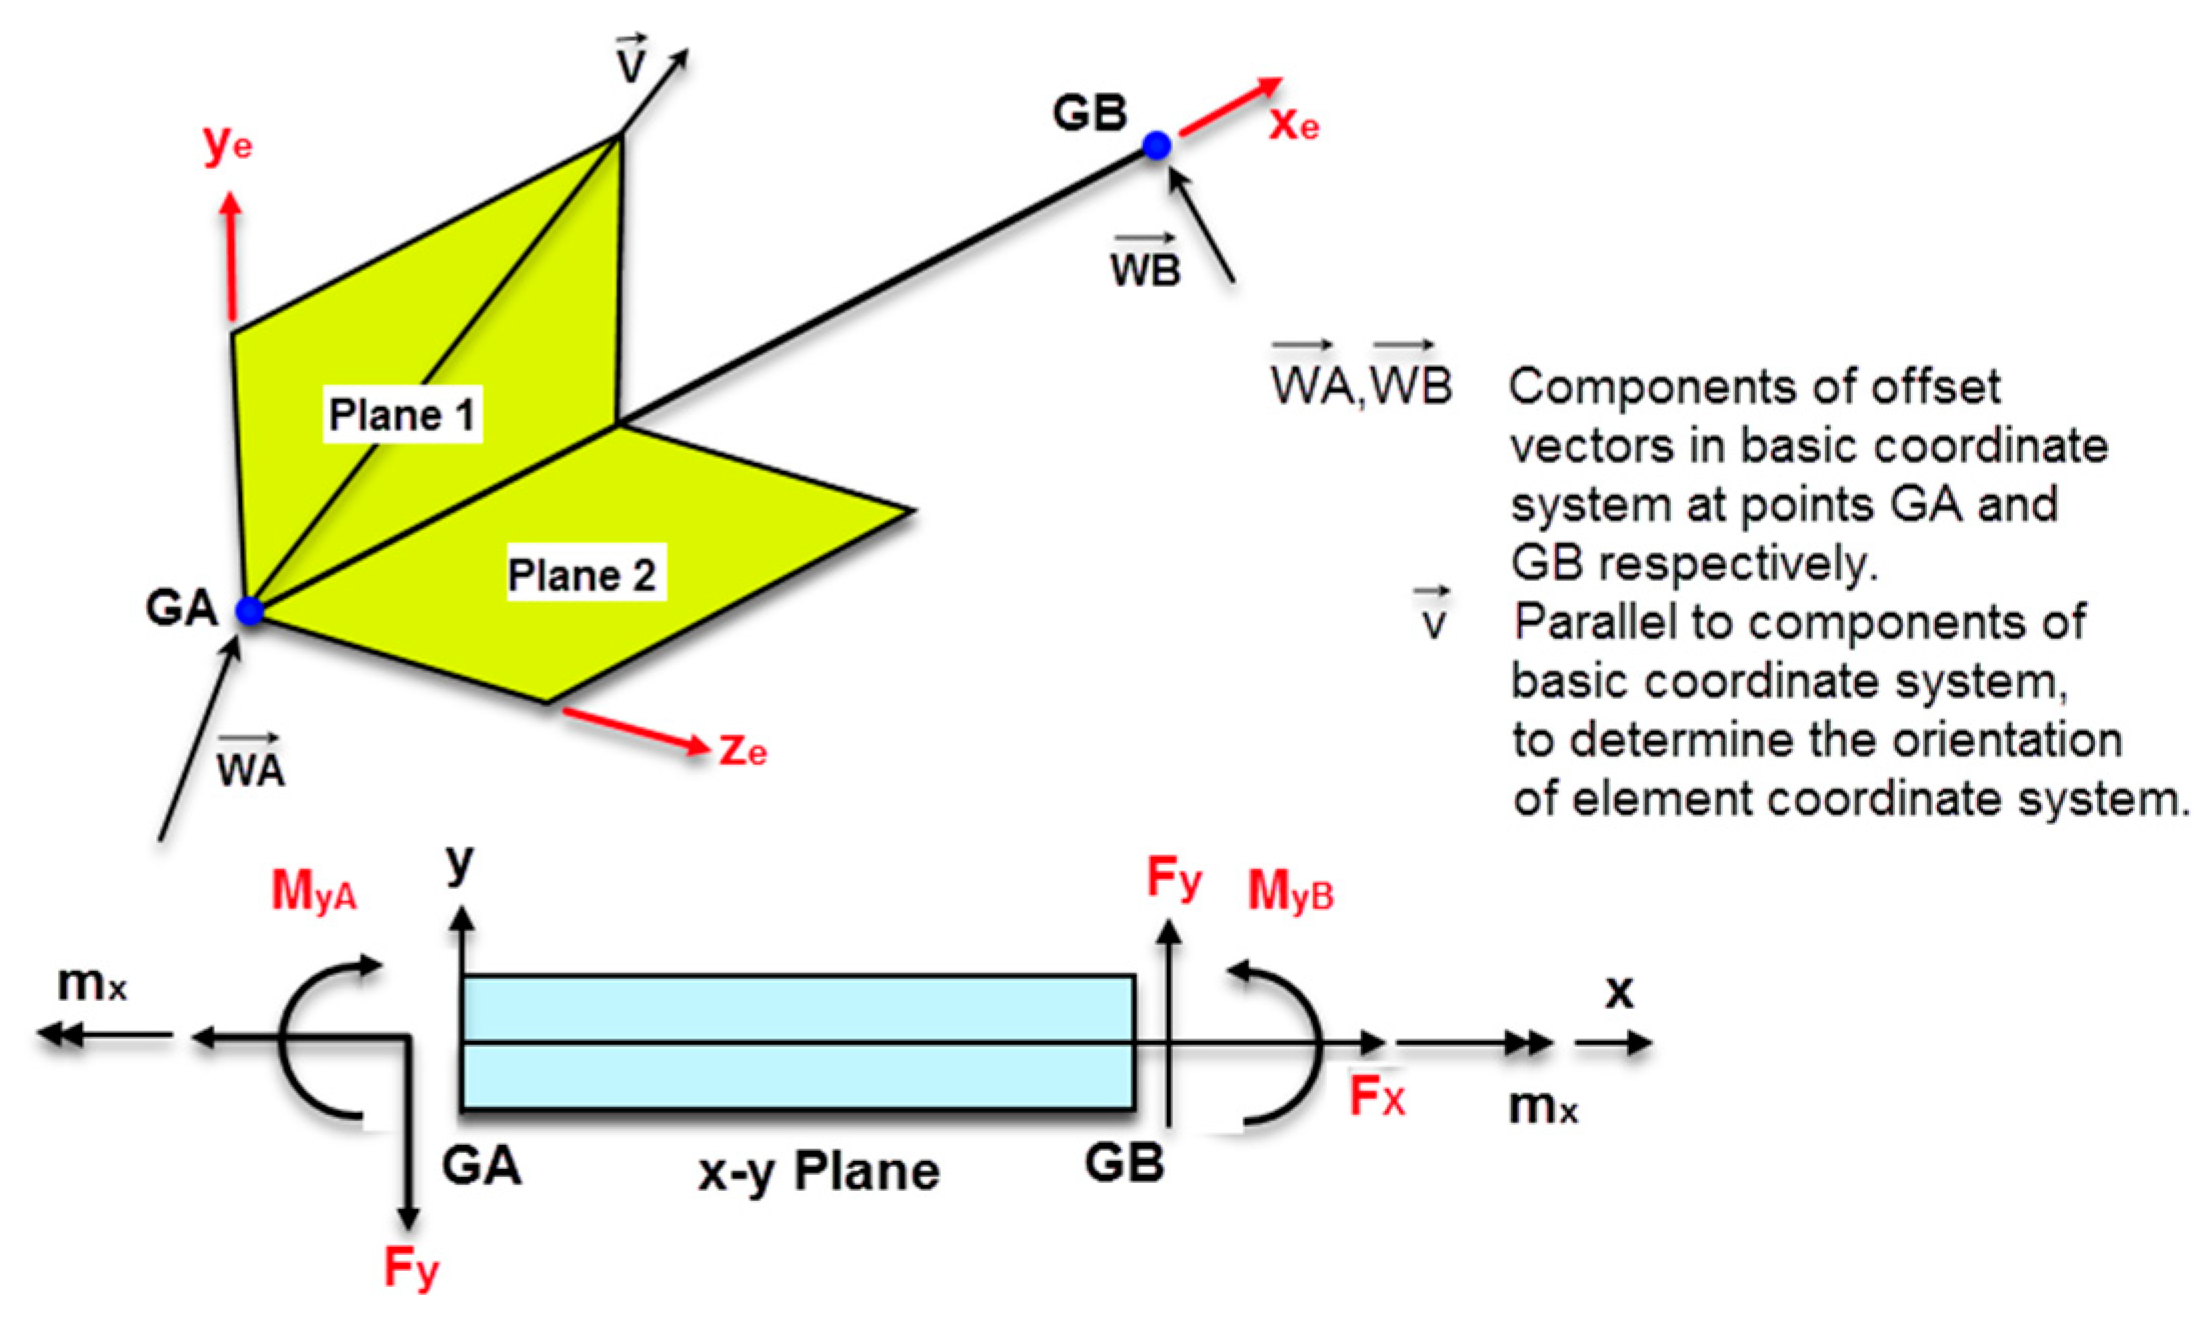
4.1. Connecting Element for Decoupling Joint Loads

In order to weigh the proportional relationship of the multi-axis performance in the following multi-objective optimization, it is necessary to investigate the load situation of automotive joints as the application object of FSSW joints, so that the optimized properties can be adapted to the actual working conditions. However, the output load transmitted through joints from the finite element (FE) code Hyperworks is based on the global coordinate system. Due to the inconsistency between the directions of shear plane and axial vector of each spot-joint and the global coordinate directions, the output three-dimensional force in arbitrary directions of space needs to be decoupled based on the local coordinate system of each solder joint instead of the basic coordinate system. Thereby, decoupled shear and axial forces can be obtained. To achieve this conversion mechanism, a 1-D flexible connecting element was developed as shown in Figure 8. The connector is defined between two surface patches which are quadrilateral or triangle (shell elements SHID-A and SHID-B in this figure). It is also assigned joint properties including material properties, the diameter D and the effective length L, which are used to calculate the stiffness of the connector in six directions. Furthermore, the position of the connector is defined by the projection of the node GS perpendicular to the two surface patches. The element x-axis (xe) points from the node GA to GB. The element y-axis (xy) is perpendicular to the x-axis and coincides with the closest coordinate axis in the basic coordinate system. The element z-axis (xz) is the cross-product of the above two elements.
As illustrated in Figure 9, taking the decoupling analysis in the element x-y plane as an example, the transmission load (the force vectors WA and WB in this case) carried by the connector GA–GB can be decomposed into four components, including shear force along the ye, axial stress along the xe, bending moments in the plane 2 as well as a pair of balanced torque around the xe, and output separately. Thereby, the total shear and axial forces after synthesis and their stress can be attained by numerical calculation of the two sub-planes. This simplified joint modeling was capable to save computation time and resources for large-scale models such as body-in-white (BIW) while maintaining analytical accuracy [30].

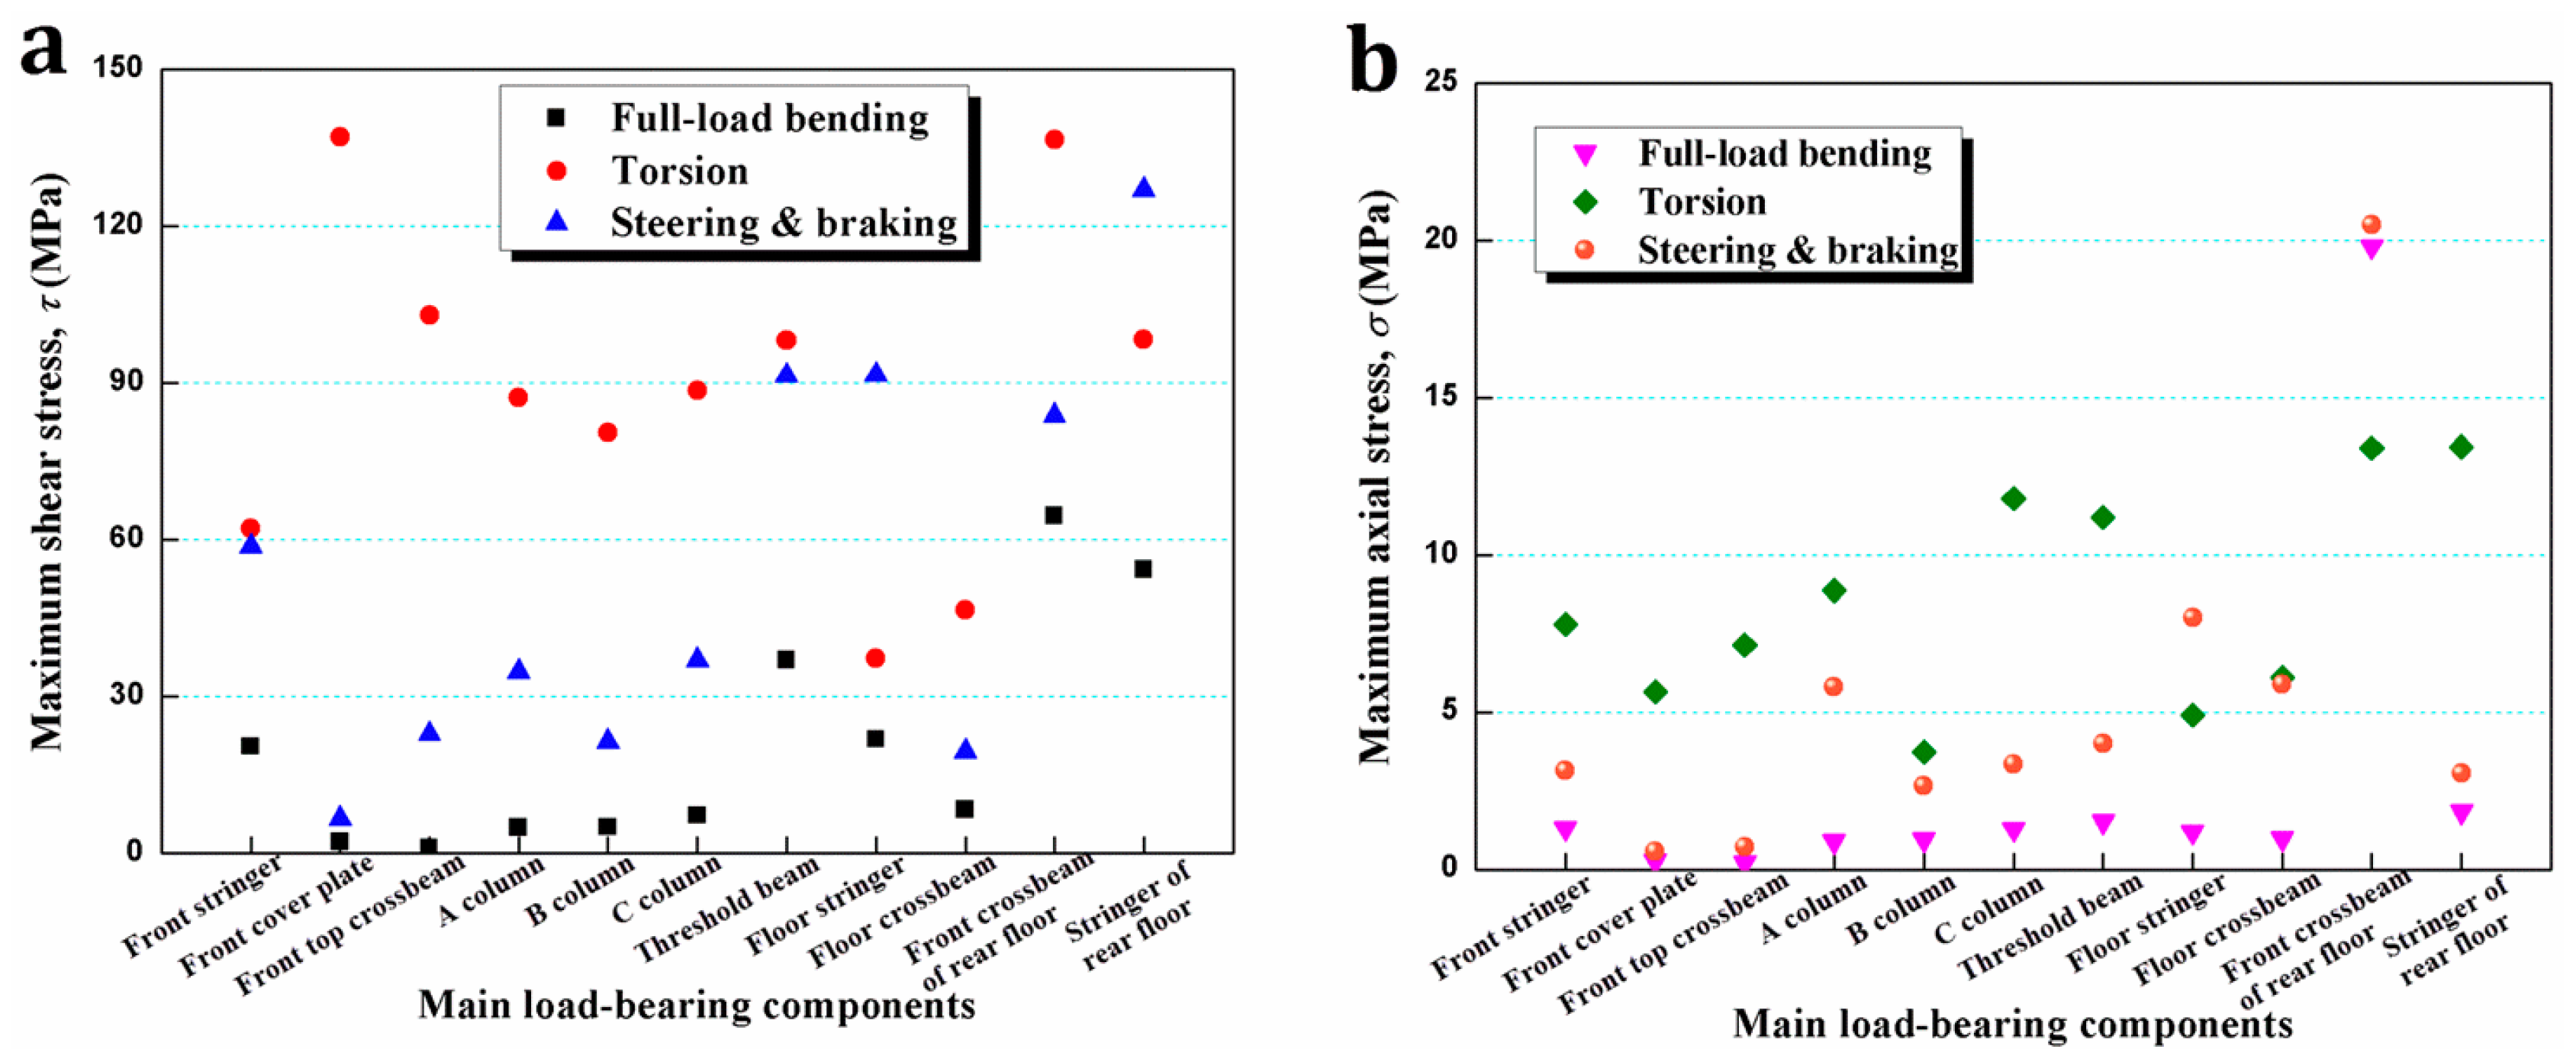
4.2. Multi-Axial Stress Analysis

Figure 10 shows the BIW FE model of a typical passenger vehicle with a total of more than 1300 developed connectors for solder joints to integrate all of the components. To reduce the number of joints used for stress analysis, eleven main force-transmitting components, including A column, etc., were extracted to analyze the maximum multi-axial stress of the joints that make them up. These components deliver higher peak loads than the rest and can therefore be used to evaluate the maximum static and dynamic load requirements of joints. The location and its stress value (MPa) of the joints with maximum shear or axial stress in partial main components are respectively displayed in Figure 11.
Three typical ultimate load conditions, consisting of full-load bending, torsion and integrated steering and braking, were separately applied to the body model. The specific loading mode and corresponding body stiffness measurement results are listed in Table 8. Additionally, in order to ensure that the solder joints will not fail due to transient overload under various operating conditions, the dynamic safety factor according to Pawlowski (1969) [31] was also considered into the strength check as listed in Table 8. This coefficient was taken to be 1.5 throughout this paper. Thus, the safety criterion was whether the FSSW solder joint load was lower than the allowable stress value determined by the product of its static strength and the dynamic safety factor.
The stress value transmitted by each joint under each working condition was calculated, then decoupled and finally output. The statistical results of the maximum shear stress and axial stress distributions of the joints connecting the main load-bearing components with others under various operating conditions are shown in Figure 12. The joints with these largest load values are most likely to be the initial failure points, so they were checked against the following optimum FSSW joint strength (Table 10 below) to meet the safety requirement. As can also be seen from Figure 12, it was found that automotive joints were dominantly shear resistant during service. Based on the sample data of the total 66 maxima, the general proportions of shear stress and axial stress were estimated to be about 0.905 and 0.095, which can be used as weights to measure the multi-axis relationship in the subsequent multi-objective optimization. Besides, by comparing the results of distinct conditions, the loads under torsion are generally the highest, followed by steering and braking, and full-load bending. The comparative evaluation of the stress of the major components under the comprehensive conditions shows that the front cover plate and the floor crossbeam are the members with the highest requirements on the shear resistance of the joints, and the joints connecting the front crossbeam of rear floor are subjected to the highest axial stress.

5. Multi-Objective Optimization

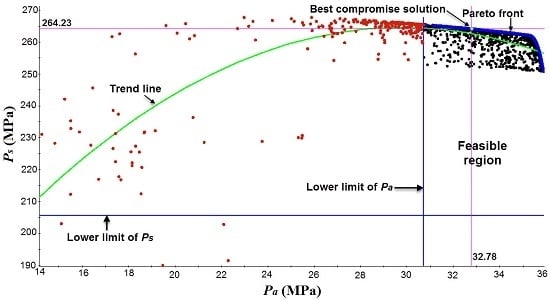
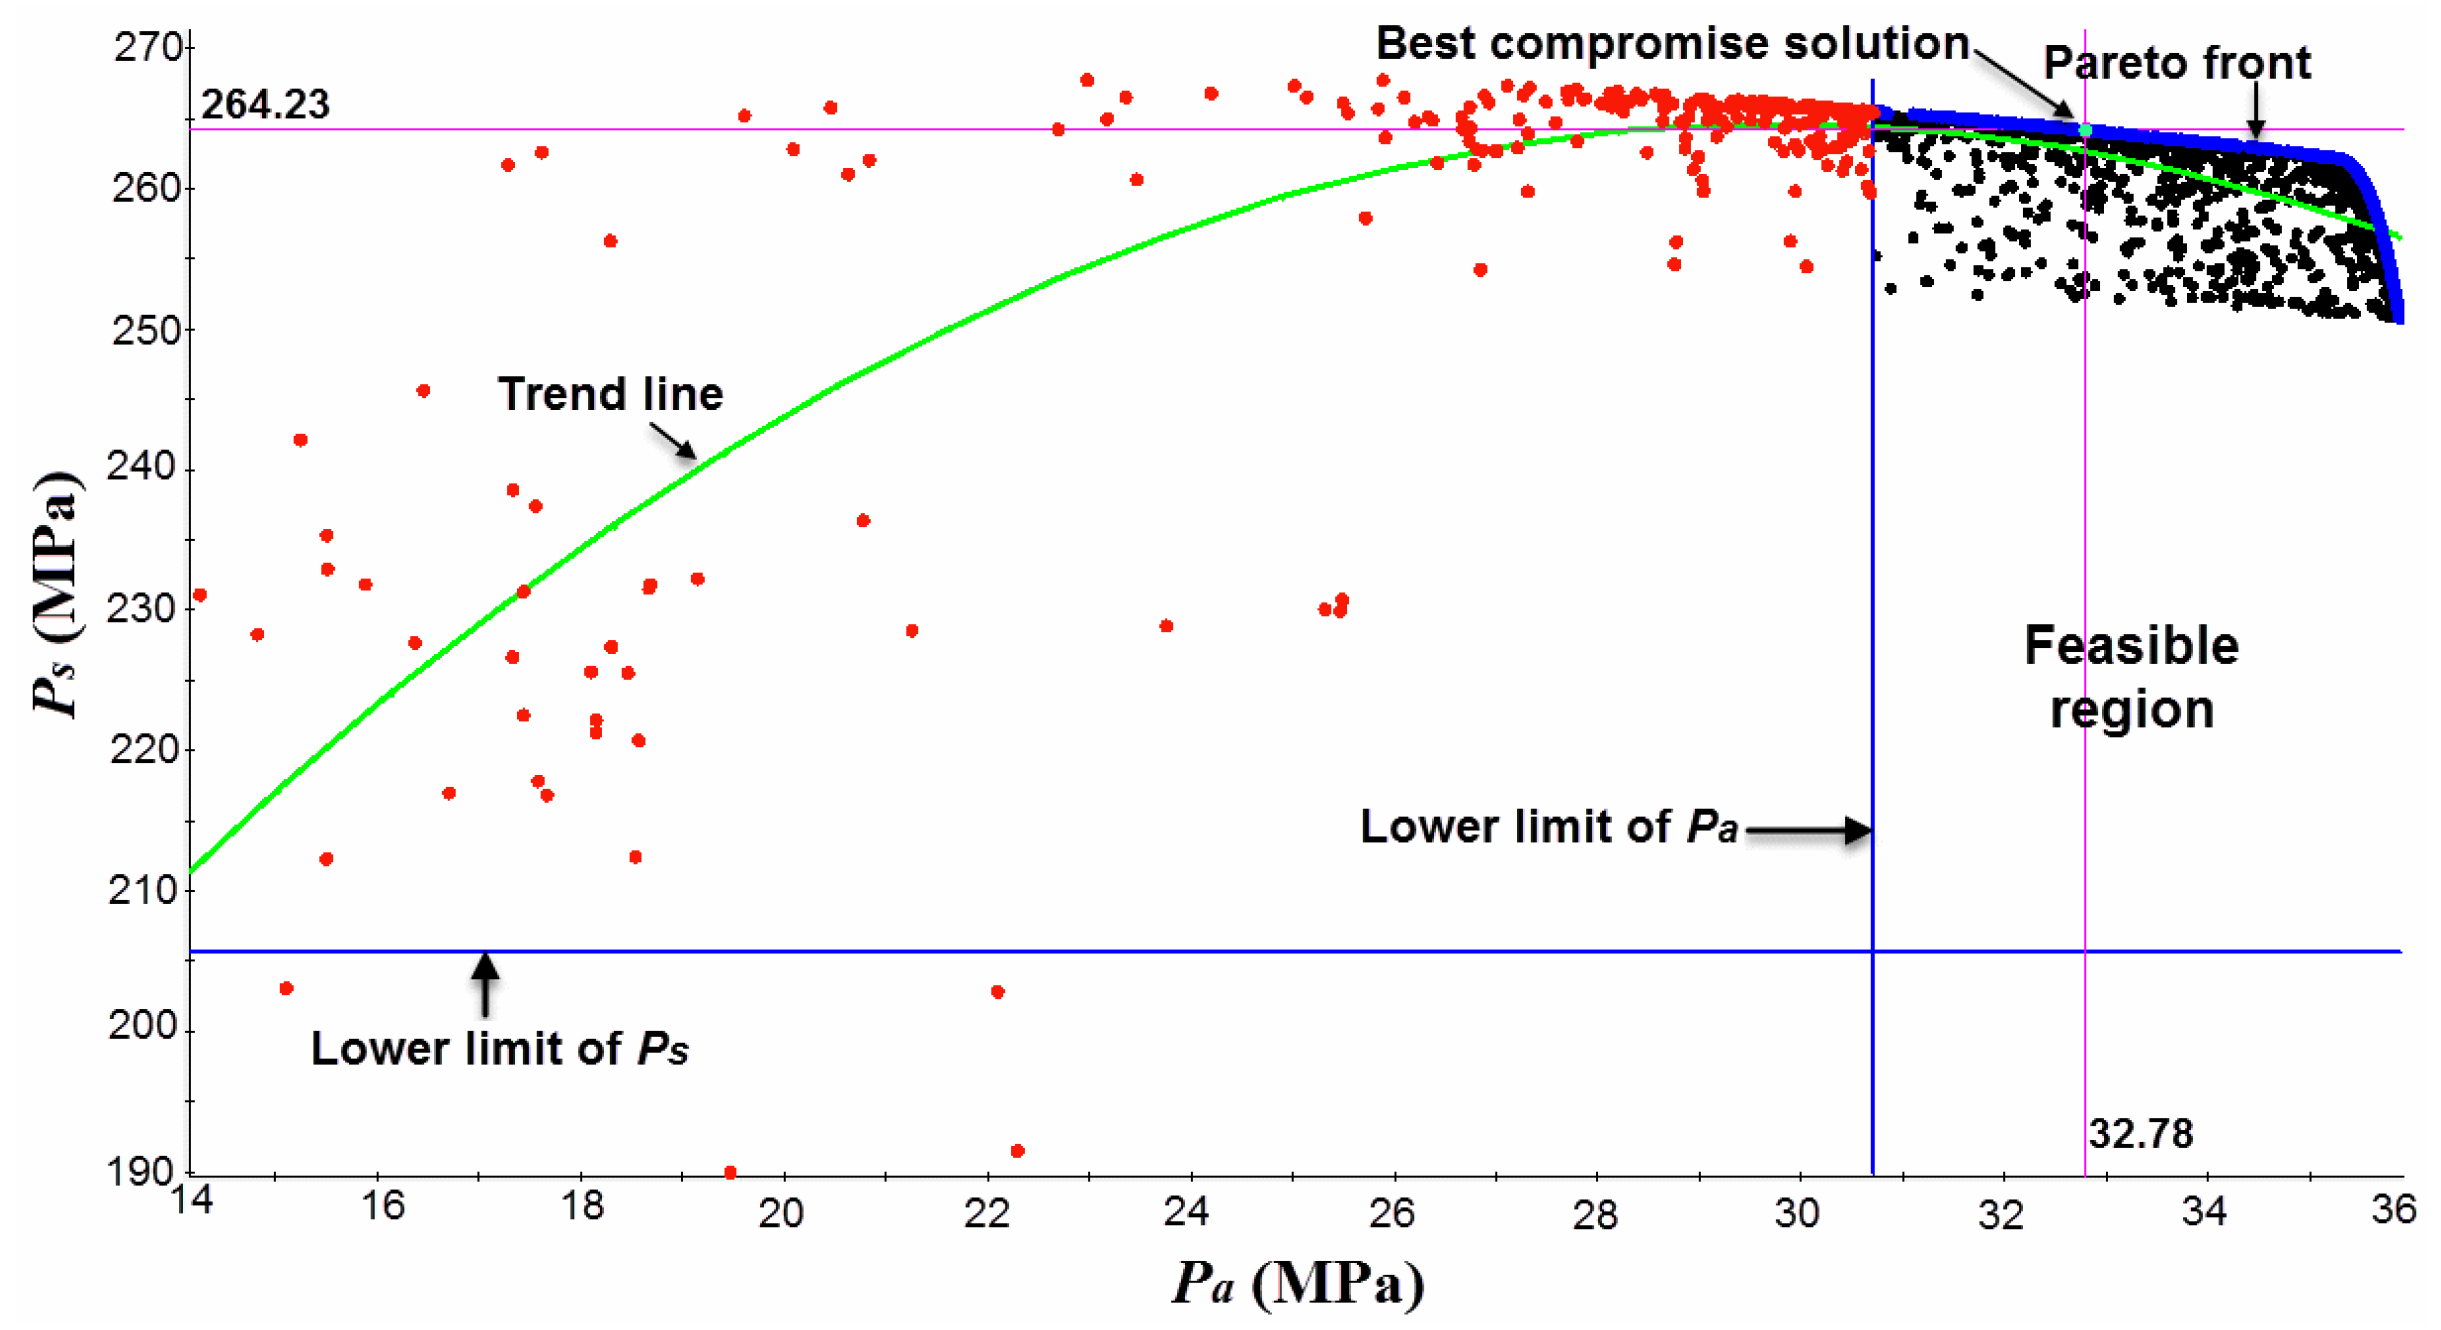
5.1. Applicability Constraints and Optimization Using NSGA-II

In this investigation, the final goal was to achieve the maximum shear and peel strength in coordination with the load weights of automotive joints while meeting the safety conditions of FSSW process to vehicles. Therefore, it was required that the optimized joint strength be greater than the corresponding allowable load value (the thresholds were taken from the safety criteria resulting from the stress analysis above). Table 9 summarizes the automotive suitability constraints of multi-objective parameter optimization for various types of lap joints.
In this multi-objective optimization problem, the maxima of the two responses are impossible to be obtained concurrently because they contradict each other. The Pareto front is considered to be a non-dominated set made up by a series of optimal solutions after multi-objective equilibrium. Each of these solutions cannot be improved with respect to one objective unless the other objective is deteriorated. In order to achieve collaborative optimization of comprehensive properties of FSSW joints, the Non-dominated Sorting Genetic Algorithm (NSGA-II) was employed to search the design space. The advantage of NSGA-II is its good exploration performance. Specifically, in the non-dominated sorting, Pareto’s ability to advance is enhanced by the selection of individuals close to the Pareto front (see [32] for the more detailed algorithm).
This procedure was executed using the parameter-based design and optimization software ISIGHT 2016. As for NSGA-II, the respective weights of the different targets (given in Table 9) are key parameters for assessing the fitness in the population evolution and selecting the best compromise solution from the Pareto frontier. With the purpose of targeted optimization for various joint types, the previous four-factor multi-response surface models were evolved into differentiated three-factor mathematical models by giving J different integers from −2 to 2. Then, the welding parameters corresponding to the five joint types can be separately optimized under their respective constraints. In this way, the desired maximum multi-axial ultimate strength required for various materials and sheet thickness combinations can be attained. Taking the case where J=0, the multi-objective optimization problem can be mathematically expressed as:
Objective : Maximize P s ( N , H , T ) Maximize P a ( N , H , T ) Subject to : 600 N 1800 , 0.1 H 0.5 , 1.0 T 5.0 , P s 205.7 , P a 30.7

5.2. Optimization Results and Verification

In terms of any joint factor, the algorithm generated 2000 sub-individuals through the crossover-mutation mechanism with population size of 20 and maximum iterations of 100 in the evolution process, and simultaneously used Pareto superiority to evaluate the merit of generated individuals. Figure 13 shows the optimization iteration history and result with J = 0 as an example. From the trend line, the advancing direction in which the solutions converge can be roughly judged. According to the set limits, the region containing feasible solutions (marked as black dots) was determined. The Pareto front formed by many optimal solutions is also clearly visible. On the basis of the dual-target weights, the best compromise solution can be filtered out from the Pareto frontier sets finally. As a result, for the 2 mm thick AA 5052-H32 and 2 mm thick AA 6061-T6 lapped FSSW joint, the optimized process parameters were taken as rotational speed of 630 rpm (−1.9), plunged depth of 0.48 mm (1.77) and dwell time of 2.4 s (−0.65), realizing a shear strength of 264.2 MPa and a peel strength of 32.8 MPa. Table 10 shows the optimal weld parameters and corresponding output responses for all joint types.
Subsequently, in order to verify the above optimization results, the test piece preparations and tensile strength tests were carried out using the optimized process settings. As illustrated in Table 10, the maximum relative errors of Ps and Pa are 7.04% and 9.60%, respectively, both within the RSM error range of 10%. This indicates that this proposed integrated optimization approach satisfies the prediction accuracy with effective optimal results.

6. Conclusions

In this paper, a targeted optimization approach that integrated RSM and NSGA-II with a full consideration of working conditions was proposed to optimize FSSW process parameters. The purpose was to derive a purposeful improvement of mechanical properties that matched to the load pattern of automotive joints. The following conclusions can be drawn:
(1)
The empirical relationships were developed to estimate the effects of different welded sheet combinations and corresponding weld parameters on multi-axial tensile strength of formed solder joints. The results reveal that the original base material properties play a significant role in determining the shear strength with a positive contribution percentage of 77.1%, followed by plunged depth, dwell time and rotation speed. The dwell time has no significant effect on the peel strength.
(2)
Using the developed connecting element, the multi-axis load-bearing characteristics of automotive joints under multiple driving conditions were analyzed. Automotive spot-joints have proven to be primarily shear resistance. In order to balance dual properties in multi-objective optimization, the weights of shear stress and axial stress were statistically found to be 0.905 and 0.095, respectively.
(3)
Under the automotive applicability constraints, NSGA-II was effectively utilized to deal with such multi-objective optimization problem. Corresponding optimal weld parameters for various joint types were obtained and subsequently validated to be in good agreement with the experimental ones.

Author Contributions

Conceptualization, B.Z. and K.P.; data curation, B.Z. and K.P.; funding acquisition, X.C.; investigation, B.Z.; methodology, B.Z. and X.C.; project administration, X.C.; writing—original draft, B.Z.; writing—review & editing, X.C. and J.W.

Funding

This research was financially funded by National Key Research and Development Plan of China (Grant No. 2016YFB0101601-7) and Jilin Province School Co-construction Project (Grant No. SXGJSF2017-2-1-5).

Acknowledgments

The authors acknowledge use of the facilities within the State Key Laboratory of Automobile Simulation and Control of Jilin University and the Changchun University of Technology.

Conflicts of Interest

The authors declare no conflict of interest.

References

  1. Du, J.; Ouyang, M.; Chen, J. Prospects for Chinese electric vehicle technologies in 2016–2020: Ambition and rationality. Energy 2016, 120, 584–596. [Google Scholar] [CrossRef]
  2. Park, D.H.; Choi, S.W.; Kim, J.H.; Lee, J.M. Cryogenic mechanical behavior of 5000- and 6000-series aluminum alloys: Issues on application to offshore plants. Cryogenics 2015, 68, 44–58. [Google Scholar] [CrossRef]
  3. Mirza, F.A.; Macwan, A.; Bhole, S.D.; Chen, D.L.; Chen, X.G. Effect of welding energy on microstructure and strength of ultrasonic spot welded dissimilar joints of aluminum to steel sheets. Mater. Sci. Eng. A 2016, 668, 73–85. [Google Scholar] [CrossRef]
  4. Lei, H.Y.; Li, Y.B.; Carlson, B.E. Cold metal transfer spot welding of 1 mm thick AA6061-T6. J. Manuf. Process. 2017, 28, 209–219. [Google Scholar] [CrossRef]
  5. Florea, R.S.; Solanki, K.N.; Bammann, D.J.; Baird, J.C.; Jordon, J.B.; Castanier, M.P. Resistance spot welding of 6061-T6 aluminum: Failure loads and deformation. Mater. Design. 2012, 34, 624–630. [Google Scholar] [CrossRef]
  6. Li, Z.; Ji, S.; Ma, Y.; Chai, P.; Yue, Y.; Gao, S. Fracture mechanism of refill friction stir spot-welded 2024-T4 aluminum alloy. Int. J. Adv. Manuf. Technol. 2016, 86, 1925–1932. [Google Scholar] [CrossRef]
  7. Moshwan, R.; Yusof, F.; Hassan, M.A.; Rahmat, S.M. Effect of tool rotational speed on force generation, microstructure and mechanical properties of friction stir welded AA 5052-O alloy. Mater. Design. 2015, 66, 118–128. [Google Scholar]
  8. Debroy, T.; Wei, H.L.; Zuback, J.S.; Mukherjee, T.; Elmer, J.W.; Milewski, J.O.; Beese, A.M.; Wilson-Heid, A.; Zhang, W. Additive manufacturing of metallic components – process, structure and properties. Prog. Mater. Sci. 2017, 92, 112–224. [Google Scholar] [CrossRef]
  9. Chu, Q.; Li, W.Y.; Yang, X.W.; Shen, J.J.; Vairis, A.; Feng, W.Y.; Wang, W.B. Microstructure and mechanical optimization of probeless friction stir spot welded joint of an Al-Li alloy. J. Mater. Sci. Technol. 2018, 34, 1739–1746. [Google Scholar] [CrossRef]
  10. Xu, Z.; Li, Z.; Ji, S.; Zhang, L. Refill friction stir spot welding of 5083-O aluminum alloy. J. Mater. Sci. Technol. 2018, 34, 878–885. [Google Scholar] [CrossRef]
  11. Xie, X.; Shen, J.; Gong, F.; Wu, D.; Zhang, T.; Luo, X.; Li, Y. Effects of dwell time on the microstructures and mechanical properties of water bath friction stir spot-welded AZ31 magnesium alloy joints. Int. J. Adv. Manuf. Technol. 2016, 82, 75–83. [Google Scholar] [CrossRef]
  12. Tutar, M.; Aydin, H.; Yuce, C.; Yavuz, N.; Bayram, A. The optimisation of process parameters for friction stir spot-welded AA3003-H12 aluminium alloy using a Taguchi orthogonal array. Mater. Des. 2014, 63, 789–797. [Google Scholar] [CrossRef]
  13. Lakshminarayanan, A.K.; Balasubramanian, V. Process parameters optimization for friction stir welding of RDE-40 aluminium alloy using Taguchi technique. Trans. Nonferrous Met. Soc. China 2008, 18, 548–554. [Google Scholar] [CrossRef]
  14. Vijayan, S.; Raju, R.; Krao, S.R. Multiobjective optimization of friction stir welding process parameters on aluminum alloy AA 5083 using Taguchi-based grey relation analysis. Mater. Manuf. Process. 2010, 25, 1206–1212. [Google Scholar] [CrossRef]
  15. Plaine, A.H.; Gonzalez, A.R.; Suhuddin, U.F.H.; dos Santos, J.F.; Alcântara, N.G. The optimization of friction spot welding process parameters in AA6181-T4 and Ti6Al4V dissimilar joints. Mater. Des. 2015, 83, 36–41. [Google Scholar] [CrossRef] [Green Version]
  16. Dwivedi, S.P. Effect of process parameters on tensile strength of friction stir welding A356/C355 aluminium alloys joint. J. Mech. Sci. Technol. 2014, 28, 285–291. [Google Scholar] [CrossRef]
  17. Shanavas, S.; Dhas, J.E.R. Parametric optimization of friction stir welding parameters of marine grade aluminium alloy using response surface methodology. Trans. Nonferrous Met. Soc. China 2017, 27, 2334–2344. [Google Scholar] [CrossRef]
  18. Shojaeefard, M.H.; Akbari, M.; Asadi, P. Multi objective optimization of friction stir welding parameters using FEM and neural network. Int. J. Precis. Eng. Manuf. 2014, 15, 2351–2356. [Google Scholar] [CrossRef]
  19. Shojaeefard, M.H.; Behnagh, R.A.; Akbari, M.; Givi, M.K.B.; Farhani, F. Modelling and Pareto optimization of mechanical properties of friction stir welded AA7075/AA5083 butt joints using neural network and particle swarm algorithm. Mater. Des. 2013, 44, 190–198. [Google Scholar] [CrossRef]
  20. Kubit, A.; Kluz, R.; Trzepieciński, T.; Wydrzyński, D.; Bochnowski, W. Analysis of the mechanical properties and of micrographs of refill friction stir spot welded 7075-T6 aluminium sheets. Arch. Civ. Mech. Eng. 2018, 18, 235–244. [Google Scholar] [CrossRef]
  21. ASTM E8/E8M-09. Standard Test Methods for Tension Testing of Metallic Materials; ASTM International: West Conshohocken, PA, USA, 2010. [Google Scholar]
  22. Karthikeyan, R.; Balasubramanian, V. Predictions of the optimized friction stir spot welding process parameters for joining AA2024 aluminum alloy using RSM. Int. J. Adv. Manuf. Technol. 2010, 51, 173–183. [Google Scholar] [CrossRef]
  23. Periyasamy, P.; Mohan, B.; Balasubramanian, V.; Rajakumar, S.; Venugopal, S. Multi-objective optimization of friction stir welding parameters using desirability approach to join Al/SiCp metal matrix composites. Trans. Nonferrous Met. Soc. China 2013, 23, 942–955. [Google Scholar] [CrossRef]
  24. Selvamani, S.T.; Divagar, S.; Vigneshwar, M. Application of response surface methodology (RSM) in friction welding AISI 1020 grade steel joints. Int. J. Eng. Res. Africa 2015, 16, 38–44. [Google Scholar] [CrossRef]
  25. Cao, J.Y.; Wang, M.; Kong, L.; Zhao, H.X.; Chai, P. Microstructure, texture and mechanical properties during refill friction stir spot welding of 6061-T6 alloy. Mater. Charact. 2017, 128, 54–62. [Google Scholar] [CrossRef]
  26. Ibrahim, I.J.; Yapici, G.G. Application of a novel friction stir spot welding process on dissimilar aluminum joints. J. Manuf. Process. 2018, 35, 282–288. [Google Scholar] [CrossRef]
  27. Tao, X.; Chang, Y.; Guo, Y.; Li, W.; Li, M. Microstructure and mechanical properties of friction stir welded oxide dispersion strengthened AA6063 aluminum matrix composites enhanced by post-weld heat treatment. Mater. Sci. Eng. A 2018, 725, 19–27. [Google Scholar] [CrossRef]
  28. Sun, Y.; Morisada, Y.; Fujii, H.; Tsuji, N. Ultrafine grained structure and improved mechanical properties of low temperature friction stir spot welded 6061-T6 Al alloys. Mater. Charact. 2017, 135, 124–133. [Google Scholar] [CrossRef]
  29. Li, W.Y.; Chu, Q.; Yang, X.W.; Shen, J.J.; Vairis, A.; Wang, W.B. Microstructure and morphology evolution of probeless friction stir spot welded joints of aluminum alloy. J. Mater. Process. Technol. 2018, 252, 69–80. [Google Scholar] [CrossRef]
  30. Alvarez, R.O.D.A.; Ferguson, N.S.; Mace, B.R. A robust spot weld model for structural vibration analysis. Finite Elem. Anal. Des. 2014, 89, 1–7. [Google Scholar] [CrossRef]
  31. Hucho, W.H. Chapter 1—Introduction to automobile aerodynamics. Aerodynamics of Road Vehicles; SAE International: Warrendale, PA, USA, 1987; pp. 1–46. [Google Scholar]
  32. Coello, C.A.C. A Comprehensive Survey of Evolutionary-Based Multiobjective Optimization Techniques. Knowl. Inf. Syst. 1999, 1, 269–308. [Google Scholar] [CrossRef] [Green Version]
Figure 1. Schematic diagram of the friction stir spot-welded (FSSW) process and its detailed dimensions.
Metals 09 00520 g001
Figure 2. Distribution of sampling points for four-factor central-composite design.
Metals 09 00520 g002
Figure 3. A photograph of friction stir spot-welded lap shear and cross tensile specimens using both automotive aluminum alloys.
Metals 09 00520 g003
Figure 4. Microstructural investigation of FSSW joints with similar and dissimilar materials. (a) The bonding cross-sectional interface; (b) Post-weld microstructure adjacent to the lap plane and its Energy Dispersive Spectroscopy (EDS) result for a similar 6061 joint; (c) Modified microstructure of the bonded region of a dissimilar 6061 and 5052 joint.
Metals 09 00520 g004
Figure 5. Experimental and predicted values of both responses. (a) lap shear strength Ps; (b) cross peeling strength Pa.
Metals 09 00520 g005
Figure 6. Response surface plots for Ps.
Metals 09 00520 g006
Figure 7. First-order main effect plots for Ps.
Metals 09 00520 g007
Figure 8. Connection between two surface patches.
Metals 09 00520 g008
Figure 9. Moments and internal forces in the element coordinate system.
Metals 09 00520 g009
Figure 10. Main force-transmitting components in a typical BIW.
Metals 09 00520 g010
Figure 11. The element number and its stress value of the solder joints with maximum shear or axial stress. (a) Connector with maximum shear stress for the front cover plate; (b) connector with maximum shear stress for the threshold beam; (c) connector with maximum axial stress for the C column; (d) connector with maximum axial stress for the floor crossbeam.
Metals 09 00520 g011
Figure 12. Maximum stress distributions of main load-bearing components under various operating conditions. (a) Shear stress τ; (b) Axial stress σ.
Metals 09 00520 g012
Figure 13. The optimization iterations andresult for the case of J = 0.
Metals 09 00520 g013
Table 1. Elemental compositions of weldedbase metals (wt. %).
SamplesSiCuMgZnMnCrFeAl
AA 5052-H320.20.02.50.00.10.20.2Bal.
AA 6061-T60.70.11.10.10.10.20.1Bal.
Table 2. Mechanical properties of two automotive aluminum alloys.
SamplesYoung’s Modulus (GPa)Yield Strength (MPa)Ultimate Tensile Strength (MPa)Elongation at 50-mm Gauge (%)Section Shrinkage (%)Hardness at 0.5 N Load (Hv)
5052-H3269.5141.8217.520.949.959.0
6061-T669.8241.2320.214.934.774.2
Table 3. Specification of the used tools.
No.Corresponding Total Plate Thickness (mm)D1 (mm)D2 (mm)D3 (mm)L (mm)
Tool-13.0 (1.0+2.0)2.63.010.02.0
Tool-24.0 (2.0+2.0)3.03.514.03.0
Table 4. FSSW process factors and their feasible range adopted in this investigation.
FactorLevel
−2−1012
Material and thickness (mm) combination of welded metals, JUpper5052; 1.06061; 2.05052; 2.05052; 2.05052; 1.0
Lower5052; 2.06061; 2.06061; 2.05052; 2.06061; 2.0
Rotational speed, N (rpm)600900120015001800
Plunged depth by shoulder, H (mm)0.10.20.30.40.5
Dwell time, T (s)1.02.03.04.05.0
Table 5. CCD matrix and experimental results.
Trial RunFactorTensile Fracture Strength (MPa)
JNHTShear, PsPeel, Pa
1−1−1−1−1212.3116.51
21−1−1−1191.5410.94
3−11−1−1204.6213.97
411−1−1178.8515.14
5−1−11−1273.8519.05
61−11−1207.6921.78
7−111−1238.0812.70
8111−1203.8519.83
9−1−1−11196.9217.29
101−1−11175.0016.41
11−11−11202.3115.63
1211−11165.3816.80
13−1−111261.5420.81
141−111203.8520.90
15−1111228.4613.87
161111198.4616.90
17−2000140.008.30
182000121.5411.53
190−200243.0826.37
200200211.5417.97
2100−20215.3818.36
220020230.7717.48
23000−2250.0014.94
240002200.3815.04
250000250.3815.14
260000267.6916.21
270000245.0014.86
280000253.4616.22
Table 6. ANOVA results of the both response models.
SourceDfAdj SSMSF-Valuep-ValueContribution (%)
Std. Dev. = 16.23, Mean = 213.28, C.V. = 7.6%, R2 = 0.918, Adj R2 = 0.865, Adeq precision = 12.70Model1433190.182370.739.00<0.001100.0
J *14548.084548.0817.270.00113.7
N *11144.981144.984.350.0573.5
H *14256.424256.4216.160.00212.8
T *11321.311321.315.020.0434.0
JN198.0998.090.370.5520.3
JH1427.38427.381.620.2251.3
JT19.246 × 10−39.246 × 10−33.51 × 10−50.9950.0
NH1178.63178.630.680.4250.5
NT118.7218.720.070.7940.1
HT117.1017.100.060.8030.1
J2 *121,055.4021,055.4079.96<0.00163.4
N21721.99721.992.740.1222.2
H2 *11027.291027.293.900.0703.1
T2 *1867.93867.933.300.0932.6
Residual133423.27263.33---
Total2736,613.46----
Std. Dev. = 1.65, Mean = 16.46, C.V. = 10.0%, R2 = 0.905, Adj R2 = 0.849, Adeq precision = 13.65Model14315.3622.538.26<0.001100.0
J *19.809.803.590.08053.1
N *152.9652.9619.420.00116.8
H *119.0719.076.990.0206.2
T13.293.291.210.2921.0
JN *116.2316.235.950.0305.1
JH *118.2618.266.700.0235.8
JT10.260.260.0960.7610.1
NH *124.0924.098.830.0117.6
NT11.941.940.710.4150.6
HT16.836.832.500.1382.2
J2 *142.7542.7515.670.00213.6
N2 *171.8371.8326.34<0.00122.8
H2 *110.7010.703.920.0693.4
T210.100.100.0370.8510.0
Residual1335.462.73---
Total27350.82----
Df: degrees of freedom; SS: sum of squares; MS: mean squares; F: Fisher’s ratio; p: probability; C.V.: coefficient of variation; * Generally significant (p < 0.1).
Table 7. Results of verification tests and their relative error analysis.
Test PointsFactor CodePs (MPa)Relative Error (%)Pa (MPa)Relative Error (%)
JNHTPredictedTestPredictedTest
No. 1−10.521221.88213.953.5713.8714.846.99
No. 21−20−1.5218.40203.706.7322.7520.808.57
No. 301.5−1−0.5219.61225.192.5418.8519.362.71
No. 4−200.52132.41145.279.718.507.758.82
Table 8. Specific loadingmode and stiffness measurement results.
ConditionsFull-Load BendingTorsionIntegrated Full-Load Steering and Braking
Loading conditionsDouble H points loaded with moment of 7000 NmTorque of 3000 NmBidirectional acceleration: ax = 1.1 g; ay = 0.5 g
Rigidity, K11,571 N/mm10,929 Nm/(°)-
Dynamic safety factor1.4–1.61.3–1.81.4–1.75
Table 9. Applicability constraints in multi-objective parameter optimization forvarious joint types.
Joint type, J−2−1012
Weight of Ps0.905
Weight of Pa0.095
Lower limit of Ps (MPa)190.5205.7205.7205.790.3
Lower limit of Pa (MPa)20.230.730.730.711.7
Table 10. Multi-objective optimization results and their verification.
Joint type, J−2−1012
Optimal code, (N, H, T)(−2.0, 2.0, −0.65)(−2.0, 2.0, −0.64)(−1.9, 1.77, −0.65)(−1.86, 1.62, −0.67)(−0.93, 0.99, −0.64)
Actual parameters, (N, H, T)(1800, 0.5, 2.4)(1800, 0.5, 2.4)(630, 0.48, 2.4)(642, 0.46, 2.3)(921, 0.4, 2.4)
PsOptimized (MPa)201.9261.7264.2208.6107.0
Experimental (MPa)188.3275.9245.6215.2100.6
Relative error (%)6.745.427.043.165.98
PaOptimized (MPa)28.333.132.830.817.7
Experimental (MPa)26.235.930.132.216.0
Relative error (%)7.428.468.234.559.60

