Research on Fatigue Strength for Weld Structure Details of Deck with U-rib and Diaphragm in Orthotropic Steel Bridge Deck


Abstract
:1. Introduction
2. Fatigue Test for Weld Structure of U-Rib and Deck Plate
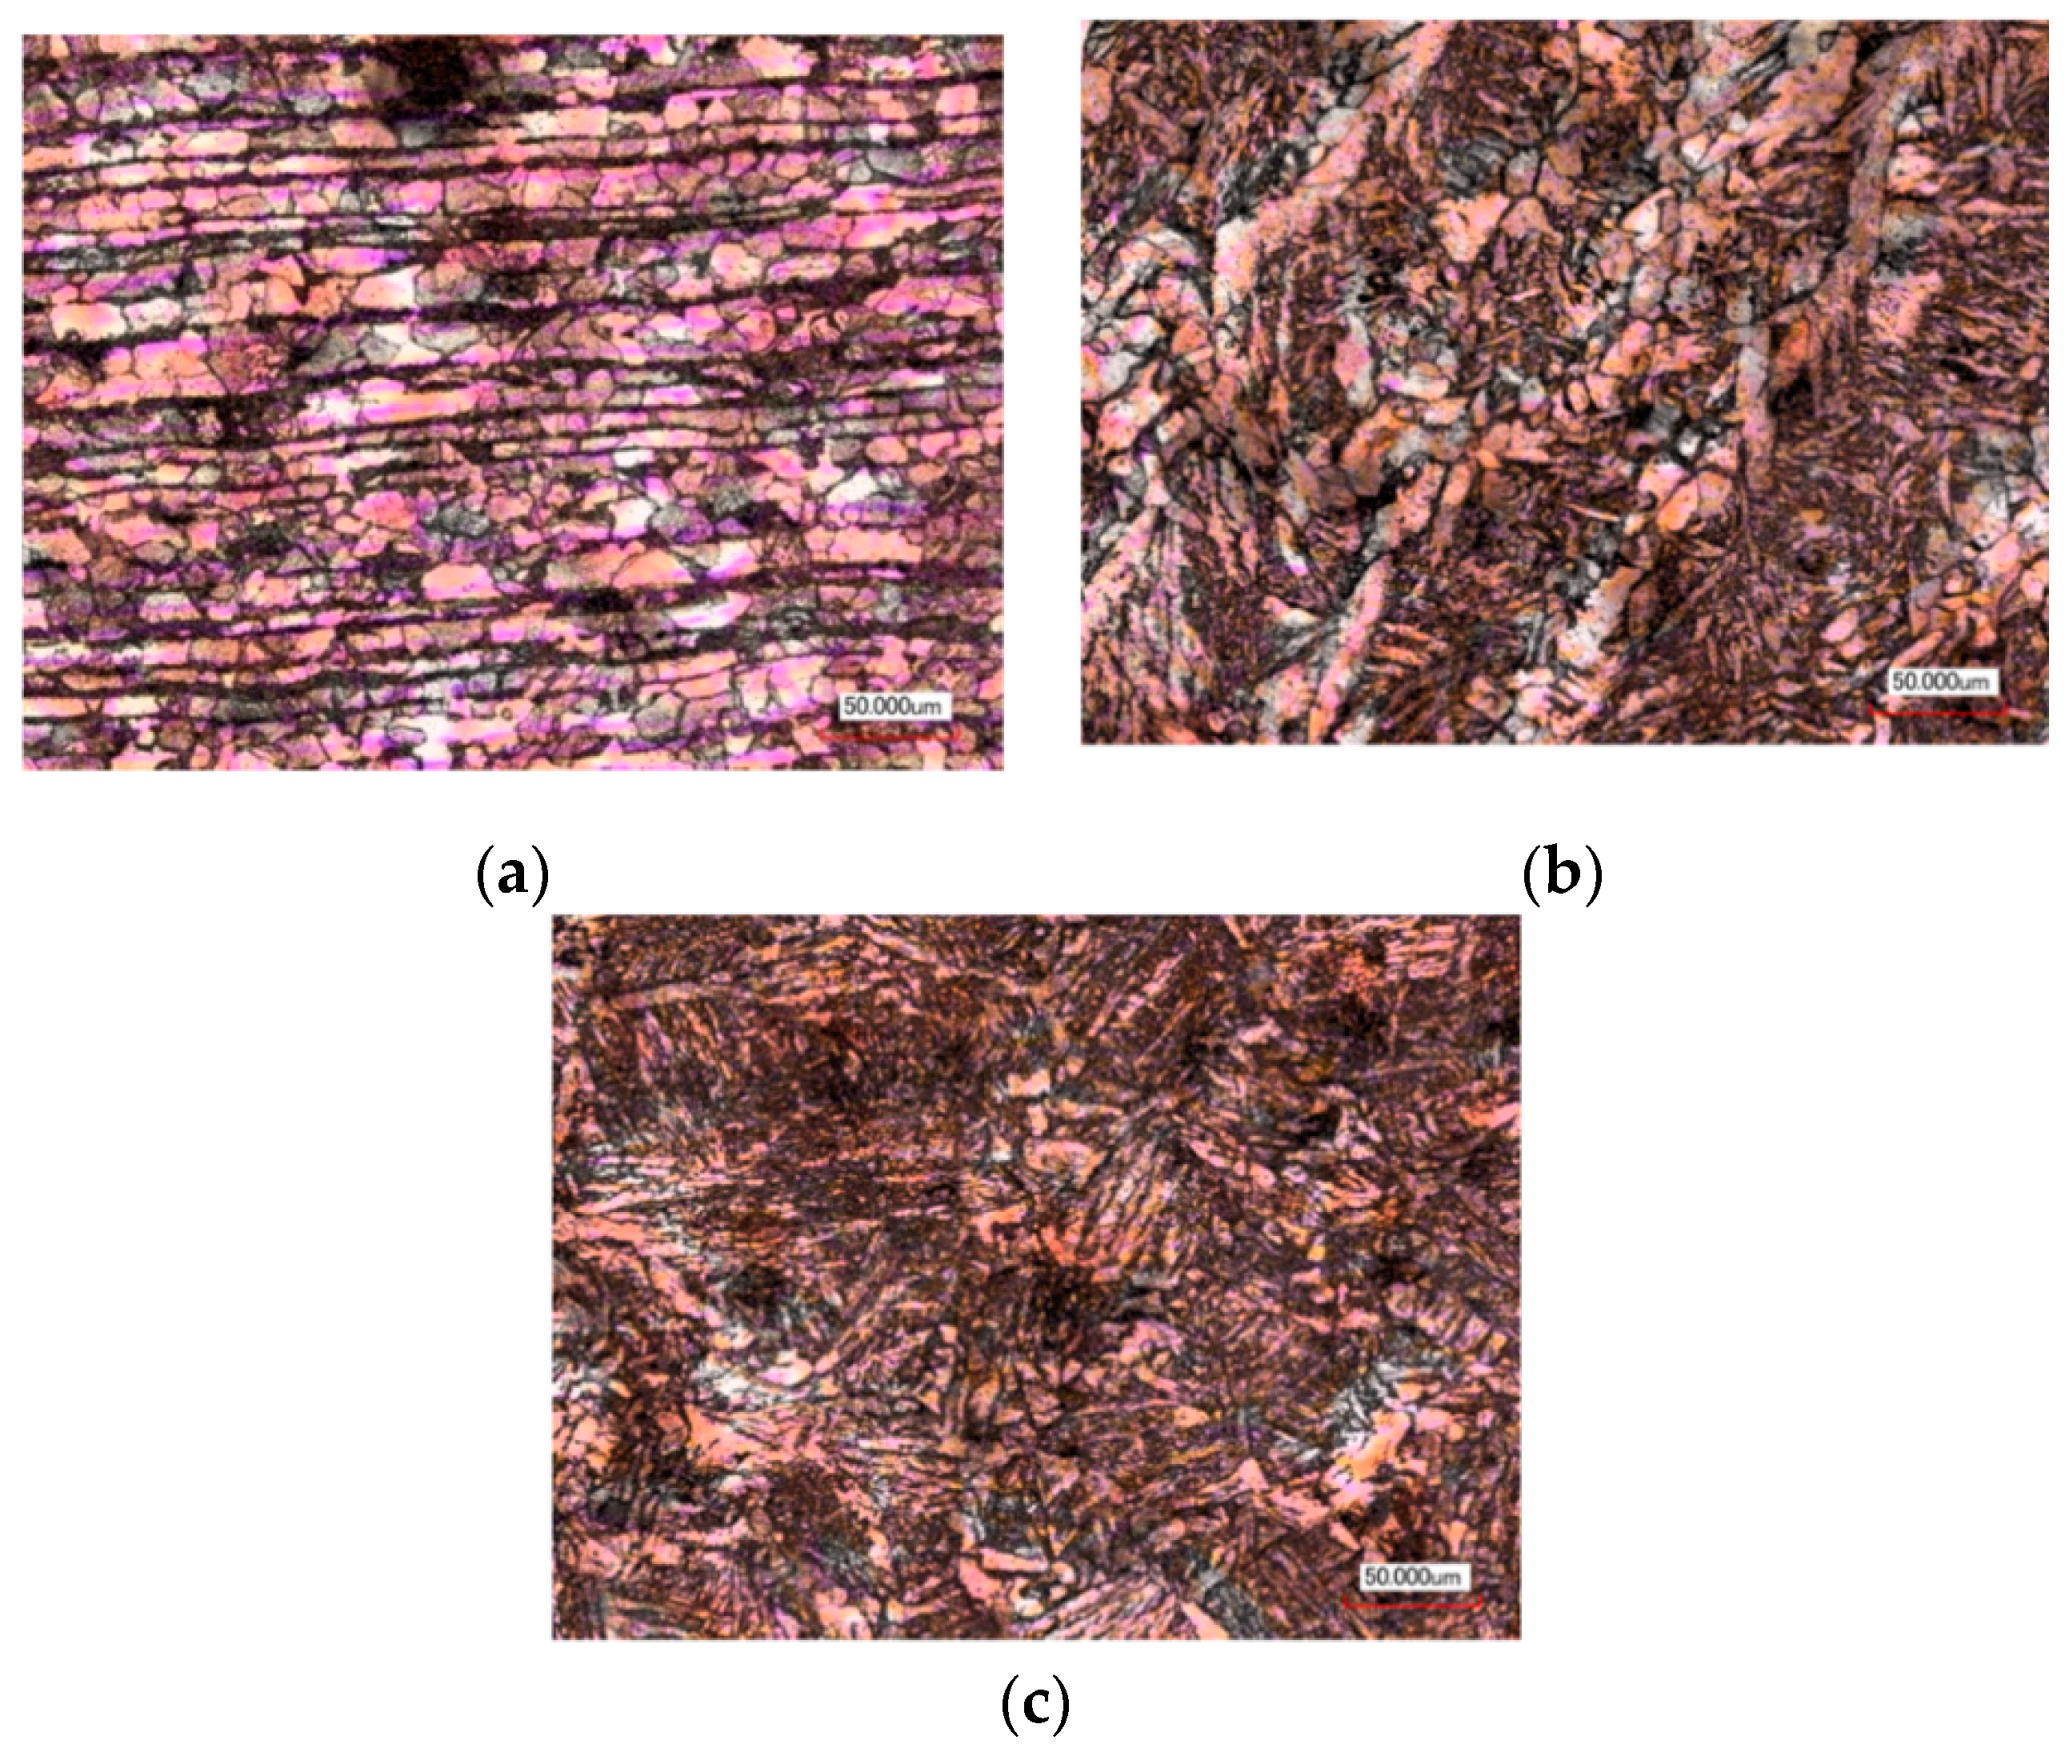
2.1. Microstructure Analysis of Welded Joint
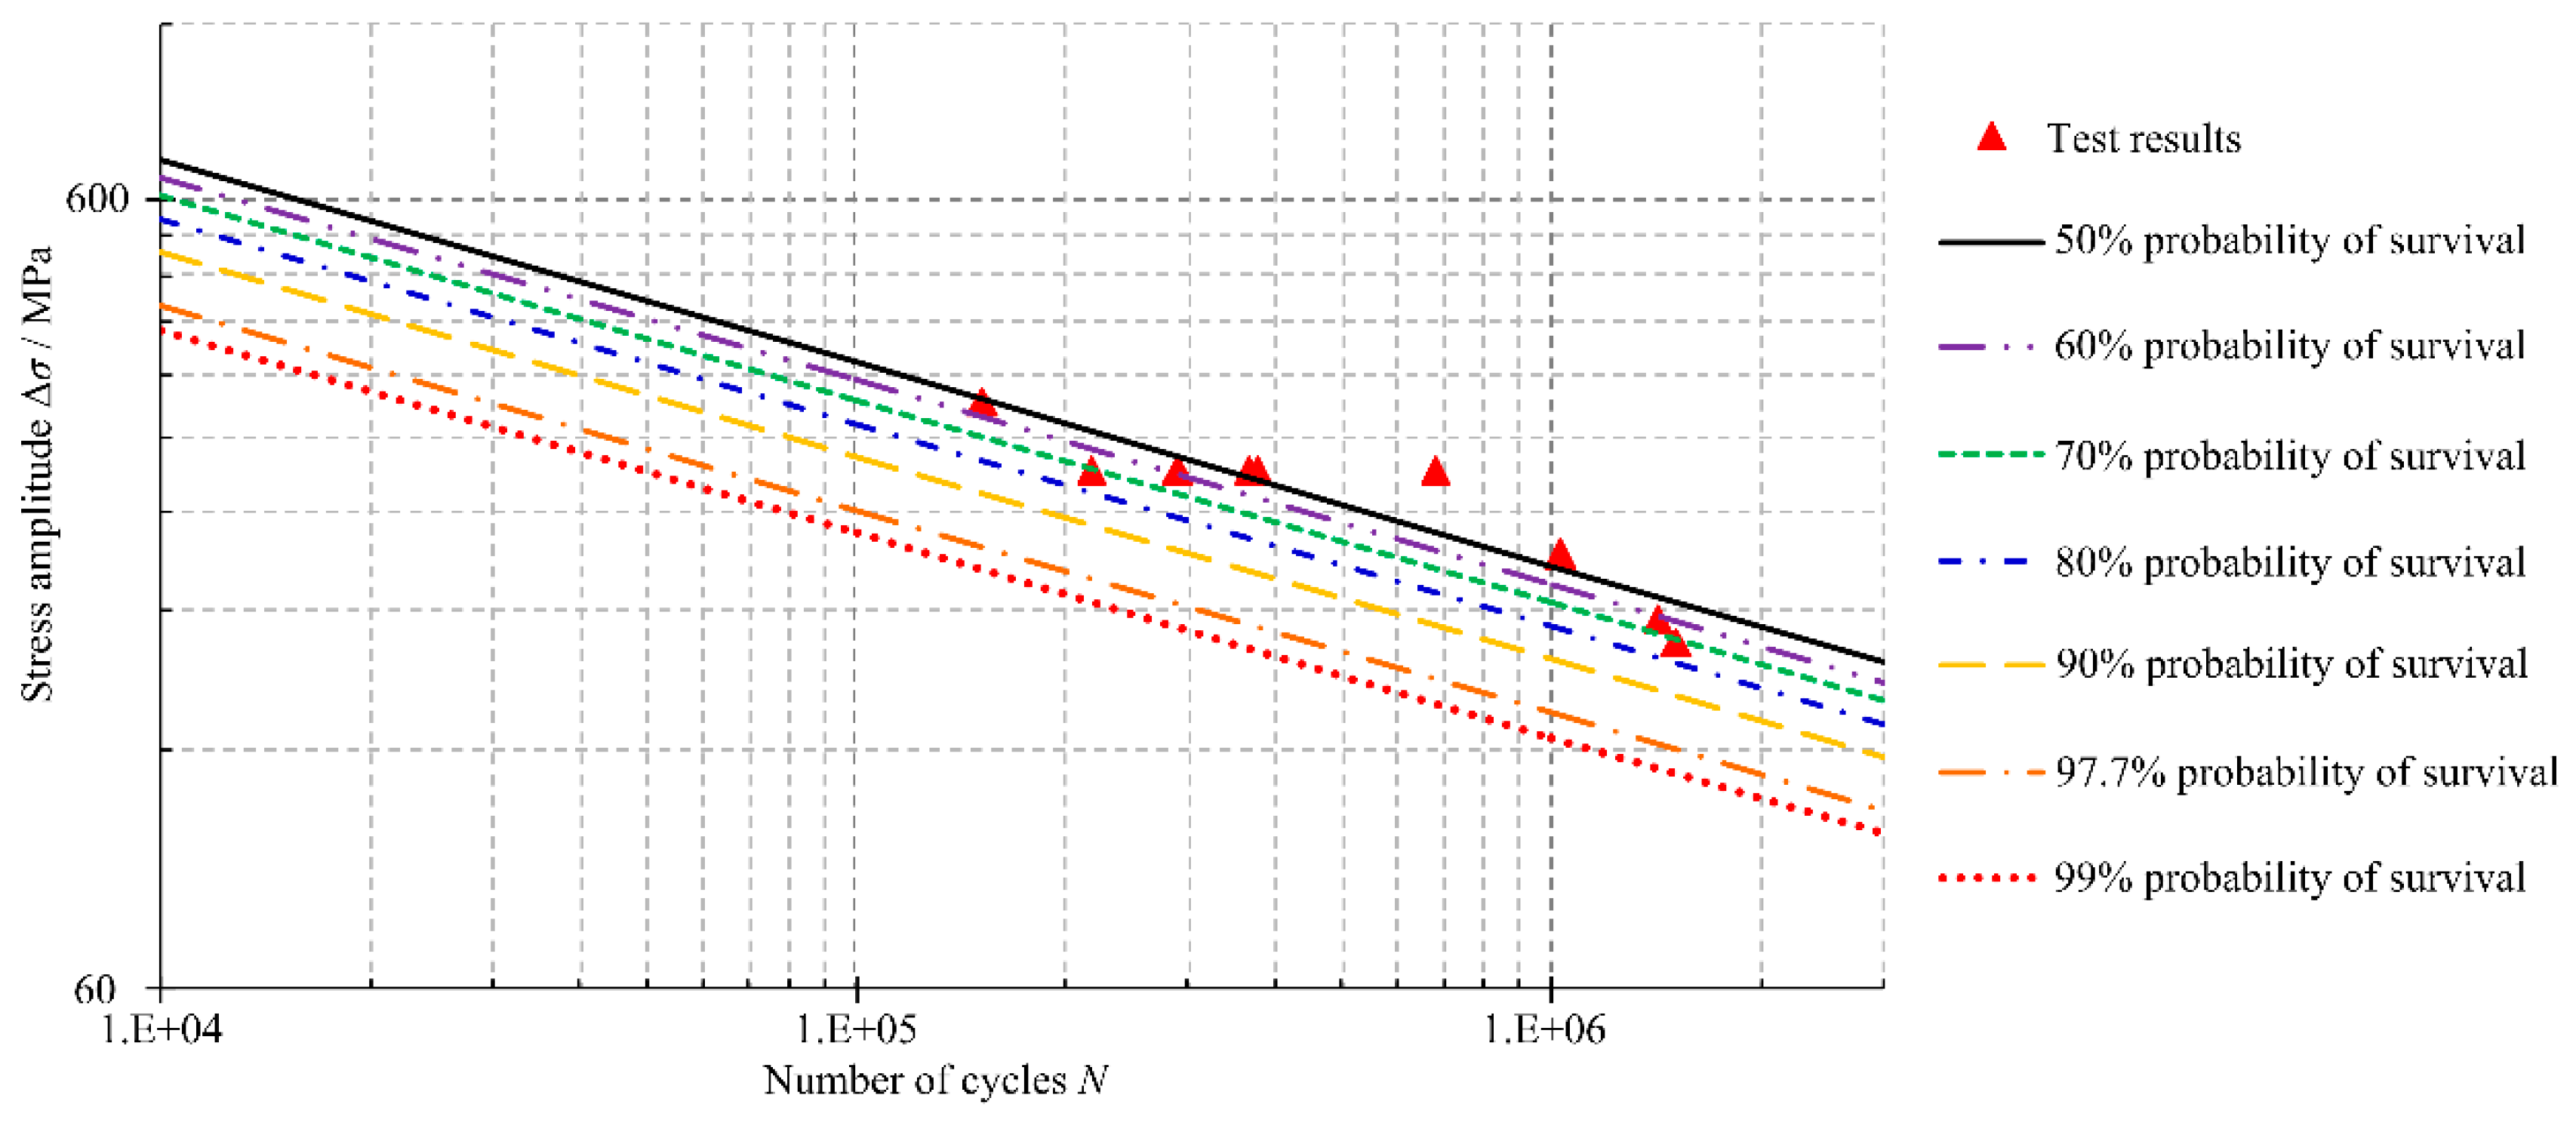
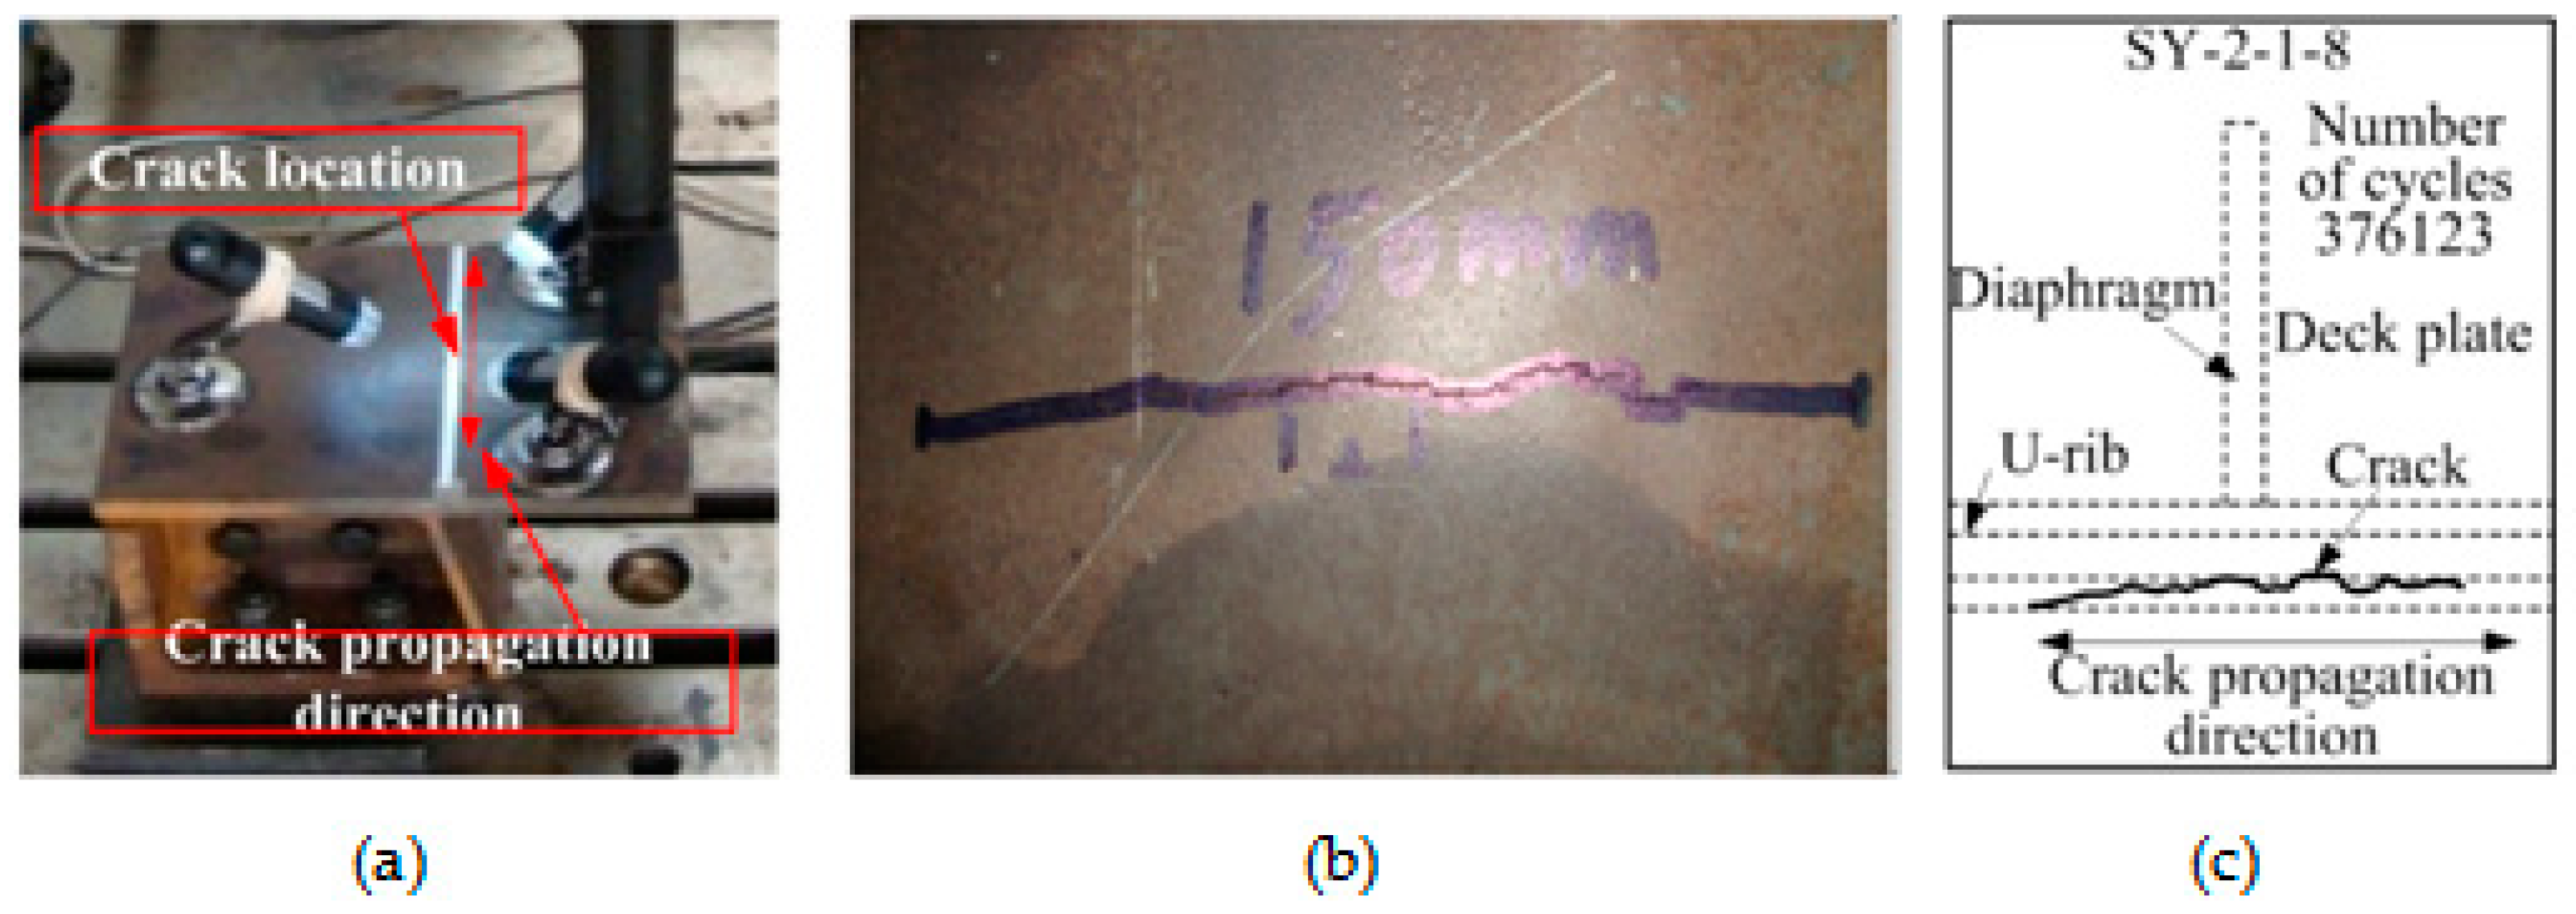
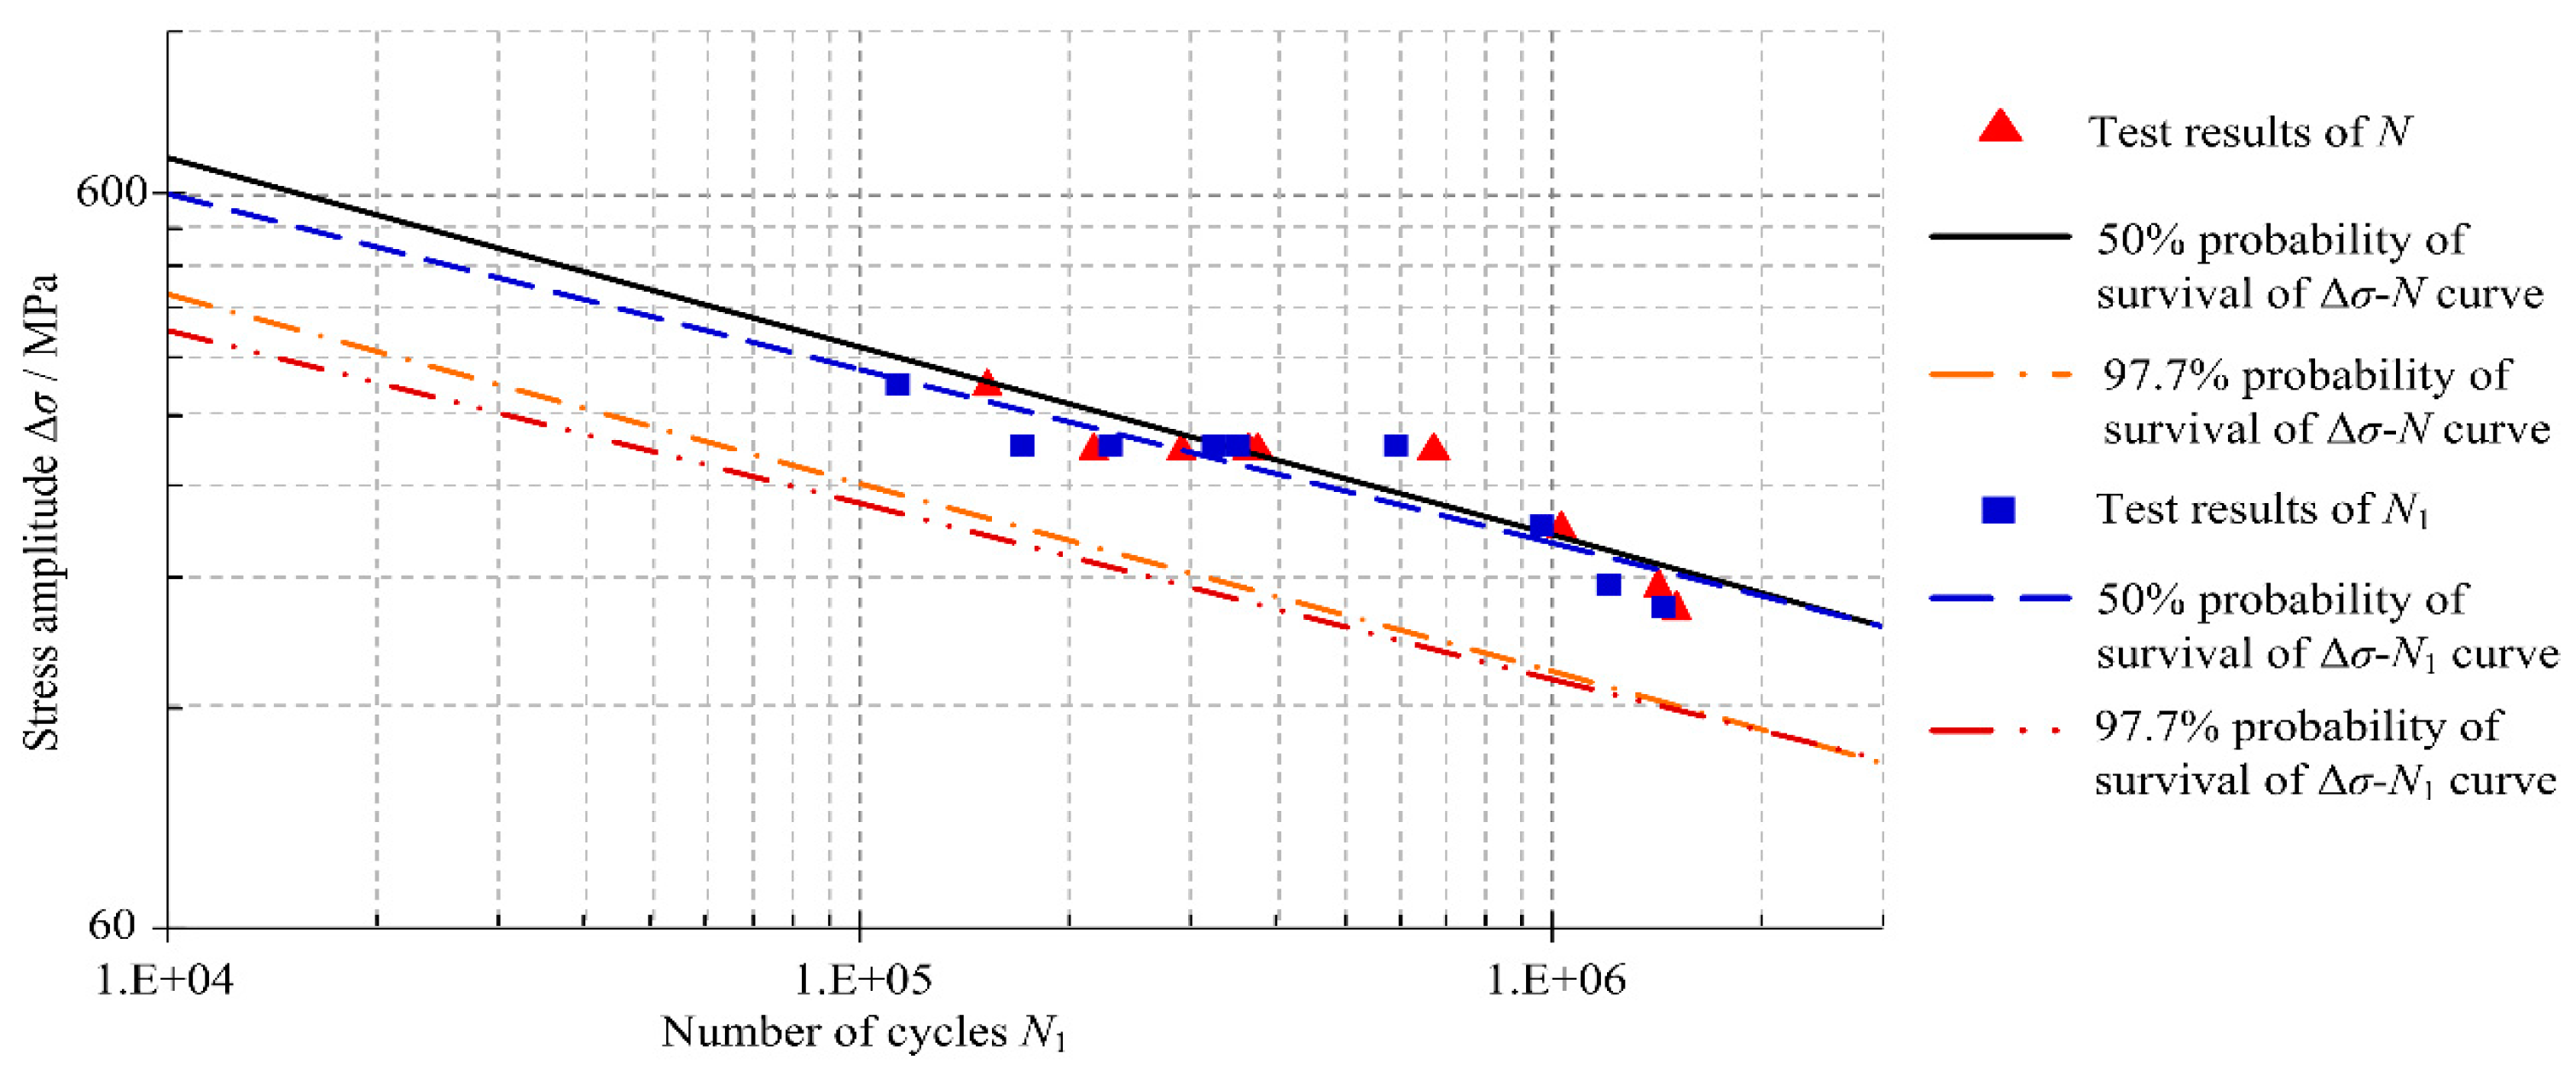
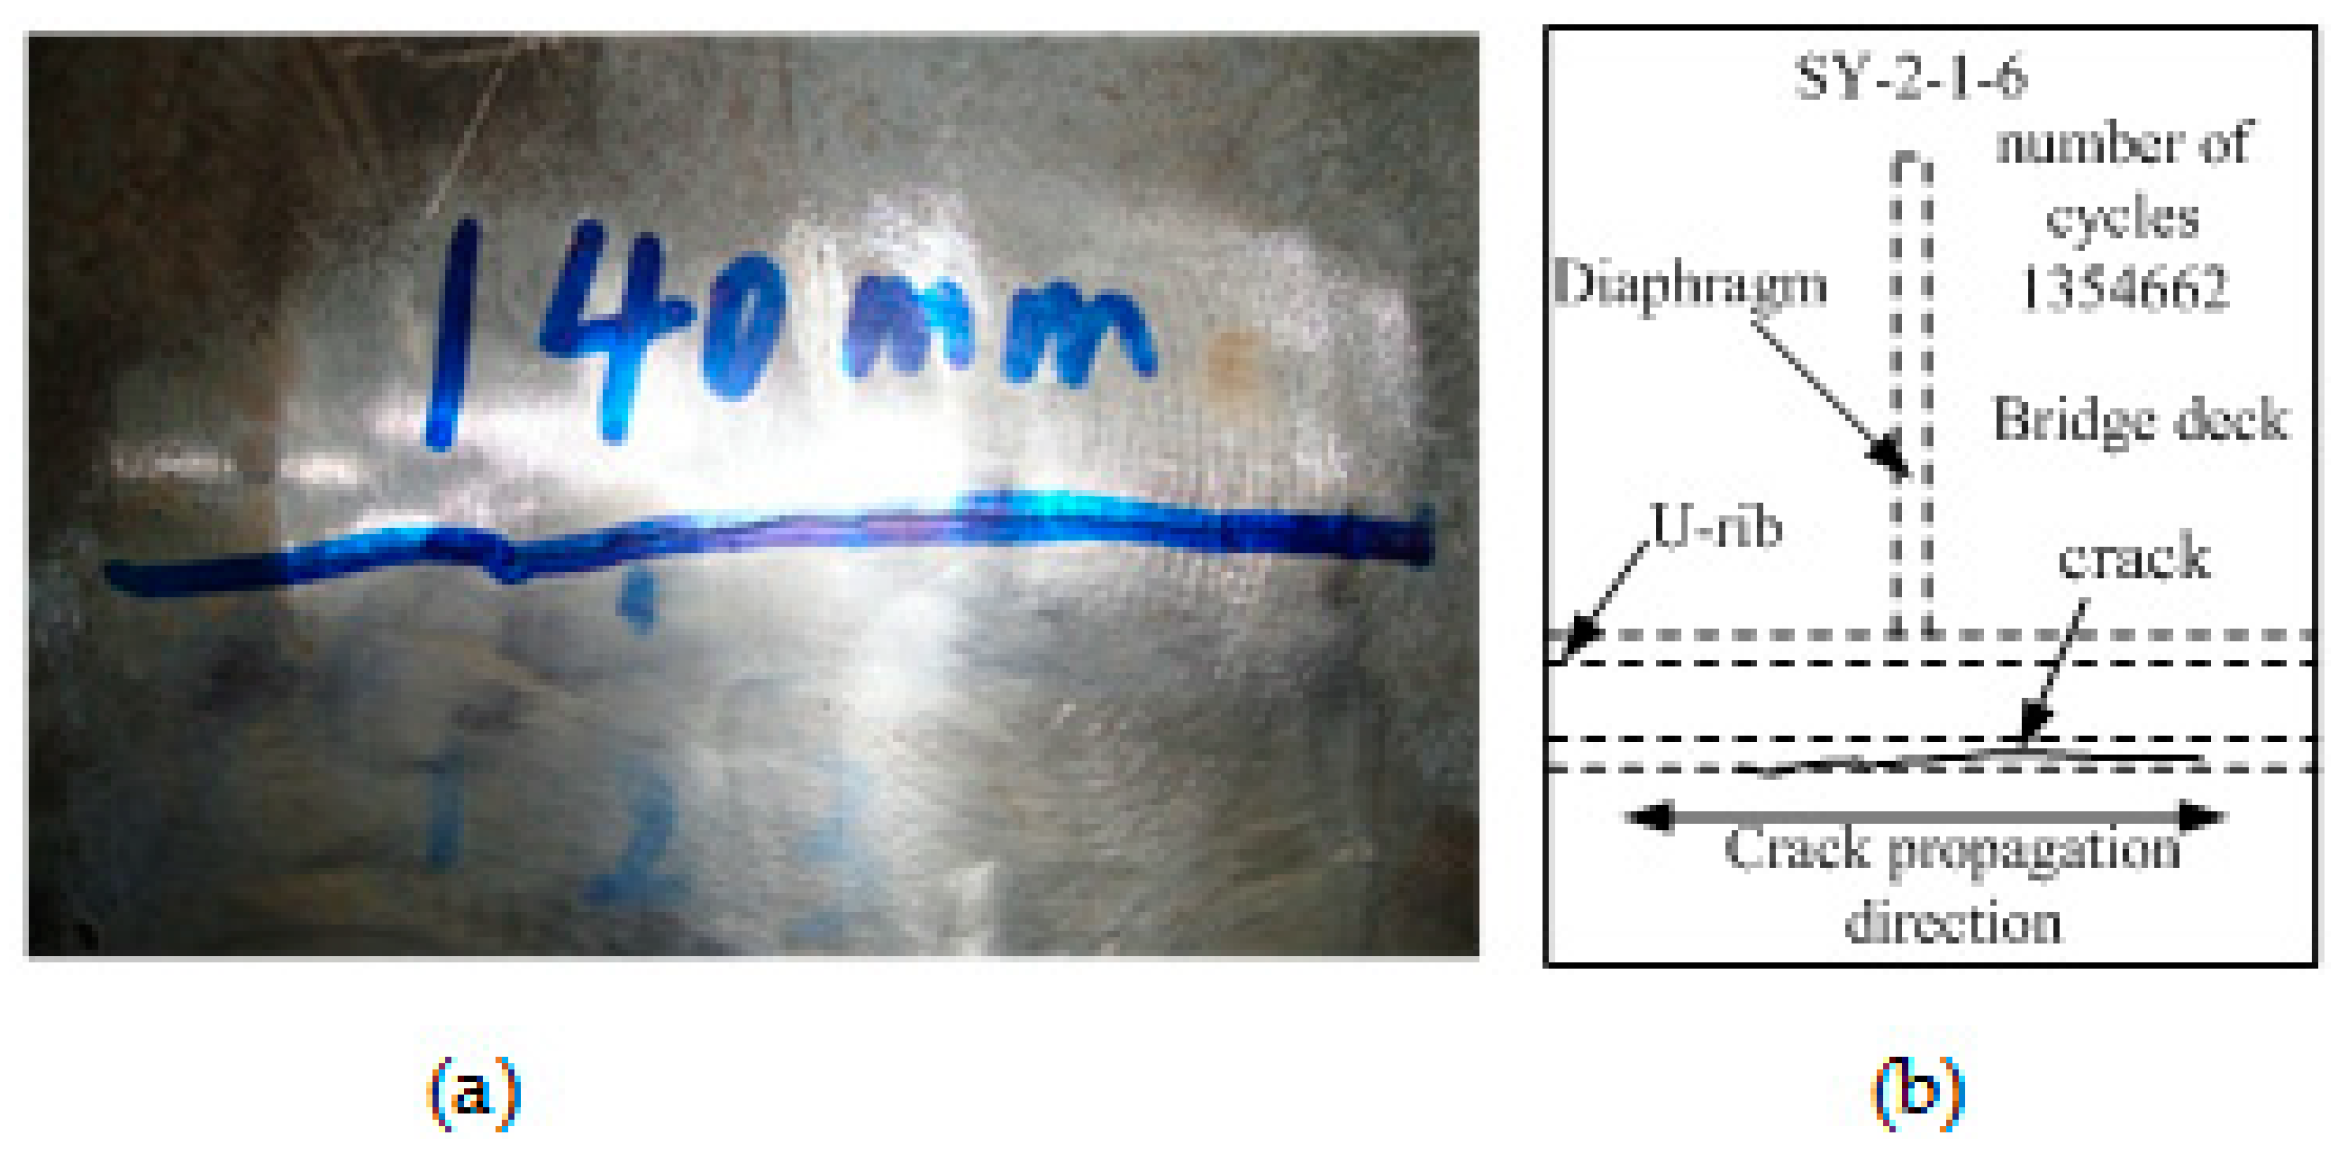
2.2. Fatigue Test and Result Analysis
2.3. The Effect of Surface Roughness on Fatigue Life
3. Stress Spectrum Calculation
3.1. Loading Method
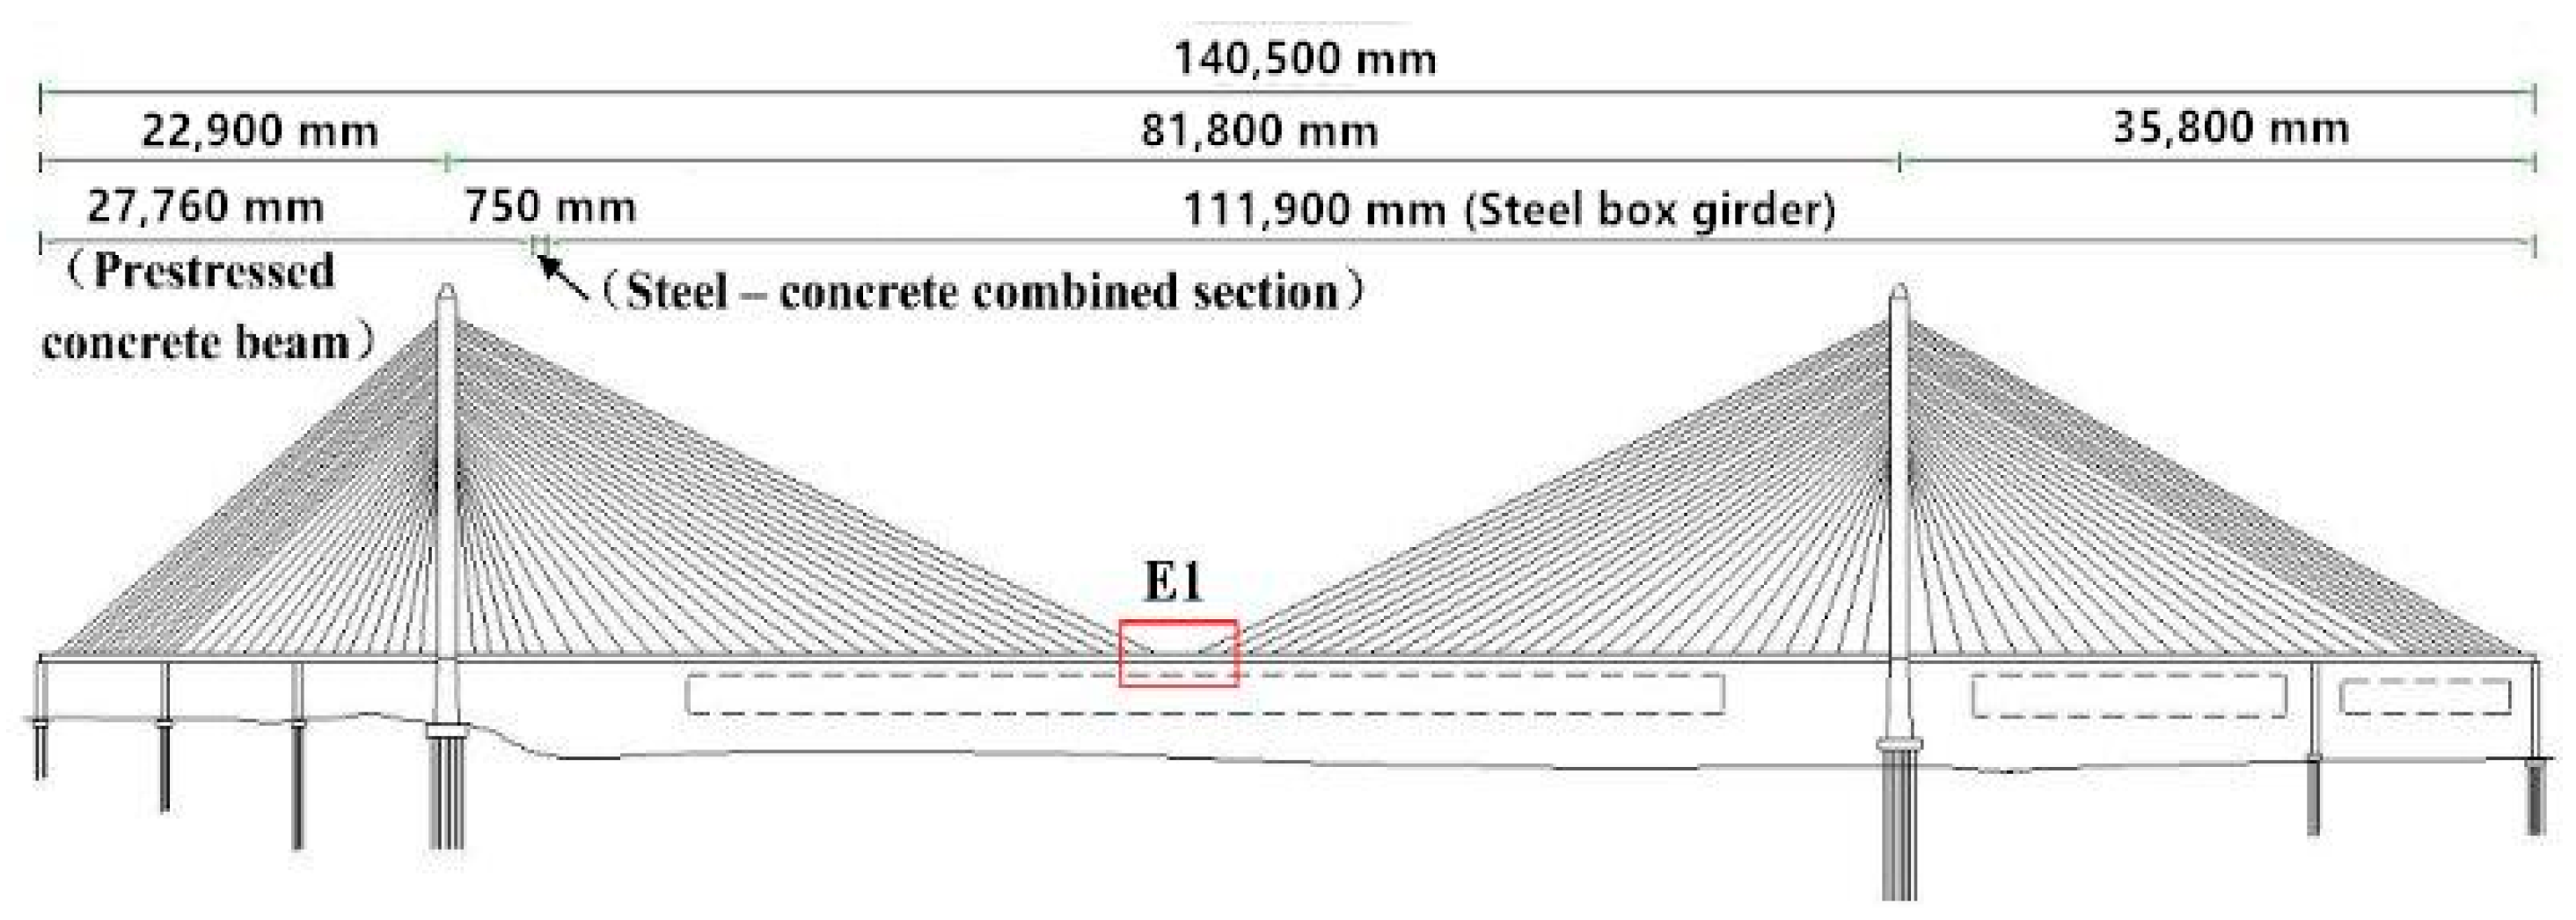
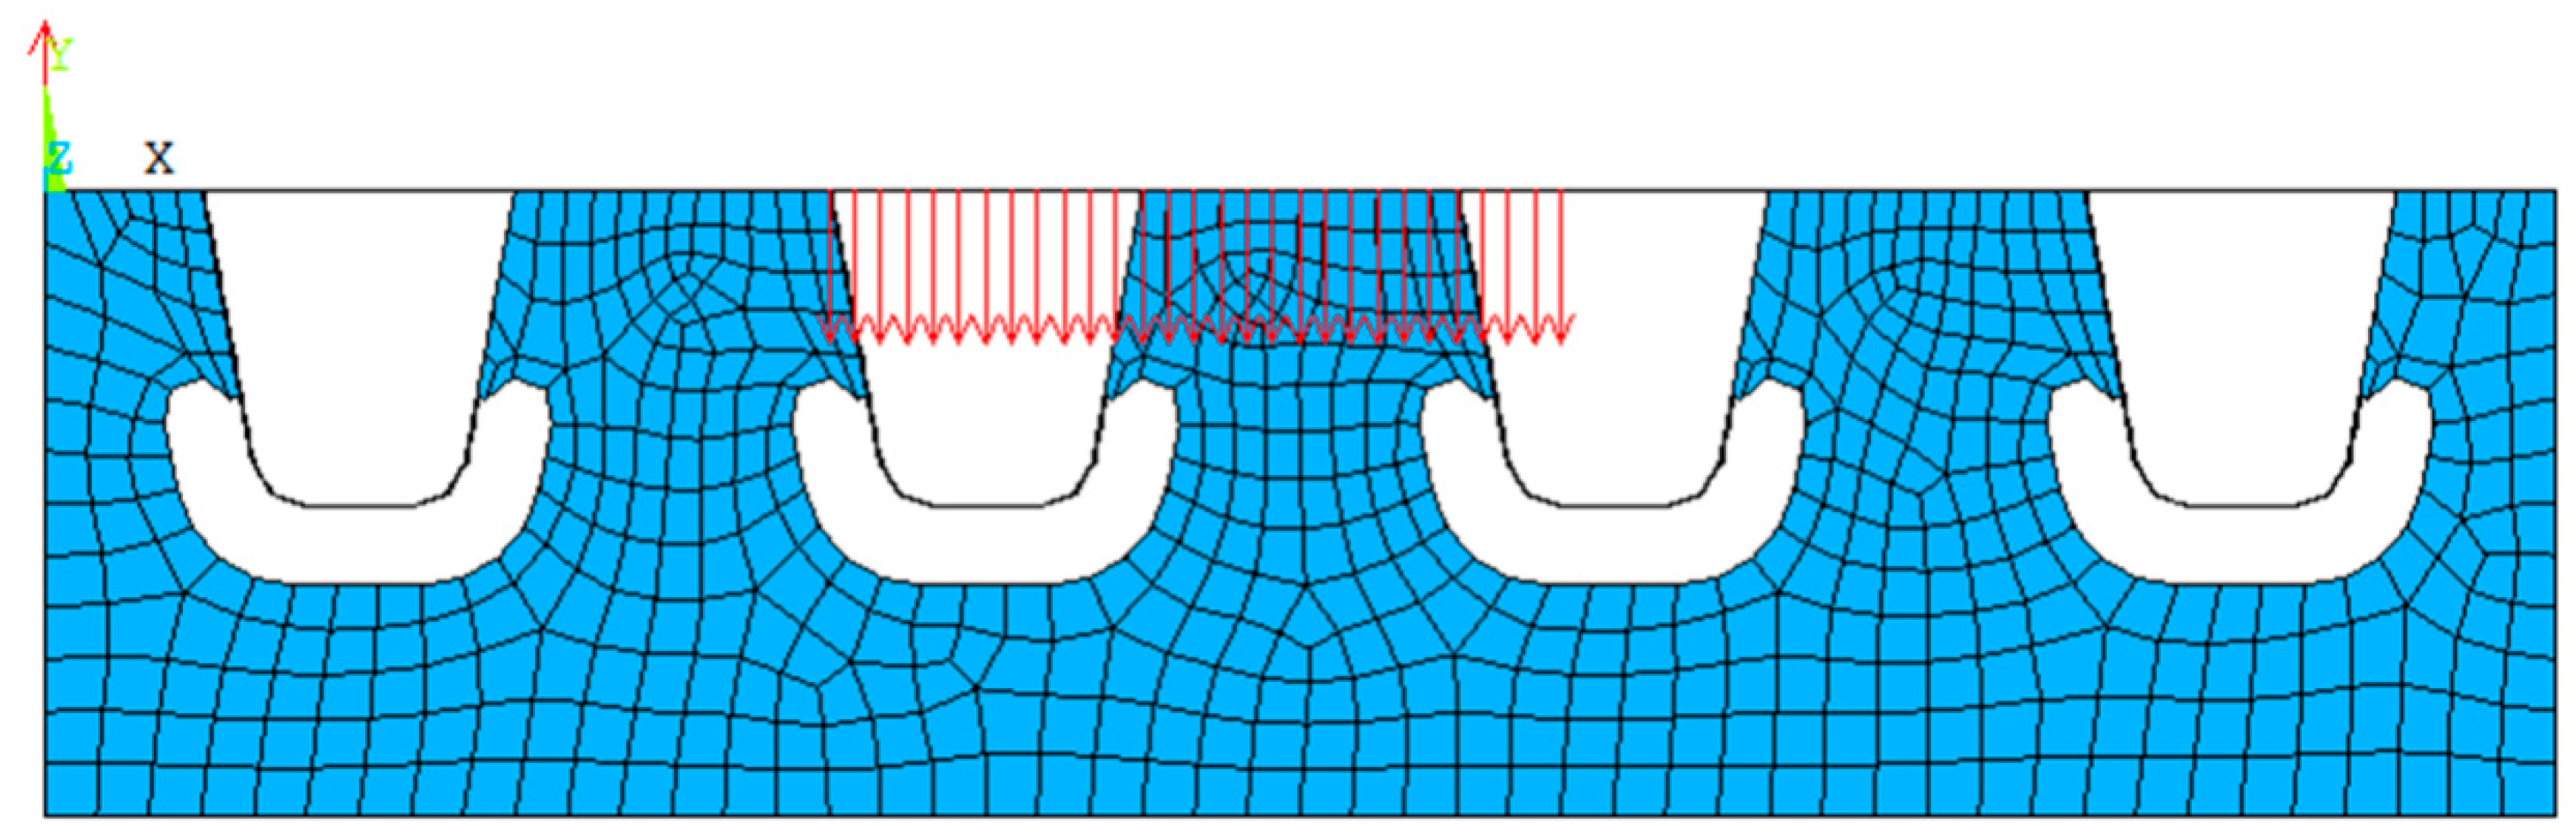
3.2. FE Model and Stress Calculation of Steel Bridge Structure
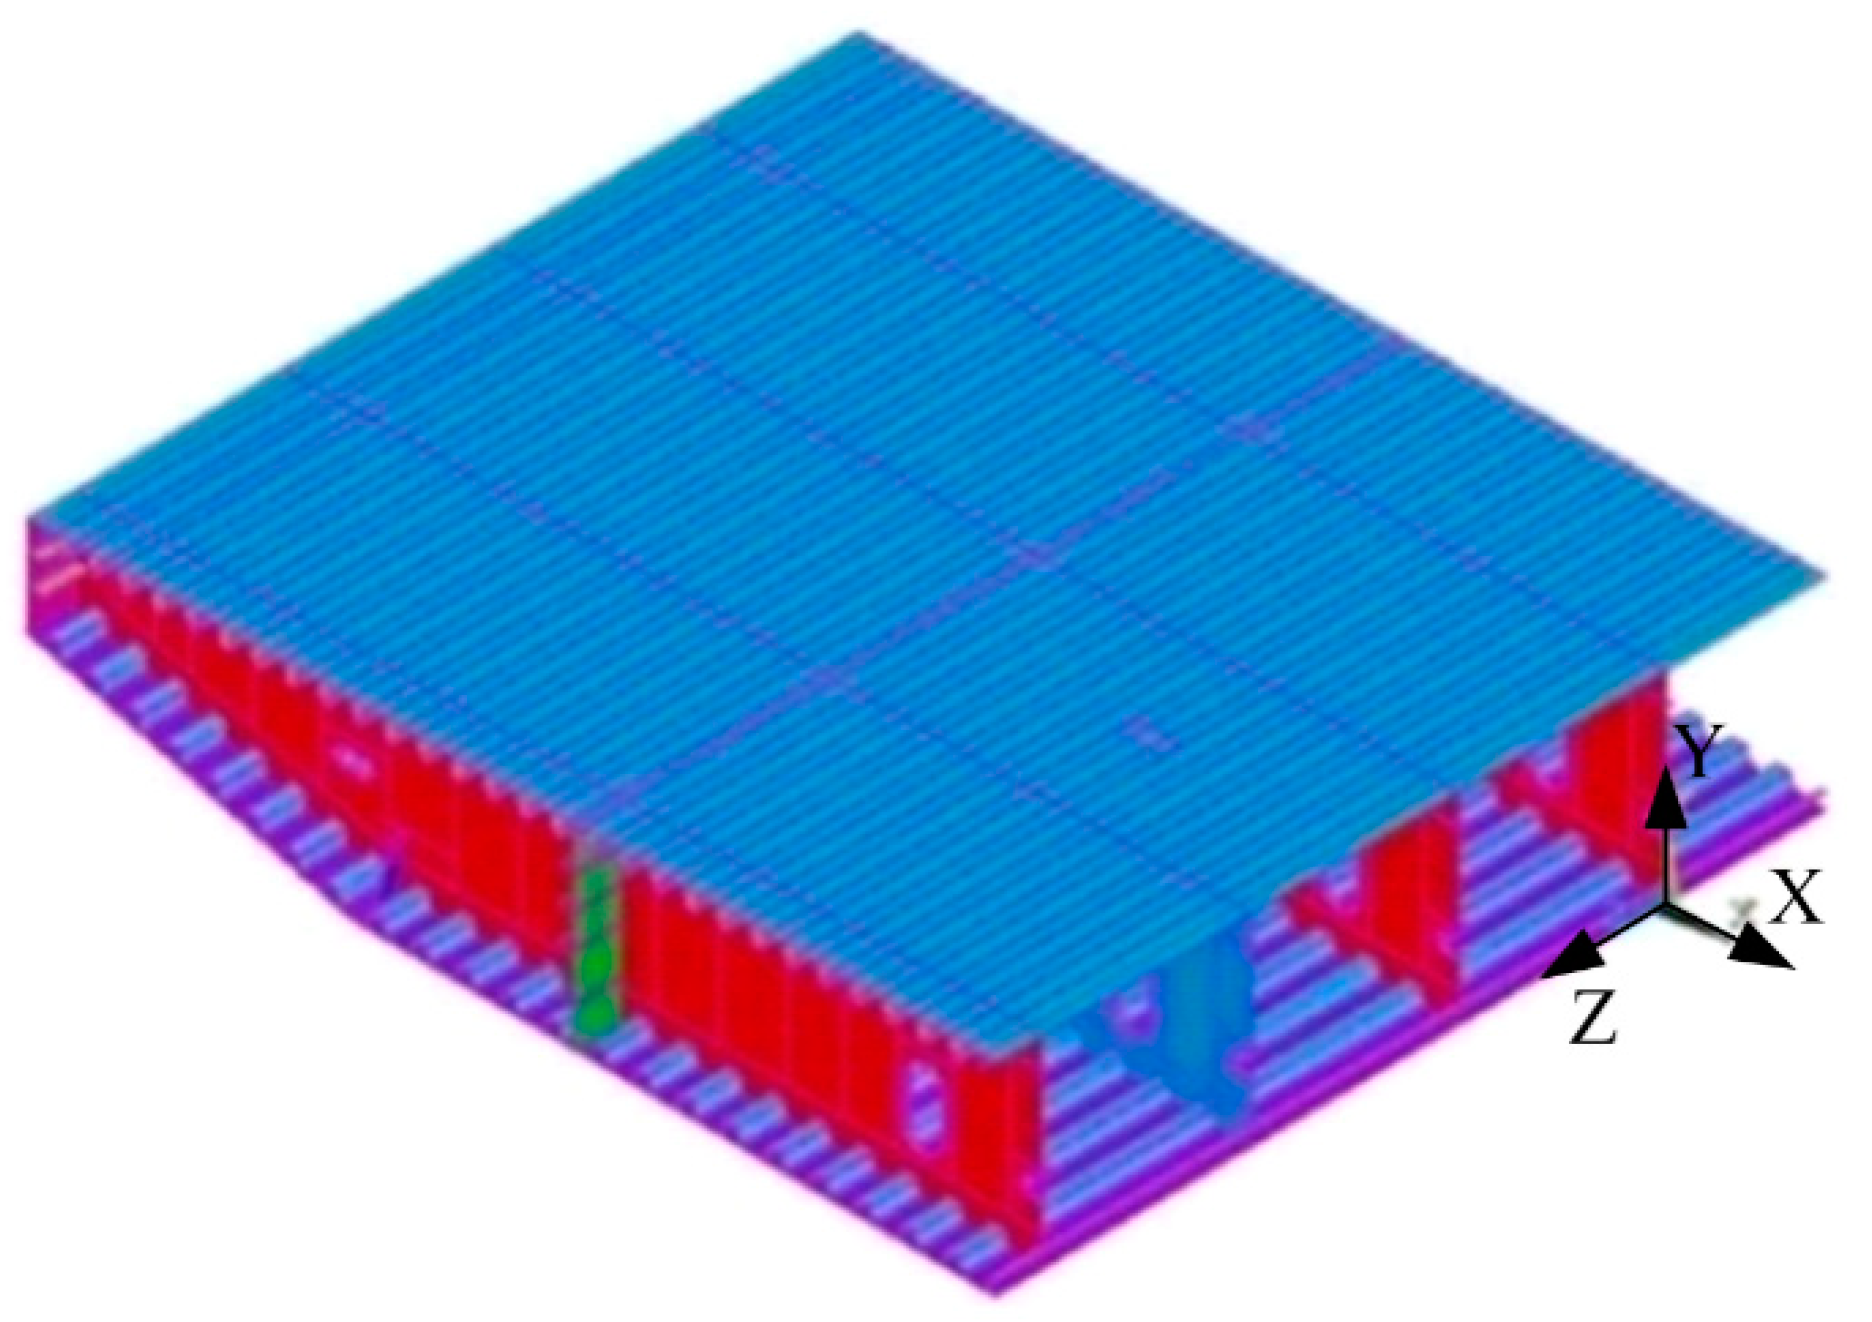
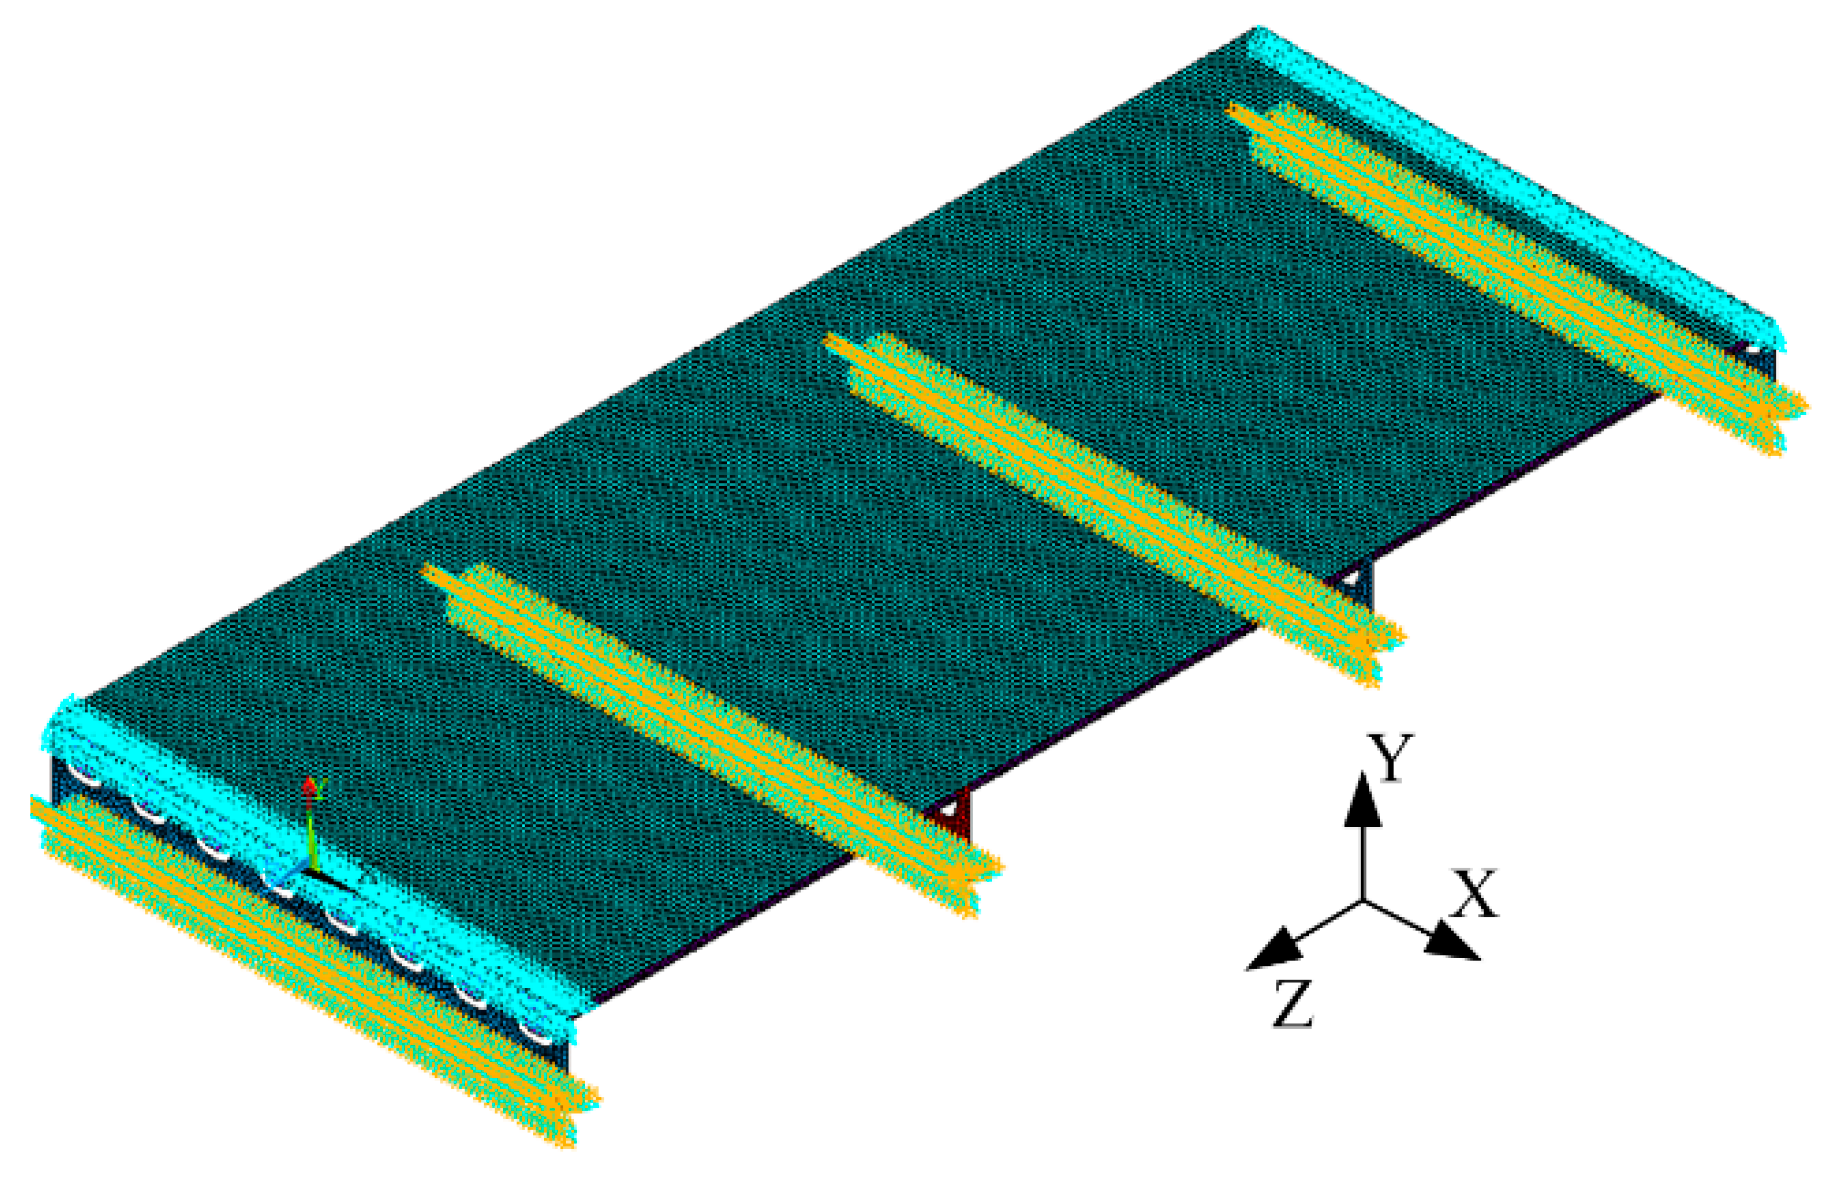
3.2.1. Simplified Finite Element Model of Steel Bridge Structure
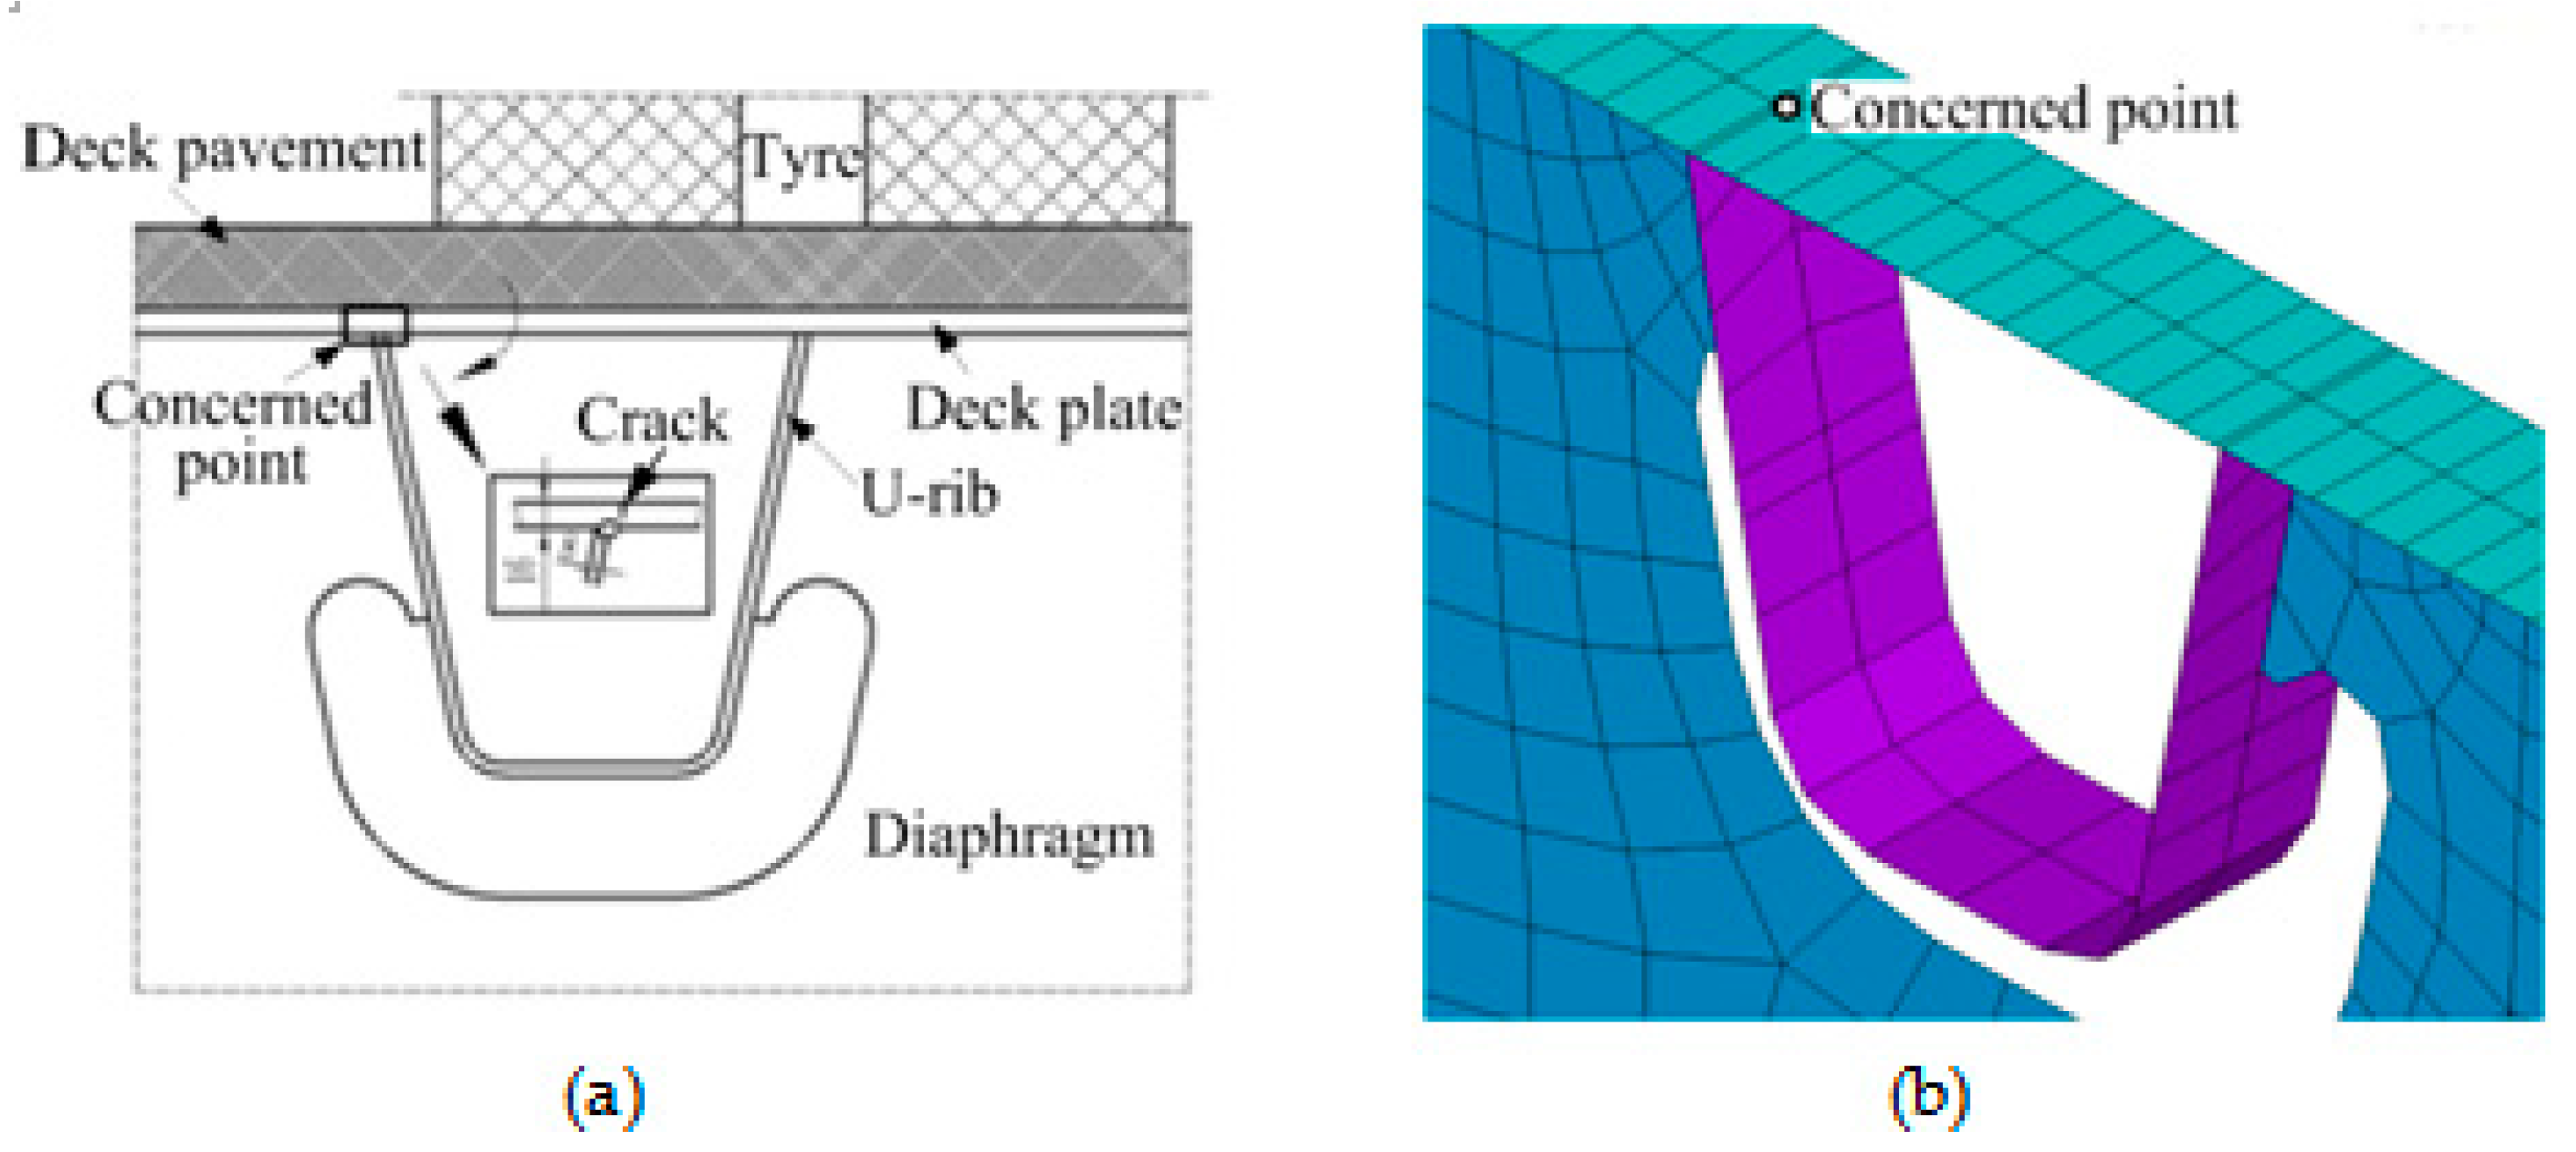
3.2.2. Determination of the Concerned Point
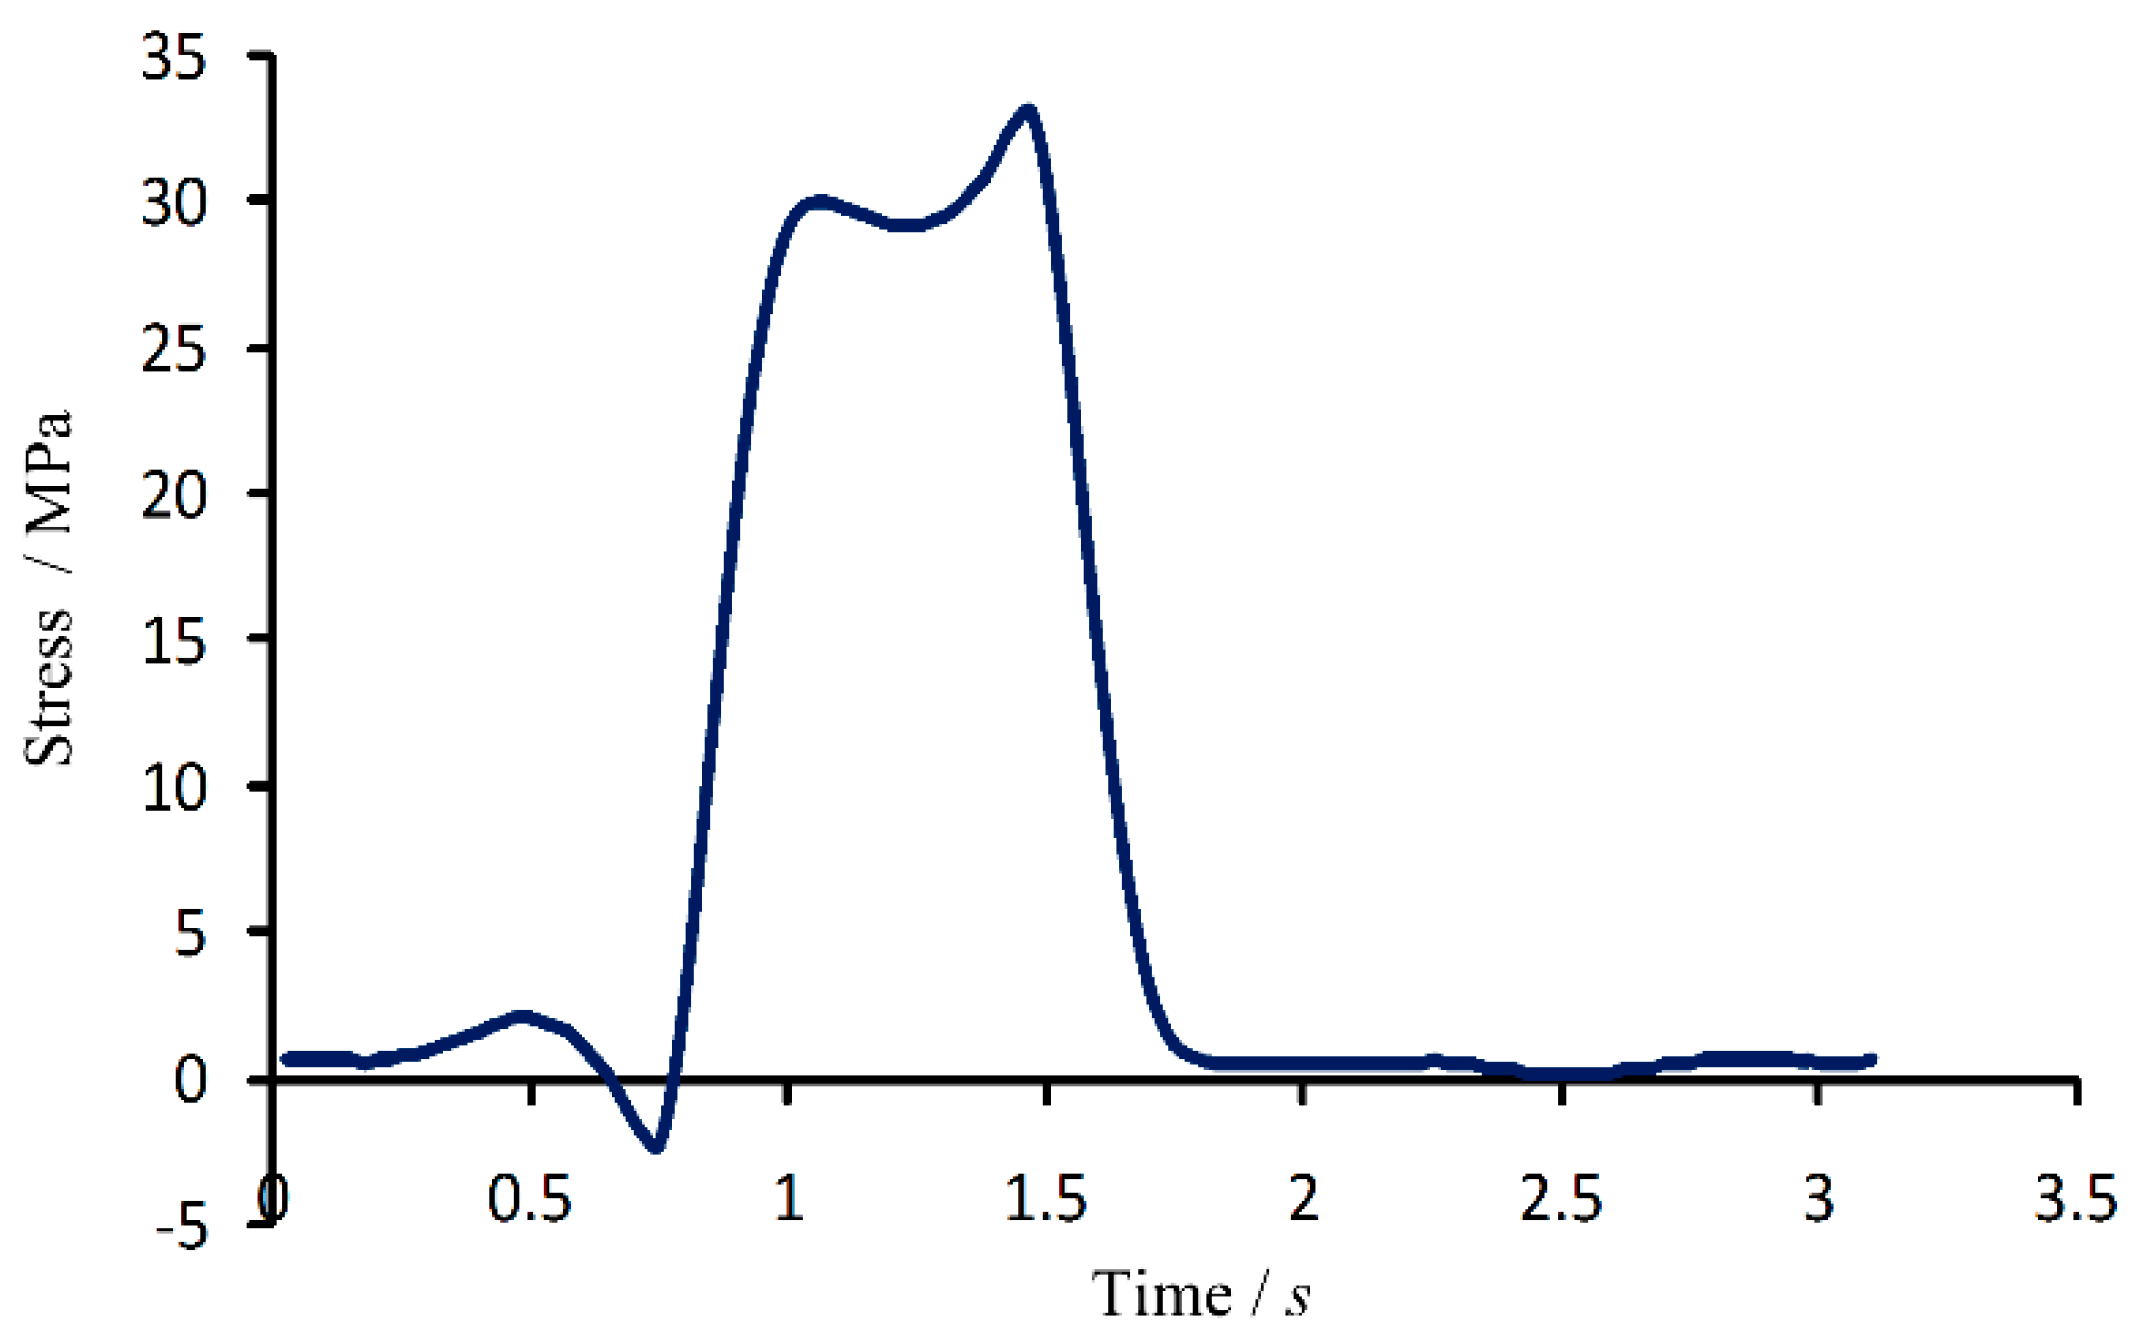
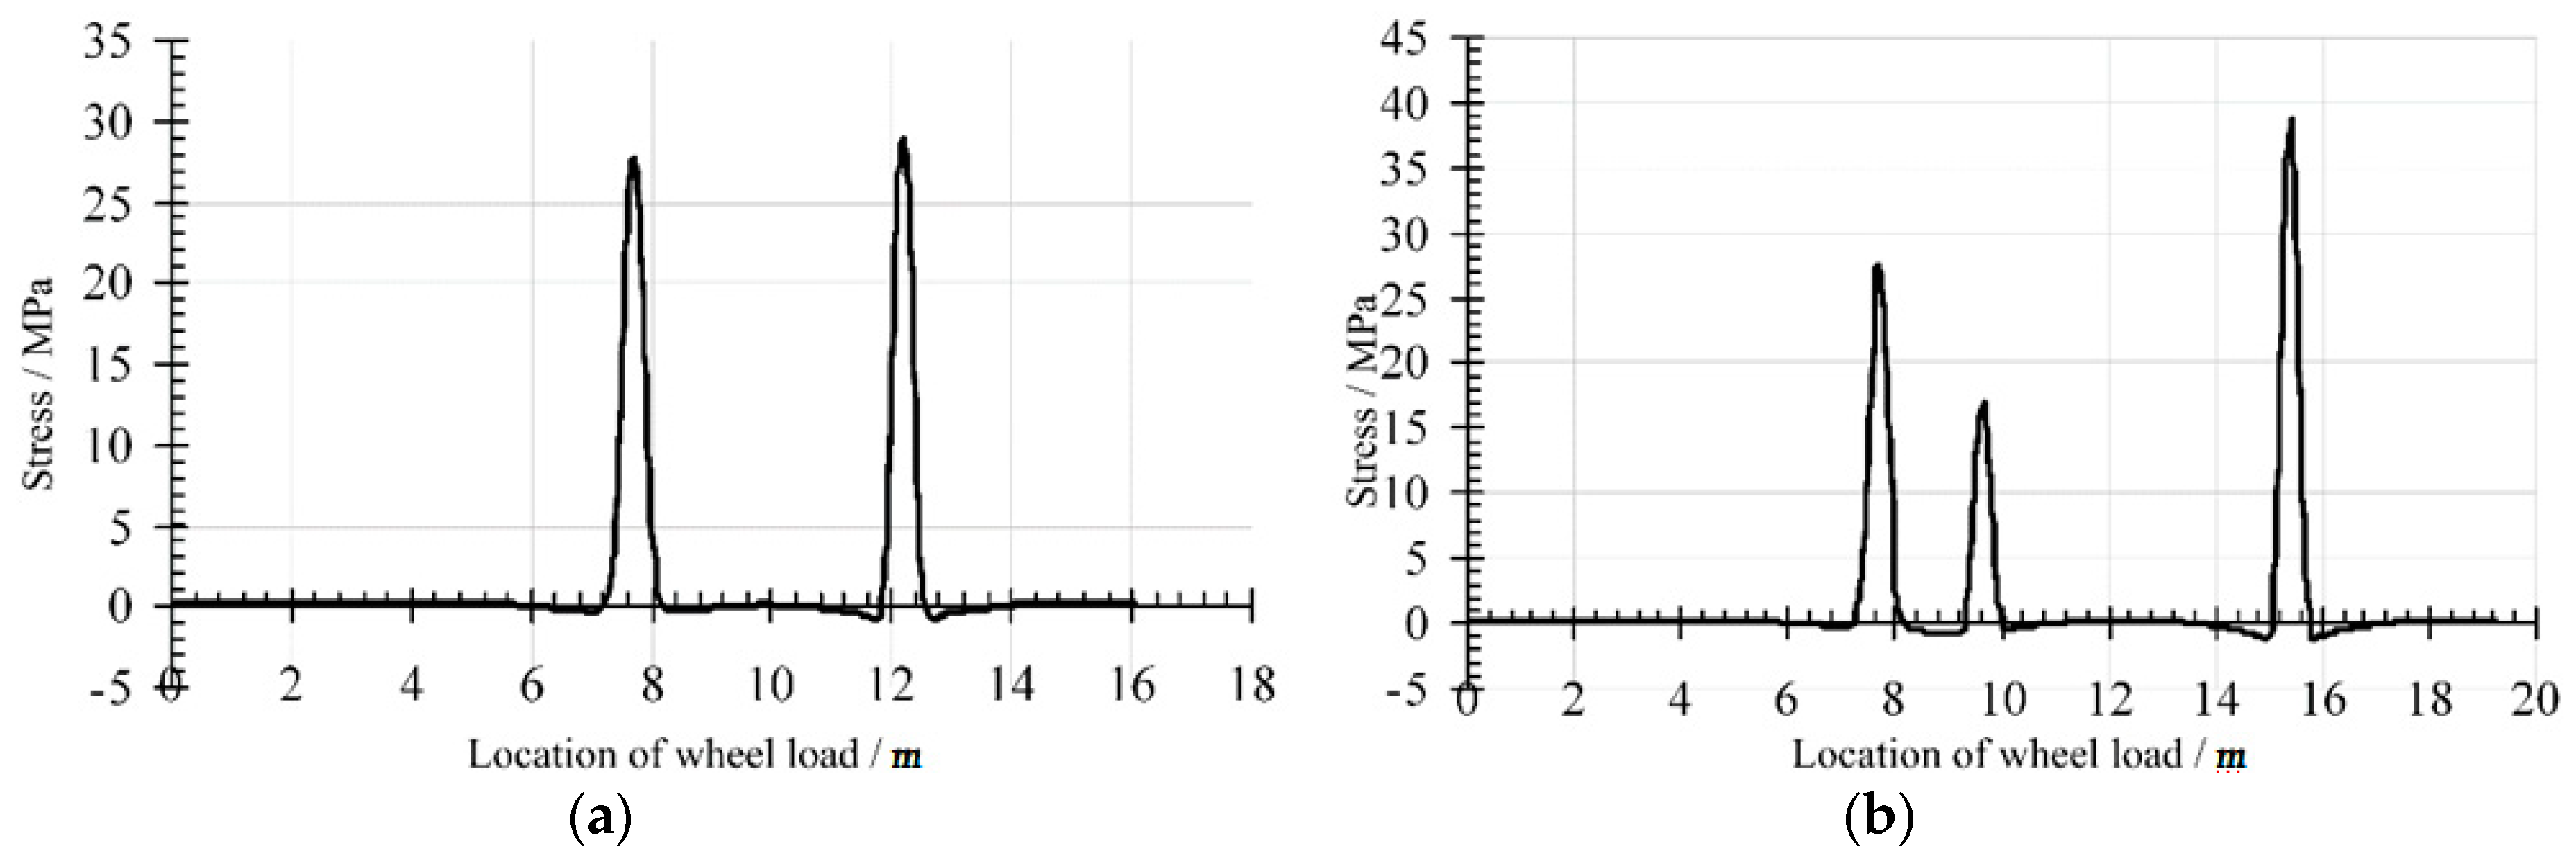
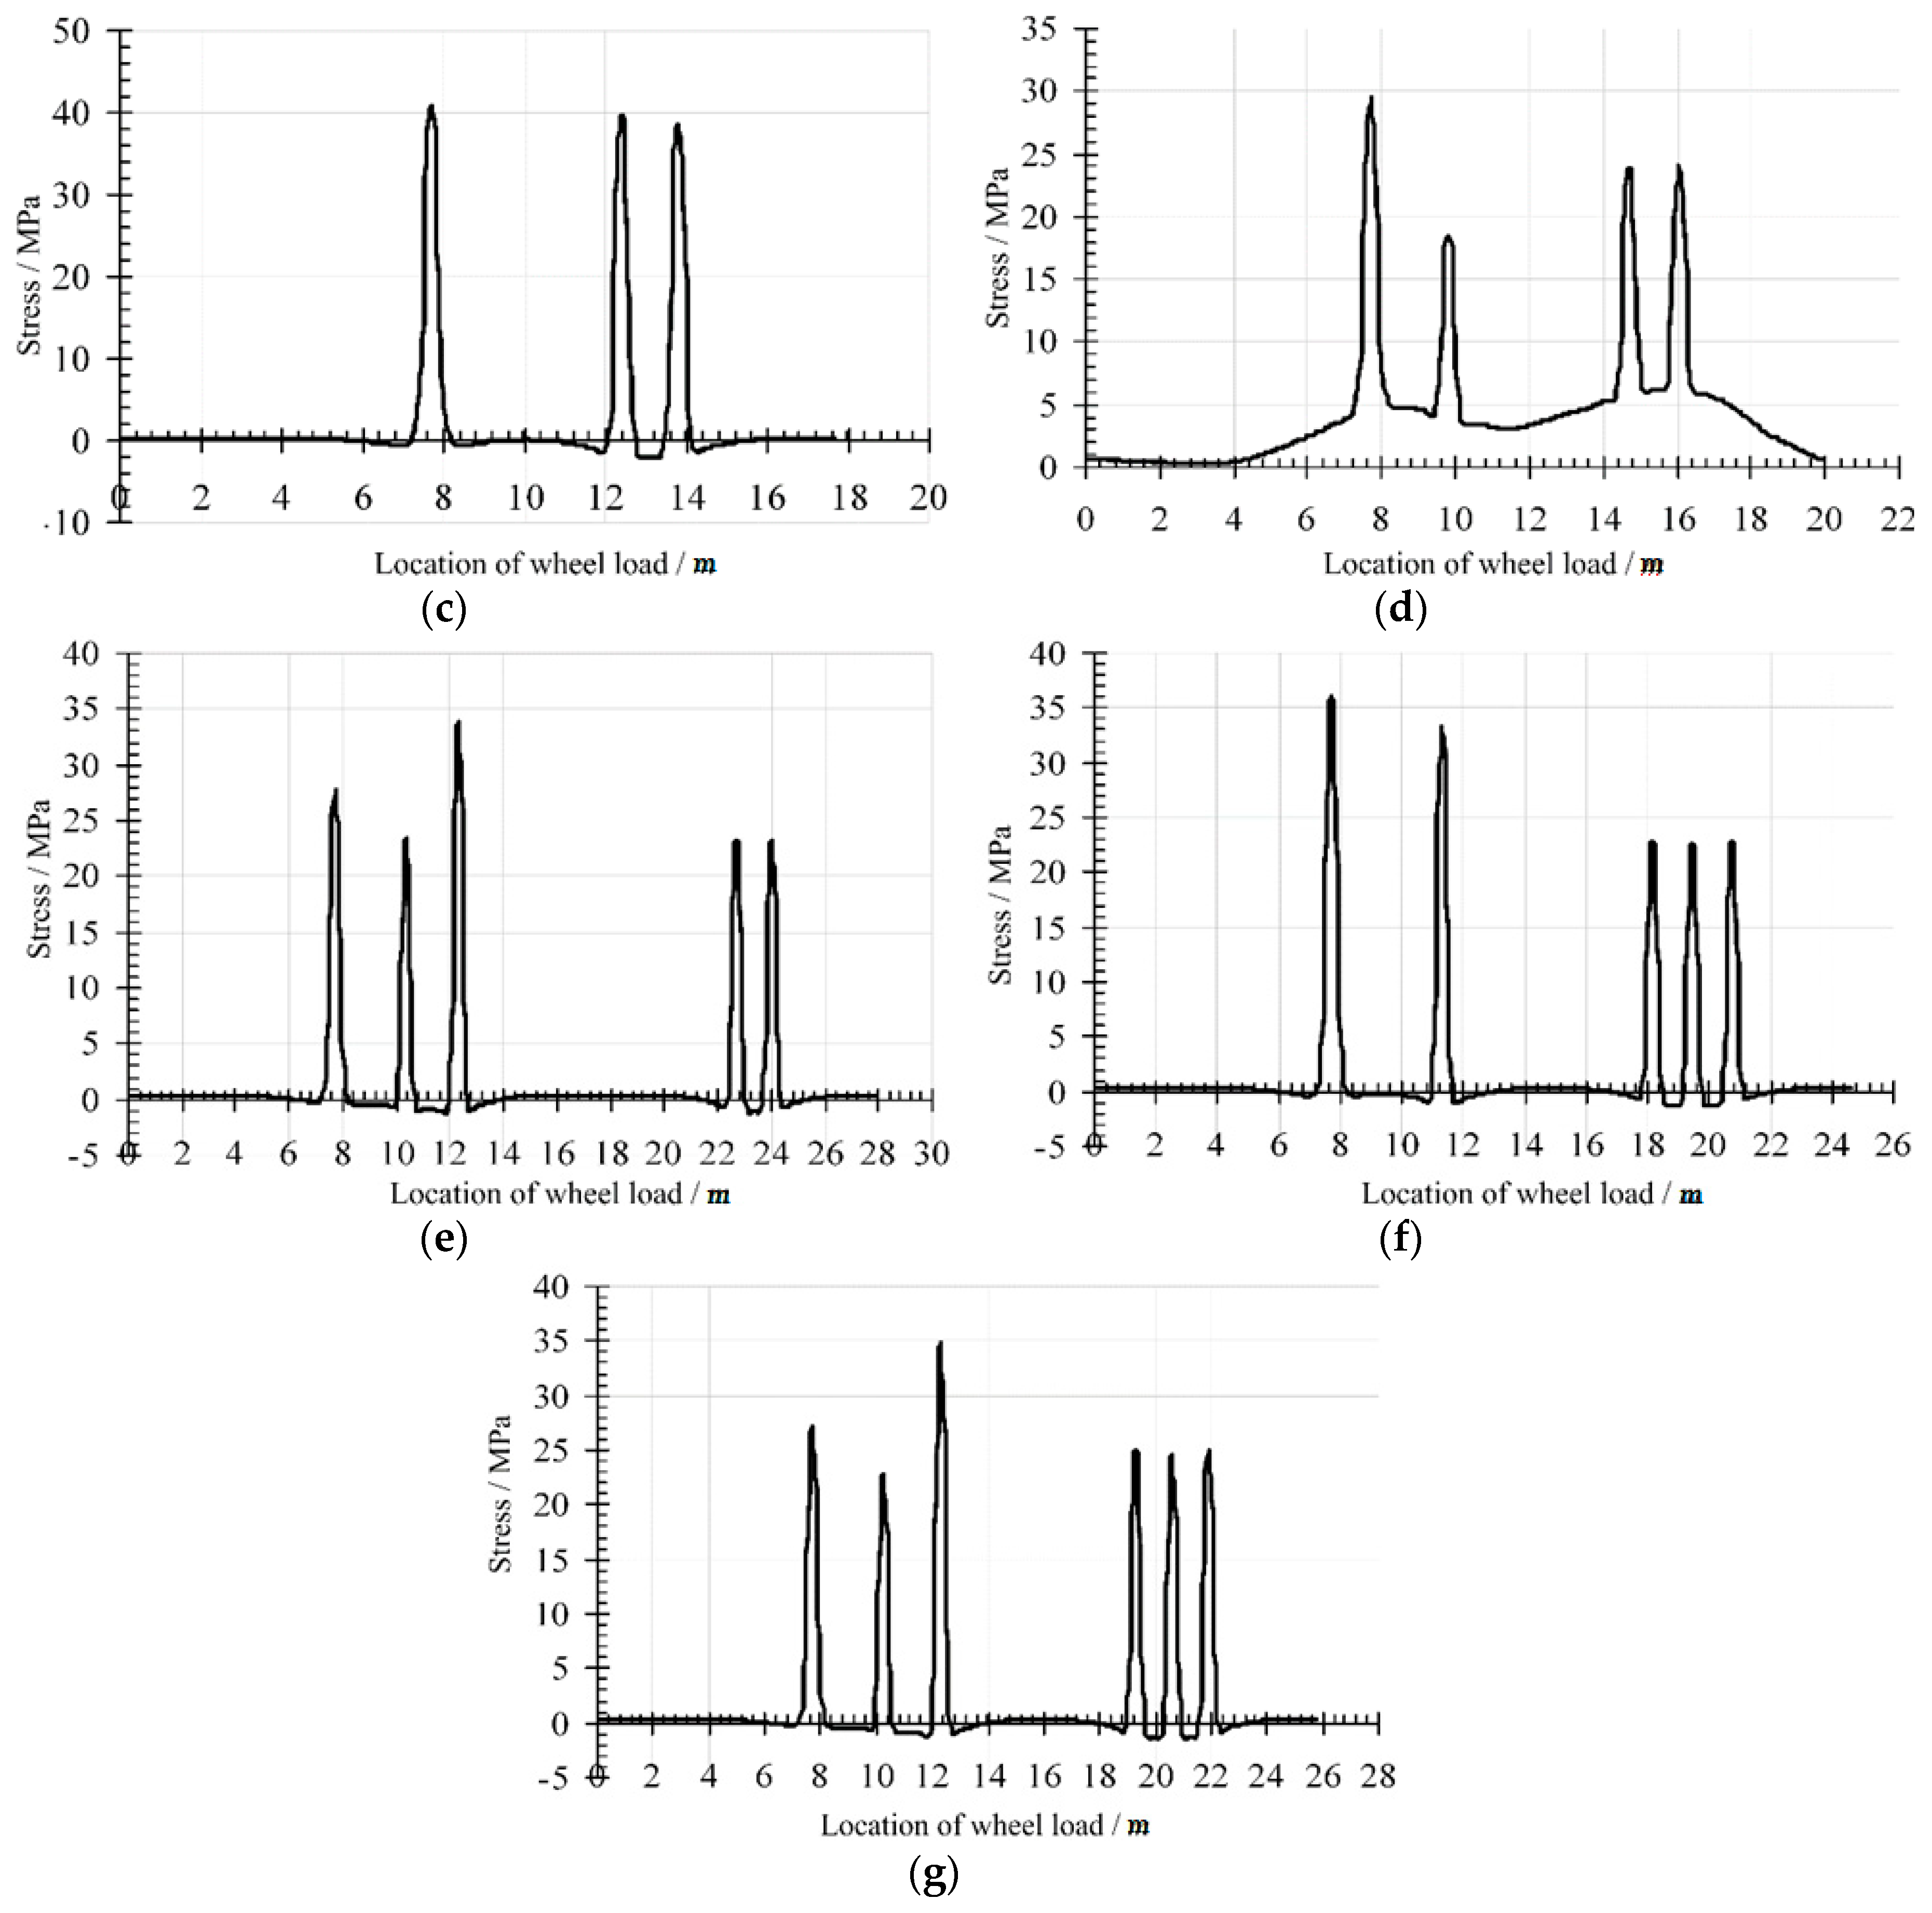
3.2.3. The Calculation of Stress Frequency Spectrum
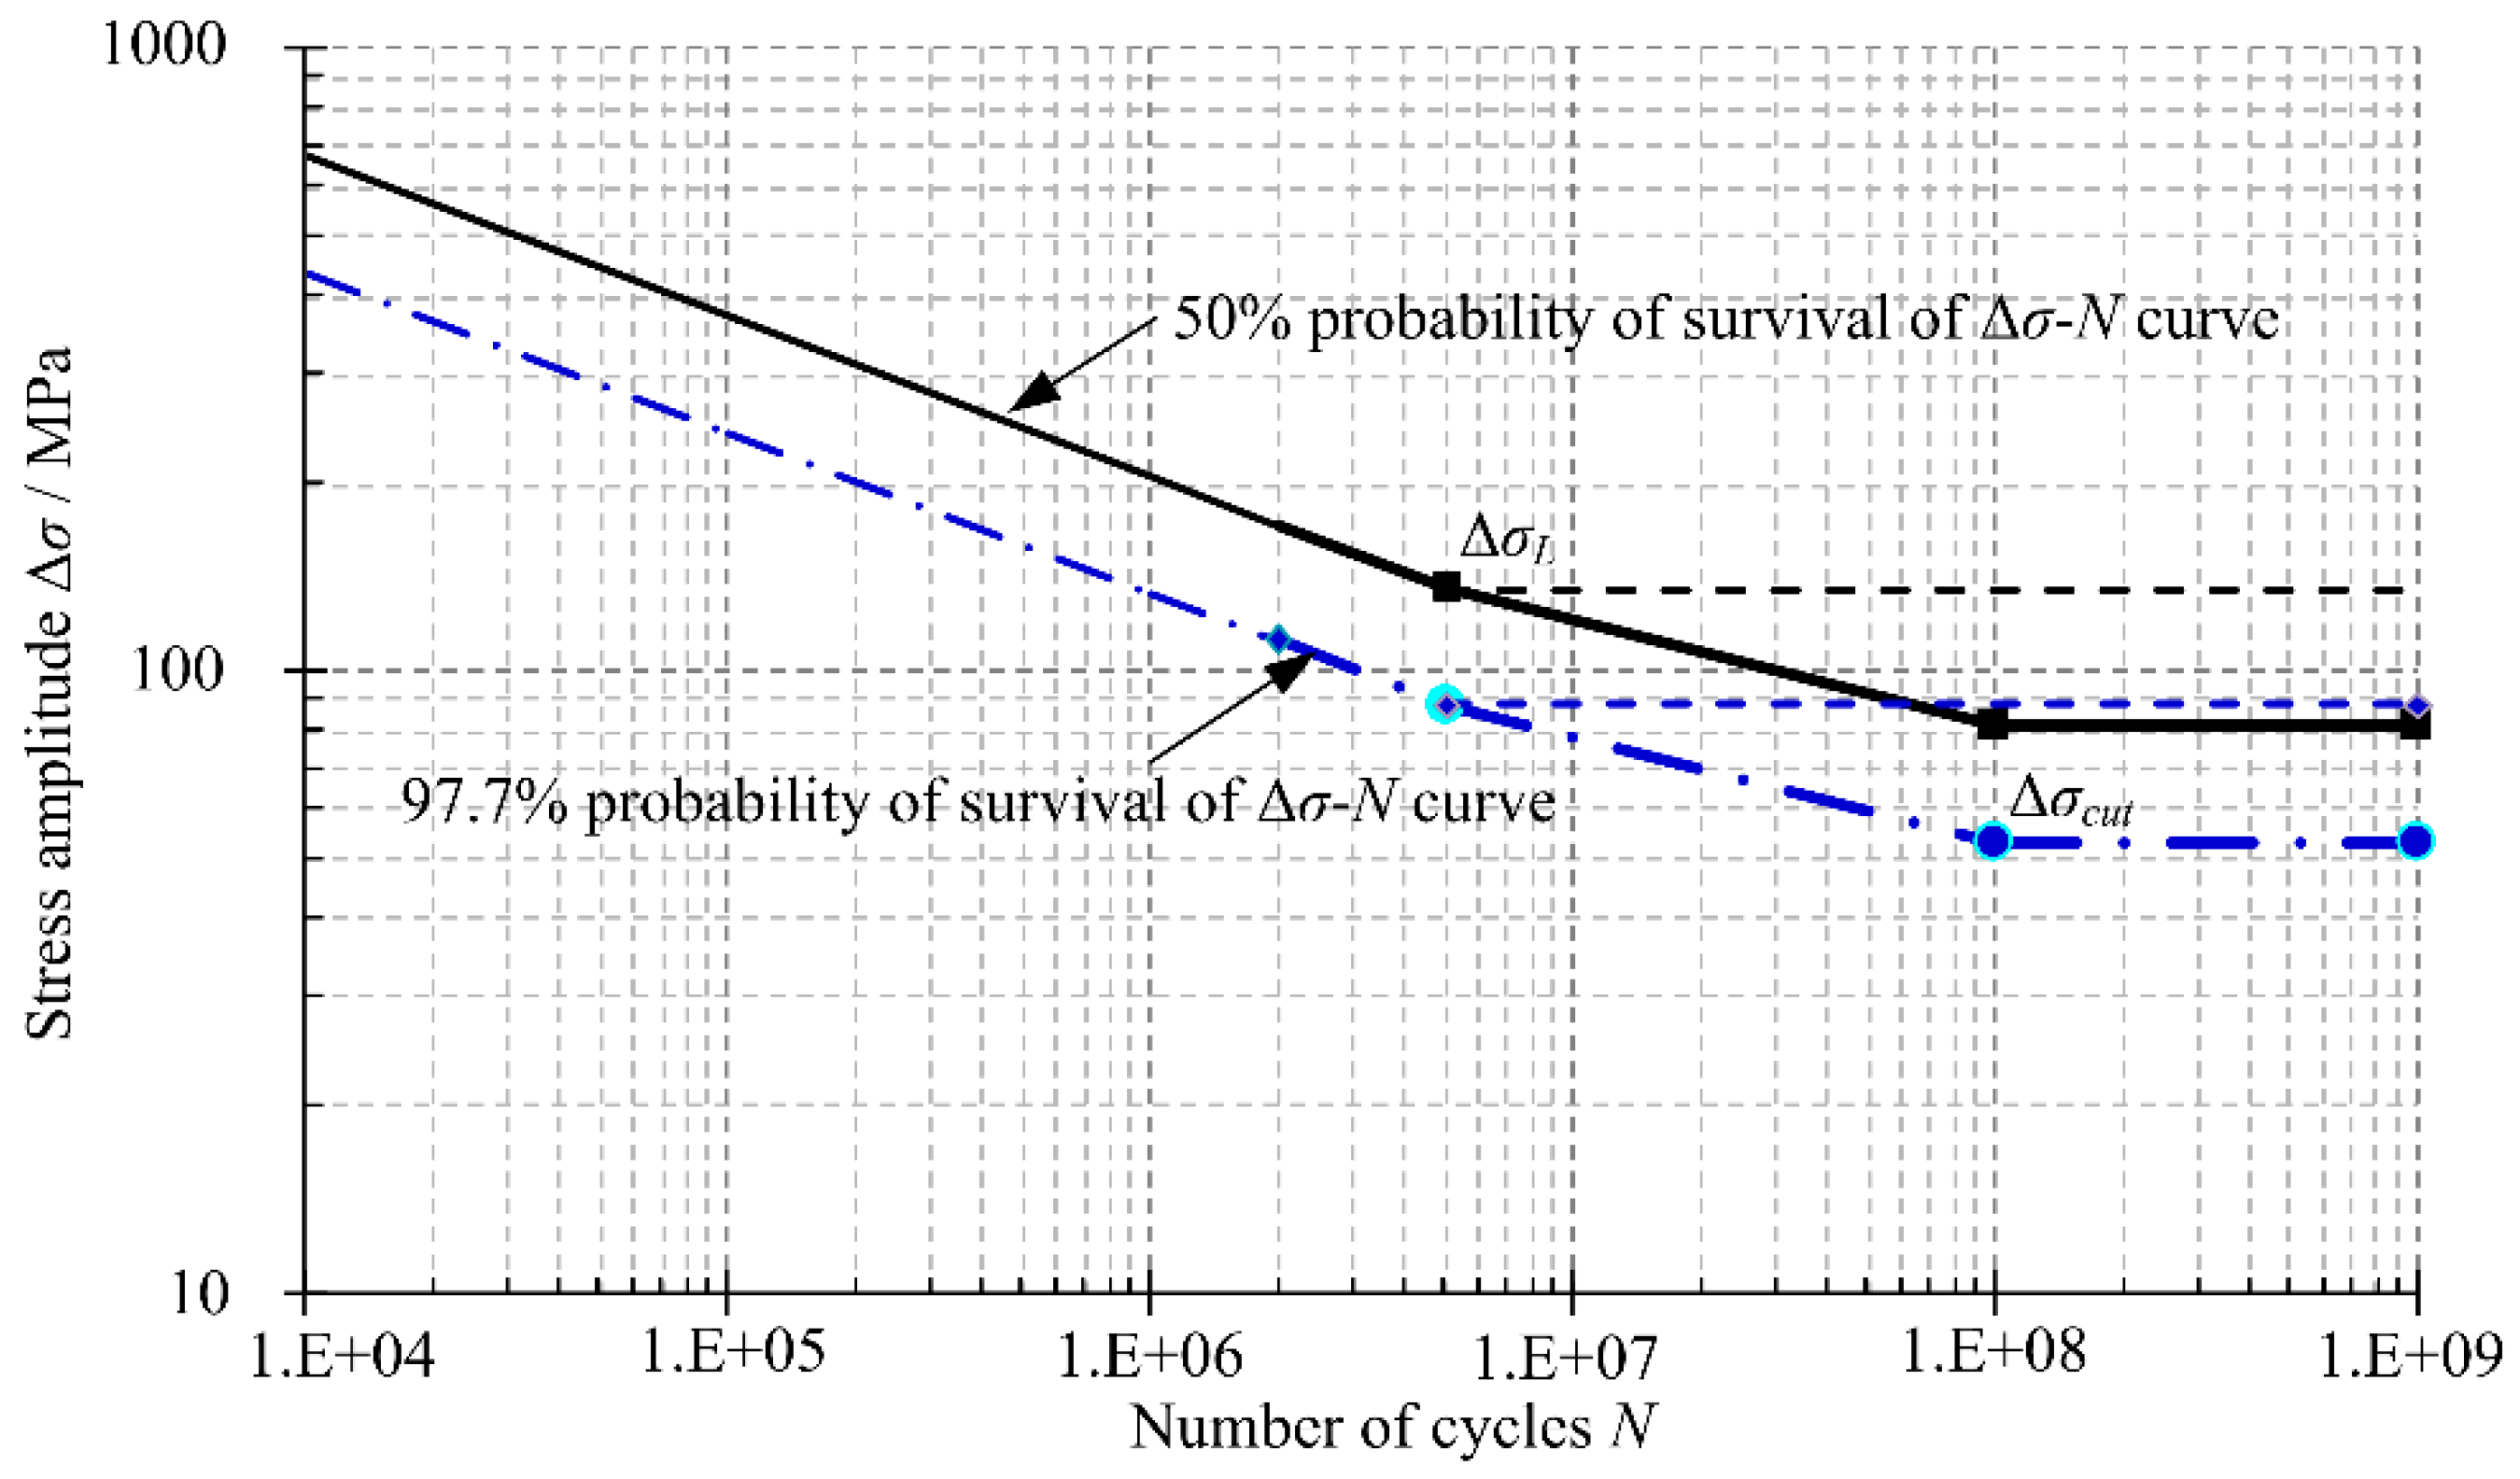
4. Fatigue Life Assessment of the Concerned Point
5. Conclusions
Author Contributions
Funding
Conflicts of Interest
References
- Ya, S.; Yamada, K.; Shikawa, T. Fatigue evaluation of rib-to-deck welded joints of orthotropic steel bridge deck. J. Bridge Eng. 2013, 18, 492–499. [Google Scholar] [CrossRef]
- Oh, C.K.; Hong, K.J.; Bae, D.; Do, H.; Han, T. Analytical and experimental studies on optimal details of orthotropic steel decks for long span bridges. Int. J. Steel Struct. 2011, 11, 227–234. [Google Scholar] [CrossRef]
- Fu, Z.; Ji, B.; Zhang, C.; Li, D. Experimental study on the fatigue performance of roof and U-rib welds of orthotropic steel bridge decks. KSCE J Civ. Eng. 2018, 22, 270–278. [Google Scholar] [CrossRef]
- Freitas, S.T.D.; Kolstein, H.; Bijlaard, F. Fatigue behavior of bonded and sandwich systems for strengthening orthotropic bridge decks. Compos. Struct. 2013, 97, 117–128. [Google Scholar] [CrossRef]
- Kainuma, S.; Ahn, J.H.; Jeong, Y.S.; Sugiyama, H.; Iwasaki, M. Evaluation of structural responses on artificial fatigue crack for bulb rib orthotropic deck. Adv. Struct. Eng. 2016, 18, 1355–1369. [Google Scholar] [CrossRef]
- Bocchieri, W.J.; Fisher, J.W. Williamsburg Bridge Replacement Orthotropic Deck as-Built Fatigue Test; ATLSS Report; Lehigh University: Bethlehem, PA, USA, 1998. [Google Scholar]
- Connor, R.J.; Richards, S.O.; Fisher, J.W. Long-term remote monitoring of prototype orthotropic deck panels on the Bronx-Whitestone Bridge for fatigue evaluation. In Recent Developments in Bridge Engineering; Swets &Zeitlinger B.V.: Lisse, The Netherlands, 2003; pp. 257–268. [Google Scholar]
- Cullimore, M.S.G.; Webber, D. Analysis of heavy girder bridge fatigue failures. Eng. Fail. Anal. 2000, 7, 145–168. [Google Scholar] [CrossRef]
- Choi, D.H.; Choi, H.Y.; Choi, J.H. The effect of diaphragm inside trough rib on fatigue behavior of trough rib and cross beam connections in orthotropic steel decks. J. Korean Soc. Steel Constr. 2000, 23, 239–250. [Google Scholar]
- Nguyen, H.T.; Chu, Q.T.; Kim, S.E. Fatigue analysis of a pre-fabricated orthotropic steel deck for light-weight vehicles. J. Constr. Steel Res. 2011, 67, 647–655. [Google Scholar] [CrossRef]
- Battista, R.C.; Pfeil, M.S.; Carvalho, E.M.L. Fatigue life estimates for a slender orthotropic steel deck. J. Constr. Steel Res. 2008, 64, 134–143. [Google Scholar] [CrossRef]
- Cui, C.; Zhang, Q.H.; Luo, Y.; Hao, H.; Li, J. Fatigue reliability evaluation of deck-to-rib welded joints in OSD considering stochastic traffic load and welding residual stress. Int. J. Fatigue 2018, 111, 151–160. [Google Scholar] [CrossRef]
- Farreras-Alcover, I.; Chryssanthopoulos, M.K.; Andersen, J.E. Data-based models for fatigue reliability of orthotropic steel bridge decks based on temperature, traffic and strain monitoring. Int. J. Fatigue 2017, 95, 104–119. [Google Scholar] [CrossRef]
- Kainuma, S.; Jeong, Y.S.; Ahn, J.H.; Yamagami, T.; Tsukamoto, S. Behavior and stress of orthotropic deck with bulb rib by surface corrosion. J. Constr. Steel Res. 2015, 113, 135–145. [Google Scholar] [CrossRef]
- Wolchuk, R. Lessons from weld cracks in orthotropic decks on three European bridges. J. Struct. Eng. 1990, 116, 75–84. [Google Scholar] [CrossRef]
- Tsakopoulos, P.A.; Fisher, J.W. Full-scale fatigue tests of steel orthotropic deck panel for the Bronx—Whitestone Bridge rehabilitation. Bridge Struct. 2005, 1, 55–66. [Google Scholar] [CrossRef]
- Connor, R.J.; Fisher, J.W. Consistent approach to calculating stresses for fatigue design of welded rib-to-web connections in steel orthotropic bridge decks. J. Bridge Eng. 2006, 11, 517–525. [Google Scholar] [CrossRef]
- Maljaars, J.; Bonet, E.; Pijpers, R.J.M. Fatigue resistance of the deck plate in steel orthotropic deck structures. Eng. Fract. Mech. 2018, 201, 214–228. [Google Scholar] [CrossRef]
- Xiao, Z.G.; Yamada, K.; Ya, S.; Zhao, X.L. Stress analyses and fatigue evaluation of rib-to-deck joints in steel orthotropic decks. Int. J. Fatigue 2008, 30, 1387–1397. [Google Scholar] [CrossRef]
- Kainuma, S.; Yang, M.Y.; Jeong, Y.S.; Inokuchi, S.; Kawabata, A.; Uchida, D. Experimental investigation for structural parameter effects on fatigue behavior of rib-to-deck welded joints in orthotropic steel decks. Eng. Fail. Anal. 2017, 79, 520–537. [Google Scholar] [CrossRef]
- Kainuma, S.; Yang, M.Y.; Jeong, Y.S.; Inokuchi, S.; Kawabata, A.; Uchida, D. Fatigue Behavior Investigation and Stress Analysis for Rib-to-Deck Welded Joints in Orthotropic Steel Decks. Int. J. Steel Struct. 2018, 18, 512–527. [Google Scholar] [CrossRef]
- Heng, J.; Zheng, K.; Gou, C.; Zhang, Y.; Bao, Y. Fatigue performance of rib-to-deck joints in orthotropic steel decks with thickened edge U-ribs. J. Bridge Eng. 2017, 22, 04017059. [Google Scholar] [CrossRef]
- Yu, B.; Qiu, H.X.; Wang, H.; Guo, T. Experimental research on fatigue behavior and damage development of welded conformation of orthotropic steel bridge deck. J. Highway Transp. Res. Dev. 2009, 26, 64–69. [Google Scholar]
- Luo, P.J.; Zhang, Q.H.; Bao, Y.; Zhou, A.X. Fatigue evaluation of rib-to-deck welded joint using averaged strain energy density method. Eng. Struct. 2018, 177, 682–694. [Google Scholar] [CrossRef]
- Zeng, Z.B. Classification and reasons of typical fatigue cracks in orthotropic steel deck. Steel Constr. 2011, 26, 9–16. [Google Scholar]
- ISO. Metallic materials-tensile testing, Part 1: Method of test at room temperature. Int. Organiz. Stand. 2016, 6892-1. [Google Scholar]
- TB 10002.2. Code for Design on Steel Structure of Railway Bridge; China Railway Publishing House: Beijing, China, 2005. [Google Scholar]
- GB/T 10045-2001. Carbon Steel Flux Cored Electrodes for Arc Welding; Standards Press of China: Beijing, China, 2001. [Google Scholar]
- Zhou, Y.B. Crack Study and Local Fatigue Analysis of Orthotropic Steel Decks on Bridges. Master’s Thesis, Tsinghua University, Beijing, China, 2010. [Google Scholar]
- AASHTO. AASHTO LRFD Bridge Design Specifications; American Association of State Highway and Transportation Officials: Washington, DC, USA, 2007. [Google Scholar]
- Sonsino, C.M. Fatigue testing under variable amplitude loading. Int. J. Fatigue 2007, 29, 1080–1089. [Google Scholar] [CrossRef]
- EN. Eurocode 3: Design of Steel Structures, Part 1–9: Fatigue Strength of Steel Structures; European Committee for Standardization: Brussels, Belgium, 2003. [Google Scholar]
- Lee, Y.L.; Pan, J.; Hathaway, R.; Barkey, M. Fatigue Testing and Analysis: Theory and Practice (Vol. 13); Butterworth-Heinemann: Burlington, MA, USA, 2005. [Google Scholar]


| Designation | Element (%) | |||||
|---|---|---|---|---|---|---|
| C | Si | Mn | P | S | Als | |
| Q345qD | ≤0.18 | ≤0.60 | 1.1–1.6 | ≤0.025 | ≤0.025 | ≥0.015 |
| E501T-1 | ≤0.18 | ≤0.90 | ≤1.75 | ≤0.03 | ≤0.03 | - |
| Designation | Specimen Number | Yield Strength/MPa | Tensile Strength/MPa |
|---|---|---|---|
| Q345qD | 1 | 331.3 | 507.5 |
| 2 | 342.6 | 517.3 | |
| 3 | 344.5 | 509.9 | |
| Mean value | 339.5 | 511.6 | |
| E501T-1 | 1 | 495 | 575 |
| Electrode Diameter (mm) | Welding Current (A) | Arc Voltage (V) | Welding Speed (cm/min) |
|---|---|---|---|
| Φ1.2 | 180 | 24 | 20 |
| Specimens Number | Stress Amplitudes Δσ/MPa | Number of Cycles N | lgΔσ | lgN |
|---|---|---|---|---|
| SY-2-1-1 | 332.4 | 152,168 | 2.522 | 5.182 |
| SY-2-1-2 | 272.4 | 820,188 | 2.435 | 5.914 |
| SY-2-1-3 | 212.5 | 1,031,746 | 2.327 | 6.014 |
| SY-2-1-4 | 164.5 | 1,513,565 | 2.216 | 6.180 |
| SY-2-1-5 | 272.4 | 365,118 | 2.435 | 5.562 |
| SY-2-1-6 | 272.4 | 1,354,662 | 2.435 | 6.132 |
| SY-2-1-7 | 272.4 | 290,476 | 2.435 | 5.463 |
| SY-2-1-8 | 272.4 | 376,123 | 2.435 | 5.575 |
| SY-2-1-9 | 272.4 | 217,132 | 2.435 | 5.337 |
| SY-2-1-10 | 272.4 | 677,876 | 2.435 | 5.831 |
| SY-2-1-11 | 176.5 | 1,419,414 | 2.247 | 6.152 |
| Probabilities of Survival (%) | Δσ-N Curve Equations | Stress Amplitude Δσ/MPa (N = 2 × 10⁶) |
|---|---|---|
| 60 | 162.95 | |
| 70 | 153.81 | |
| 80 | 143.64 | |
| 90 | 130.74 | |
| 97.7 | 112.08 | |
| 99 | 104.44 |
| Specimen Number | Stress Amplitude Δσ/MPa | Number of Cycles when Crack Occurred N1 | Number of Cycles N | Proportion of Initiation Life |
|---|---|---|---|---|
| SY-2-1-1 | 332.37 | 113,210 | 152,168 | 74.40% |
| SY-2-1-3 | 212.47 | 964,524 | 1,031,746 | 93.48% |
| SY-2-1-4 | 164.51 | 1,440,870 | 1,513,565 | 95.20% |
| SY-2-1-5 | 272.42 | 323,484 | 365,118 | 88.60% |
| SY-2-1-7 | 272.42 | 230,748 | 290,476 | 79.44% |
| SY-2-1-8 | 272.42 | 351,444 | 376,123 | 93.44% |
| SY-2-1-9 | 272.42 | 171,784 | 217,132 | 79.12% |
| SY-2-1-10 | 272.42 | 592,622 | 677,876 | 87.42% |
| SY-2-1-11 | 176.50 | 1,207,128 | 1,419,414 | 85.04% |
| Specimen Number | Theoretical Number of Cycles | Test Number of Cycles | Growth Rate/% |
|---|---|---|---|
| SY-2-1-2 | 344,372 | 820,188 | 138.2% |
| SY-2-1-6 | 344,372 | 1,354,662 | 293.4% |
| Vehicle Model | Number of Axles | Illustrations Axle Load/kN, Wheelbase/mm | Total Weight/kN | Number of Vehicles | Ratio of Total Traffic |
|---|---|---|---|---|---|
| V1 | 2 | 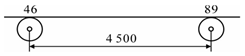 | 137 | 19,078 | 14.74% |
| V2 | 3 |  | 222 | 2778 | 2.15% |
| V3 | 3 | 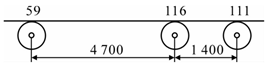 | 318 | 916 | 0.71% |
| V4 | 4 |  | 317 | 5342 | 4.13% |
| V5 | 5 |  | 375 | 163 | 0.13% |
| V6 | 5 | 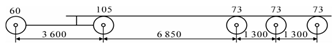 | 384 | 1682 | 1.30% |
| V7 | 6 | 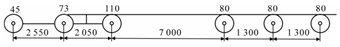 | 467 | 18,009 | 13.91% |
| Total | 47,968 | 37.06% | |||
| Vehicle Weight | Vehicle Model | Inside Lane | Center Lane | Outside Lane |
|---|---|---|---|---|
| 0–2 t | Cars, light buses | 0.699 | 0.248 | 0.054 |
| 2–8 t | Bus Two axle truck I | 0.244 | 0.372 | 0.384 |
| >8 t | Two-axle bus Two axle truck II | 0.042 | 0.650 | 0.309 |
| Number of Axles | Daily Average Number of Vehicles | Inside Lane | Center Lane | Outside Lane |
|---|---|---|---|---|
| 3 | 1171 | 0.076 | 0.435 | 0.489 |
| 4 | 3384 | 0.043 | 0.310 | 0.648 |
| 5 | 1284 | 0.067 | 0.401 | 0.533 |
| 6 | 543 | 0.091 | 0.420 | 0.488 |
| Stress Level | Stress Amplitude/MPa | Number of Cycles |
|---|---|---|
| 1 | 0–5 | 498,915 |
| 2 | 5–10 | 0 |
| 3 | 10–15 | 838,642 |
| 4 | 15–20 | 183,148 |
| 5 | 20–25 | 1,139,528 |
| 6 | 25–30 | 997,920 |
| 7 | 30–35 | 339,727 |
| 8 | 35–40 | 78,374 |
| Total | 4,076,254 | |
© 2019 by the authors. Licensee MDPI, Basel, Switzerland. This article is an open access article distributed under the terms and conditions of the Creative Commons Attribution (CC BY) license (http://creativecommons.org/licenses/by/4.0/).
Share and Cite
Chen, Y.; Lv, P.; Li, D. Research on Fatigue Strength for Weld Structure Details of Deck with U-rib and Diaphragm in Orthotropic Steel Bridge Deck. Metals 2019, 9, 484. https://doi.org/10.3390/met9050484
Chen Y, Lv P, Li D. Research on Fatigue Strength for Weld Structure Details of Deck with U-rib and Diaphragm in Orthotropic Steel Bridge Deck. Metals. 2019; 9(5):484. https://doi.org/10.3390/met9050484
Chicago/Turabian StyleChen, Yixin, Pengmin Lv, and Datao Li. 2019. "Research on Fatigue Strength for Weld Structure Details of Deck with U-rib and Diaphragm in Orthotropic Steel Bridge Deck" Metals 9, no. 5: 484. https://doi.org/10.3390/met9050484
APA StyleChen, Y., Lv, P., & Li, D. (2019). Research on Fatigue Strength for Weld Structure Details of Deck with U-rib and Diaphragm in Orthotropic Steel Bridge Deck. Metals, 9(5), 484. https://doi.org/10.3390/met9050484