Article

Friction Surfacing of Aluminium Alloy 5083 on DH36 Steel Plate

1
Faculty of Mechanical Engineering and Automation, Zhejiang Sci-Tech University, Xiasha Higher Education Zone, Hangzhou 310018, China
2
Department of Mechanical & Aerospace Engineering, University of Strathclyde, James Weir Building, 75 Montrose Street, Glasgow G11XJ, UK
*
Author to whom correspondence should be addressed.
Metals 2019, 9(4), 479; https://doi.org/10.3390/met9040479
Submission received: 19 March 2019 / Revised: 20 April 2019 / Accepted: 21 April 2019 / Published: 25 April 2019

Abstract

:
In this work, friction surfacing (FS) of AA5083 on a DH36 steel substrate was experimentally studied. The process parameters such as rotation speed, travel speed and feed rate are of great significance to the success of the FS process. Seven friction surfaced plates with different combinations of parameters were examined. Optical microscopy, SEM and EDS were used to analyse the characteristics of the microstructure and composition of the interface between the surface and the substrate. The results show that the deposition surface quality decreased as the feed rate, travel speed and axial force increased. However, the bond strength increased with higher feed rate, higher rotation speed and lower travel speed. Elemental diffusion of Fe to AA5083 was established, and the intermetallic compound FeAl3 was produced in the interface.

1. Introduction

Friction surfacing (FS) is a solid-state surface engineering technology invented by Klopstock and Neelands [1]. It has been used for the repair of damaged surfaces and for improving the surface wear-resistance or corrosion-resistance performance [2,3,4]. In friction surfacing (see Figure 1), a high rotational speed consumable rod is pressed against the substrate by the axial force, which generates the frictional heat in the interface to soften and plasticize the rod material such that a viscoplastic shearing layer is formed between the deposited rod material and the substrate. When the consumable rod moves relative to the substrate plate, the shearing layer is continuously and evenly deposited onto the surface of the substrate [5].
Since the heat is dissipated by friction, the maximum temperature is lower than the melting temperature of the rod, which eliminates porosity and solidification cracking, providing advantages for dissimilar joining of materials over fusion-based technologies [6,7,8].
The quality of the friction surfaced layer is greatly influenced by the process parameters. Gandra et al. [9] tested various process parameters for a mild steel consumable rod and substrate. Higher travel speeds produced thinner deposits, improved deposition hardness, and decreased energy consumption. Increasing the axial force enhanced the bond strength and resulted in wider and thinner deposits, but excessive force resulted in a non-uniform deposition [10,11]. Guo et al. [12] investigated the effect of rotation speed on the microstructure, hardness and pitting corrosion resistance. The improvement in pitting corrosion resistance caused by optimization of the rotation speed was clearly visible. Vitanovet al. [13] performed FS experiments with different materials, rod diameters and substrates (303, 304, 316, 416, 431). The bond strength was found to increase proportionally with axial force, and travel speed had a second order relationship to the bond strength. Murugan et al. [14] experimentally deposited MONEL K500 on AISI 1012 substrate with response surface methodology, and a mathematical model was developed for the thickness of the surfaced layer and good bond integrity in terms of the process parameters.
In a similar study, Voutchkov et al. [15] proposed the procedures for optimization of the friction surfacing process. In their work [11], SS 304 rod was deposited onto a mild steel plate. The rotational speed was set constant, the traverse speed varied from 100 mm/min to 450 mm/min and the feed rate from 50 mm/min to 500 mm/min. By visually assessing the deposition appearance, optimum parameters were found in the center of a trapezium-shaped area in the speed force map, where the deposition appearance corresponding to the travel speed and feed rate was plotted. Rafi et al. [16] chose H13 steel for the consumable rod and low-carbon steel for the substrate, and their results showed that the higher rotational speed produced a narrower deposition, while higher travel speeds resulted in thinner deposition and higher bond strength. Similar conclusions were found by Rafi et al. [17] and Vitanov et al. [13]. Tokisue et al. [18] studied the relationship between the interval of circular pattern and the rotational speed. When the rotational speed increased, the interval of circular pattern was smaller.
There are significant application-driven demands for steel and aluminium joining in industries such as shipbuilding, automotive and aerospace industries, but very limited research work has been found in the relevant literature. In the present study, 5083 aluminum alloy was used as the consumable rod, and DH36 steel plate as the substrate. The effects of friction process parameters (rotation speed, travel speed and feed rate) on the microstructure and properties of deposition are reported herein.

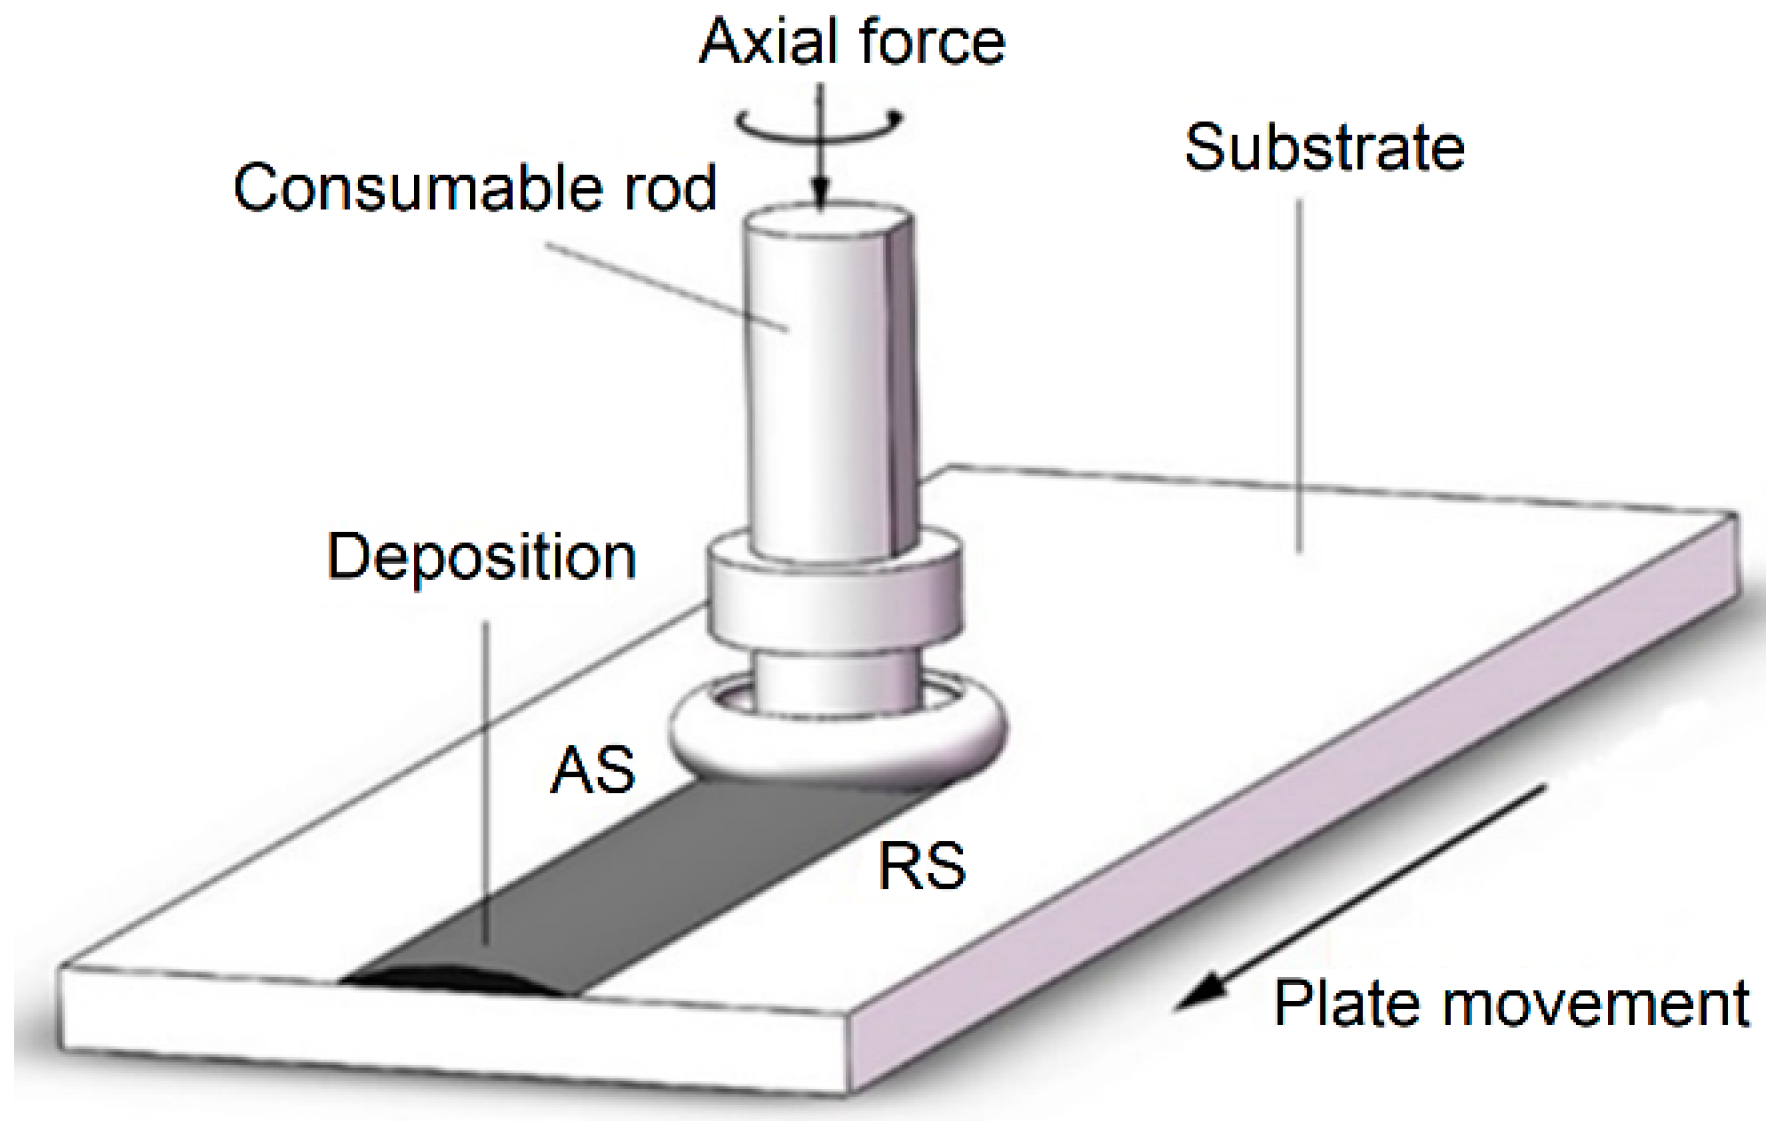
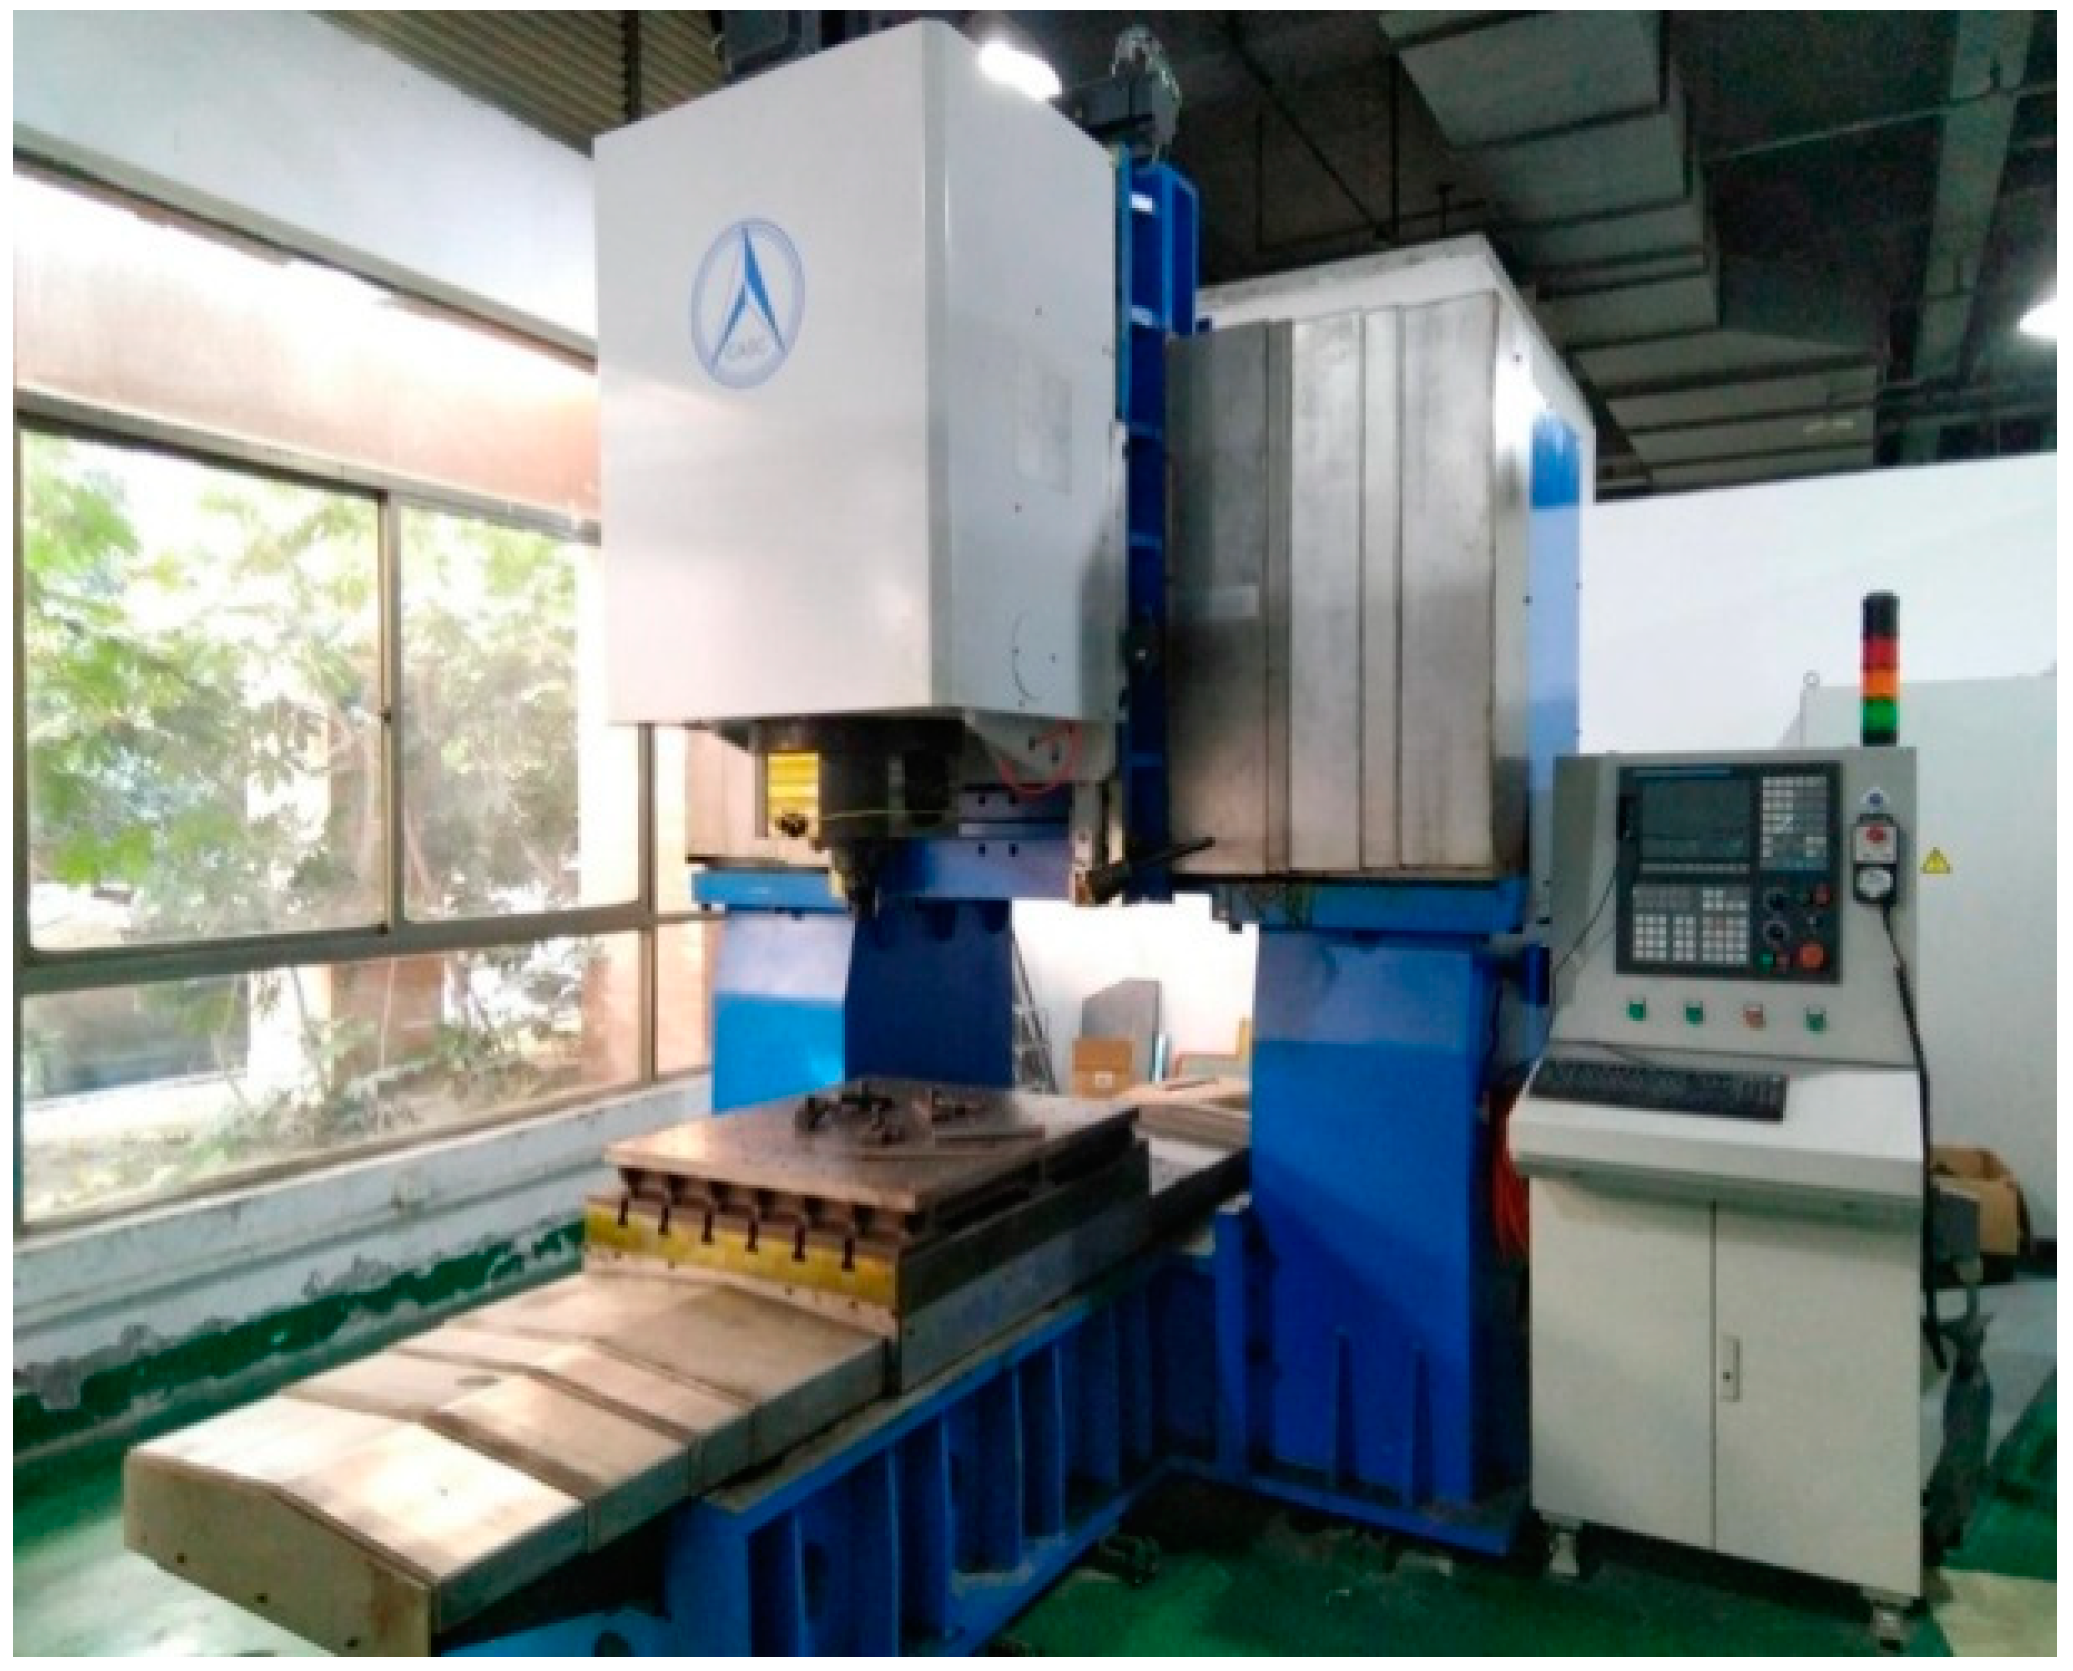
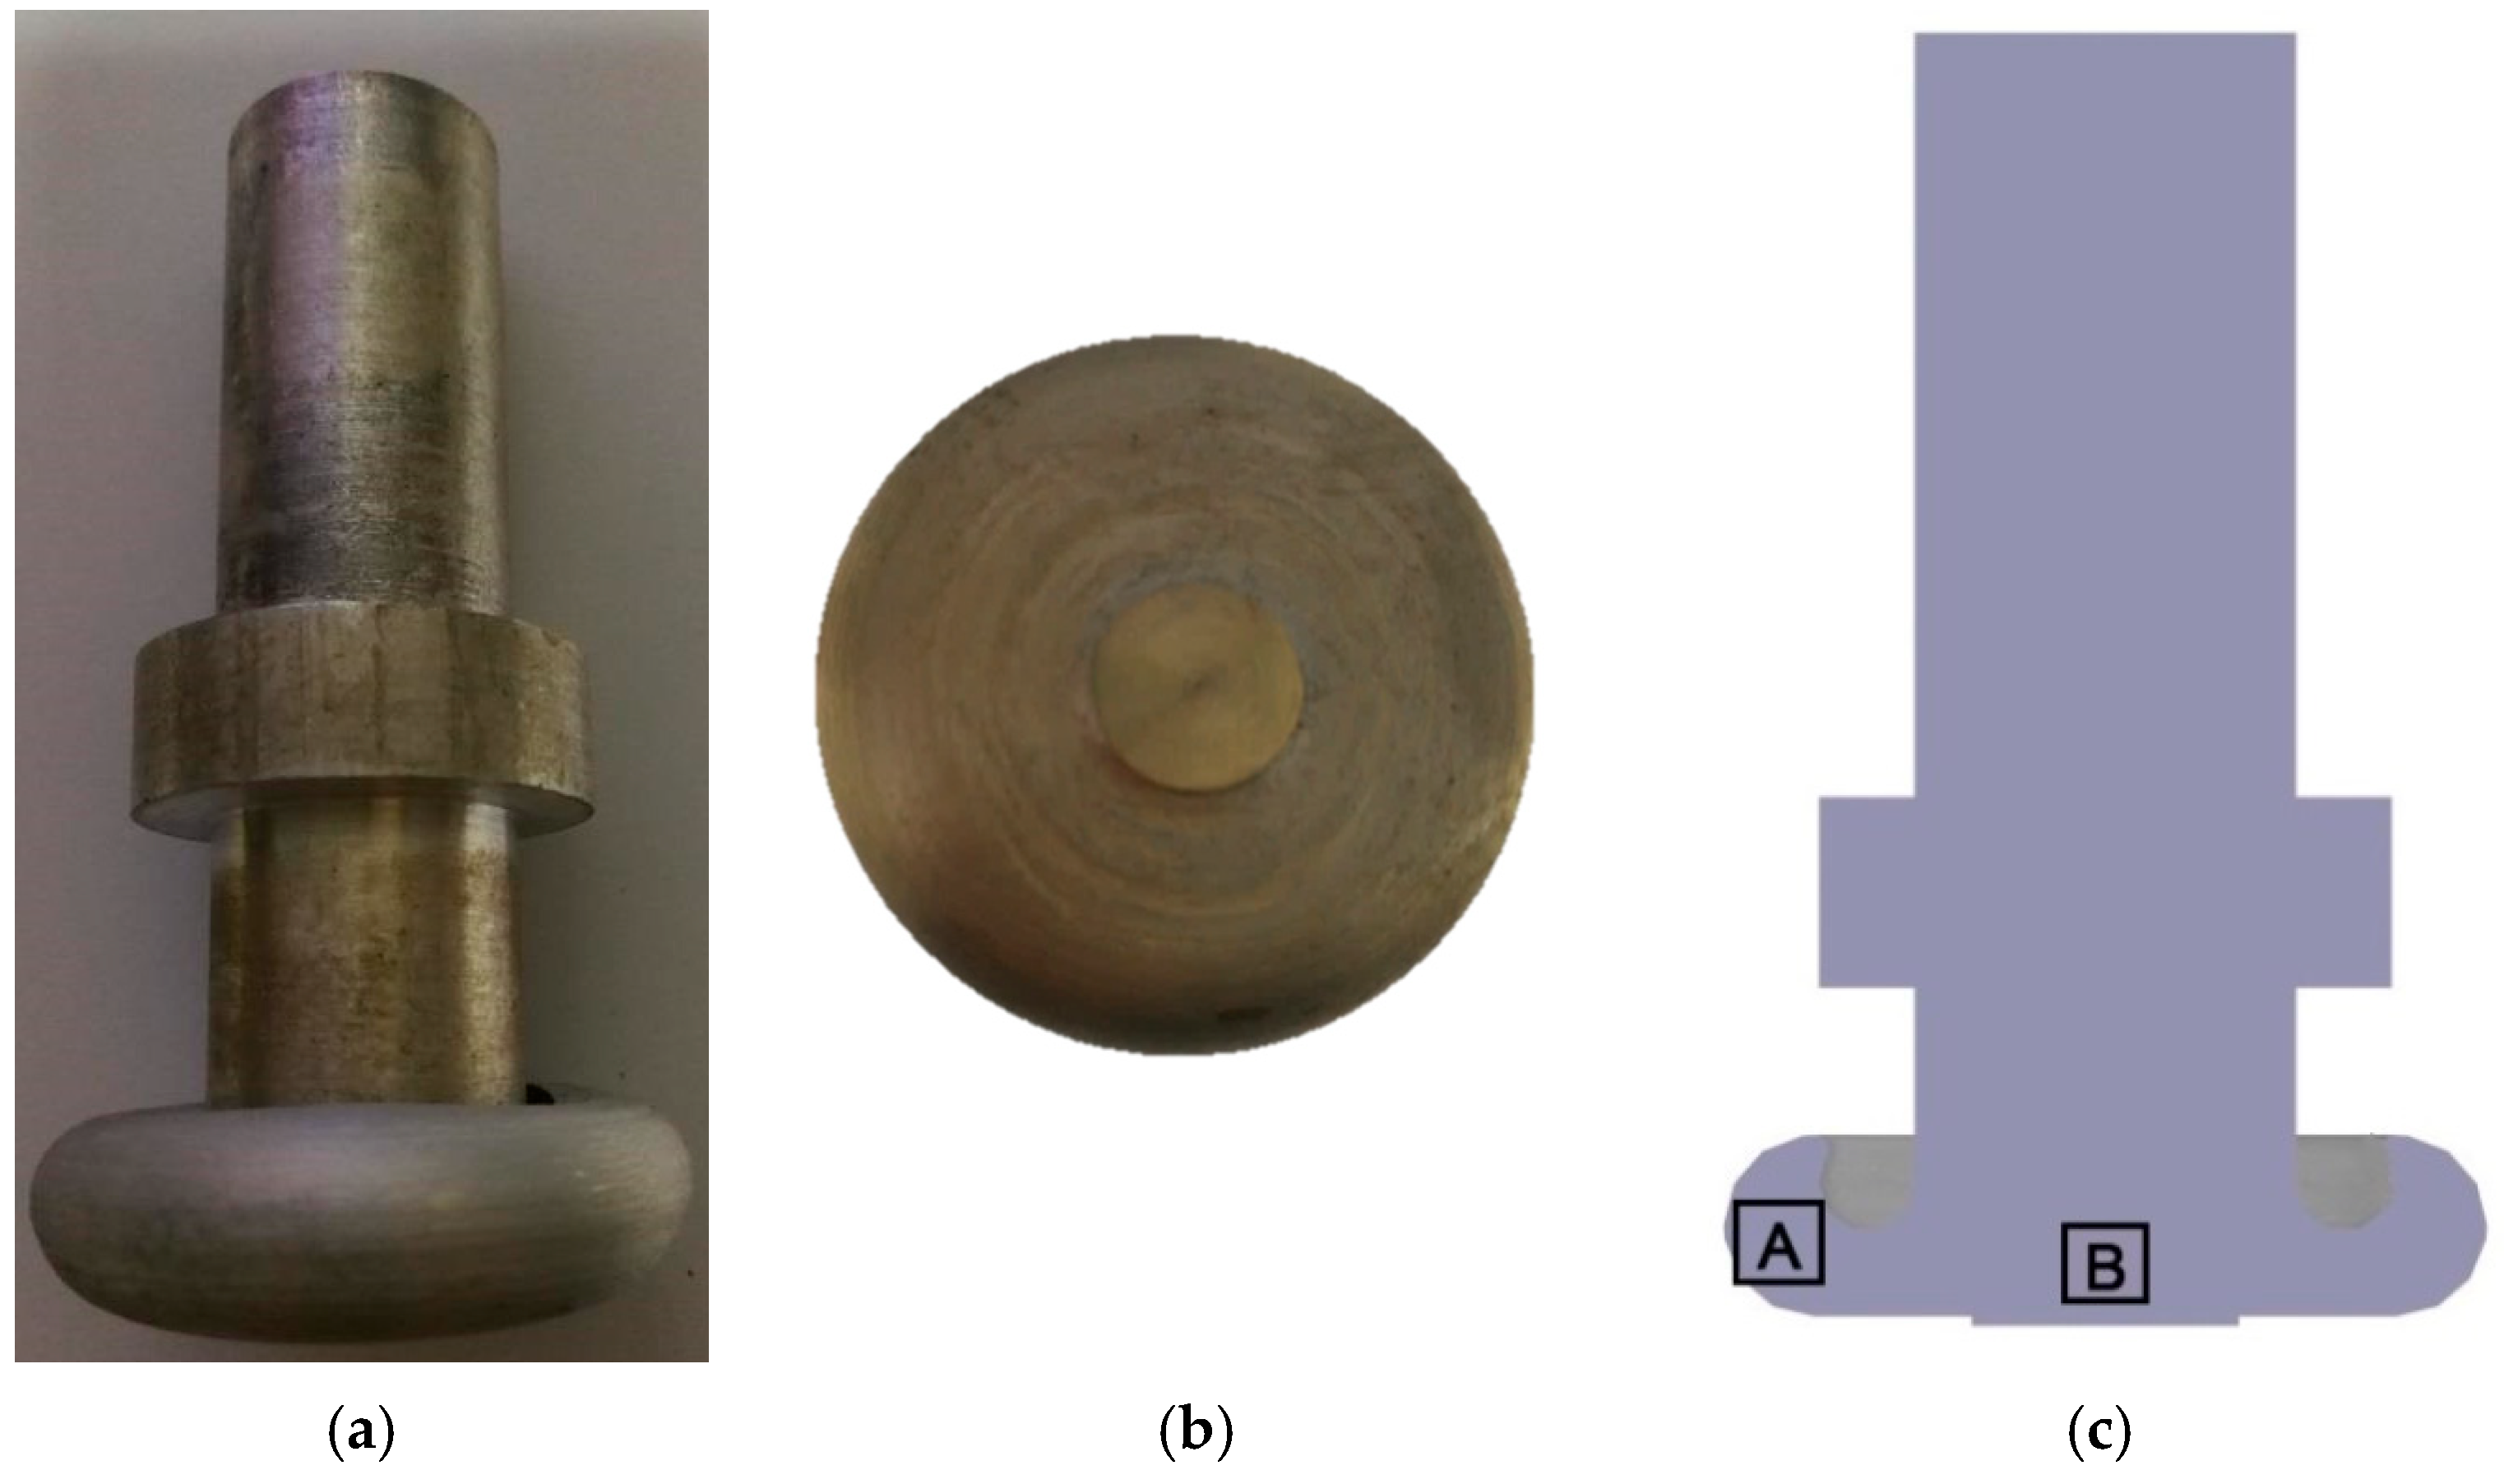
2. Experimental Procedures

An HT-JM16X8/2 static gantry friction stir welding machine (Aerospace Engineering Equipment Co. Ltd, Suzhou, China) was used in the friction surfacing experiments, as shown in Figure 2. The DH36 steel has a thickness of 10 mm, and the AA5083 rod has a diameter of 20 mm. Any oxidation of the steel plate was removed by ultrasonic cleaning. The chemical composition of the two materials is presented in Table 1 and Table 2. Since the travel speed, rotation speed and feed rate have a great influence on the quality of deposition, nine tests with different parameter combinations (Table 3) were designed to investigate the effect of each parameter. In fact, parameters for tests No. 2, 5 and 8 were the same, hence seven tests were performed.
The temperature was measured by K-type thermocouples (Shanghai Automation Instrumentation Co. Ltd, Shanghai, China) placed inside the steel plate away from the surfacing zone. Their relative positions are shown in Figure 3. CH01 and CH02 were 5 mm deep from the top surface, while CH3 and CH4 were placed only 0.2 mm from the top surface aiming to measure the temperature close to the interface between steel and aluminium deposition. The holes for CH01 and CH02 were drilled from the top surface, and the remaining holes (CH03 and CH04) were drilled from the bottom surface to assist the installation of the thermocouples. A non-contact temperature measurement method by means of a Fluke thermal infrared camera (Fluke Corporation, Everett, WA, USA) was also used to record the temperature field around the rod and steel substrate interface.
The metallographic specimens were cut by a wire-cutting machine, allowing the surface to be observed perpendicular to the deposition direction, as shown in Figure 4. The size of the specimen was a = 25 mm, b = 6 mm and c = 5 mm. Specimens were ground using coarse then fine grinding papers, followed by final polishing with a 0.5 μm diamond suspension. The cross section was etched using 4% nitric acid solution to enhance and reveal the microstructure. The specimens were observed on a light optical microscope and a JSM-5610LV scanning electron microscope (JEOL Ltd., Tokyo, Japan). Energy dispersive X-ray spectroscopy (EDS) (JEOL Ltd., Tokyo, Japan) was used to analyze the chemical composition at the interface of steel plate and deposited aluminium. To study the metallography of the deformed aluminium rod after FS processing, electrolytic polishing was chosen to smooth the surface, using a mixture of perchloric acid and ethanol with the volume ratio of 1:9. The anodic coating was then performed with a mixed solution of fluoroboric acid and purified water in a volume ratio of 13:200, and the microstructures were observed by optical microscope under polarized light.
To examine the bond strength of the deposition, a three-point bending test method was adopted according to ASTM E290-14 [19]. A “V”-type guided bend was made to support the specimen, as shown in Figure 5a. The specimen surface with deposition faced downward to avoid direct contact with the punch. A typical bending specimen is shown in Figure 5b. The deposition in the middle of the specimen with a length of 30 mm was left in the as-produced condition, and the remaining was removed from the specimen so that no deposition material would contact the top surface of the “V”-type bend.

3. Results and Discussion

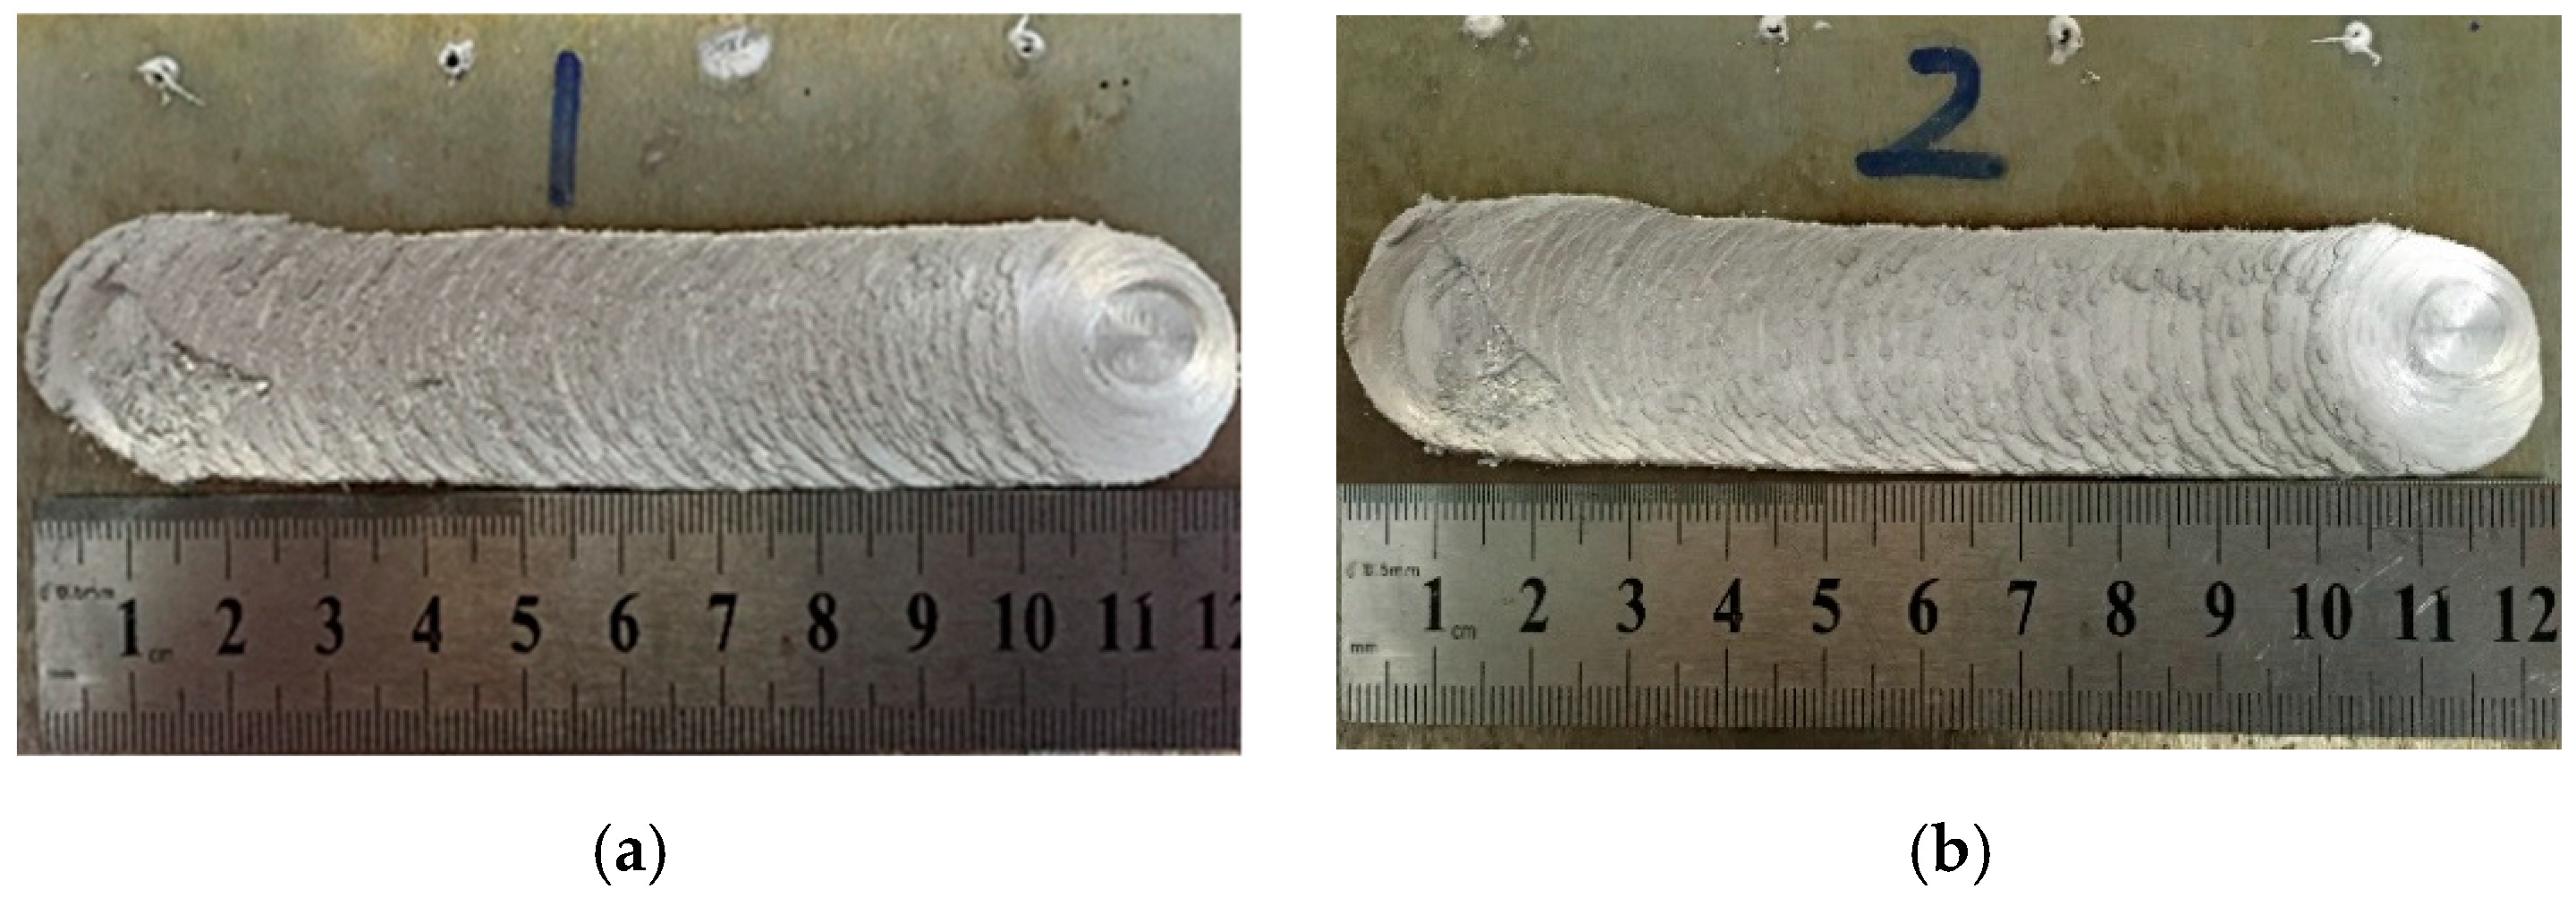
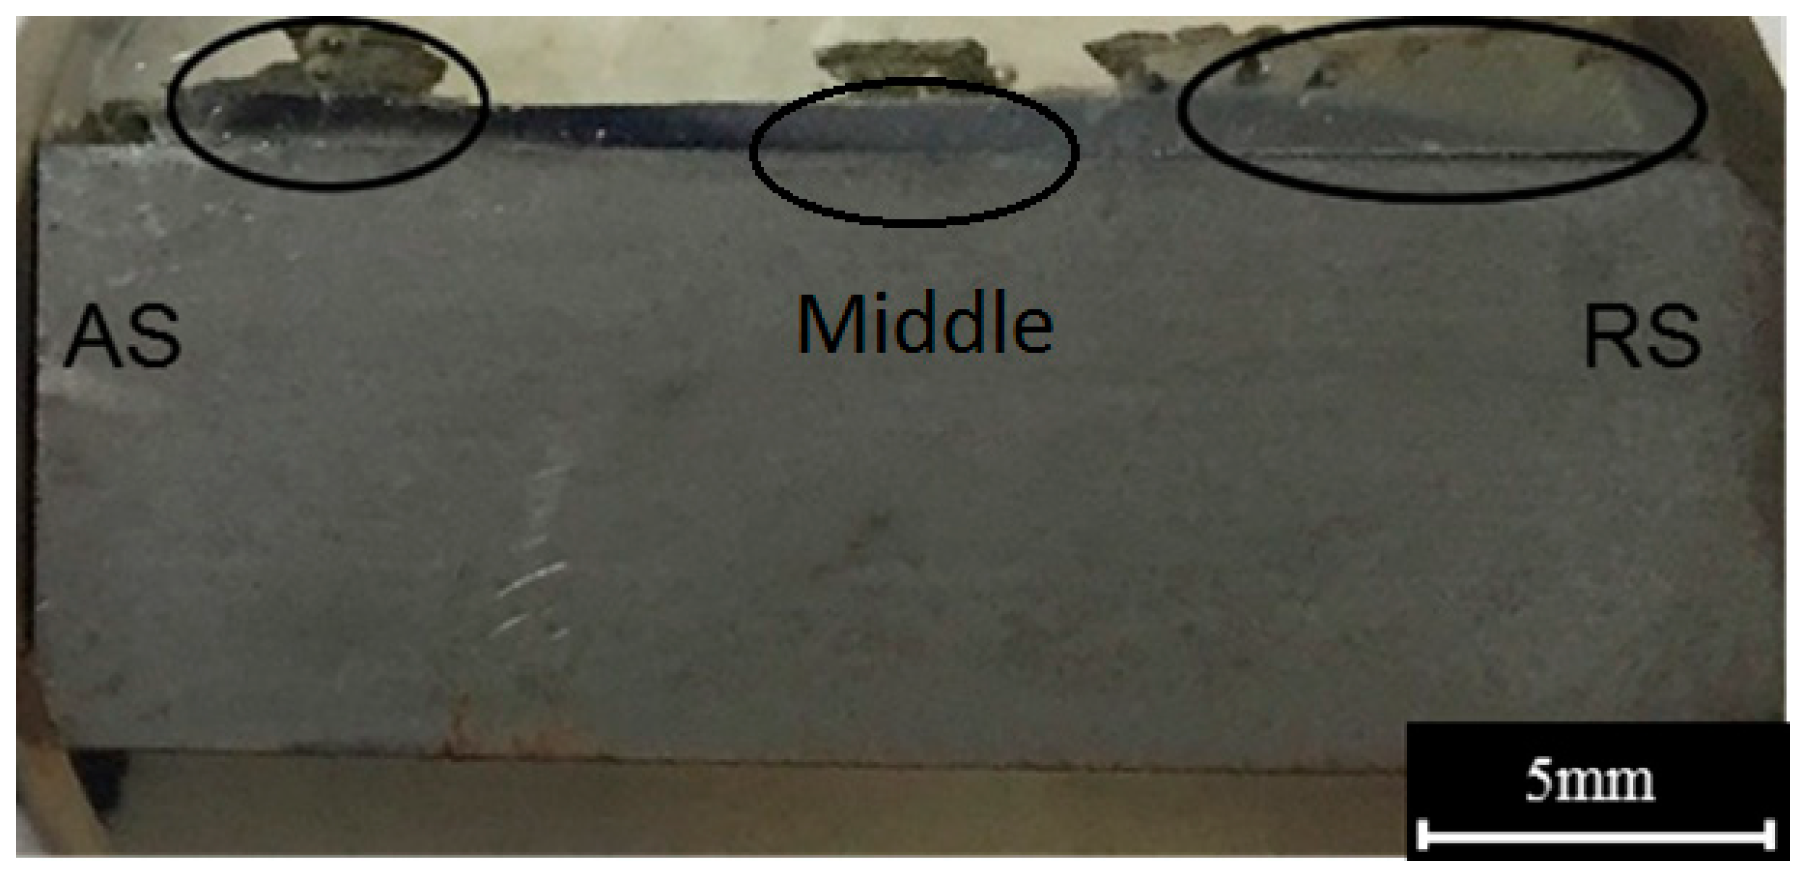
3.1. Surface Morphology

The characteristics of the deposited aluminium layer on the steel substrate are shown in Figure 6. The surface morphology varied with different process parameters in the aspects of deposition width, thickness and roughness. The width and thickness of the deposition during steady state for all samples are presented in Table 4. For tests No. 1, 2 and 3, the same travel speed and rotational speed were employed, and the consumable rod feed rates were 15 mm/min, 20 mm/min and 25 mm/min, respectively. The surface quality of the deposition decreased with the increase of the feed rate. The widths of samples 1 and 2 were similar and slightly greater than that of sample 3. All three samples had the same thickness of 1 mm. The thickness measurement only took account of continuous material layer, and the scattered depositions in sample 2 and 3 were not considered. Therefore, the feed rate had little effect on the width and thickness of the deposition.
For test No. 4, 2 and 6, the feed rate and rotational speed were kept constant, and the travel speeds were 60 mm/min, 80 mm/min and 100 mm/min, respectively. The visual surface quality of the deposition improved with the increase in travel speed. The widths of sample 4 and 2 were similar and greater than that of sample 6, hence, lower travel speed led to wider deposition. A similar conclusion was found by Rafi et al. [16]. The thickness of sample 4 was slightly greater than those of samples 2 and 6, indicating that lower travel speed led to thicker deposition.
For test No. 7, 2 and 9, the same feed rate and travel speed were used, and the rotational speeds were 600 rpm, 900 rpm and 1200 rpm, respectively. An obvious defect existed in sample 7, the aluminium in the center was not bonded to the steel substrate. Test 7 had the lowest rotation speed resulting in the least heat generation and lowest temperature. With the increase of rotation speed, the deposition width decreased, which is consistent with findings in Rafi et al. [16]. Test 9 had the highest rotation speed and produced the sample with the worst surface quality among all tests.

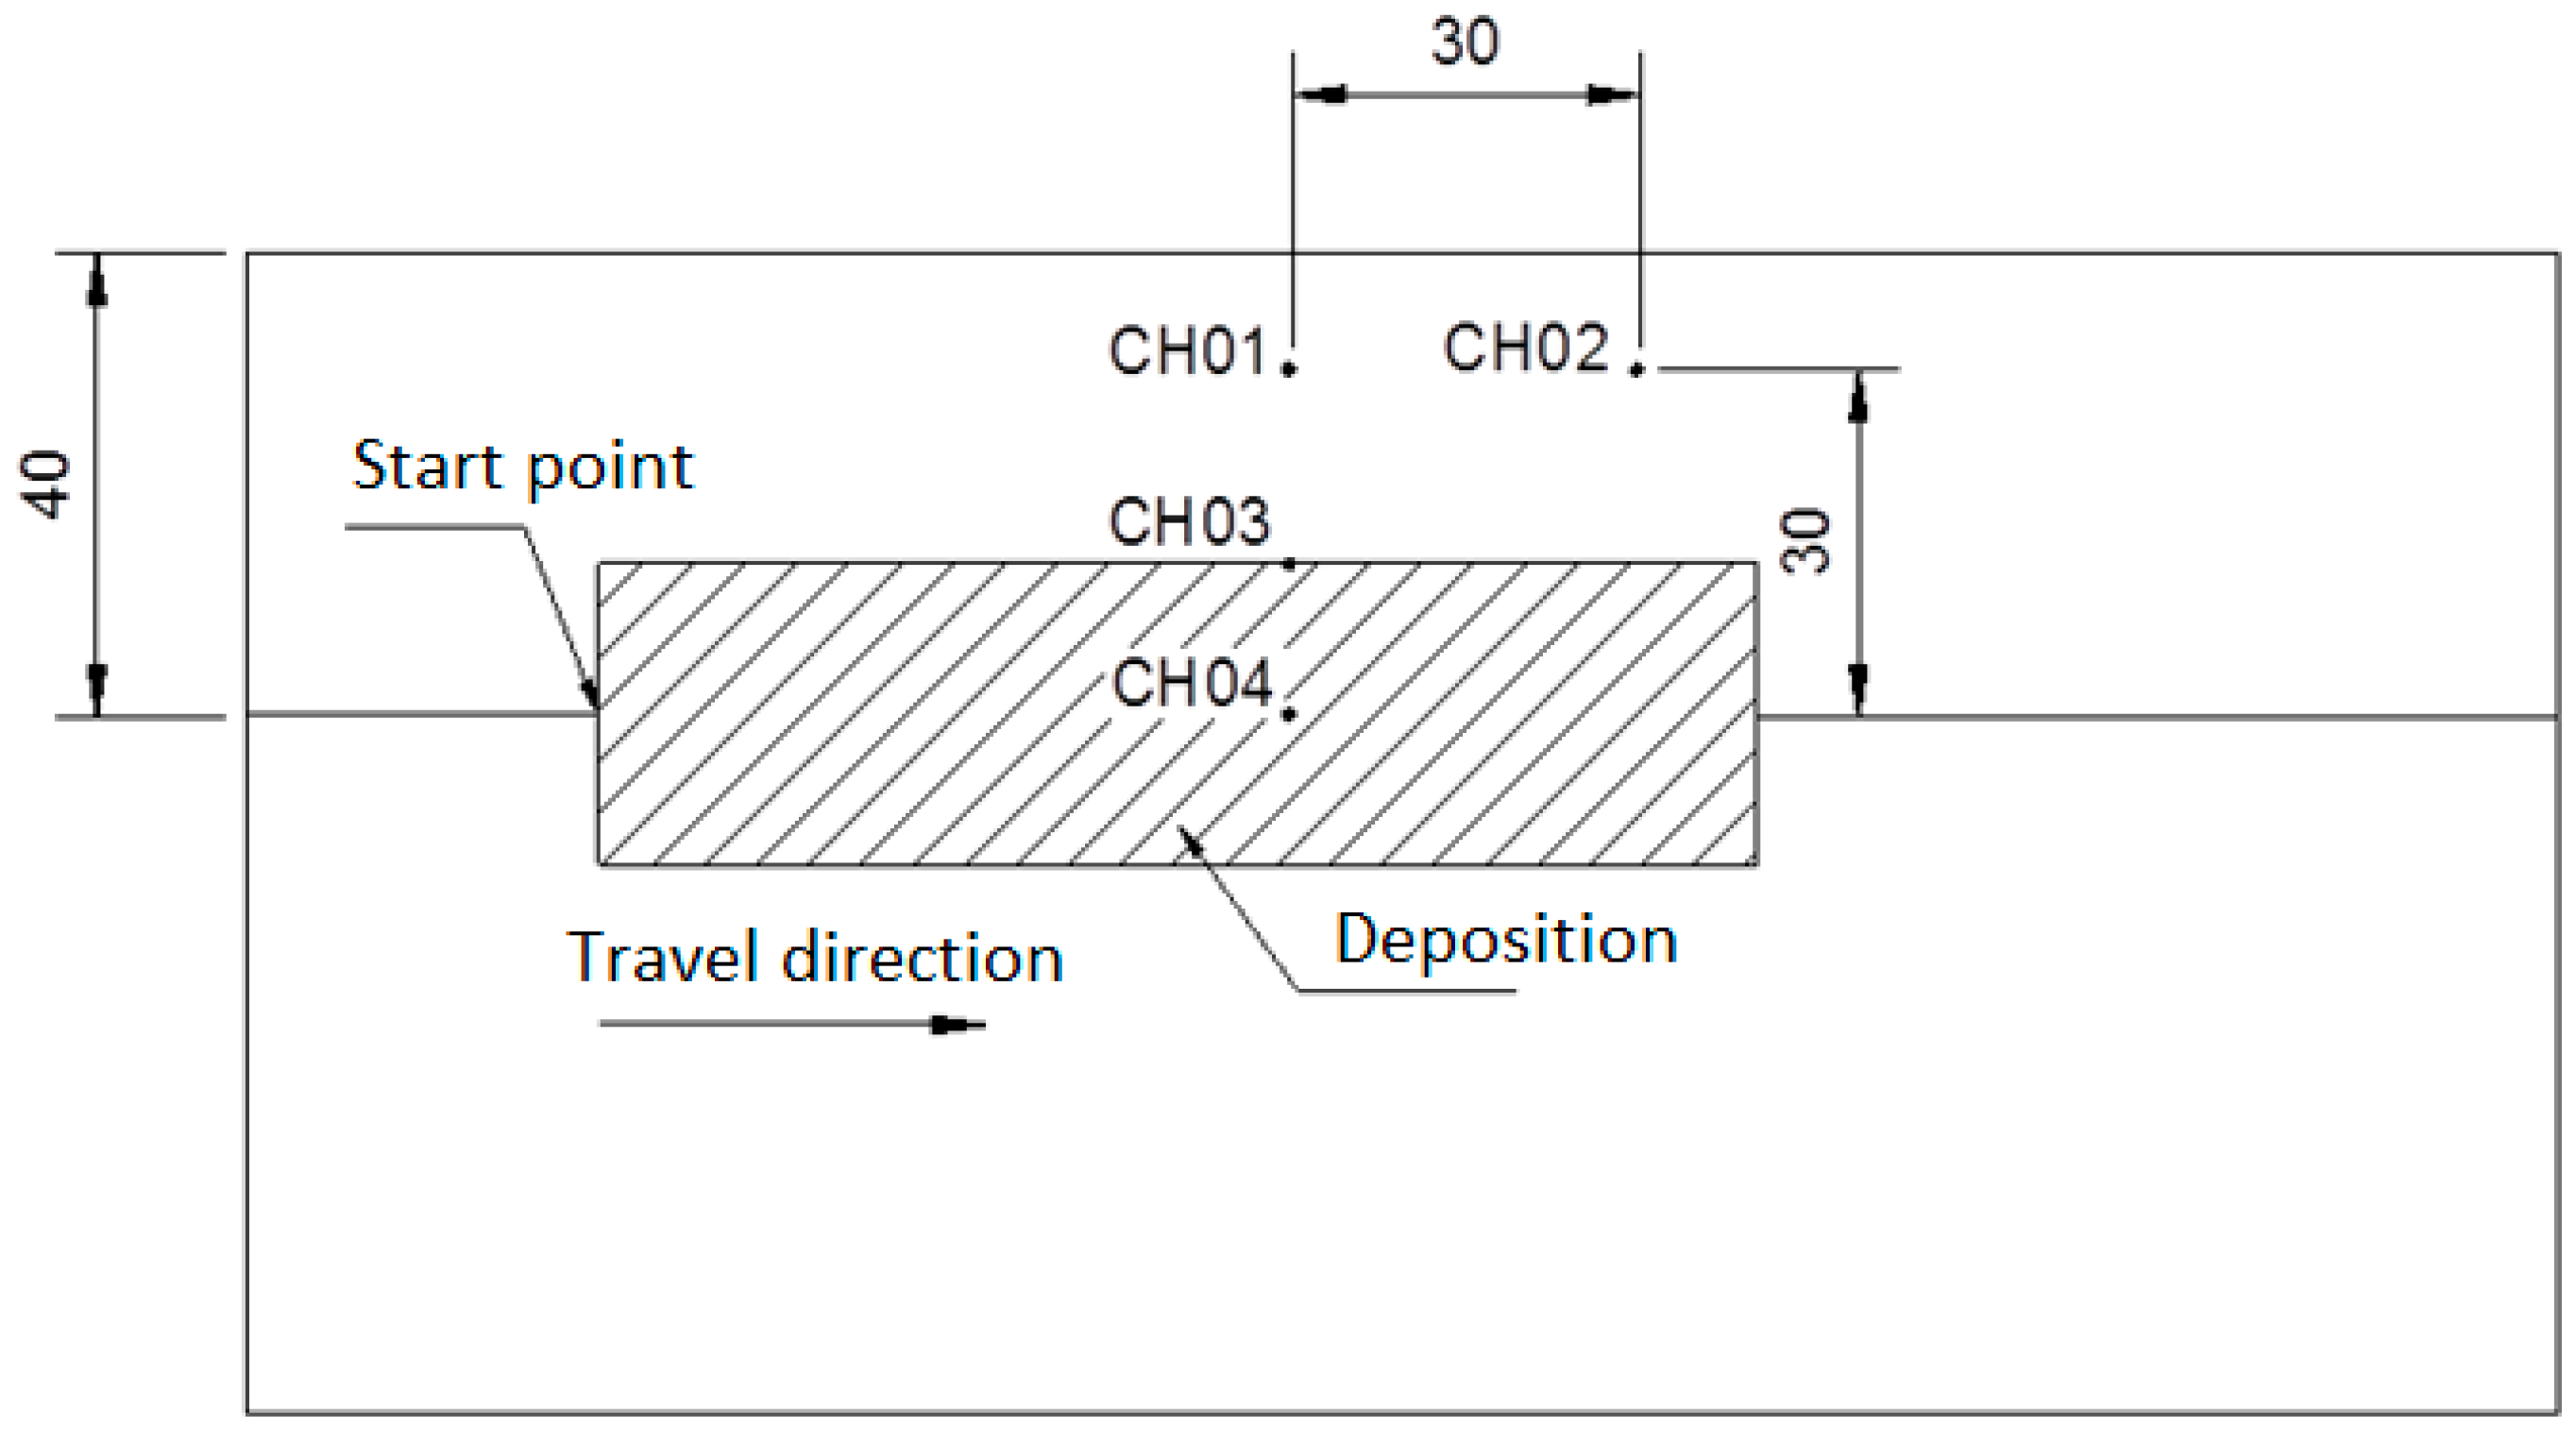
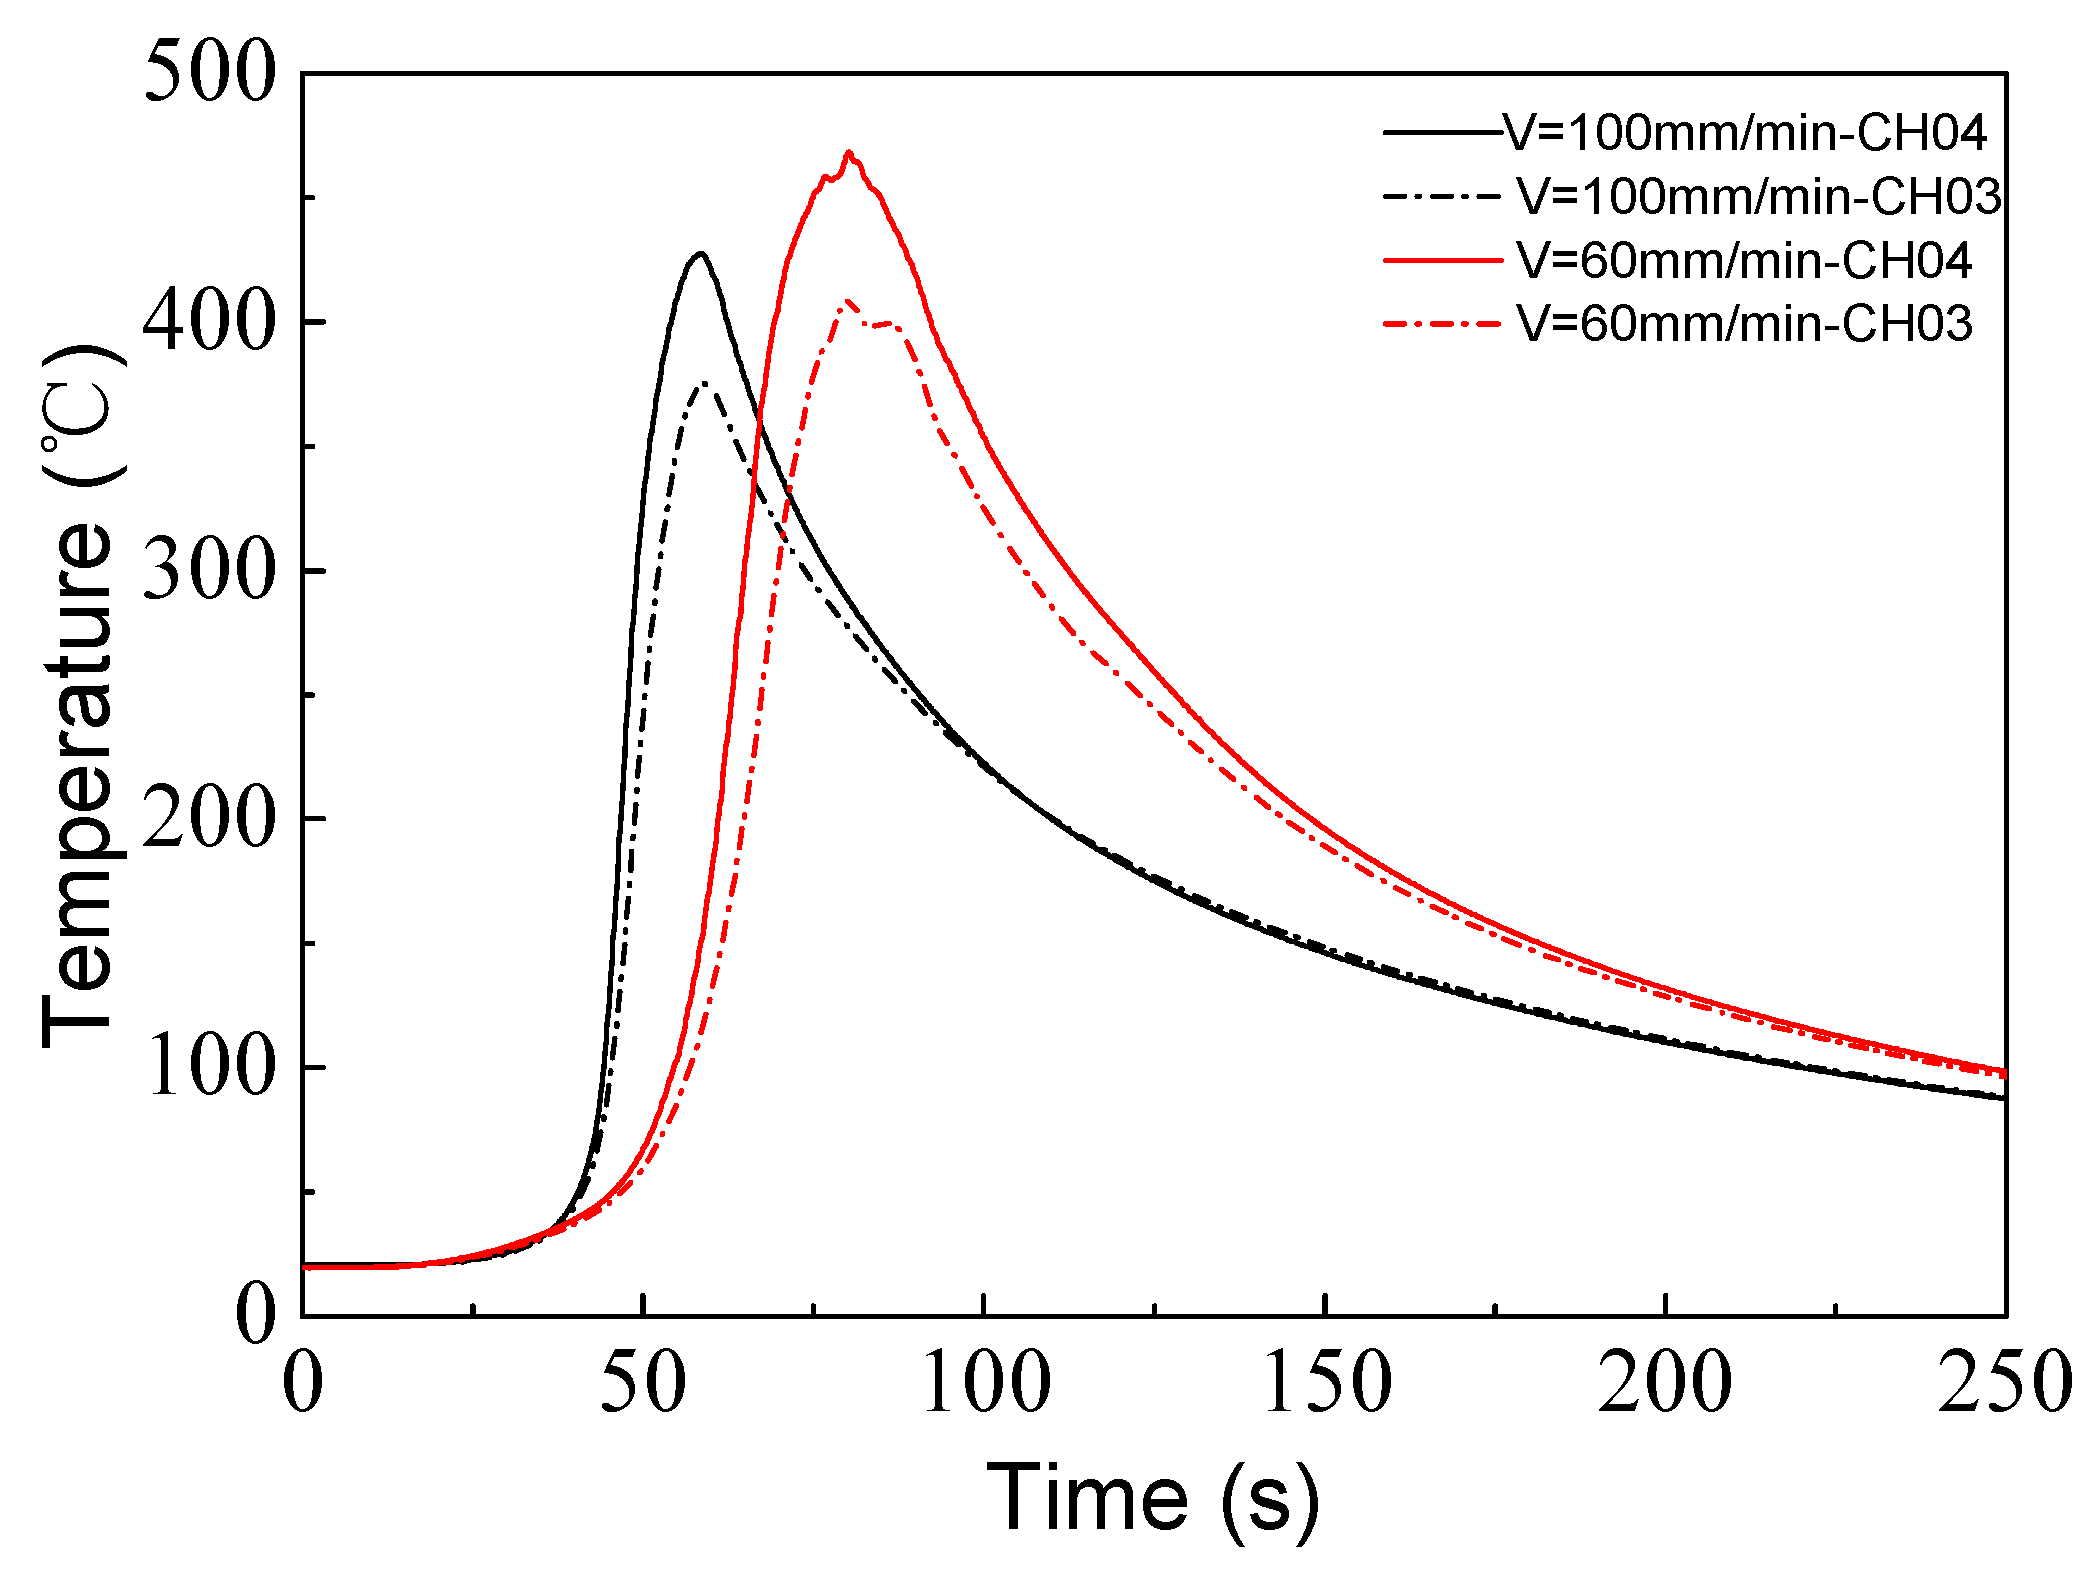
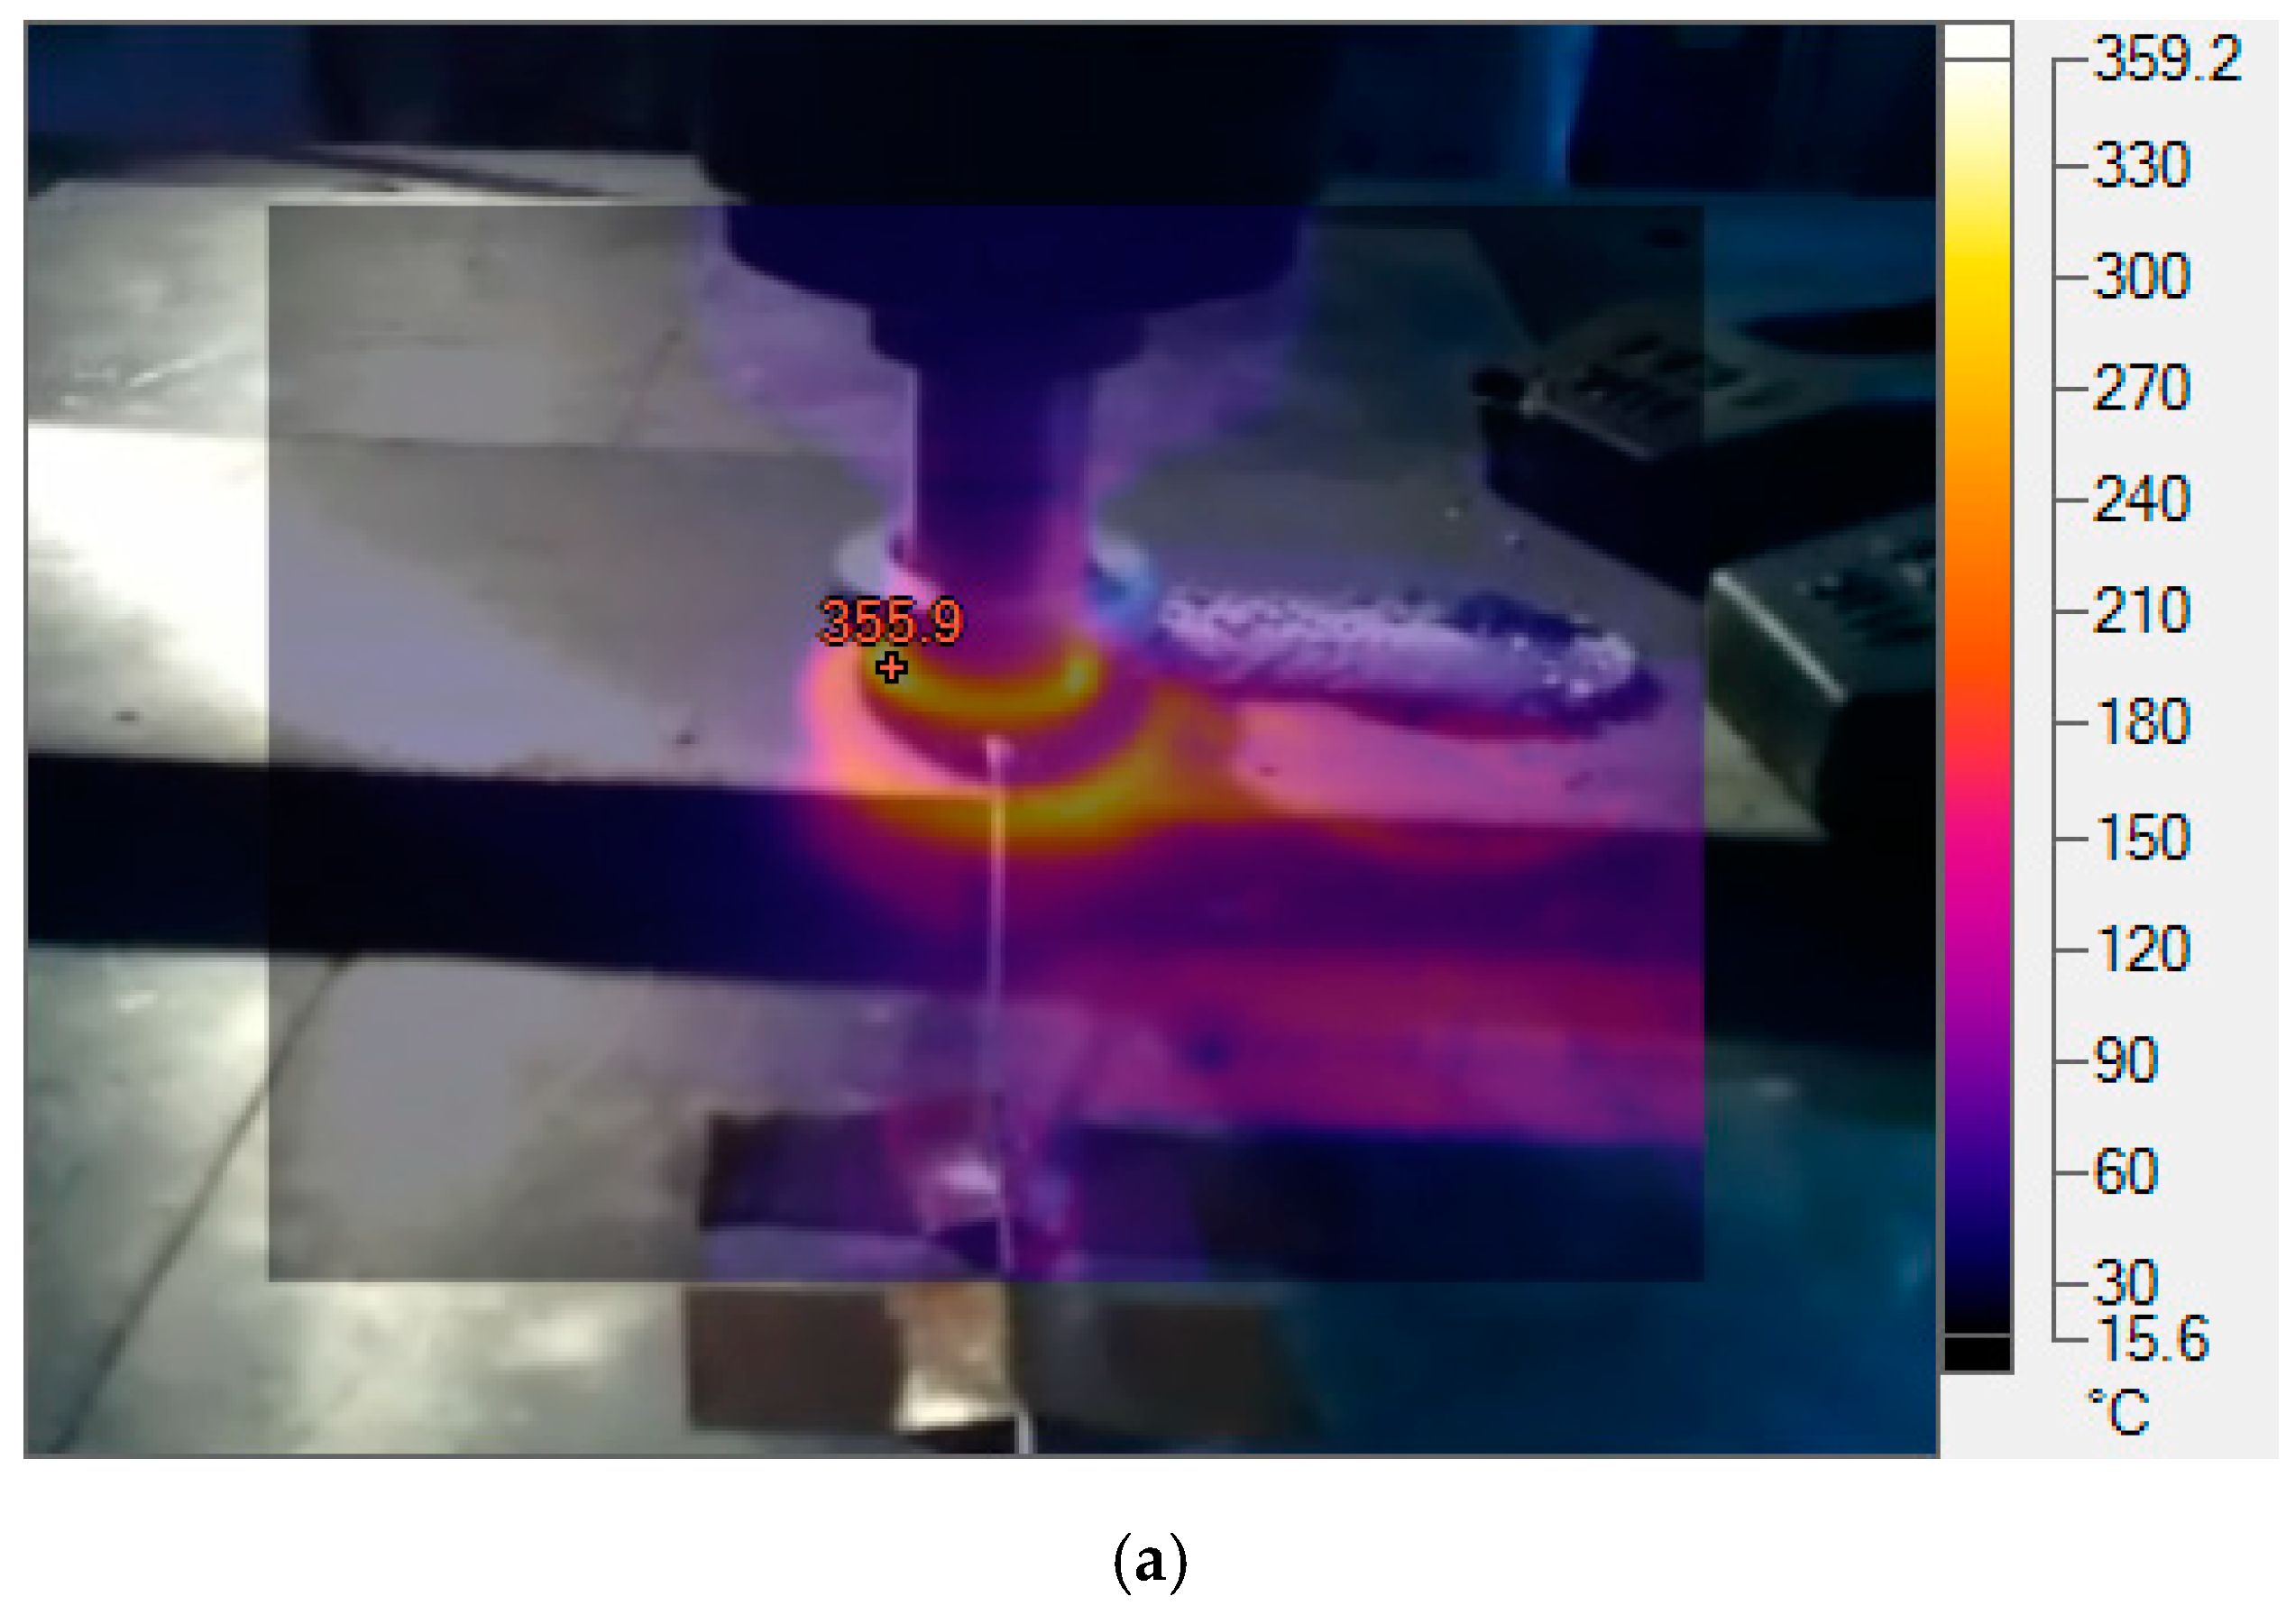
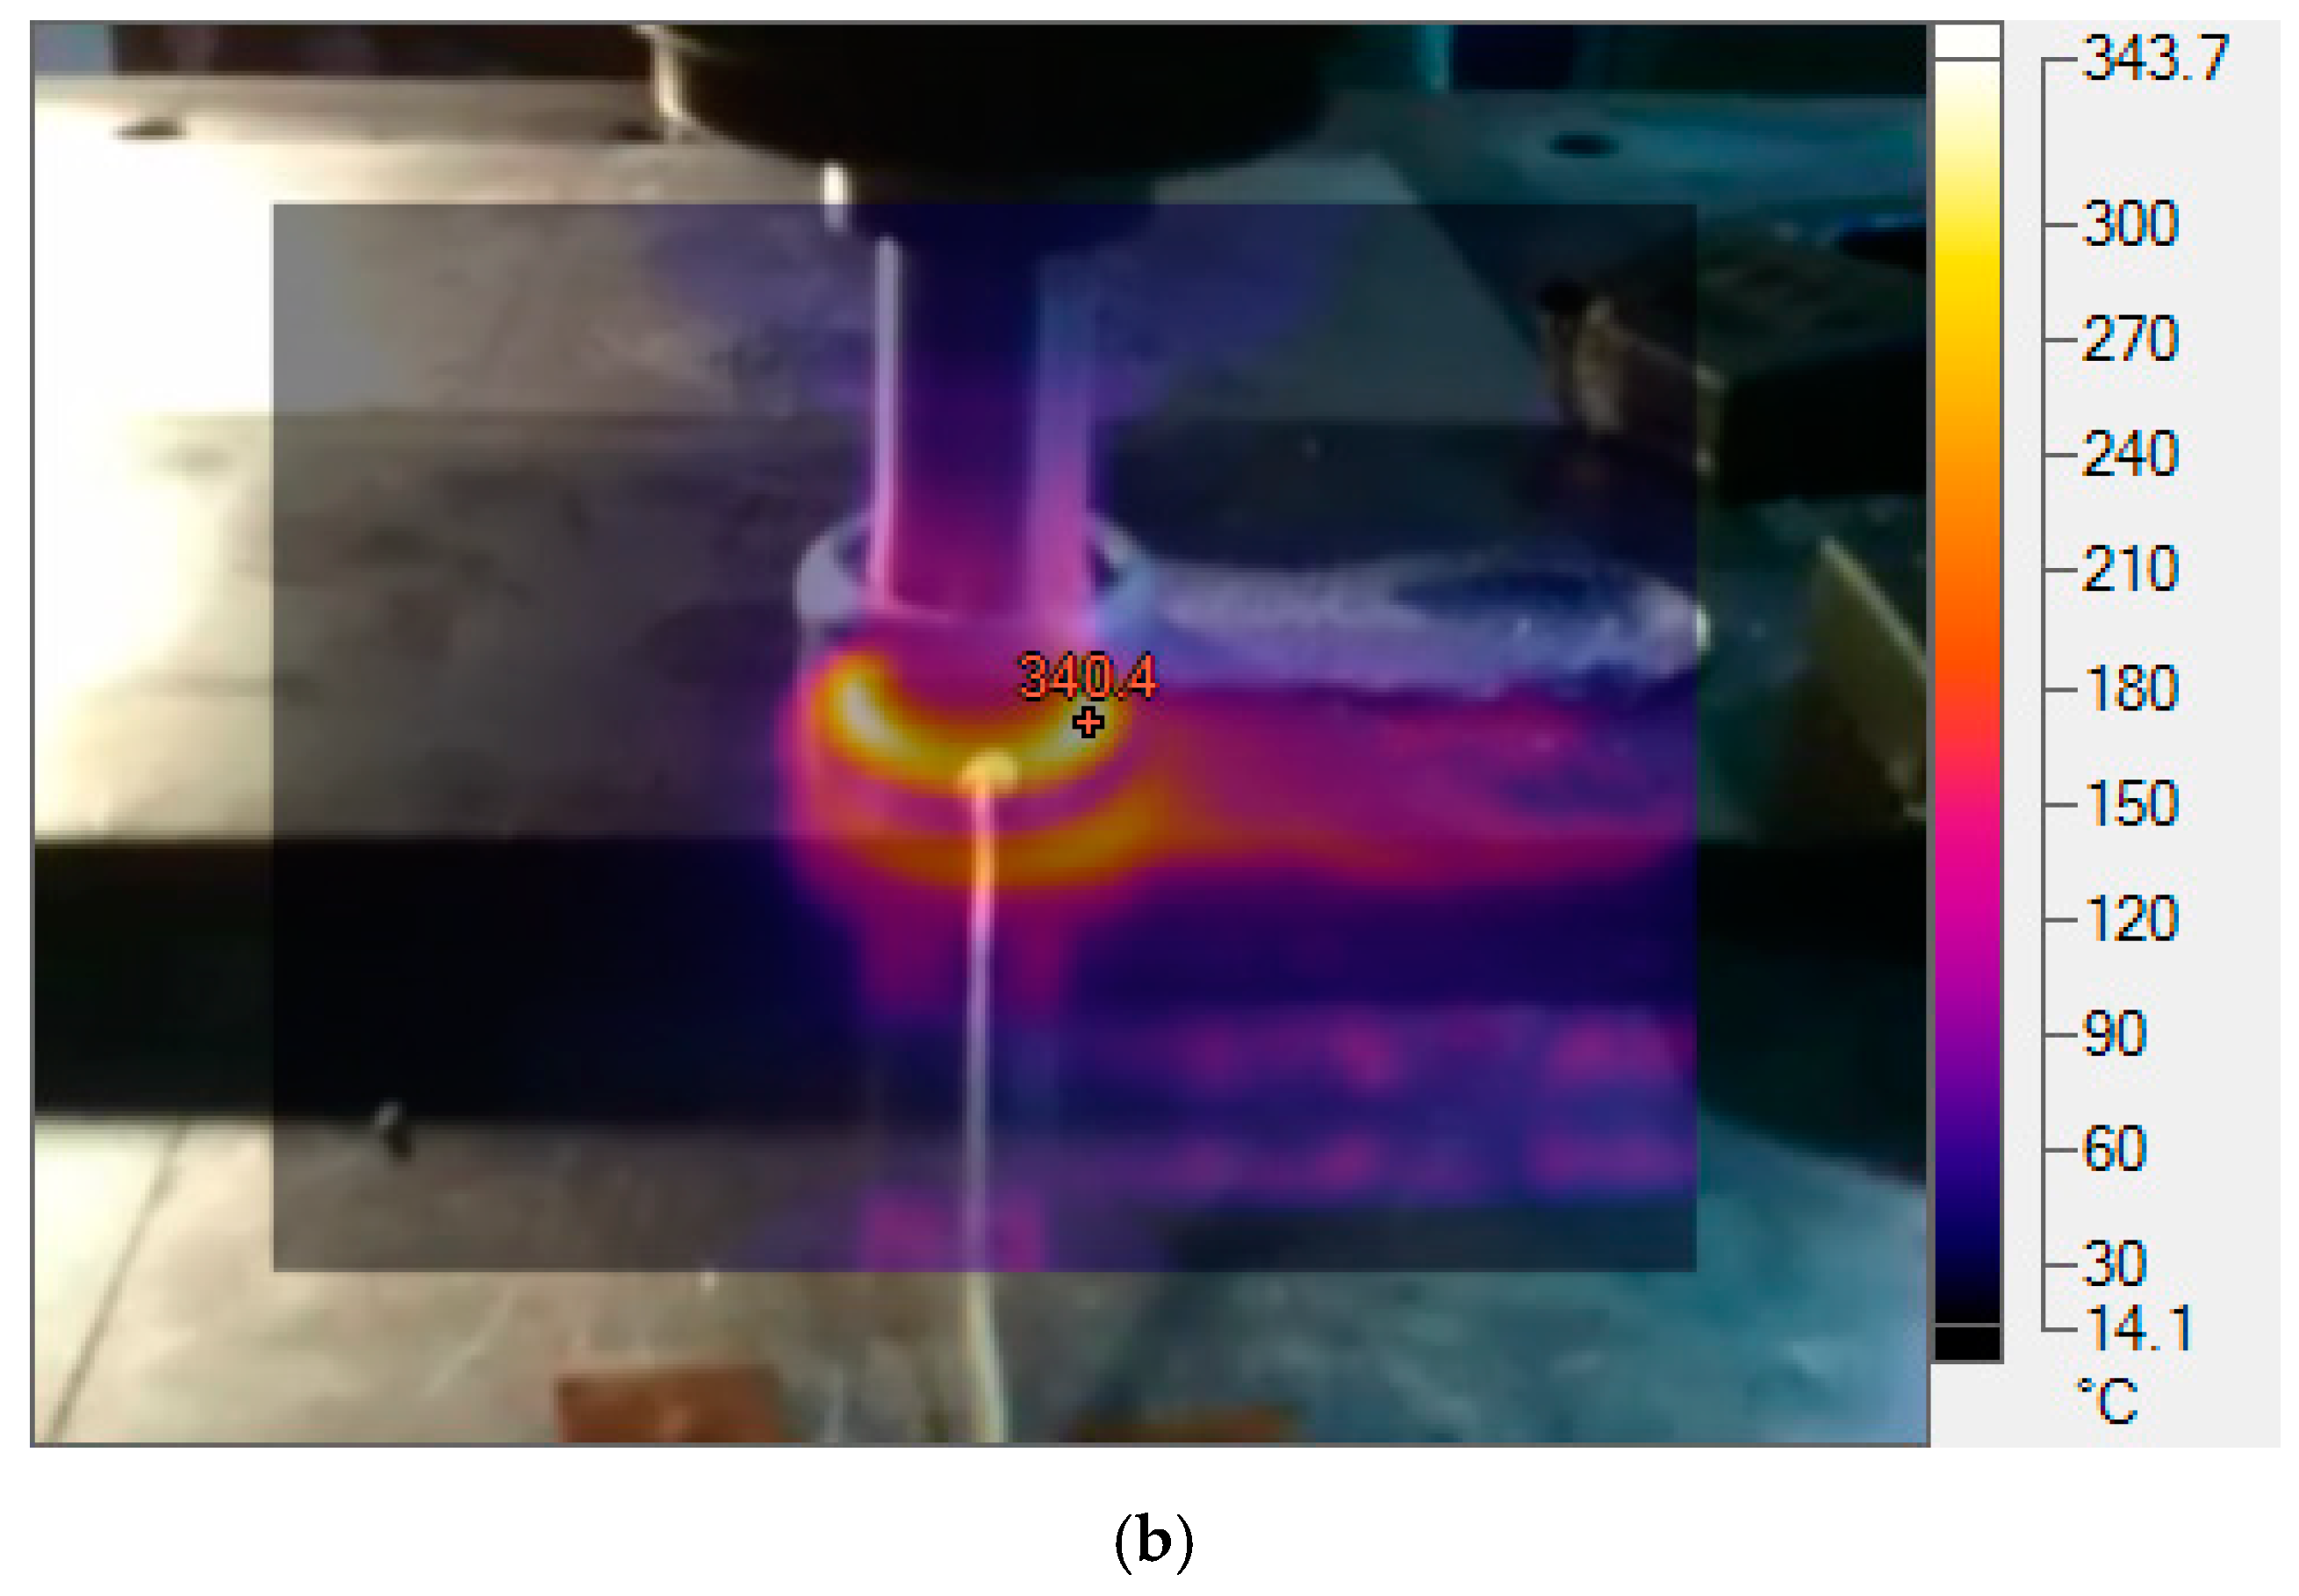
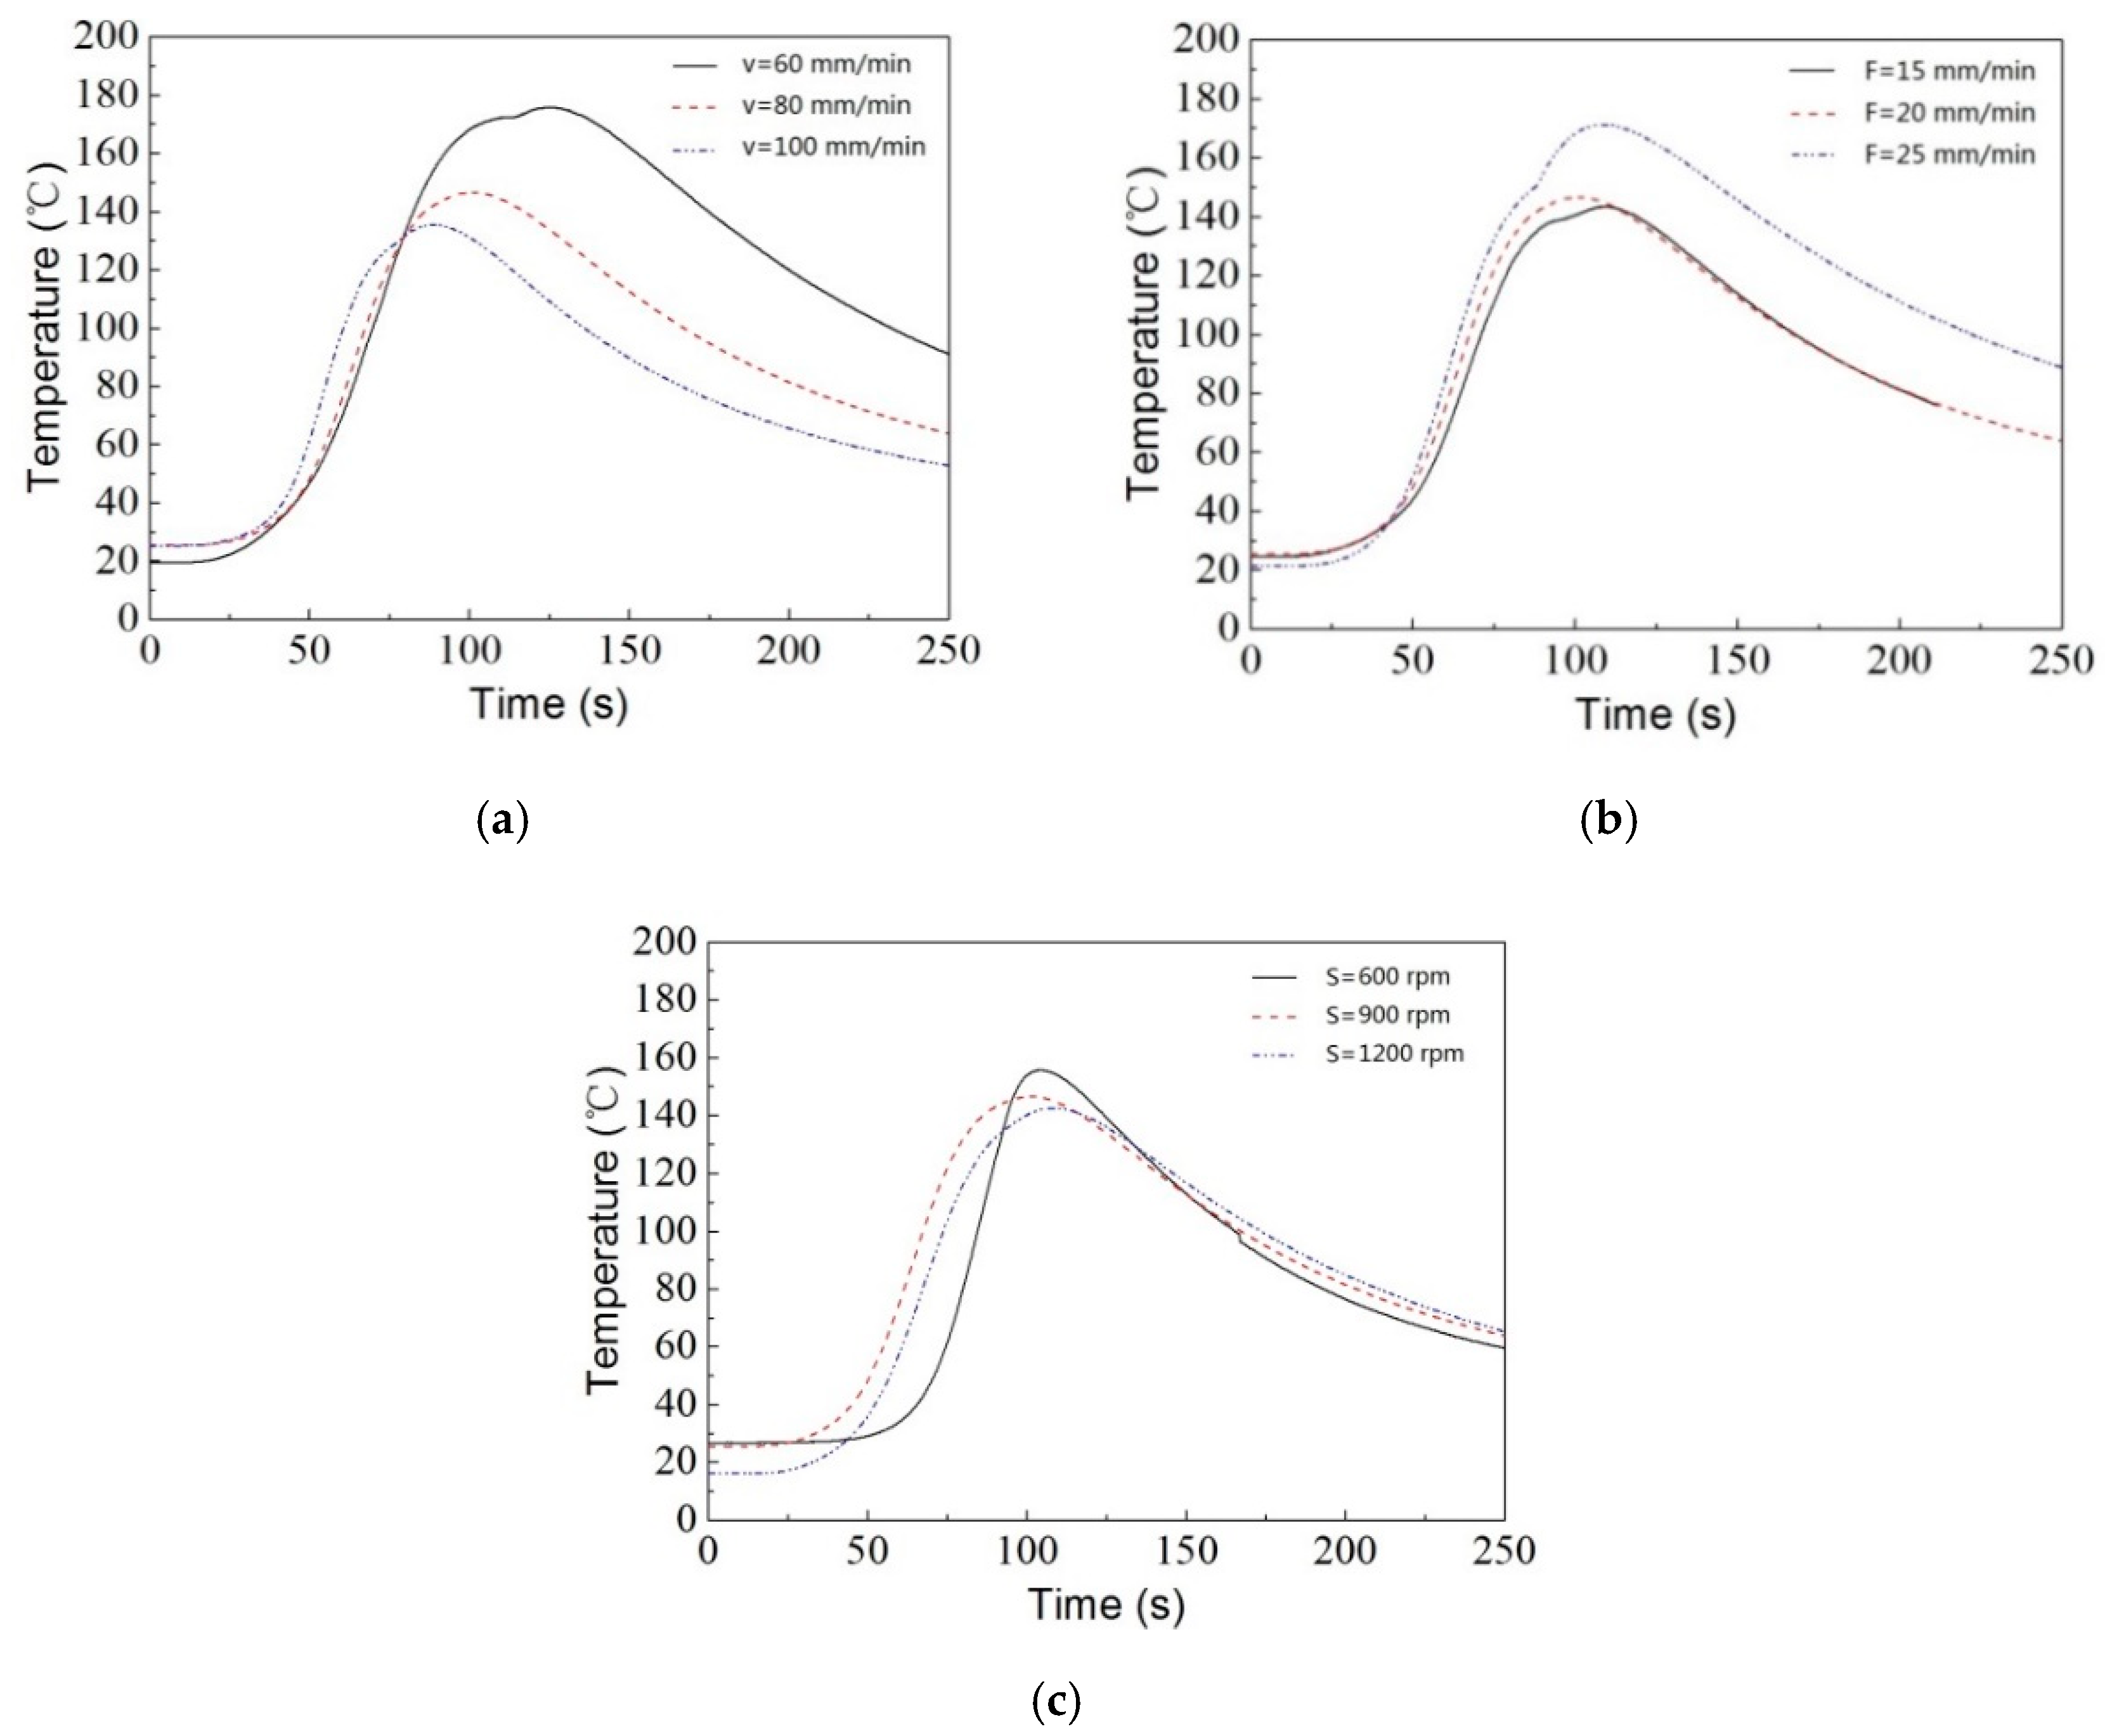
3.2. Thermal Analysis

Temperature evolution measured from the thermocouples at CH03 and CH04 is plotted in Figure 7. The temperature increased rapidly when the rod passed the measuring points and then gradually decreased to ambient temperature. The peak temperature was higher at the center than that at edge of the deposition zone. It was found, from Figure 7, that a lower travel speed resulted in higher temperature due to higher heat input per unit time. This was also evidenced by the infrared thermal images, as shown in Figure 8. The temperature histories at CH01 for three different travel speeds were also determined, and the curves were plotted in Figure 9a. The effect of travel speed on temperature was similar for different positions on the steel substrate.
The temperature curves for three different feed speeds are presented in Figure 9b. With the increase of feed speed, more rod material was pushed against the steel substrate and experienced large plastic deformation, leading to more heat generation and higher temperature. The temperature evolutions at CH01 for three ration speeds are shown in Figure 9c. When the travel speed and feed rate were fixed, a higher rotation speed generated more heat and higher temperature in the deposition region. However, the peak temperature decreased with the increase of rotation speed at CH01. This was due to the distance between CH01 and the edge of the deposition region. For test No. 7, 2 and 9 in Figure 6, the deposition morphology revealed that the edge of the deposition region moved away from CH01 when the rotation speed increased. Because of the malfunction of the thermocouple at CH02, the specific temperature data are not presented.

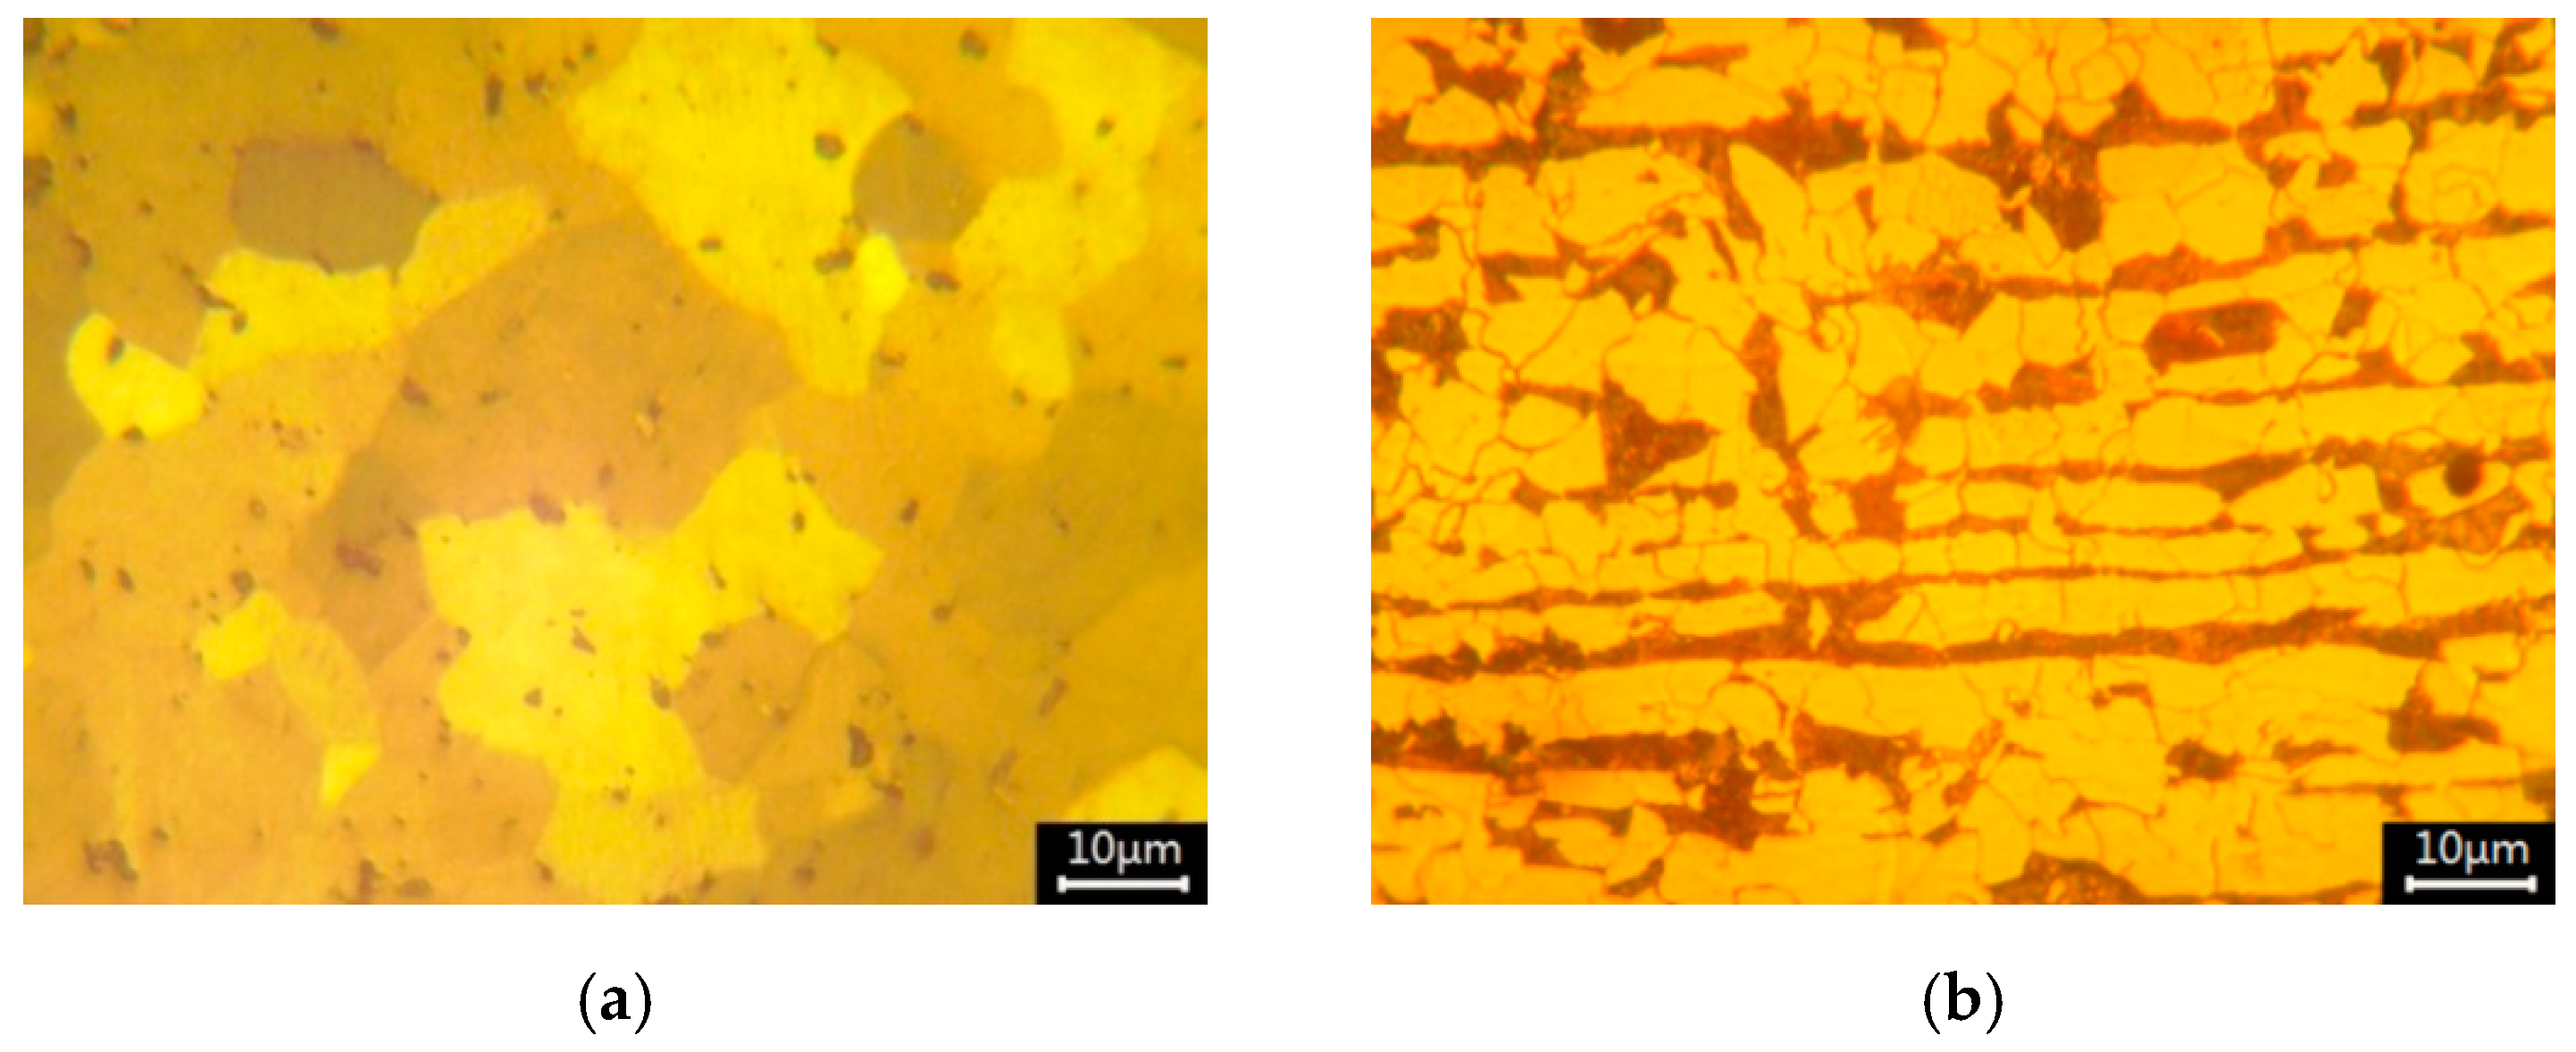
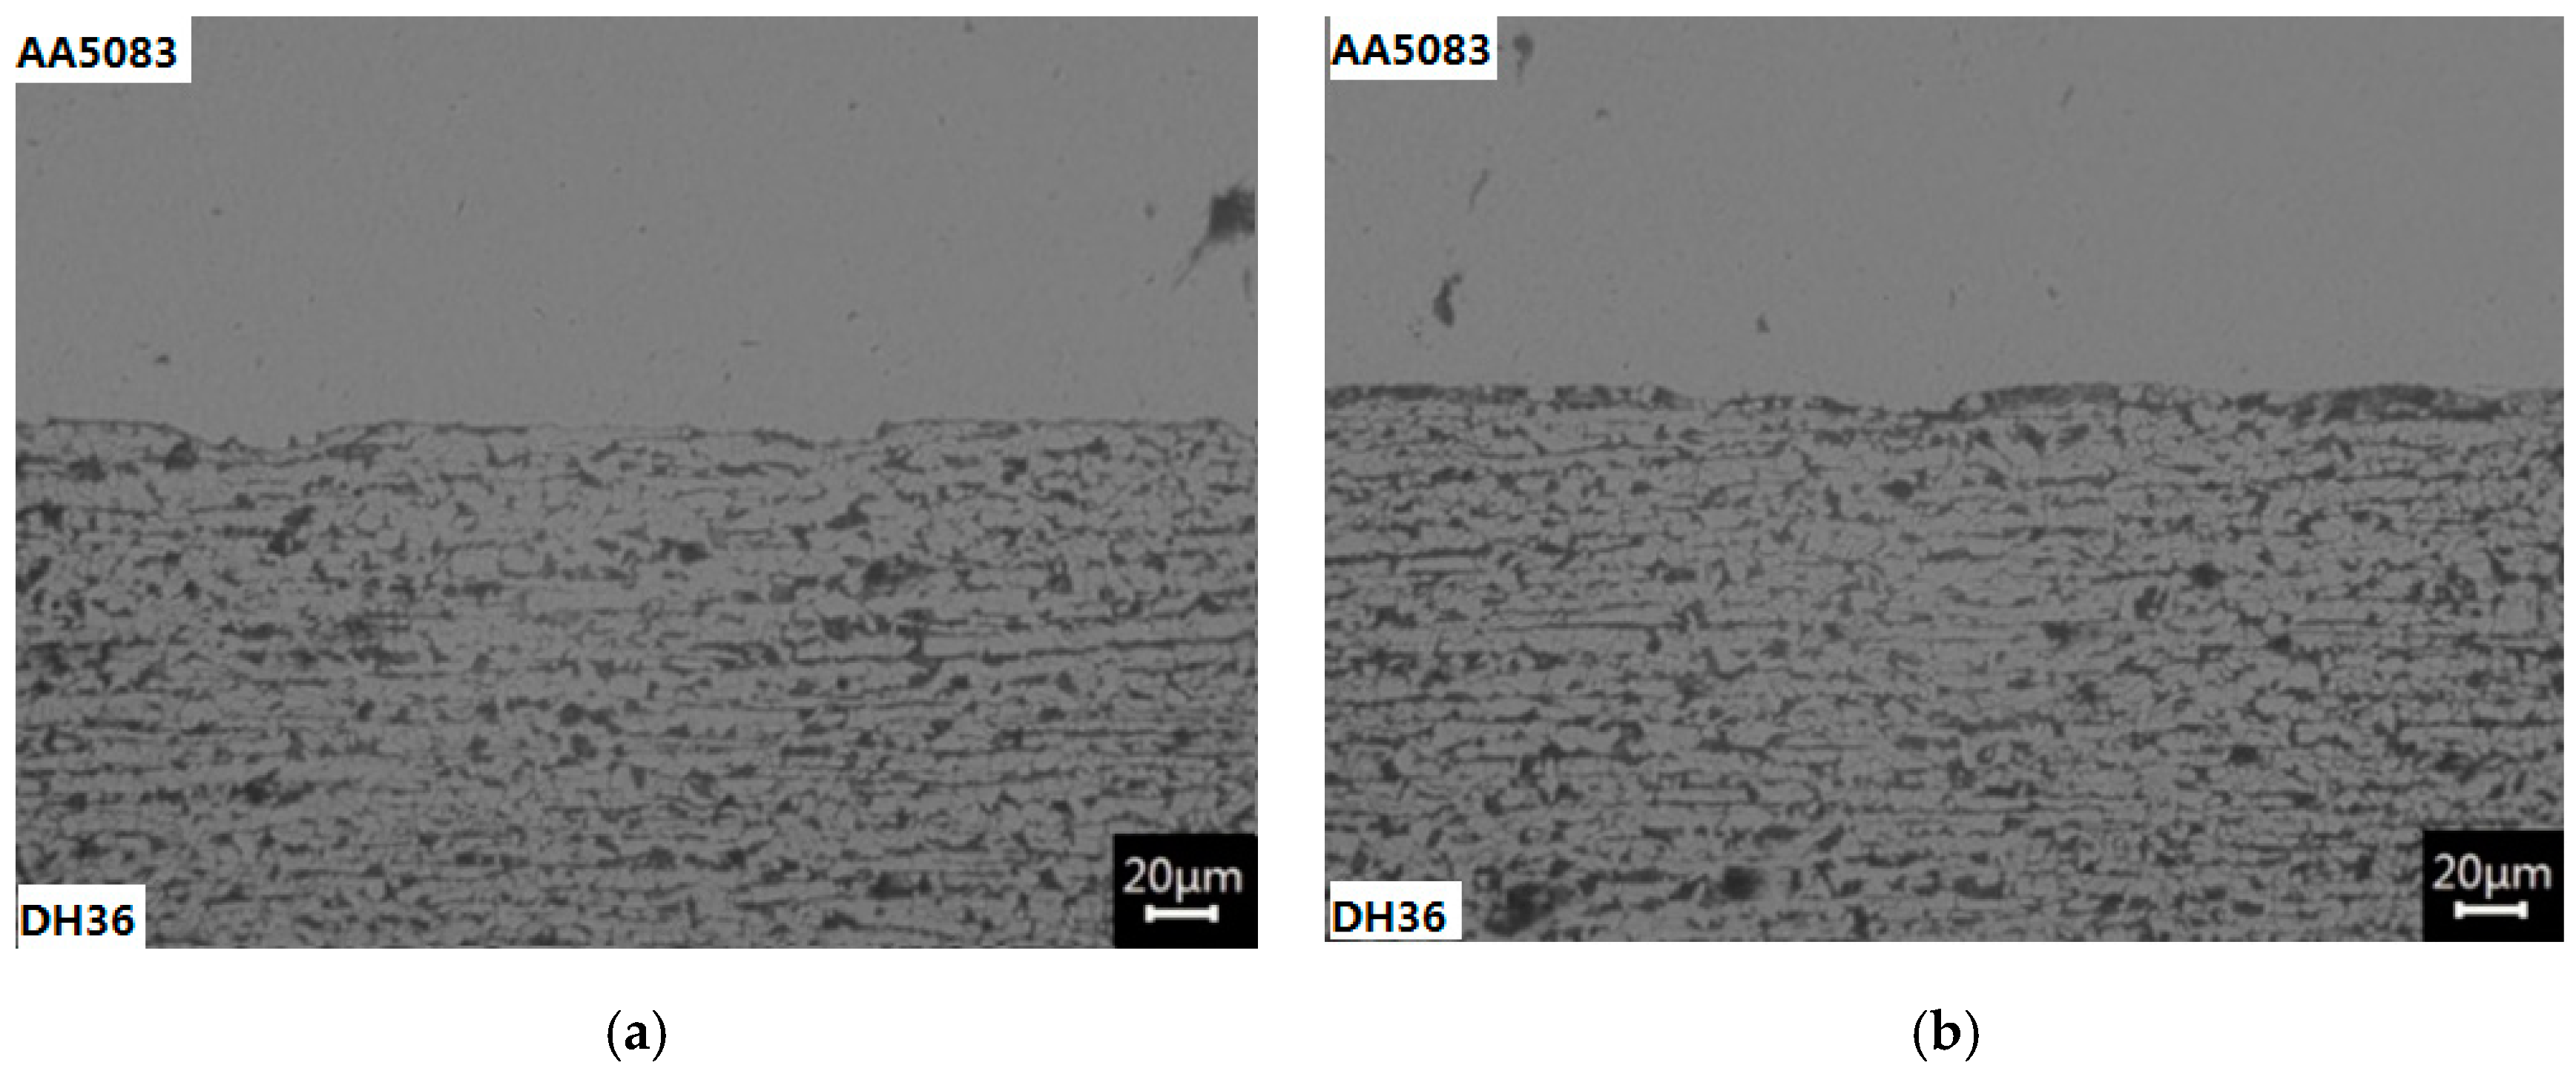
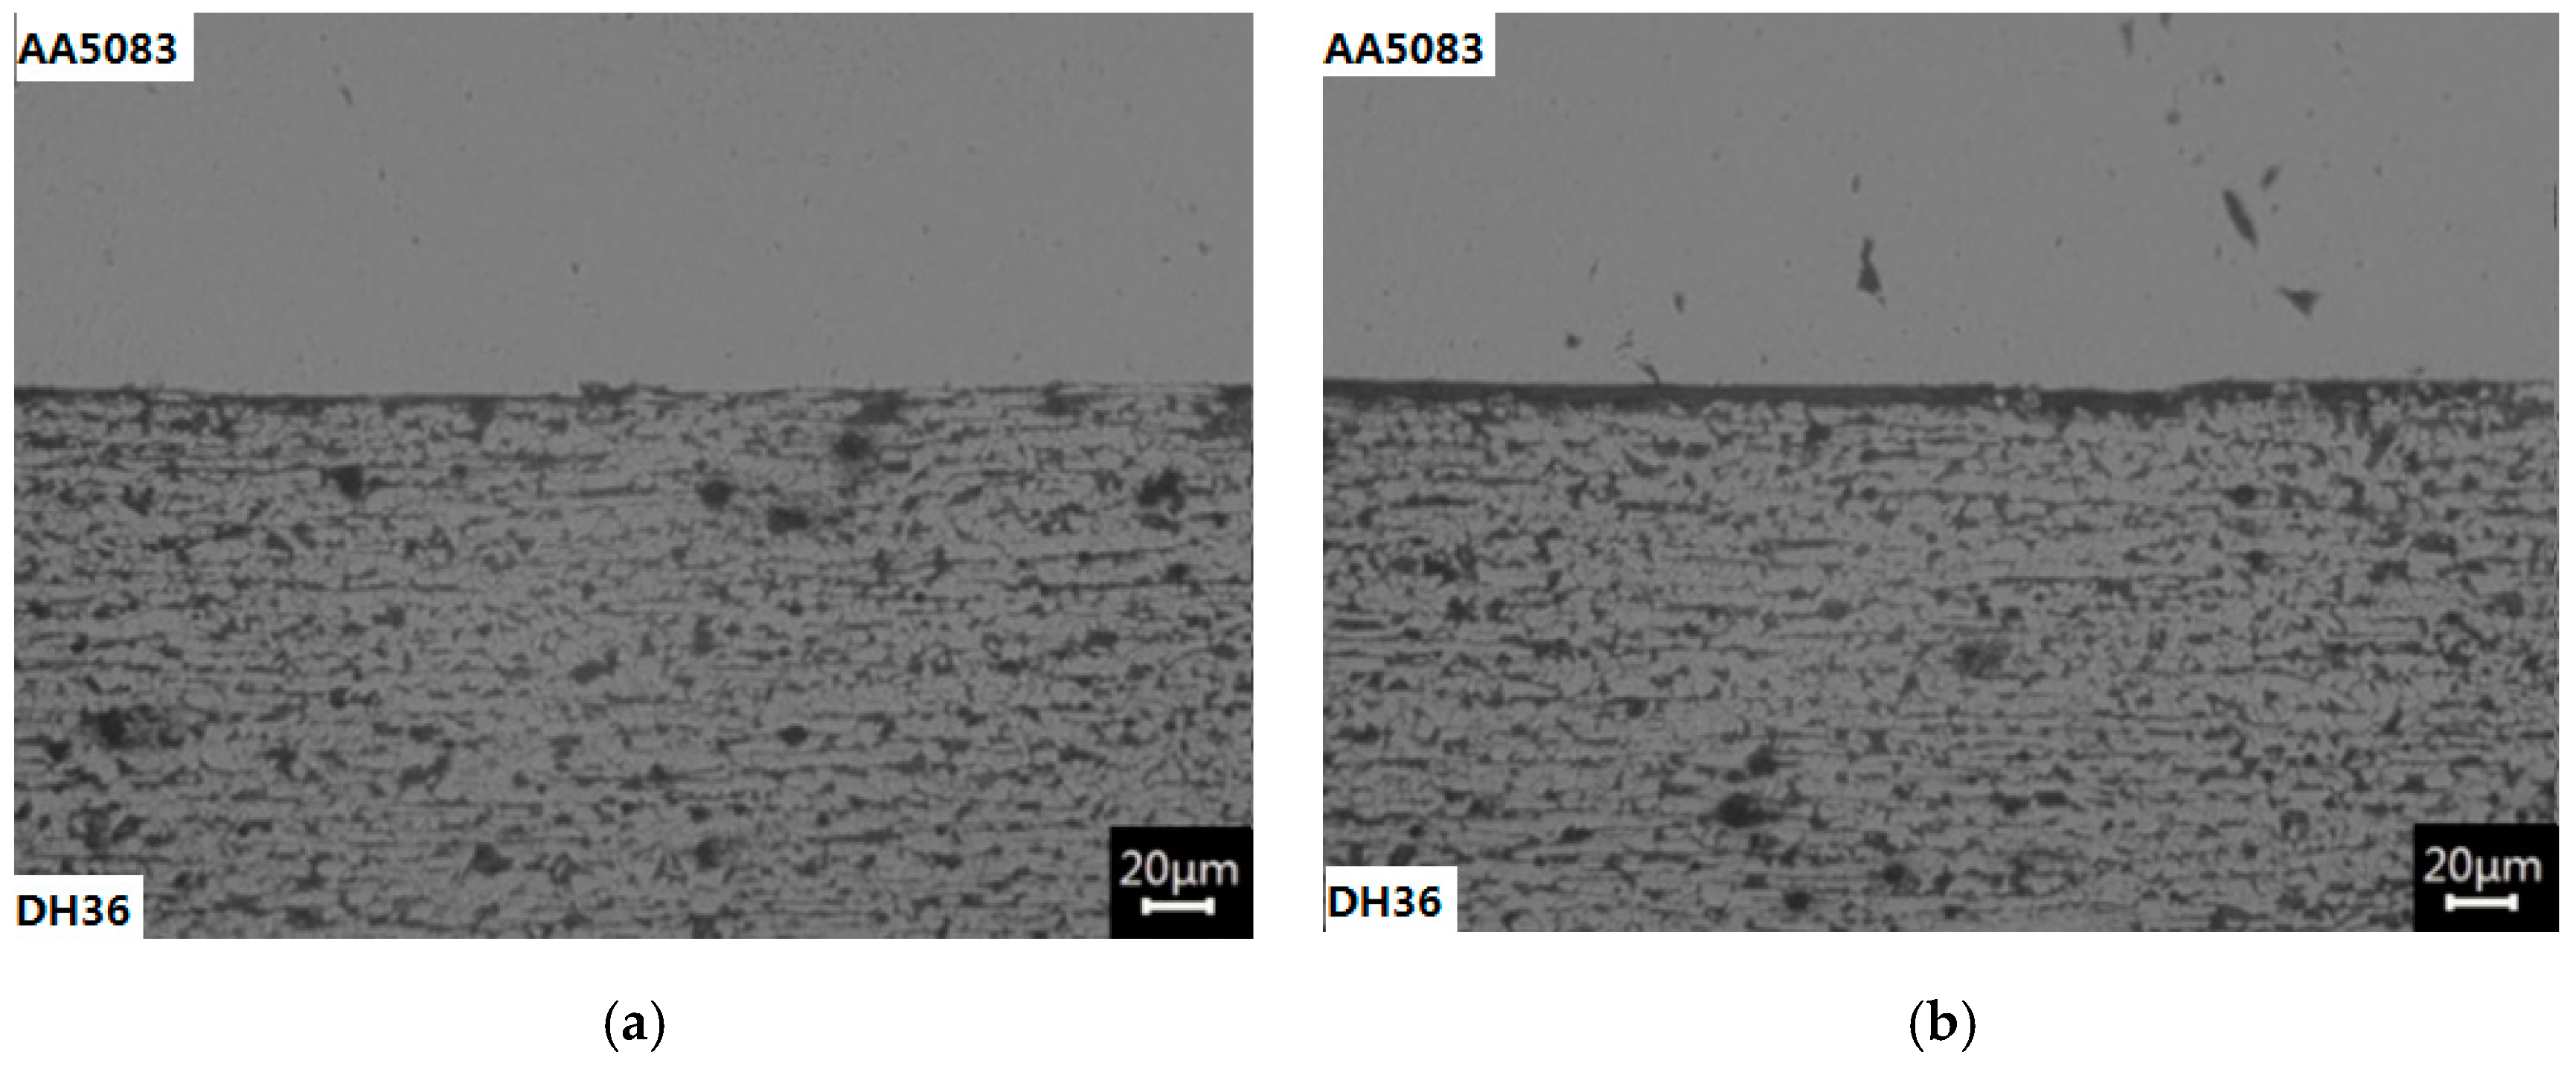
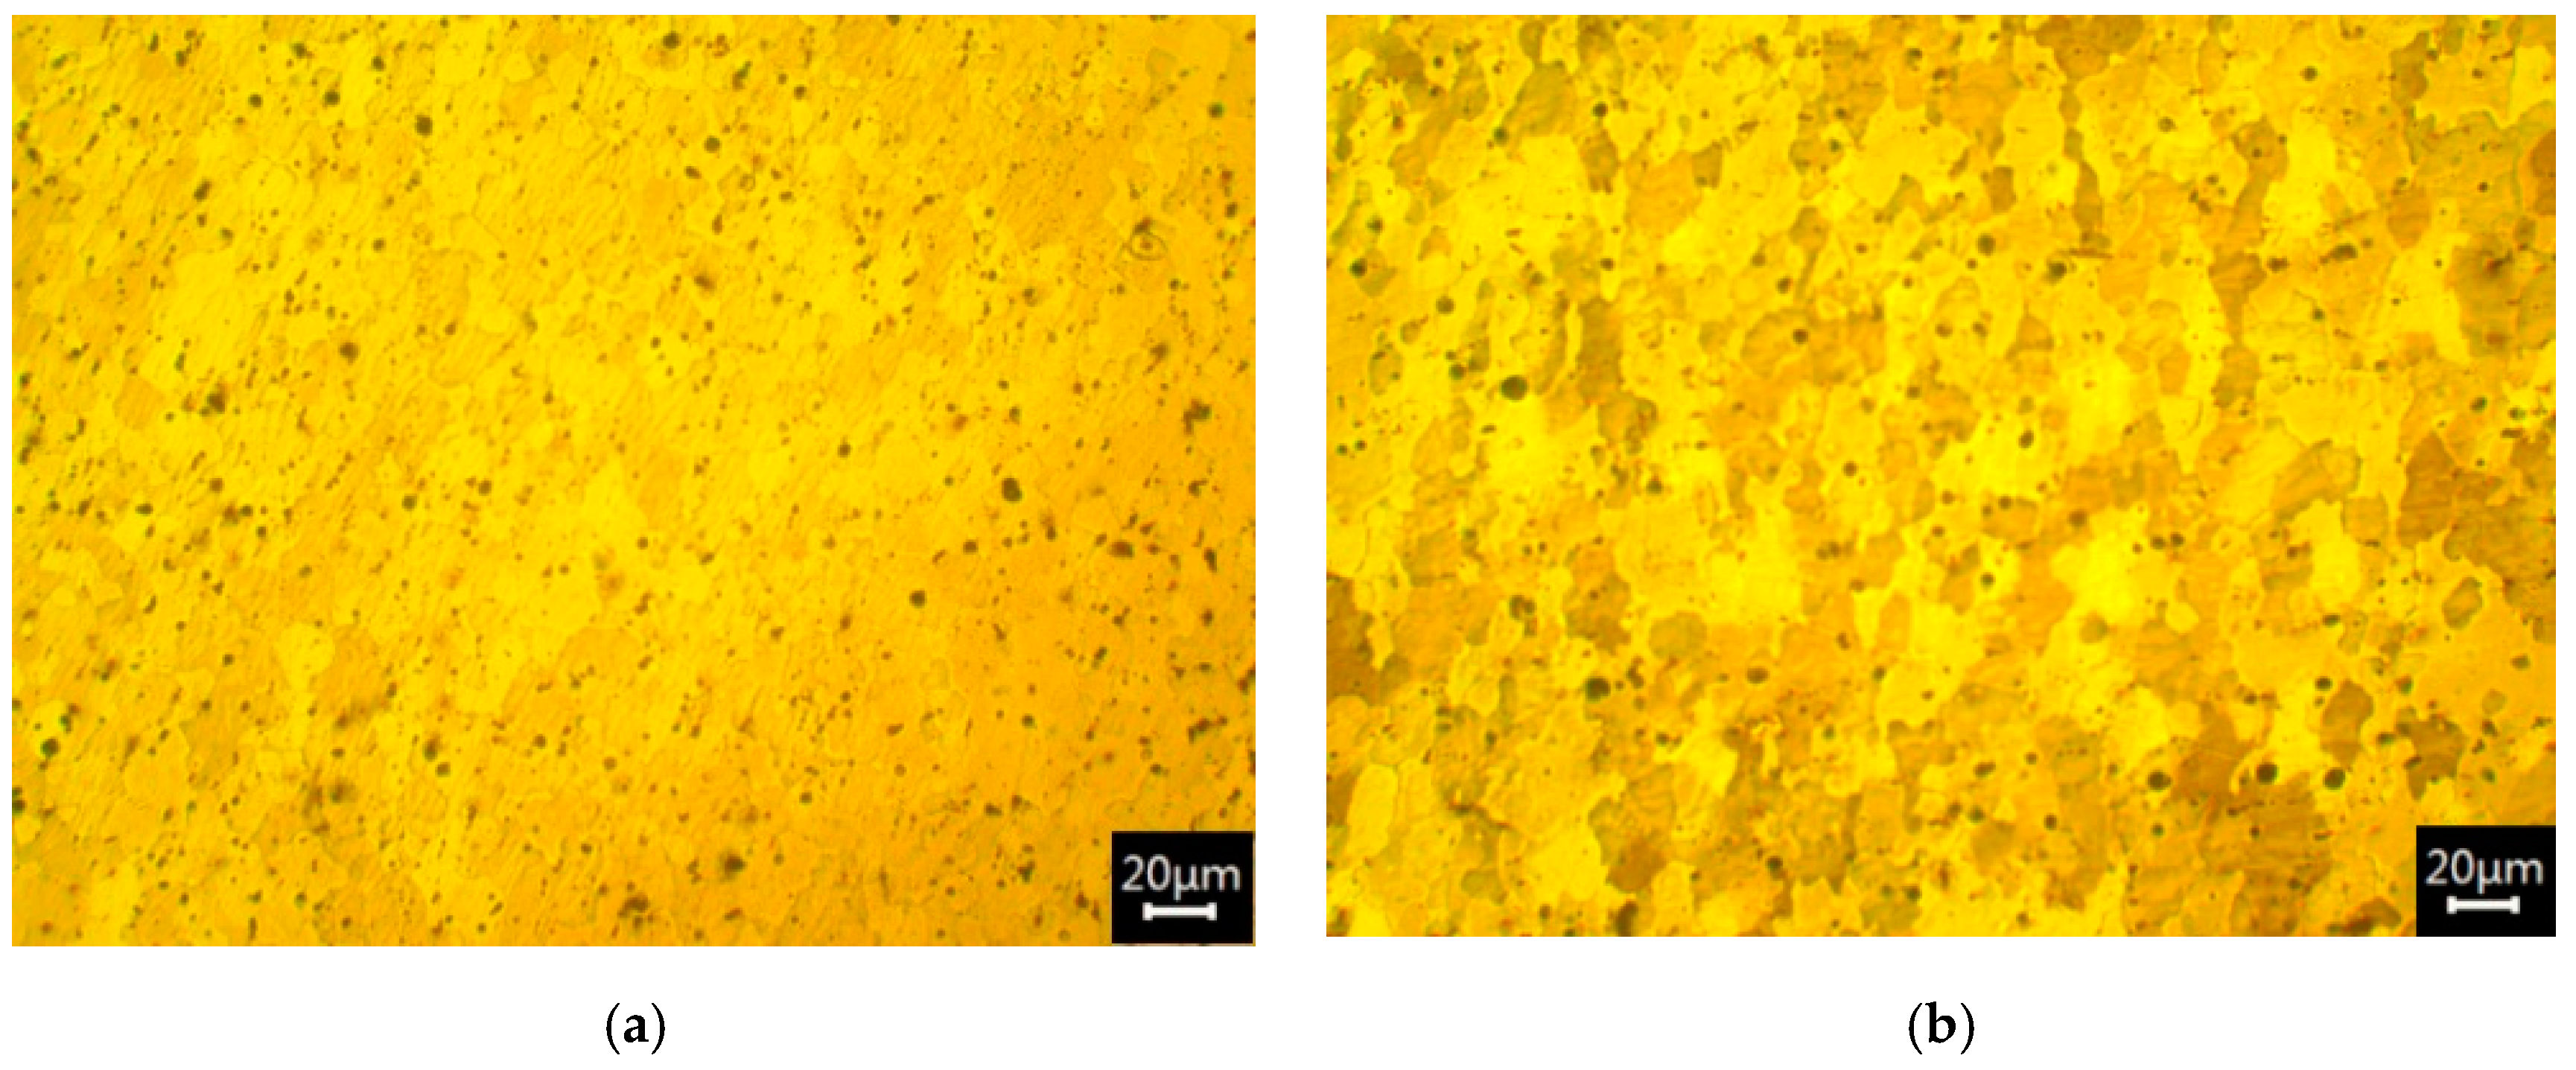
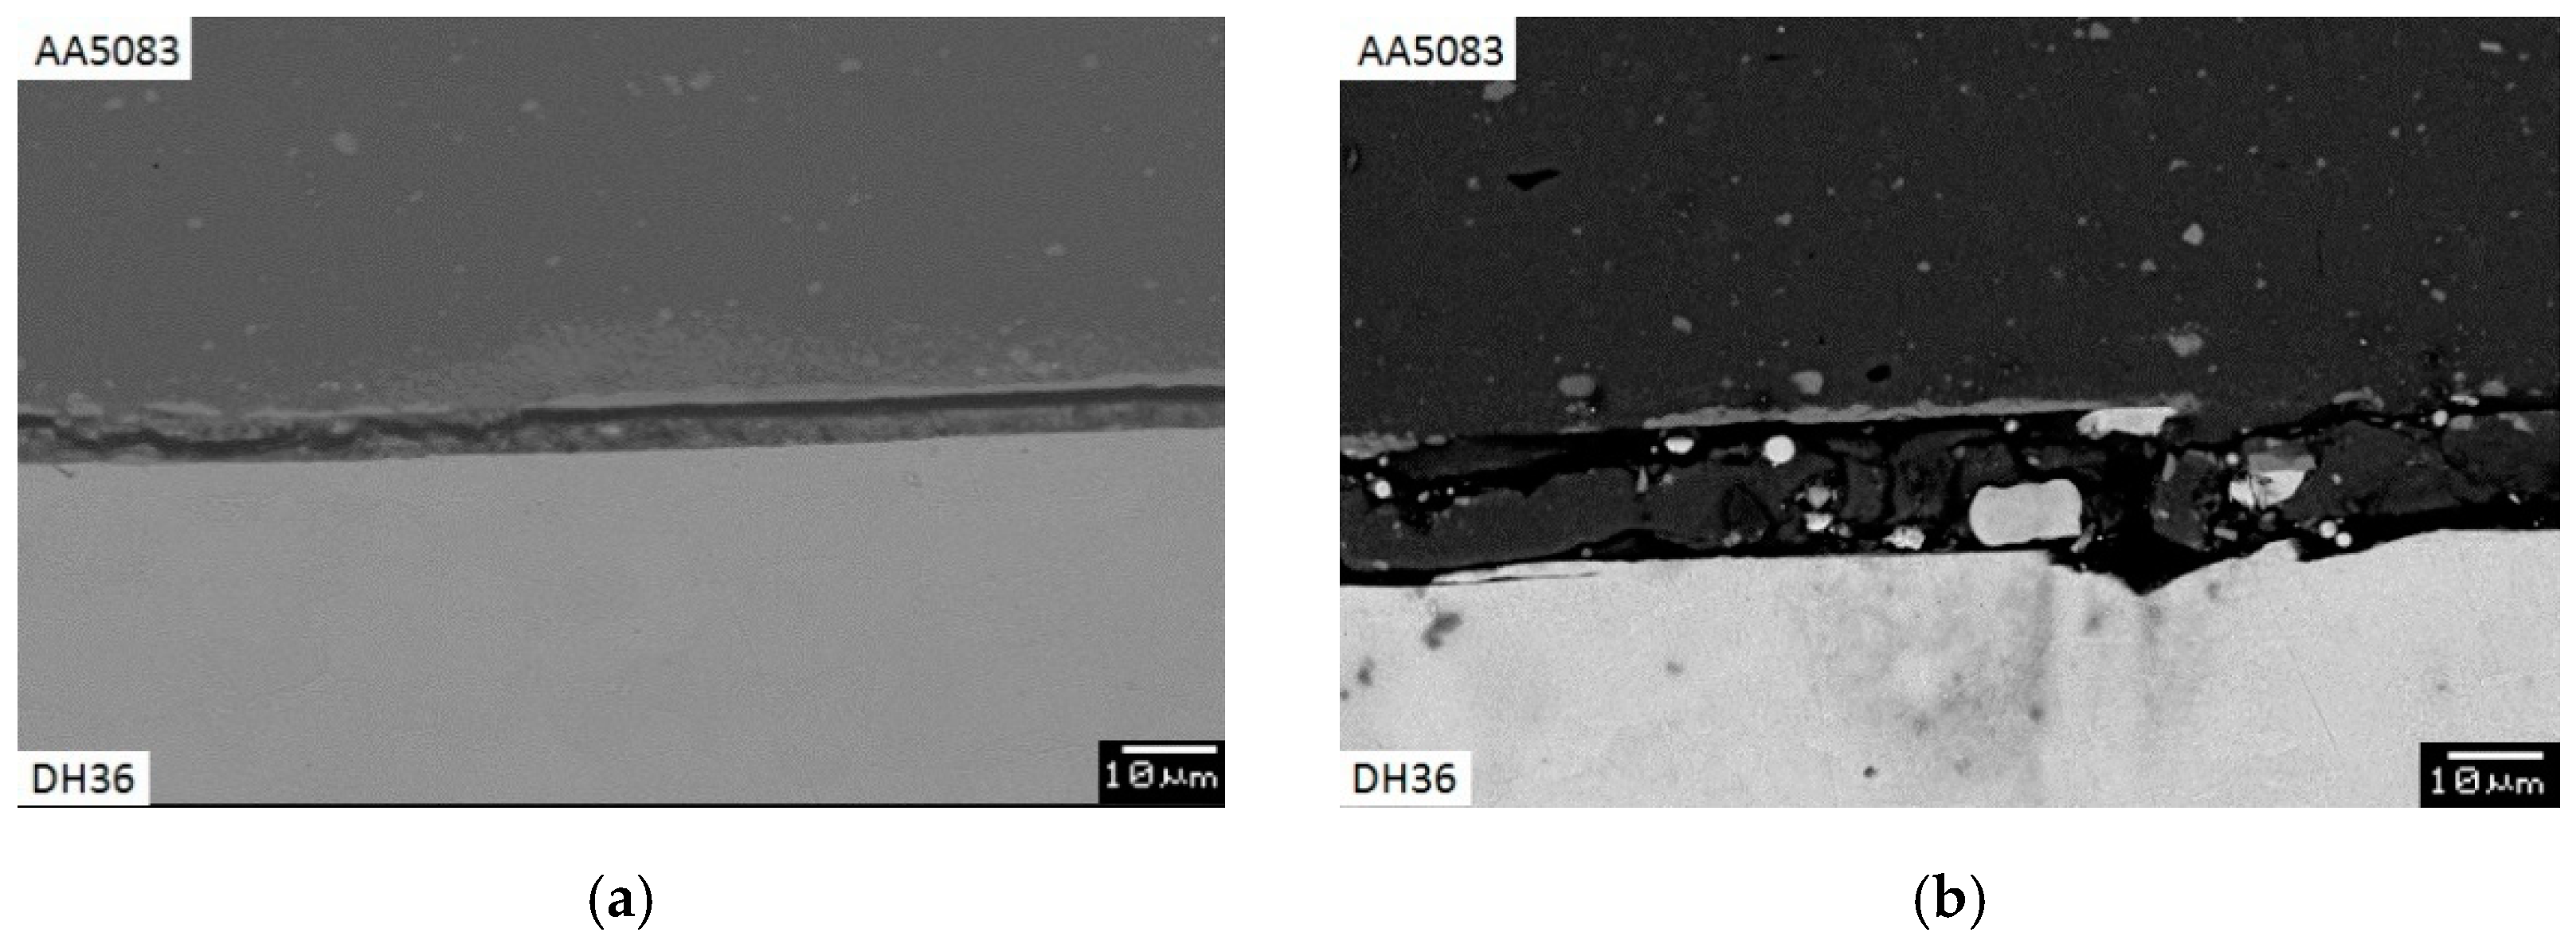
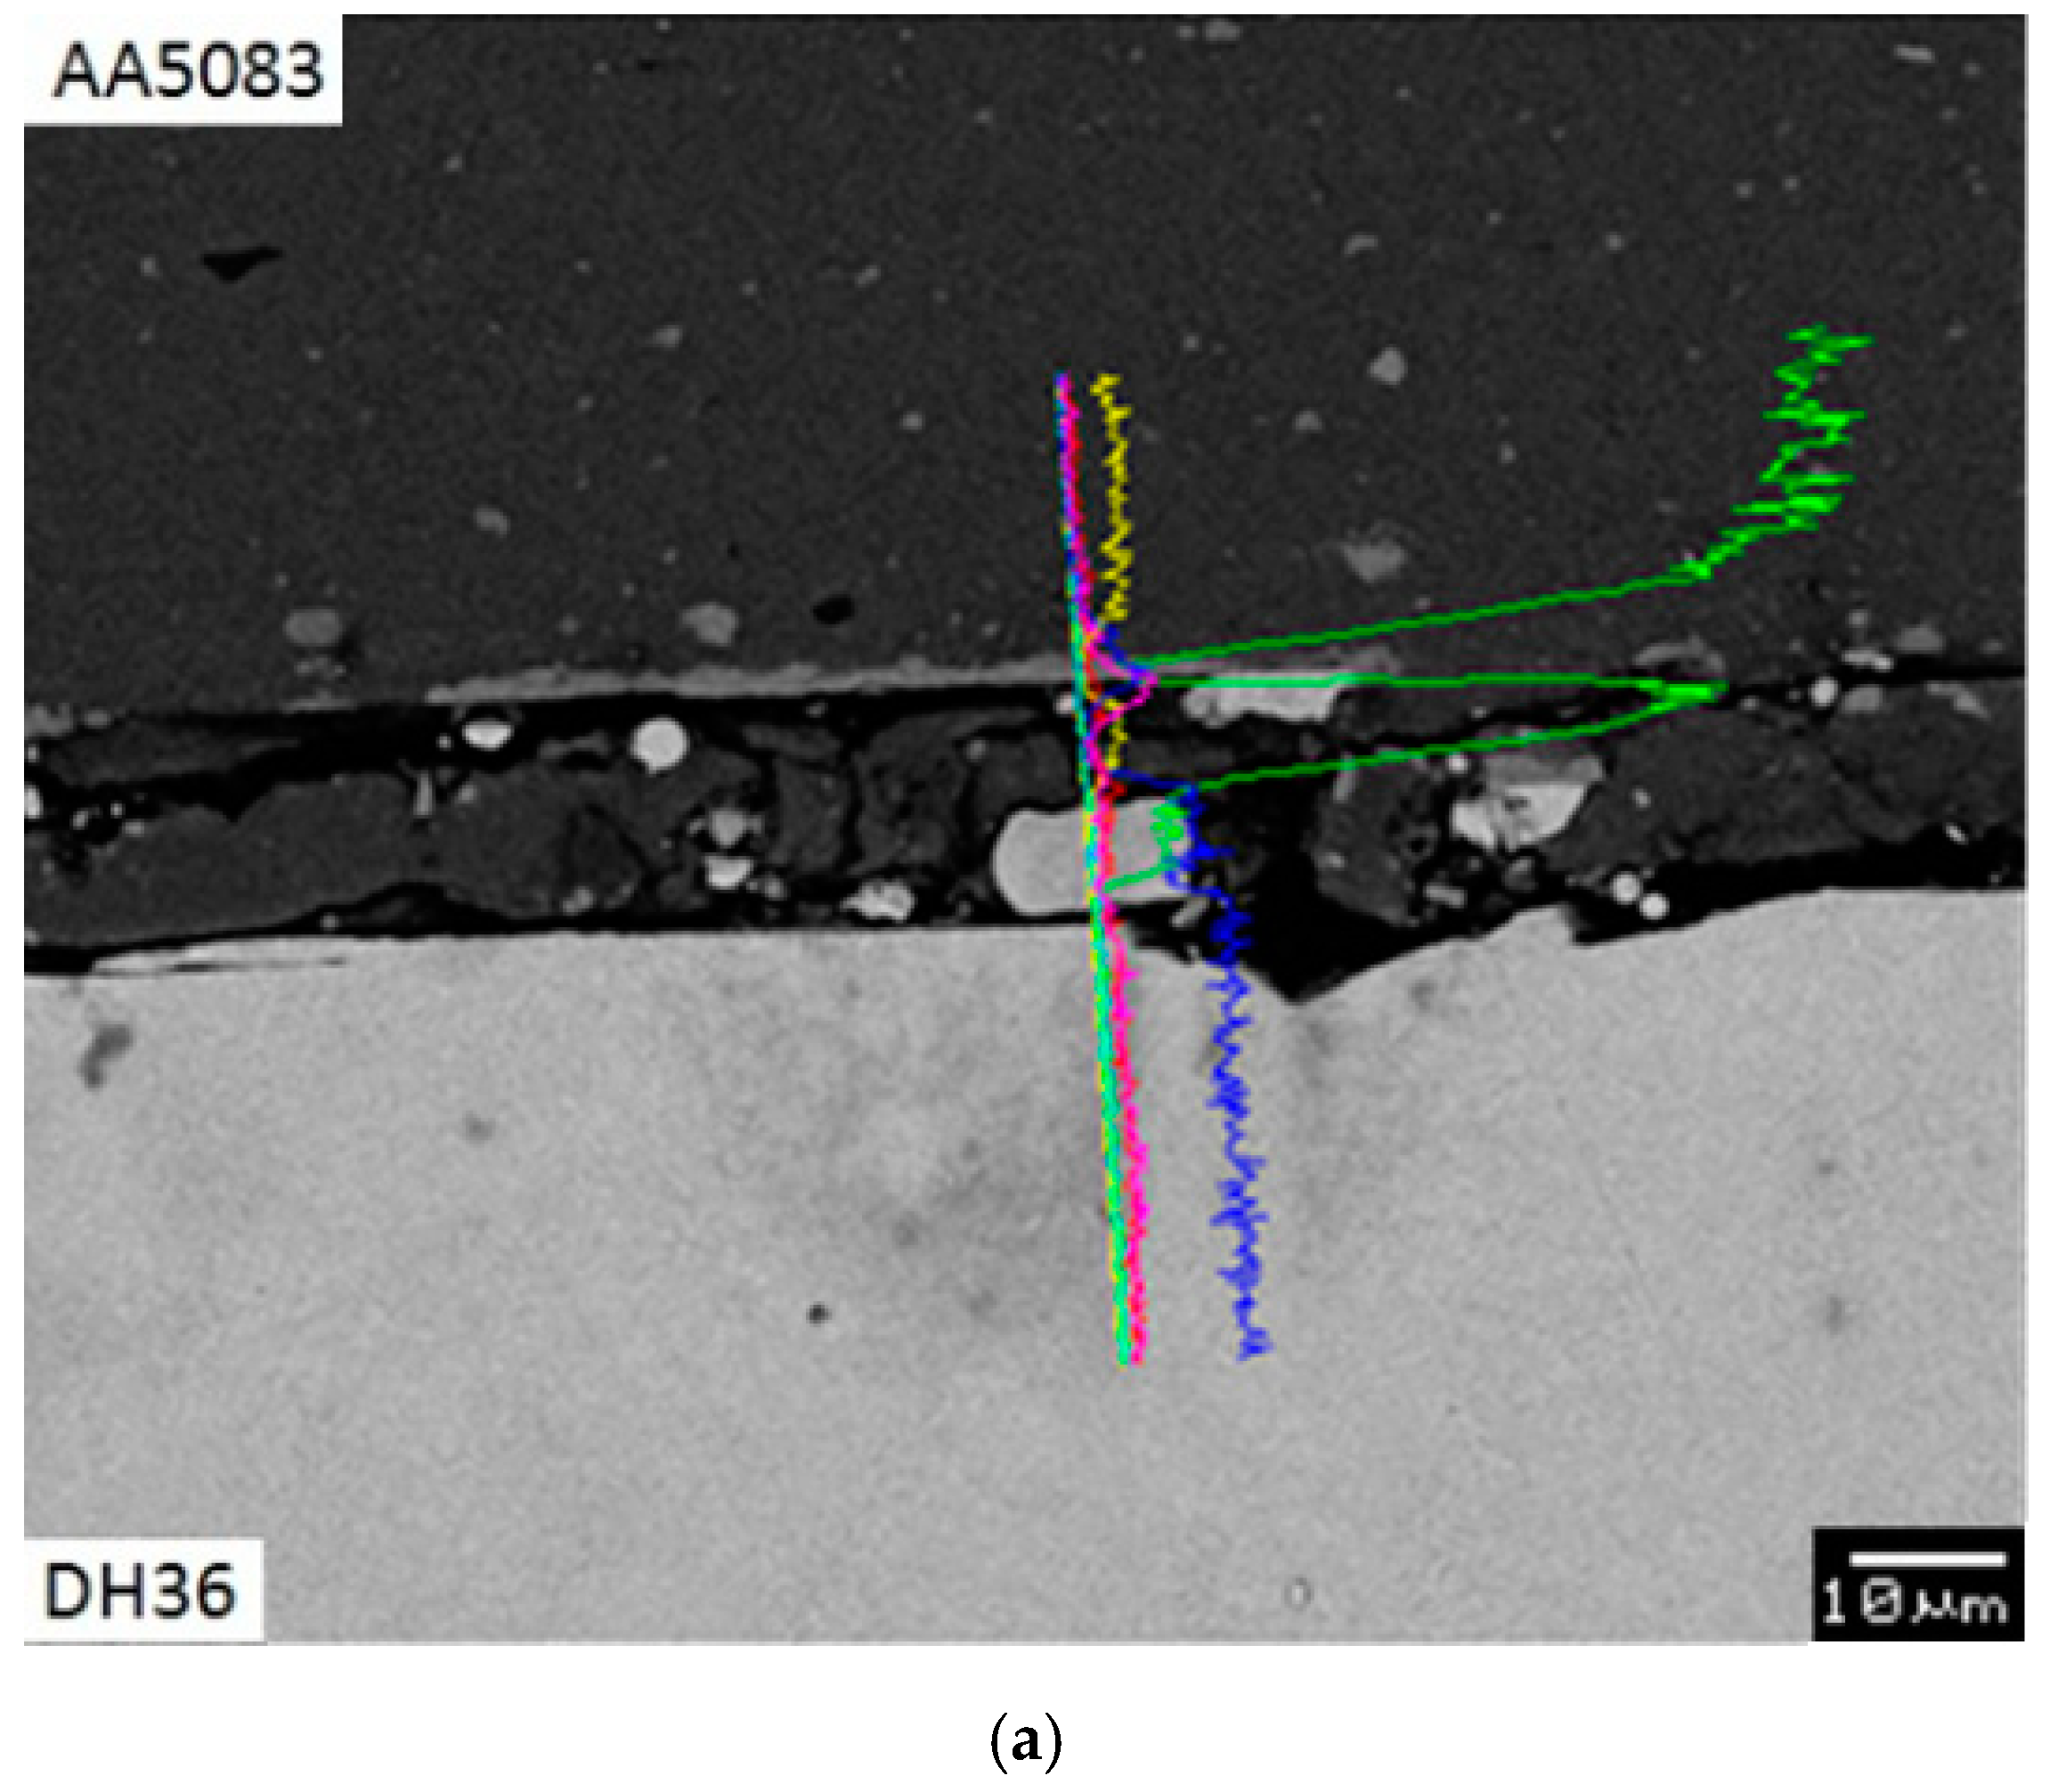
3.3. Metallographic Analysis

A typical metallographic specimen is shown in Figure 10. There were scattered depositions on top of the continuous deposited layer. The thickness increased towards the two sides of the deposition, especially at the retreating side (RS). The parent material microstructures of AA5083 and DH36 are given in Figure 11; the typical banded structure of pearlite and equiaxed ferrite was found for DH36. At the interface of deposition layer and substrate, the aluminum underwent severe plastic deformation, and the grains were refined. Because of higher hardness and strength, the steel substrate microstructure was affected substantially less than the aluminium, as shown in Figure 12, Figure 13 and Figure 14 for three typical cases. Only samples 3, 4, 9 were observed because the depositions on samples 1, 2 and 6 fell off when preparing the metallographic specimen. Because of the groove defect, sample 7 was not considered. As indicated in Table 3, test 3 had the highest feed rate among tests 1–3, test 4 employed the lowest travel speed among tests 4–6 and test 9 used the highest rotation speed among tests 7–9; hence, high-quality interface microstructures were produced with higher feed rate, lower travel speed and higher rotation speed. Clear interfaces can be identified in the middle of the specimen in Figure 12a, Figure 13a and Figure 14a. However, a larger interaction zone was found in the retreating side of the deposition, as shown in Figure 12b, Figure 13b and Figure 14b, indicating more intense friction at both advancing and retreating sides.
During the FS process, the rod was subjected to substantial plastic deformation. The characteristic shape of the deformed rod is exhibited in Figure 15. The accumulated flash can be identified at the bottom end. The microstructures of the consumable rod in the flash (region A) and the heat-affected region (region B) are presented in Figure 16. Similar to findings by Vilaça et al. [20], the grain structure in the flash was finer and more uniform than in region B, since the flash materials experienced significant plastic deformation.

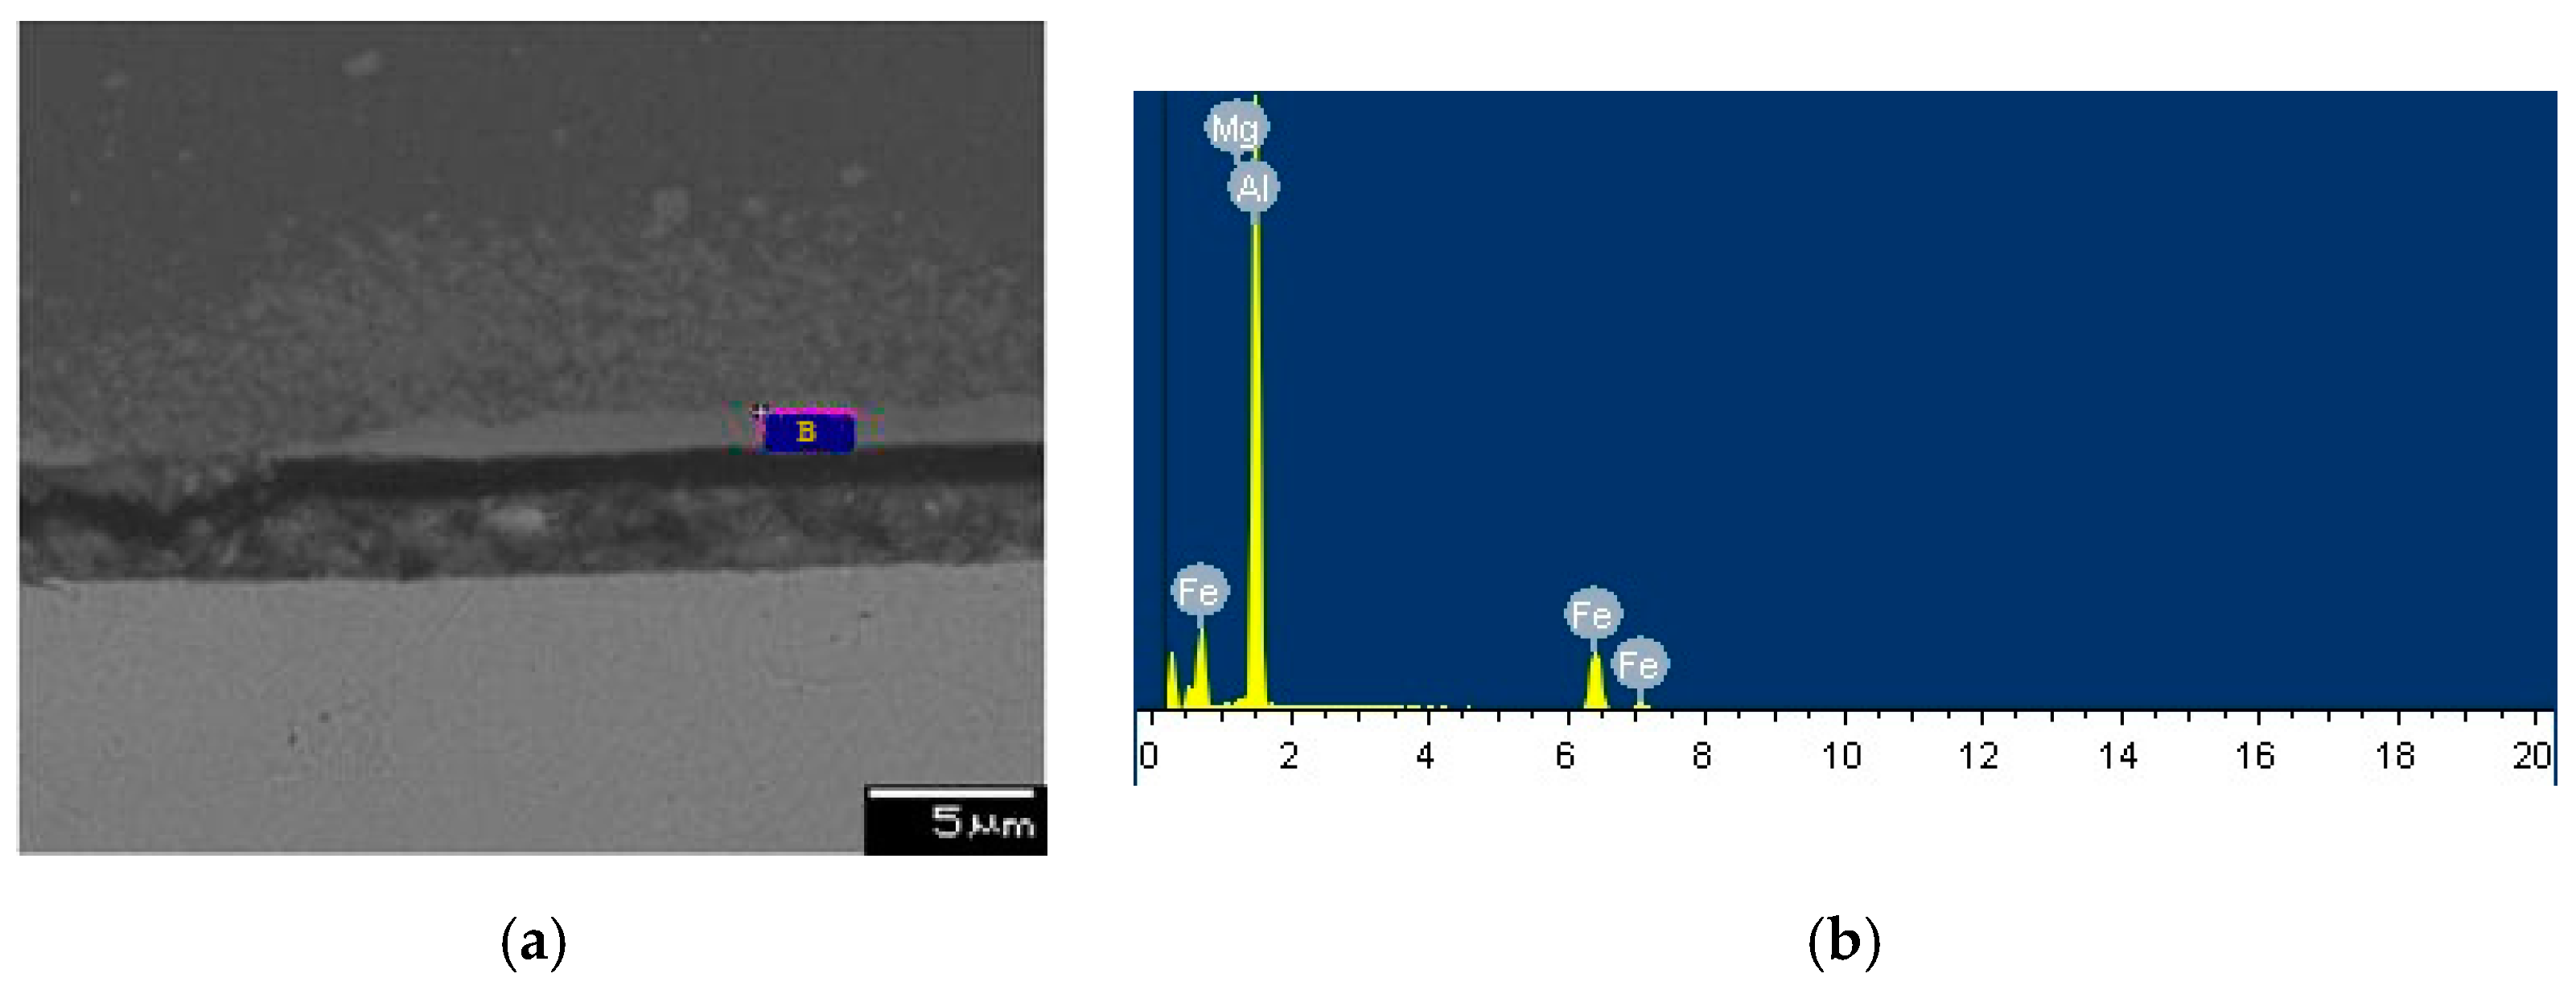
3.4. SEM and EDS Analysis
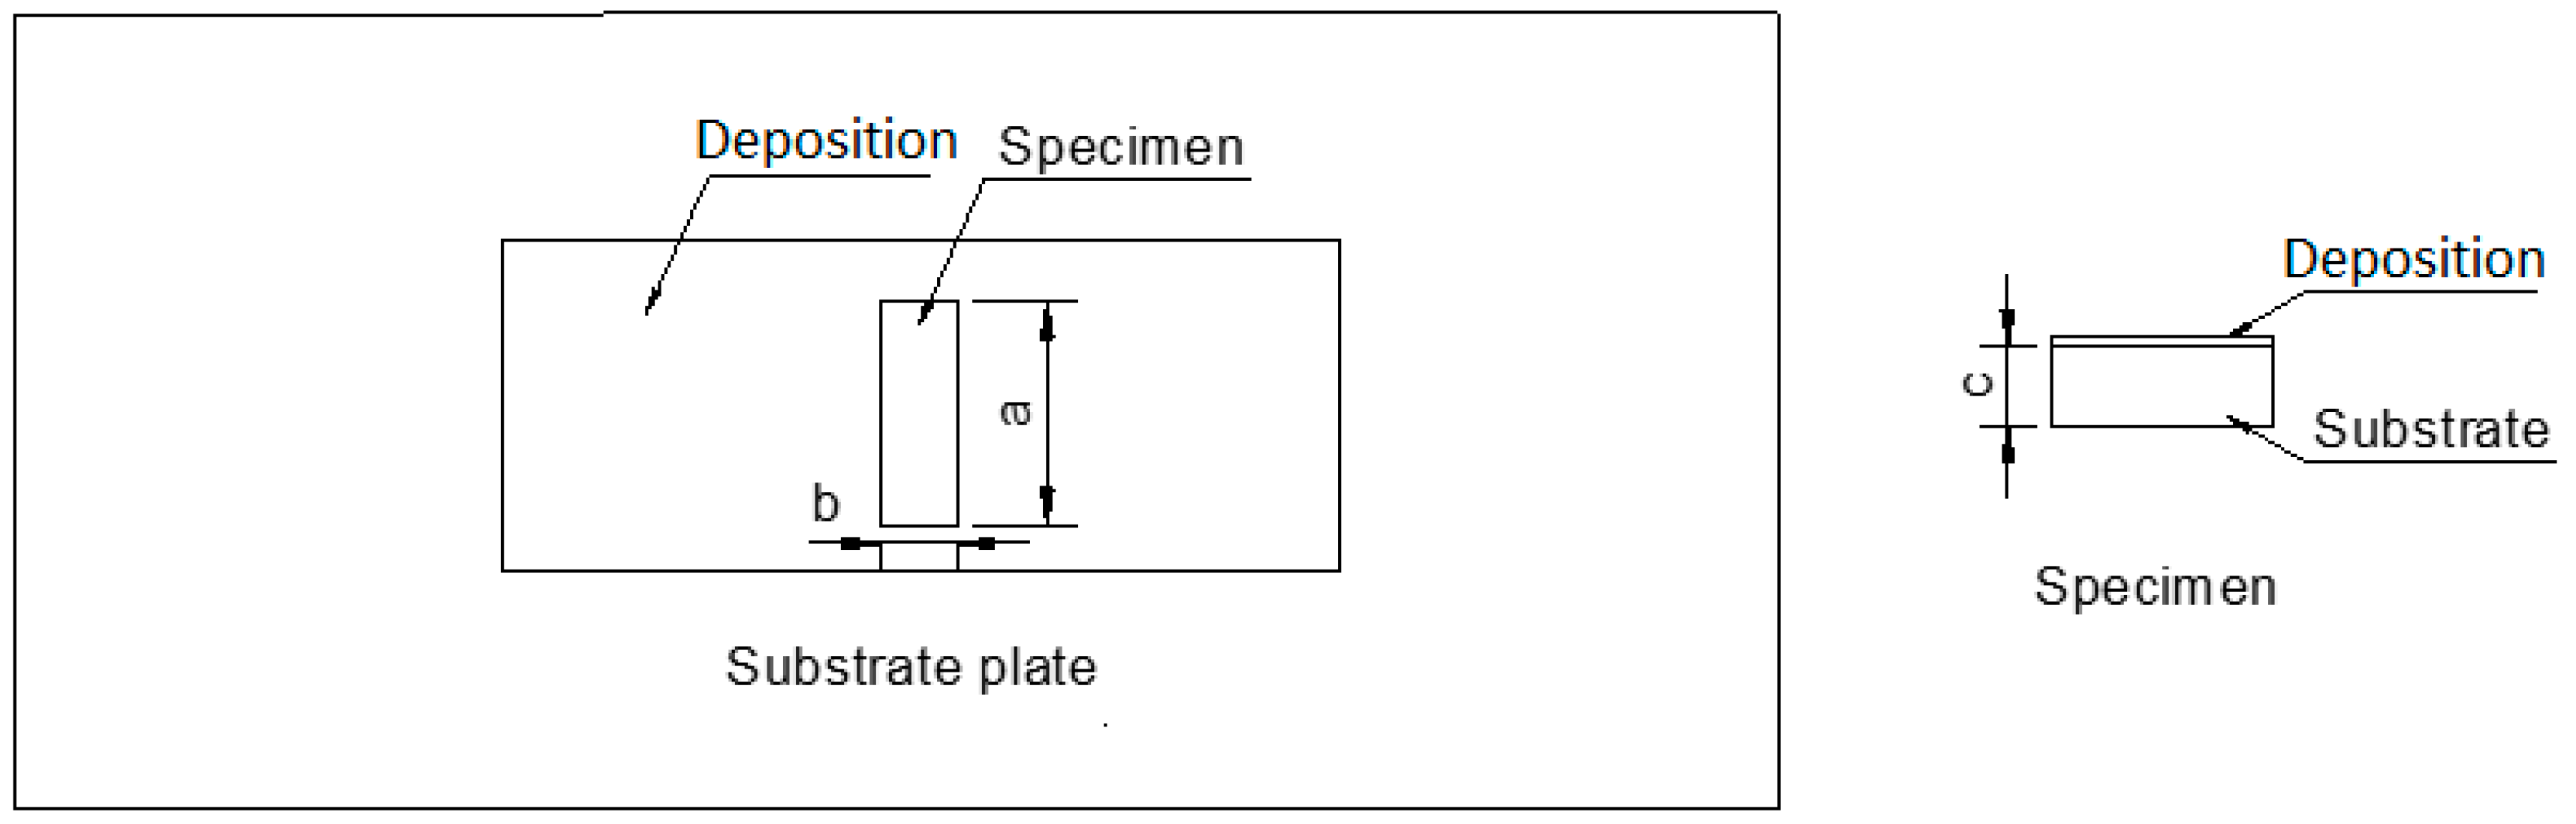
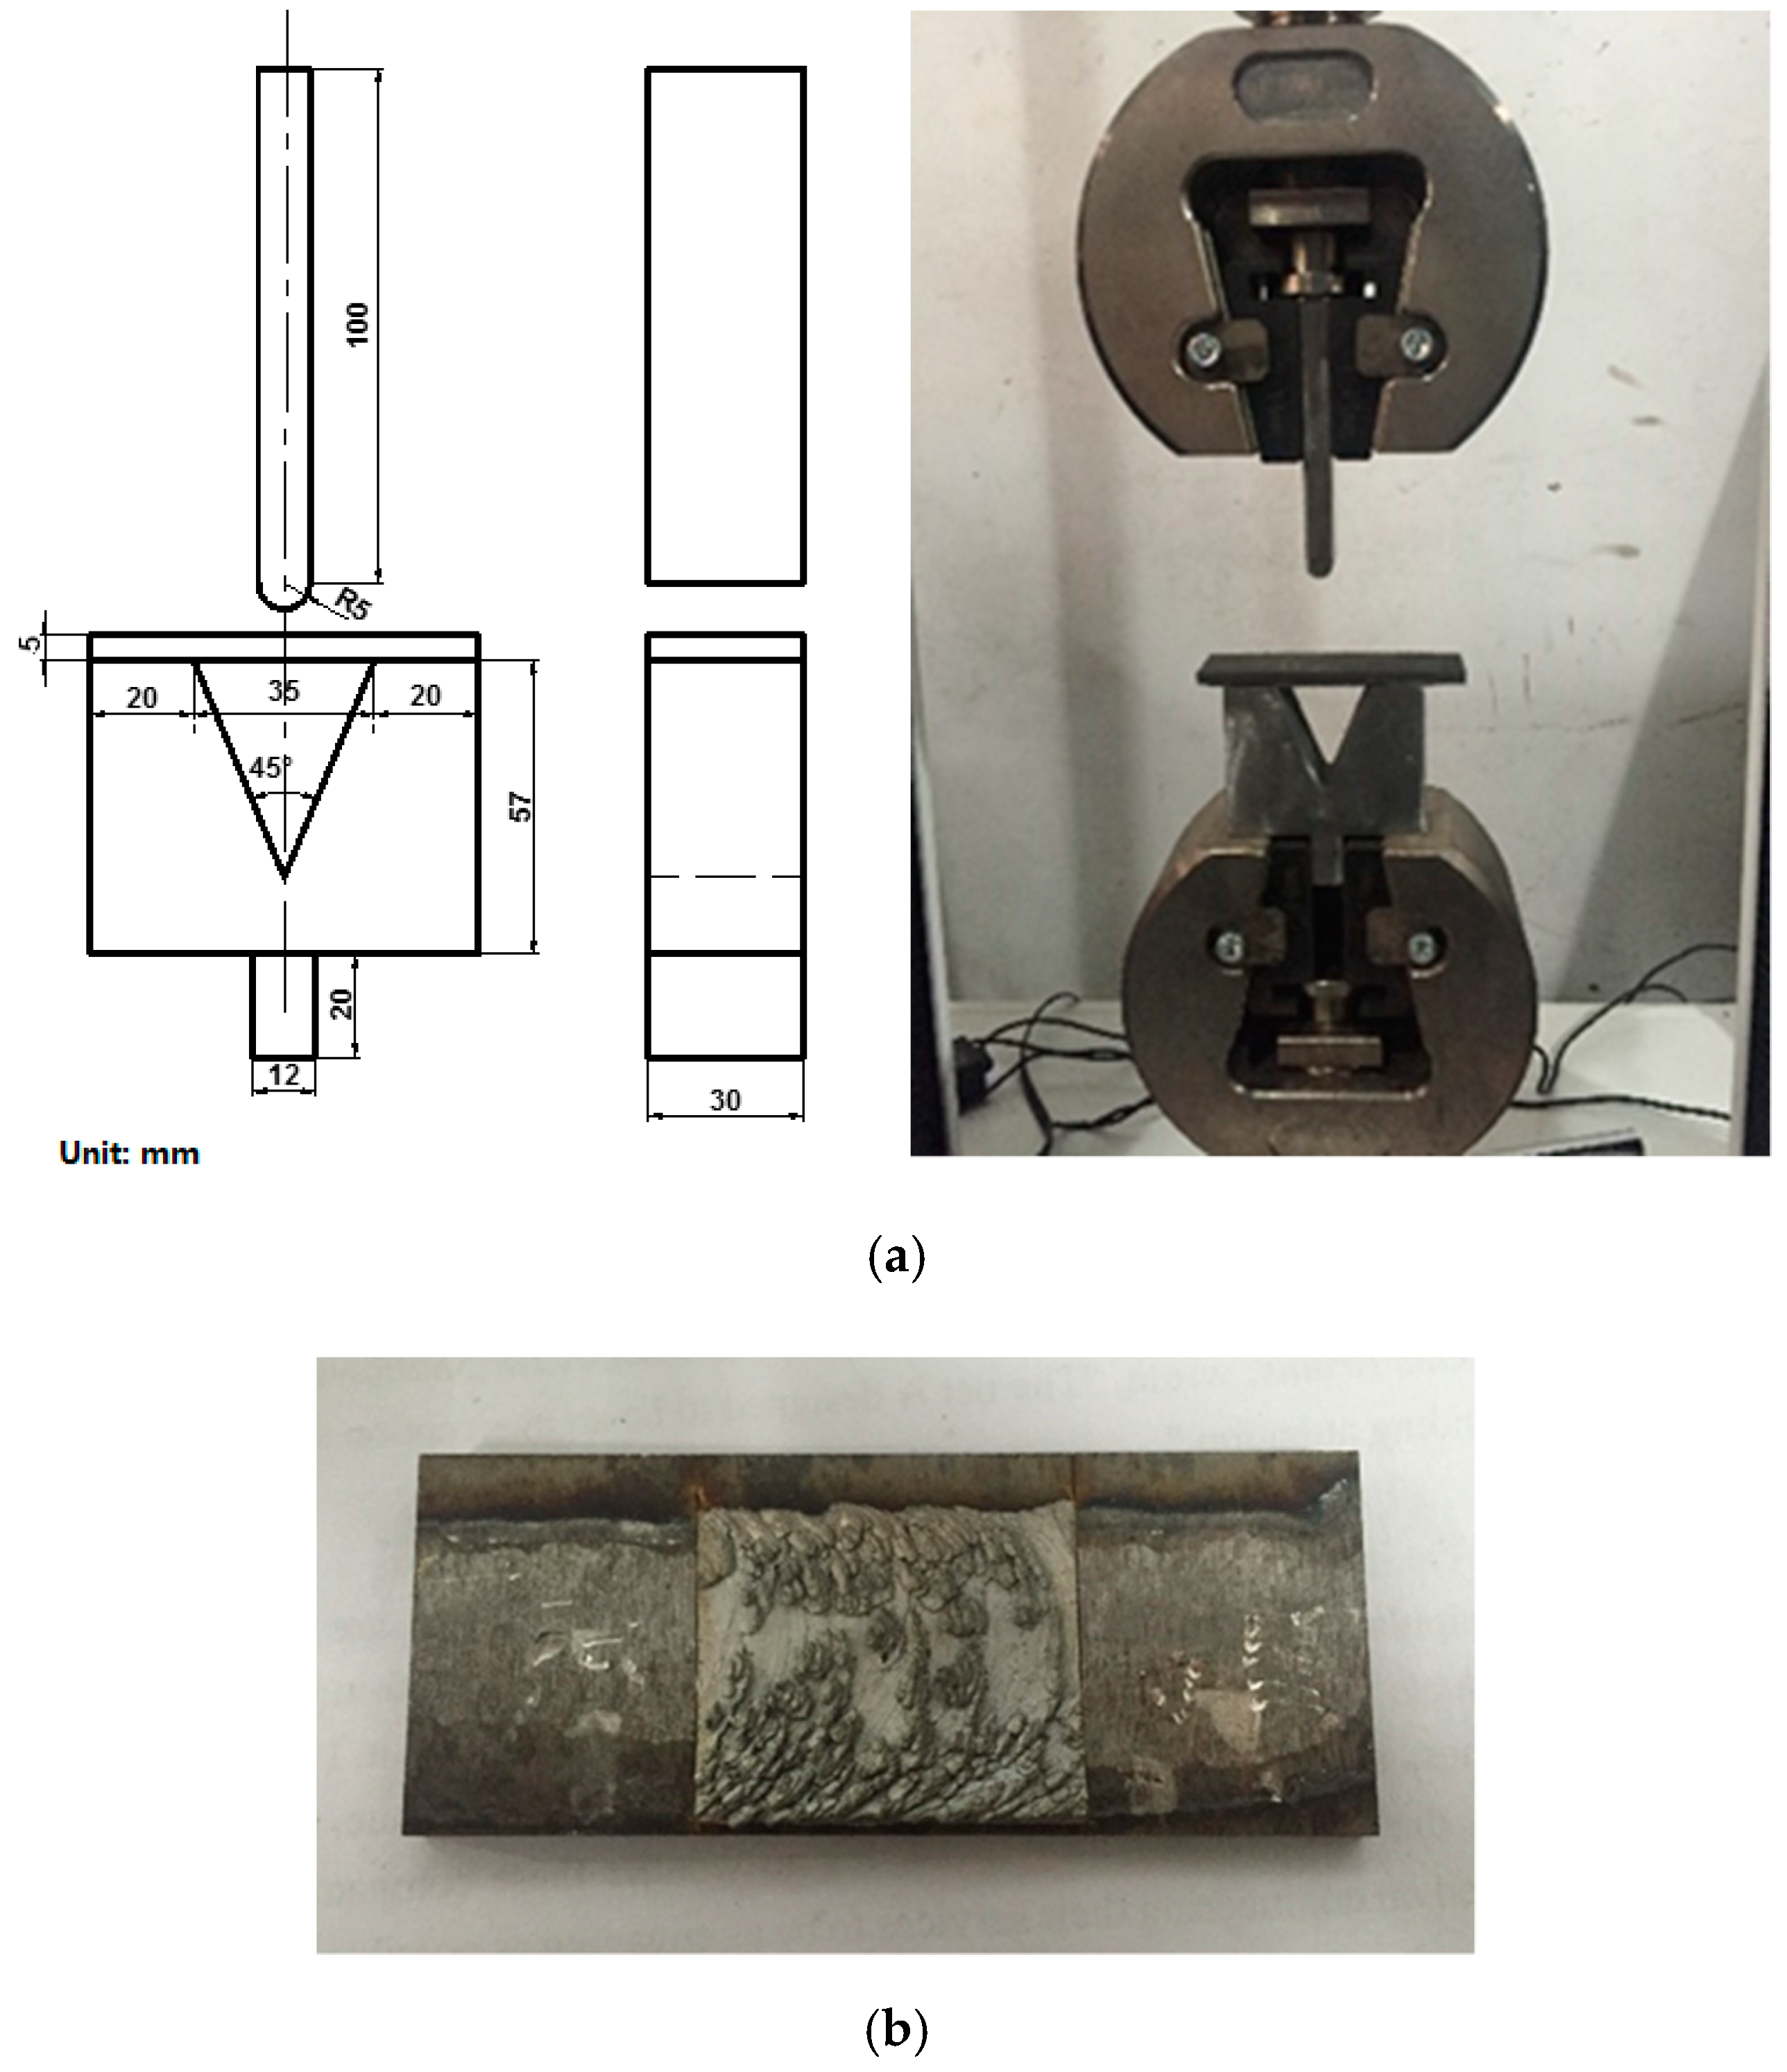
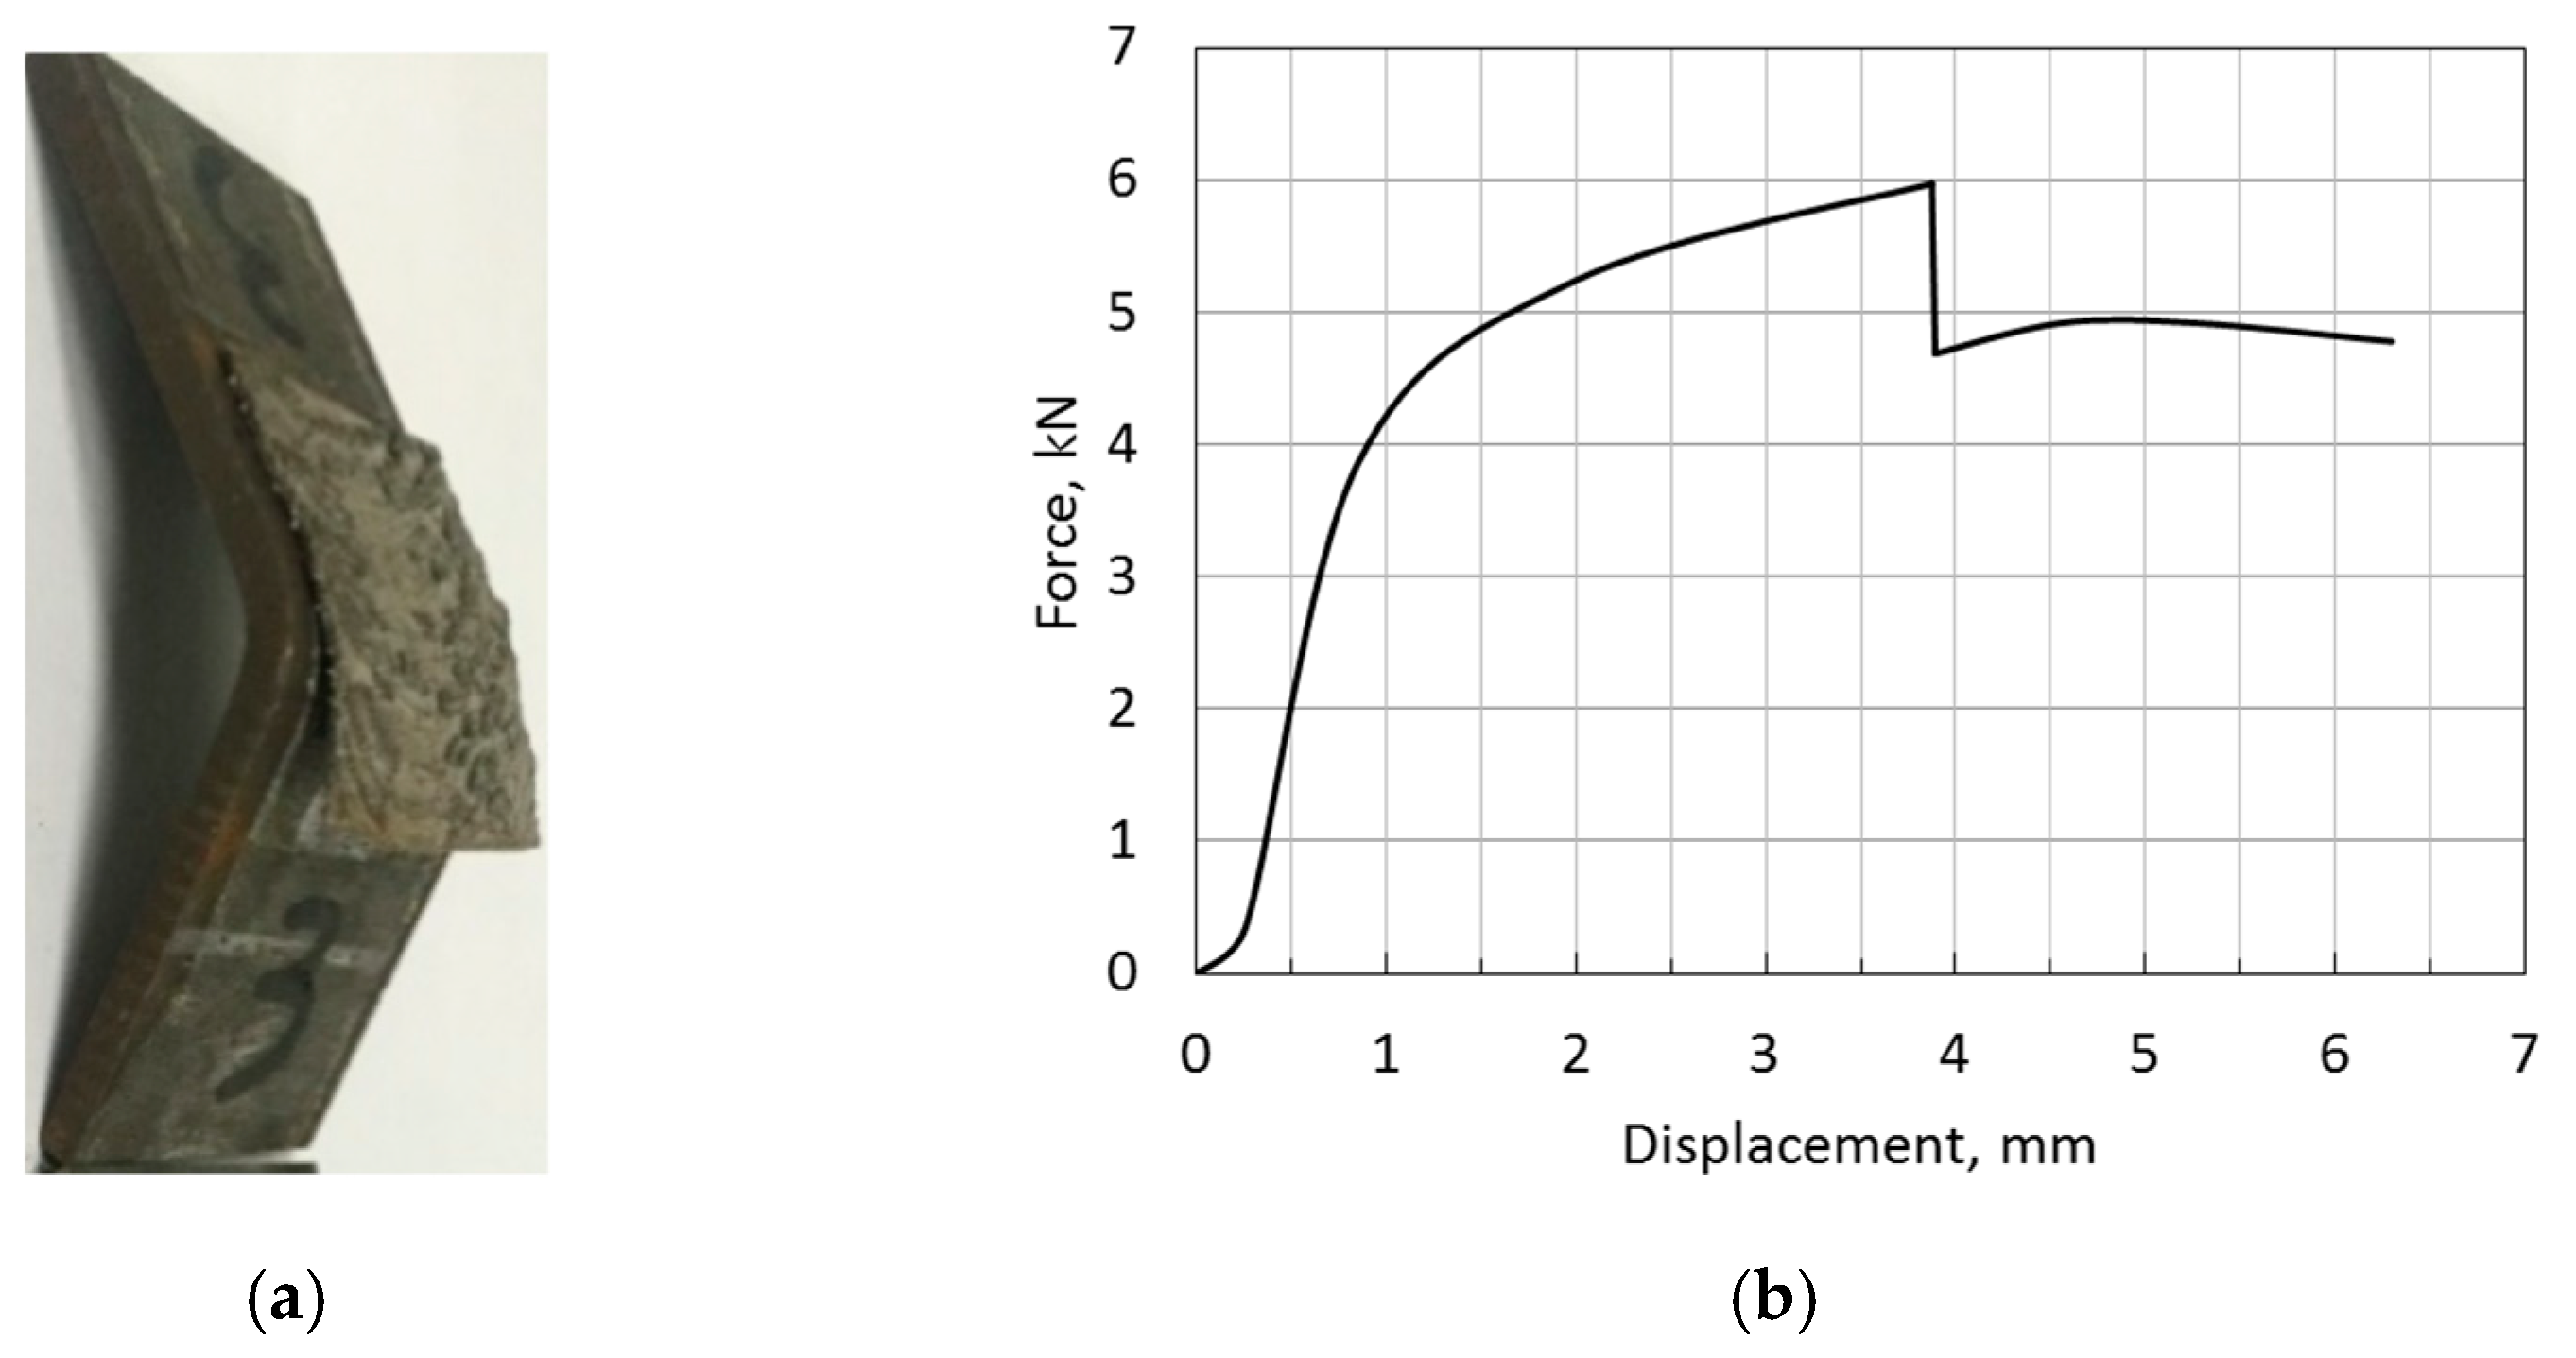
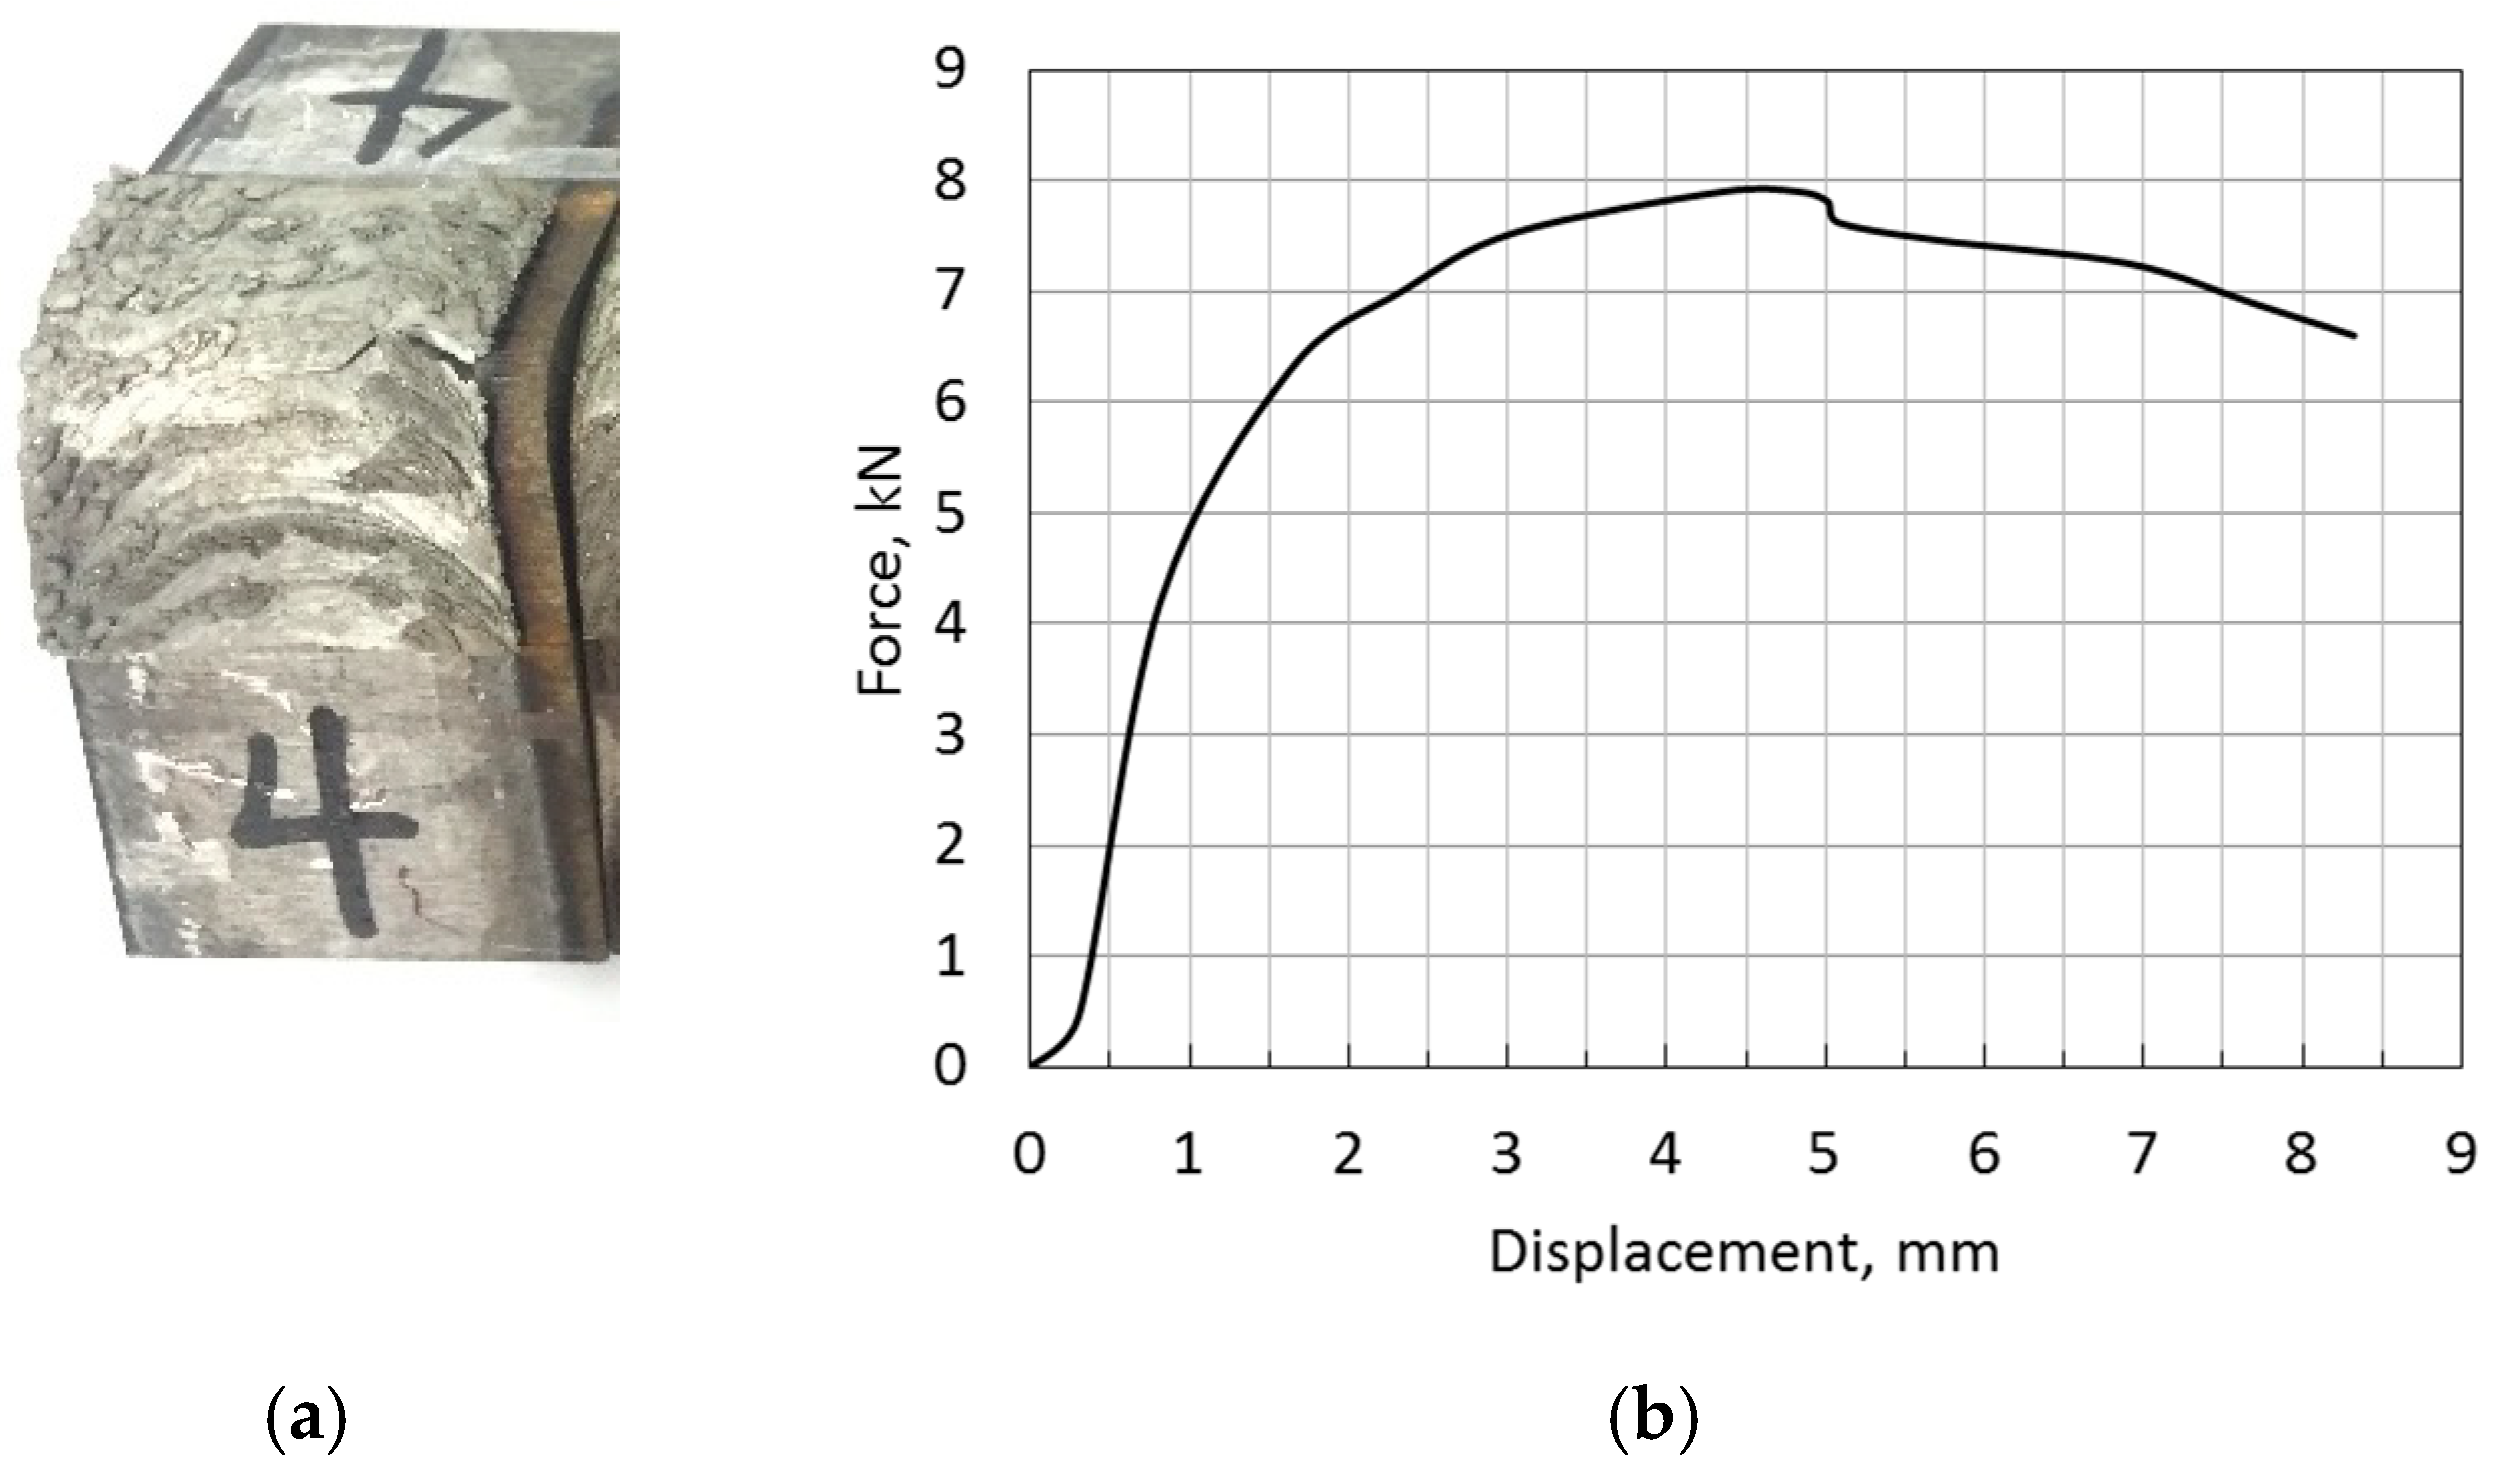
Scanning electron microscopy (SEM) was utilized to obtain further information about the surface topography and composition of the sample. The images for specimen 3 at the center and retreating side of the interface are shown in Figure 17a,b, respectively. In the central region, the aluminium was found to be in close contact with the steel substrate. The thickness of the bonding interface was smaller and smoother. However, in the outer sides of the interface, a greater mechanically interacting zone was produced. Gaps or cracks were identified in the interface.
To further investigate the composition of the interface, electron dispersive X-ray spectroscopy (EDS) was performed to scan the sample. The graph of the line scanning across the interface from AA5083 to DH36 is shown in Figure 18a. Element contents for Al and Fe were plotted in Figure 18b,c, respectively. Iron was found in the AA5083 rod close to the interface, indicating elemental diffusion of Fe to AA5083. Materials from the rod and steel substrate were mixed in the interface, since all the above four elements were observed in the interface layer of the material. The element Al content dropped sharply in the whiter region, and the chemical composition was different from those of AA5083 and DH36, revealing that a metallic compound might be produced. The weight percent, wt % and atomic percent, at % for point A in Figure 19 are tabulated in Table 5. The focus was on Fe and Al, as the contents of Mg and Mn were much lower in the white particle. Referring to Fe–Al alloy phase diagram [17], the metallic compound FeAl3 corresponds to Al at. 76.62%.
In the central region of the deposition interface, the element details at point B in the vicinity of the interface on the AA5083 side were also analyzed, as shown in Figure 20. The composition of the main elements is provided in Table 5. Similar to point A, the intermetallic compound FeAl3 formed. Clearly, elemental diffusion of Fe took place from the steel to the aluminium alloy as a result of the thermo-mechanical effect during FS. EDS analysis was also performed for specimens 4 and 9; FeAl3 was detected in the interfaces; however, apart from FeAl3, the intermetallic compound FeAl existed in specimen 4.

3.5. Bond Strength

The depositions on samples 1, 2, 6 and 9 were detached when preparing bending specimens, and sample 7 revealed a groove defect in the middle of the deposition. Hence, bond strength tests were only carried out for samples 3 and 4. The deposition on sample 3 bent with the steel as the die moved downward, and, suddenly, half of the deposition separated from the substrate before damages (cracks) occurred in the deposition, as shown in Figure 21a. From the force-displacement curve, Figure 21b, a noticeable maximum point can be identified, where a sharp drop in force happened. However, for sample 4 in Figure 22, no sudden separation was found during the test. A crack gradually developed at the edge of the depositions on the retreating side, corresponding to a relatively smoother decrease in force.
Rotation speed and travel speed remained constant for samples 1, 2 and 3 during the FS process; the highest feed rate was used for sample 3, indicating that the bond strength increased with the increase of downward pressure exerted by the rod. Comparing samples 4, 2 and 6, lower travel speed led to higher bond strength. For samples 7, 2 and 9, sample 9, which had the highest rotation speed, had the highest bonding strength. Higher rotation speed generated more heat and higher temperature in the deposition zone. Therefore, high bonding strength could be achieved by high contact pressure and temperature in the interface.

4. Conclusions

The FS process parameters play a key role in generating a high-quality depositions. The increase in feed rate led to higher deposition bonding strength and lower deposition roughness. Increasing the travel speed reduced the deposition thickness and bonding strength but increased surface quality. With the increase of rotation speed, the deposition width and surface quality decreased, while the bonding strength increased.
With the chosen process parameters, a good deposition interface was created. As a result of thermomechanical effects, elements from both aluminium alloy and steel substrate were found in the interface layer materials. Elemental diffusion of Fe to the AA5083 side of the interface was detected, and metallic compound FeAl3 was produced.

Author Contributions

Conceptualization, H.L., A.G. and A.T.; methodology, A.T.; formal analysis, W.Q.; investigation, H.L. and W.Q.; resources, H.L. and A.G.; data curation, W.Q.; writing—original draft preparation, H.L. and W.Q.; writing—review and editing, H.L., A.G. and A.T.; supervision, H.L.; project administration, H.L.; funding acquisition, H.L.

Funding

This research was supported by the National Natural Science Foundation of China under Grant No. 51605444.

Acknowledgments

Thanks to Zhejiang Sc-Tech University for providing the APC fee.

Conflicts of Interest

The authors declare no conflict of interest.

References

  1. Klopstock, H.; Neelands, A.R. An Improved Method of Joining or Welding Metals. UK Patent No. GB572789, 17 October 1941. [Google Scholar]
  2. Nicholas, E.D. Friction processing technologies. Weld. World 2003, 47, 2–9. [Google Scholar] [CrossRef]
  3. Dunkerton, S.B.; Thomas, W.M. Repair by Friction Welding. In Proceedings of the TWI Repair and Reclamation Conference, London, UK, 24–25 September 1984. [Google Scholar]
  4. Ravisekhar, S.; Das, V.C.; Govardhan, D. Friction Surfaced Deposits for Industrial Applications. Mater. Today Proc. 2017, 4, 3796–3801. [Google Scholar] [CrossRef]
  5. Gandra, J.; Krohn, H.; Miranda, R.M.; Vilaça, P.; Quintino, L.; dos Santos, J.F. Friction surfacing—A review. J. Mater. Process. Technol. 2014, 214, 1062–1093. [Google Scholar] [CrossRef] [Green Version]
  6. Bedford, G.M.; Vitanov, V.I.; Voutchkov, I.I. On the thermo-mechanical events during friction surfacing of high speed steels. Surf. Coat. Technol. 2001, 141, 34–39. [Google Scholar] [CrossRef] [Green Version]
  7. Thomas, W.M.; Nicholas, E.D.; Watts, E.R.; Staines, D.G. Friction based welding technology for aluminium. Mater. Sci. Forum 2002, 396, 1543–1548. [Google Scholar] [CrossRef]
  8. Padhy, G.K.; Wu, C.S.; Gao, S. Friction stir based welding and processing technologies-processes, parameters, microstructures and applications: A review. J. Mater. Sci. Technol. 2018, 34, 1–38. [Google Scholar] [CrossRef]
  9. Gandra, J.; Miranda, R.M.; Vilaça, P. Performance analysis of friction surfacing. J. Mater. Process. Technol. 2012, 212, 1676–1686. [Google Scholar] [CrossRef]
  10. Shinoda, T.; Li, J.Q.; Katoh, Y.; Yashiro, T. Effect of process parameters during friction coating on properties of non-dilution coating layers. Surf. Eng. 1998, 14, 211–216. [Google Scholar] [CrossRef]
  11. Sahoo, D.K.; Mohanty, B.S. Performance analysis of friction surfacing between two dissimilar materials. Int. J. Innov. Eng. Technol. 2016, 7, 47–58. [Google Scholar]
  12. Guo, D.; Kwok, C.T.; Chan, S.L.I. Spindle speed in friction surfacing of 316L stainless steel—How it affects the microstructure, hardness and pitting corrosion resistance. Surf. Coat. Technol. 2019, 361, 324–341. [Google Scholar] [CrossRef]
  13. Vitanov, V.I.; Voutchkov, I.I.; Bedford, G.M. Decision support system to optimise the Frictec (friction surfacing) process. J. Mater. Process. Technol. 2000, 107, 236–242. [Google Scholar] [CrossRef]
  14. Murugan, B.K.; Balusamy, V.; Padmanaban, R. Process parameter effects in the friction surfacing of MONEL over mild steel. In Proceedings of the IEEE International Conference on Intelligent Systems & Control, Coimbatore, India, 5–6 January 2017. [Google Scholar]
  15. Voutchkov, I.; Jaworski, B.; Vitanov, V.I.; Bedford, G.M. An integrated approach to friction surfacing process optimisation. Surf. Coat. Technol. 2001, 141, 26–33. [Google Scholar] [CrossRef] [Green Version]
  16. Rafi, H.K.; Ram, G.D.J.; Phanikumar, G.; Prasad Rao, K. Friction surfaced tool steel (H13) coatings on low carbon steel: A study on the effects of process parameters on coating characteristics and integrity. Surf. Coat. Technol. 2010, 205, 232–242. [Google Scholar] [CrossRef]
  17. Rafi, H.K.; Ram, G.D.J.; Phanikumar, G.; Prasad Rao, K. Friction surfacing of austenitic stainless steel on low carbon steel: Studies on the effects of traverse speed. In Proceedings of the World Congress on Engineering, London, UK, 30 June–2 July 2010. [Google Scholar]
  18. Tokisue, H.; Katoh, K.; Asahina, T.; Usiyama, T. Mechanical properties of 5052/2017 dissimilar aluminum alloys deposit by friction surfacing. Mater. Trans. 2006, 47, 874–882. [Google Scholar] [CrossRef]
  19. E290-14. Standard Test Methods for Bend Testing of Material for Ductility; ASTM International: West Conshohocken, PA, USA, 2014. [Google Scholar]
  20. Vilaça, P.; Gandra, J.; Vidal, C. Linear Friction Based Processing Technologies for Aluminum Alloys: Surfacing, Stir Welding and Stir Channeling. In Alum. Aluminium Alloys—New Trends in Fabrication and Applications; Ahmad, Z., Ed.; InTech: London, UK, 2012; pp. 159–197. [Google Scholar]
Figure 1. Illustration of the friction surfacing process (AS: Advancing side, RS: Retreating side).
Metals 09 00479 g001
Figure 2. Friction stir welding equipment.
Metals 09 00479 g002
Figure 3. Position of the thermocouples (mm).
Metals 09 00479 g003
Figure 4. Metallographic specimens.
Metals 09 00479 g004
Figure 5. Bending test: (a) test setup; (b) bending specimen.
Metals 09 00479 g005
Figure 6. Deposition morphology at different process parameters, i.e., rotation speed (rpm), travel speed (mm/min), feed rate (mm/min): (a) 900, 80, 15; (b) 900, 80, 20; (c) 900, 80, 25; (d) 900, 60, 20; (e) 900, 100, 20; (f) 600, 80, 20; (g) 1200, 80, 20.
Metals 09 00479 g006aMetals 09 00479 g006b
Figure 7. Temperature measurements at CH03 and CH04.
Metals 09 00479 g007
Figure 8. Infrared thermal images: (a) V = 60 mm/min; (b) V = 100 mm/min.
Metals 09 00479 g008aMetals 09 00479 g008b
Figure 9. Temperature evolution at point CH01: (a) S = 900 rpm, F = 20 mm/min; (b) S = 900 rpm, V = 80 mm/min; (c) V = 80 mm/min, F = 20 mm/min.
Metals 09 00479 g009
Figure 10. Metallographic specimen.
Metals 09 00479 g010
Figure 11. Microstructure of (a) AA5083 and (b) DH36.
Metals 09 00479 g011
Figure 12. Deposition microstructures for specimen No. 3: (a) middle (b) retreating side.
Metals 09 00479 g012
Figure 13. Deposition microstructures for specimen No. 4: (a) middle (b) retreating side.
Metals 09 00479 g013
Figure 14. Deposition microstructures for specimen No. 9: (a) middle (b) retreating side.
Metals 09 00479 g014
Figure 15. Deformed shape of AA5083 rod. (a) front view; (b) bottom view; (c) cross-section view.
Metals 09 00479 g015
Figure 16. Rod microstructure in (a) region A and (b) region B.
Metals 09 00479 g016
Figure 17. Scanning electron microscopy (SEM) images for the deposition interface: (a) central region and (b) retreating side.
Metals 09 00479 g017
Figure 18. Graphs of line scanning in electron dispersive X-ray spectroscopy (EDS) analysis: (a) position of line scanning, (b) Al distribution, (c) Fe distribution, (d) C distribution and (e) Mg distribution.
Metals 09 00479 g018aMetals 09 00479 g018b
Figure 19. EDS analysis at point A. (a) SEM image; (b) Spectrum.
Metals 09 00479 g019
Figure 20. EDS analysis at point B. (a) SEM image; (b) Spectrum.
Metals 09 00479 g020
Figure 21. Bending test for sample 3: (a) sample; (b) force-displacement curve.
Metals 09 00479 g021
Figure 22. Bending test for sample 4: (a) sample; (b) force-displacement curve.
Metals 09 00479 g022
Table 1. Chemical composition (in wt %) of the AA5083 Al alloy.
SiMgCuMnZnTiCrFe
0.984.00.100.700.250.150.100.40
Table 2. Chemical composition (in wt %) of the DH36 steel.
CSiMnPSNbAlN
0.110.371.480.0140.0040.020.020.002
Table 3. Summary of process parameters.
Test No.Rotation Speed (rpm)Travel Speed (mm/min)Feed Rate (mm/min)
19008015
29008020
39008025
49006020
59008020
690010020
76008020
89008020
912008020
Table 4. Deposition width and thickness.
Test No.Width of Deposition (mm)Thickness of Deposition (mm)
126.71
226.51
325.51
426.51.1
625.61
731.42.2
923.01
Table 5. Elements in the interface layer.
ElementWeight Percent, wt %Atomic Percent, at %
Point AAl61.9076.62
Fe36.5121.84
others1.59-
Point BAl62.3277.11
Fe37.2122.24
others0.47-

