Article

Kinetics of Phosphorus Transfer during Industrial Electroslag Remelting of G20CrNi2Mo Bearing Steel

State Key Laboratory of Advanced Metallurgy, University of Science and Technology Beijing, Beijing 100083, China
*
Author to whom correspondence should be addressed.
Metals 2019, 9(4), 467; https://doi.org/10.3390/met9040467
Submission received: 13 March 2019 / Revised: 16 April 2019 / Accepted: 19 April 2019 / Published: 22 April 2019

Abstract

:
Phosphorus is undesirable in steel for it greatly decreases ductility and causes embrittlement in most cases. The kinetic behavior of phosphorus transfer was investigated during electroslag remelting (ESR) of G20CrNi2Mo bearing steel. Four heat treatments were carried out using an industrial furnace with a capacity to refine 2400 kg ingot. It was found the P content in the four ingots were all higher than that in the electrodes, indicating rephosphorization occurs during ESR. A kinetic model based on film and penetration theory was developed to elucidate the variation of phosphorus from metal film to droplet and metal pool. The model indicates that the rate-determining step of phosphorus transfer is at the slag side. Rephosphorization mainly occurs in the metal film and falling droplet. In addition, the effect of P in the slag and electrode, as well as the temperature of the slag pool on the P content in the metal pool were discussed. In order to achieve a low-P ingot of no more than 0.015%, the corresponding maximum P content in slag under the condition of a certain P content in the electrode was proposed.

1. Introduction

G20CrNi2Mo is one of the typical carburized bearing steels, widely used in the bearings of heavy-duty locomotives in China due to its good surface hardness, high contact fatigue strength, and mechanical properties [1]. With the railway speed-up, a higher requirement for superior quality of G20CrNi2Mo has been required in recent years. During traditional secondary refining, large-size inclusions are occasionally formed because of the technology instability [2], which exerts a detrimental effect on the rolling contact fatigue life. Based on this, electroslag remelting (ESR) is utilized to produce G20CrNi2Mo in China, due to its excellent abilities of inclusion removal and solidification structure improvement [3,4,5].
Phosphorus is undesirable in steel for it greatly decreases ductility and causes embrittlement [6,7]. Lowering phosphorus content has become a critical topic for steelmakers. Removal of phosphorus is thermodynamically favored at relatively low temperature, high oxygen potential, and high slag basicity [8]. However, these conditions are not applicable during electroslag remelting of bearing steel. On one hand, the oxygen potential of slag should be controlled as low as possible in order to achieve a low-oxygen ingot; on the other hand, the temperature of slag pool is usually very high, even more than 2073 K (1800 °C). In this case, dephosphorization becomes rather difficult. Sometimes, rephosphorization occurs. Since ESR is the last step in controlling the steel cleanliness, a thorough understanding of phosphorus behavior is of great necessity for producing low-phosphorus steel.
Thermodynamics of dephosphorization have been of interest to researchers and there are numerous studies to determine phosphorus partition ratios and phosphate capacity [9,10,11,12,13,14,15,16,17]. However, it has been observed that dephosphorization may not be able to reach complete equilibrium in a basic oxygen furnace or electric arc furnace, mainly due to liquid slag formation, and time constraint. Therefore, kinetic analyses are necessary to elucidate the phosphorus behavior. Several studies have been conducted on dephosphorization kinetics assuming equilibrium of the reactions at the slag-metal interface [18,19,20,21,22]. It has been well established that dephosphorization is controlled by mass transfer in the metal, slag, or both simultaneously. Monaghan et al. [20] proposed that the rate-determining step is the mass transfer in slag, while Mori et al. [21] indicated that the rate of dephosphorization is under mixed control by mass transport in both the slag and metal phase. More recently, Manning [22] showed that the mass transfer parameter (A*ko) decreased as the reaction proceeded and appeared to be a function of interfacial tension. However, most studies have mentioned the above focus on the kinetic behavior of phosphorus during basic oxygen steelmaking. The various slag-metal interfaces during ESR make the mass transfer behavior of phosphorus become more complicated. To the best of the authors’ knowledge, related kinetic studies have been seldom reported.
The current work is focused on investigating the phosphorus behavior during ESR from kinetics. Four industrial heats were conducted using an industrial ESR furnace. Then, a kinetic model on the basis of mass transfer theory was developed to elucidate the variation of phosphorus from electrode tip to droplet and metal pool. This practice is expected to provide some guidance for commercial ESR production of low-phosphorus bearing steel.

2. Methodology

2.1. Experimental Procedure

Carburized bearing steel G20CrNi2Mo with Fe-0.20C-0.32Si-0.60Mn-0.50 Cr-1.80Ni-0.25Mo in mass percent was produced by the process of 70-ton electric arc furnace (EAF) melting → 70-ton ladle furnace (LF) refining → 70-ton vacuum degassing (VD) refining → continuous casting. Four different heat treatments, i.e., A, B, C, and D, were carried out using a furnace with a capacity to refine 2400 kg ingot, as schematically shown in Figure 1.
The water-cooled copper mold had a height of 2000 mm and an inner diameter of 470 mm. Due to the limited plant height, two 2200 × 250 × 280 mm3 billets were utilized as the consumable electrodes for each heat treatment. Before the experiments, the iron oxide scale on the electrode surface was removed mechanically. About 75 kg slag was prepared by mixing CaF2, Al2O3, CaO, and MgO. High-purity argon with a flow of 100–140 L/min was introduced at the start into the mold to isolate the air from outside before arcing. After the mixed slag was added into the mold, a graphite electrode was used for arcing while the slagging process lasted about 30 minutes. Thereafter, the consumable electrode was switched into the mold. Thirty minutes later, one slag sample was taken from the slag pool for each heat treatment.
A portable infrared thermometer (Produced by B&S instrument corporation, Canada) with the range of 473–2673 K (200–2400 °C) was used to measure the surface temperature of the slag pool. Three measurements were taken and the highest temperature taken. In addition, a voltmeter was used to detect the secondary voltage of the furnace mouth. Table 1 shows the related refining parameters at the beginning of the four heat treatments. It can be seen that within a specified time interval, the parameters do not vary much.
After the experiments, one 20-mm-high slice was cut away 70 mm from the bottom of each ingot. Then, three steel cuttings samples were cut from the center, 1/2 the radius, and the edge of the slice for chemical analysis.

2.2. Chemical Analysis

Chemical analysis was performed at the National Analysis Center for Iron and Steel (NACIS), Beijing, China. Inductively coupled plasma atomic emission spectroscopy (ICP-AES) was used for the detection of Als, Si, Mn, and P in steel.
The contents of CaO, MgO, MnO, SiO2, Al2O3, and P in the slag were determined by wavelength dispersion X-ray fluorescence spectrometry while FeO was measured by the potassium dichromate volumetric method. The EDTA method was used for the determination of calcium fluoride.

3. Kinetic Analysis of Phosphorus Transfer

Table 2 lists the chemical compositions of slag at the beginning of refining. It can be seen that the FeO content in slag D is the highest, mainly due to the fact that the permeability of oxygen through molten slag obviously increases as the CaF2 content increases [23], thus enhancing the accumulation of iron oxide in the slag [24]. In addition, the contents of P in the four slags are all less than 0.020%.
Table 3 shows the chemical compositions of the electrode and ingots, from which the contents of P in ingots are all shown to be higher than that in the electrodes. Besides that, a certain extent of soluble Al (Als)-, Si- and Mn-oxidation occurs during ESR. Combining Table 2 and Table 3, it can be seen that the extent of Al-oxidation increases with increased FeO.
In order to better understand the rephosphorization mechanism, a kinetic model was developed based on the film and penetration theory.

3.1. Model Assumptions

(1) The temperature gradients within the slag-metal phases are assumed to be negligible.
(2) Three reaction sites, i.e., metal film-, droplet-, and metal pool-slag interface are considered in this model.
(3) The concentrations of components in the metal and slag are evenly distributed. The concentration difference only appears near the slag-metal interface based on film theory.
(4) The rephosphorization reaction occurs very quickly, and reaches thermodynamic equilibrium at the interface. The rate-determining step is both controlled by the diffusion of reactants and products through the boundary layer.

3.2. Mass Transfer Kinetics

The kinetic analysis is based on mass control across the slag-metal interface at which equilibrium is maintained. The rephosphorization reaction occurs, as given in Equation (1).
5 2 [ Fe ] + ( P O 4 3 ) = 2 [ P ] + 5 2 ( FeO ) + 3 2 ( O 2 )
Based on this reaction, the mass transfer of phosphorus includes the following steps:
(1) Mass transfer of PO43− from slag phase to the slag-metal interface;
(2) Fe reacts with PO43− very quickly, forming [P], (FeO), and (O2−) at the interface;
(3) Mass transfer of [P] and [O] from interface to metal, and (O2−) from interface to slag phase.
At each reaction site, the flux equation for phosphorus in metal and slag can be expressed as
d [ % P ] d t = A ρ m k P , m W m { [ % P ] [ % P ] * }
d ( % P ) d t = A ρ s k P , s W s { ( % P ) ( % P ) * }
where [%P] and (%P) are the phosphorus content in the metal and slag; the symbol * represents the interfacial concentration. A is the reaction area, cm2. Wm and Ws are the mass of metal and slag. ρ m and ρ s are the density of metal and slag, 7.0 g/cm3 (1873 K, calculated by ProCAST 2016) and 2.65 g/cm3. kP,m and kP,s are the mass transfer coefficients of phosphorus in metal and slag, cm/s, respectively.
It is assumed that phosphorus is conserved within the slag-metal systems. The flux of phosphorus out of the slag must equal that into the metal, which is given as
d [ % P ] d t W m + d ( % P ) d t W s = 0
Combining Equations (2)–(4), the interface concentration [%P]* as a function of bulk concentrations can be expressed as
[ % P ] * = ρ m k P , m [ % P ] + ρ s k P , s ( % P ) ρ m k P , m + ρ s k P , s L P
where LP is the equilibrium phosphorus partition ratio, as defined in [13]
log L P = ( % P ) * [ % P ] * = 21740 T 9.87 + 0.071 [ ( % CaO ) + ( % CaF 2 ) + 0.3 ( % MgO ) ] + 2.5 log [ % O ] *
where [%O]* is the equilibrium oxygen content at the slag-metal interface. The effect of CaF2 on LP in CaF2-containing slags should be considered, for the addition of CaF2 can increase the activity of FeO, thus enhancing the rate of the dephosphorization reaction [25,26].
If the expression of [%P]* is put back into the flux Equation (2) for phosphorus in the metal, then we get
d [ % P ] d t = A ρ m k P W m { [ % P ] ( % P ) L P }
1 k P = 1 k P , m + ρ m k P , s ρ s L P
In Equation (8), kP is the overall mass transfer coefficient, which includes the mass transfer of phosphorus in both metal and slag phases.
In order to determine the interface oxygen activity, the following reactions are considered to occur simultaneously at the various slag–metal interfaces [27].
[ Al ] + 1.5 [ O ] = ( Al O 1.5 )
log K Al O 1.5 = 32000 T 10.29
[ Si ] + 2 [ O ] = ( Si O 2 )
log K Si O 2 = 30410 T 11.59
[ Mn ] + [ O ] = ( MnO )
log K MnO = 15015 T 6.664
[ Fe ] + [ O ] = ( FeO )
log K FeO = 6320 T 2.734
where KAl, KSi, KMn, KFe are the equilibrium constants. The flux reaction rates for Al, Si, Mn, and oxygen can be expressed as follows
d [ % Al ] d t = A k Al W m { [ % Al ] ( % AlO 1.5 ) B Al ( a O * ) 1.5 }
d [ % Si ] d t = A k Si W m { [ % Si ] ( % SiO 2 ) B Si ( a O * ) 2 }
d [ % Mn ] d t = A k Mn W m { [ % Mn ] ( % MnO ) B Mn a O * }
d [ % O ] d t = A k O W m { ( % FeO ) B Fe a O * [ % O ] }
where kAl, kSi, kMn, and kO are the overall mass transfer coefficients, expressed as
1 k Al = 1 ρ m k Al , m + M AlO 1.5 B Al M Al ρ s ( a O * ) 1.5 k AlO 1.5
1 k Si = 1 ρ m k Si , m + M SiO 2 B Si M Si ρ s ( a O * ) 2 k SiO 2
1 k Mn = 1 ρ Mn k Mn , m + M MnO B Mn M Mn ρ s a O * k MnO
1 k O = 1 ρ O k O , m + M FeO B Fe M O ρ s a O * k FeO
where BM is the apparent constant, as given in
B M = ( % MO x ) * [ % M ] * ( a O * ) x = 1 γ MO x [ M MO x f M K MO x { ( % CaF 2 ) M CaF 2 + ( % M O x ) M MO x } ]
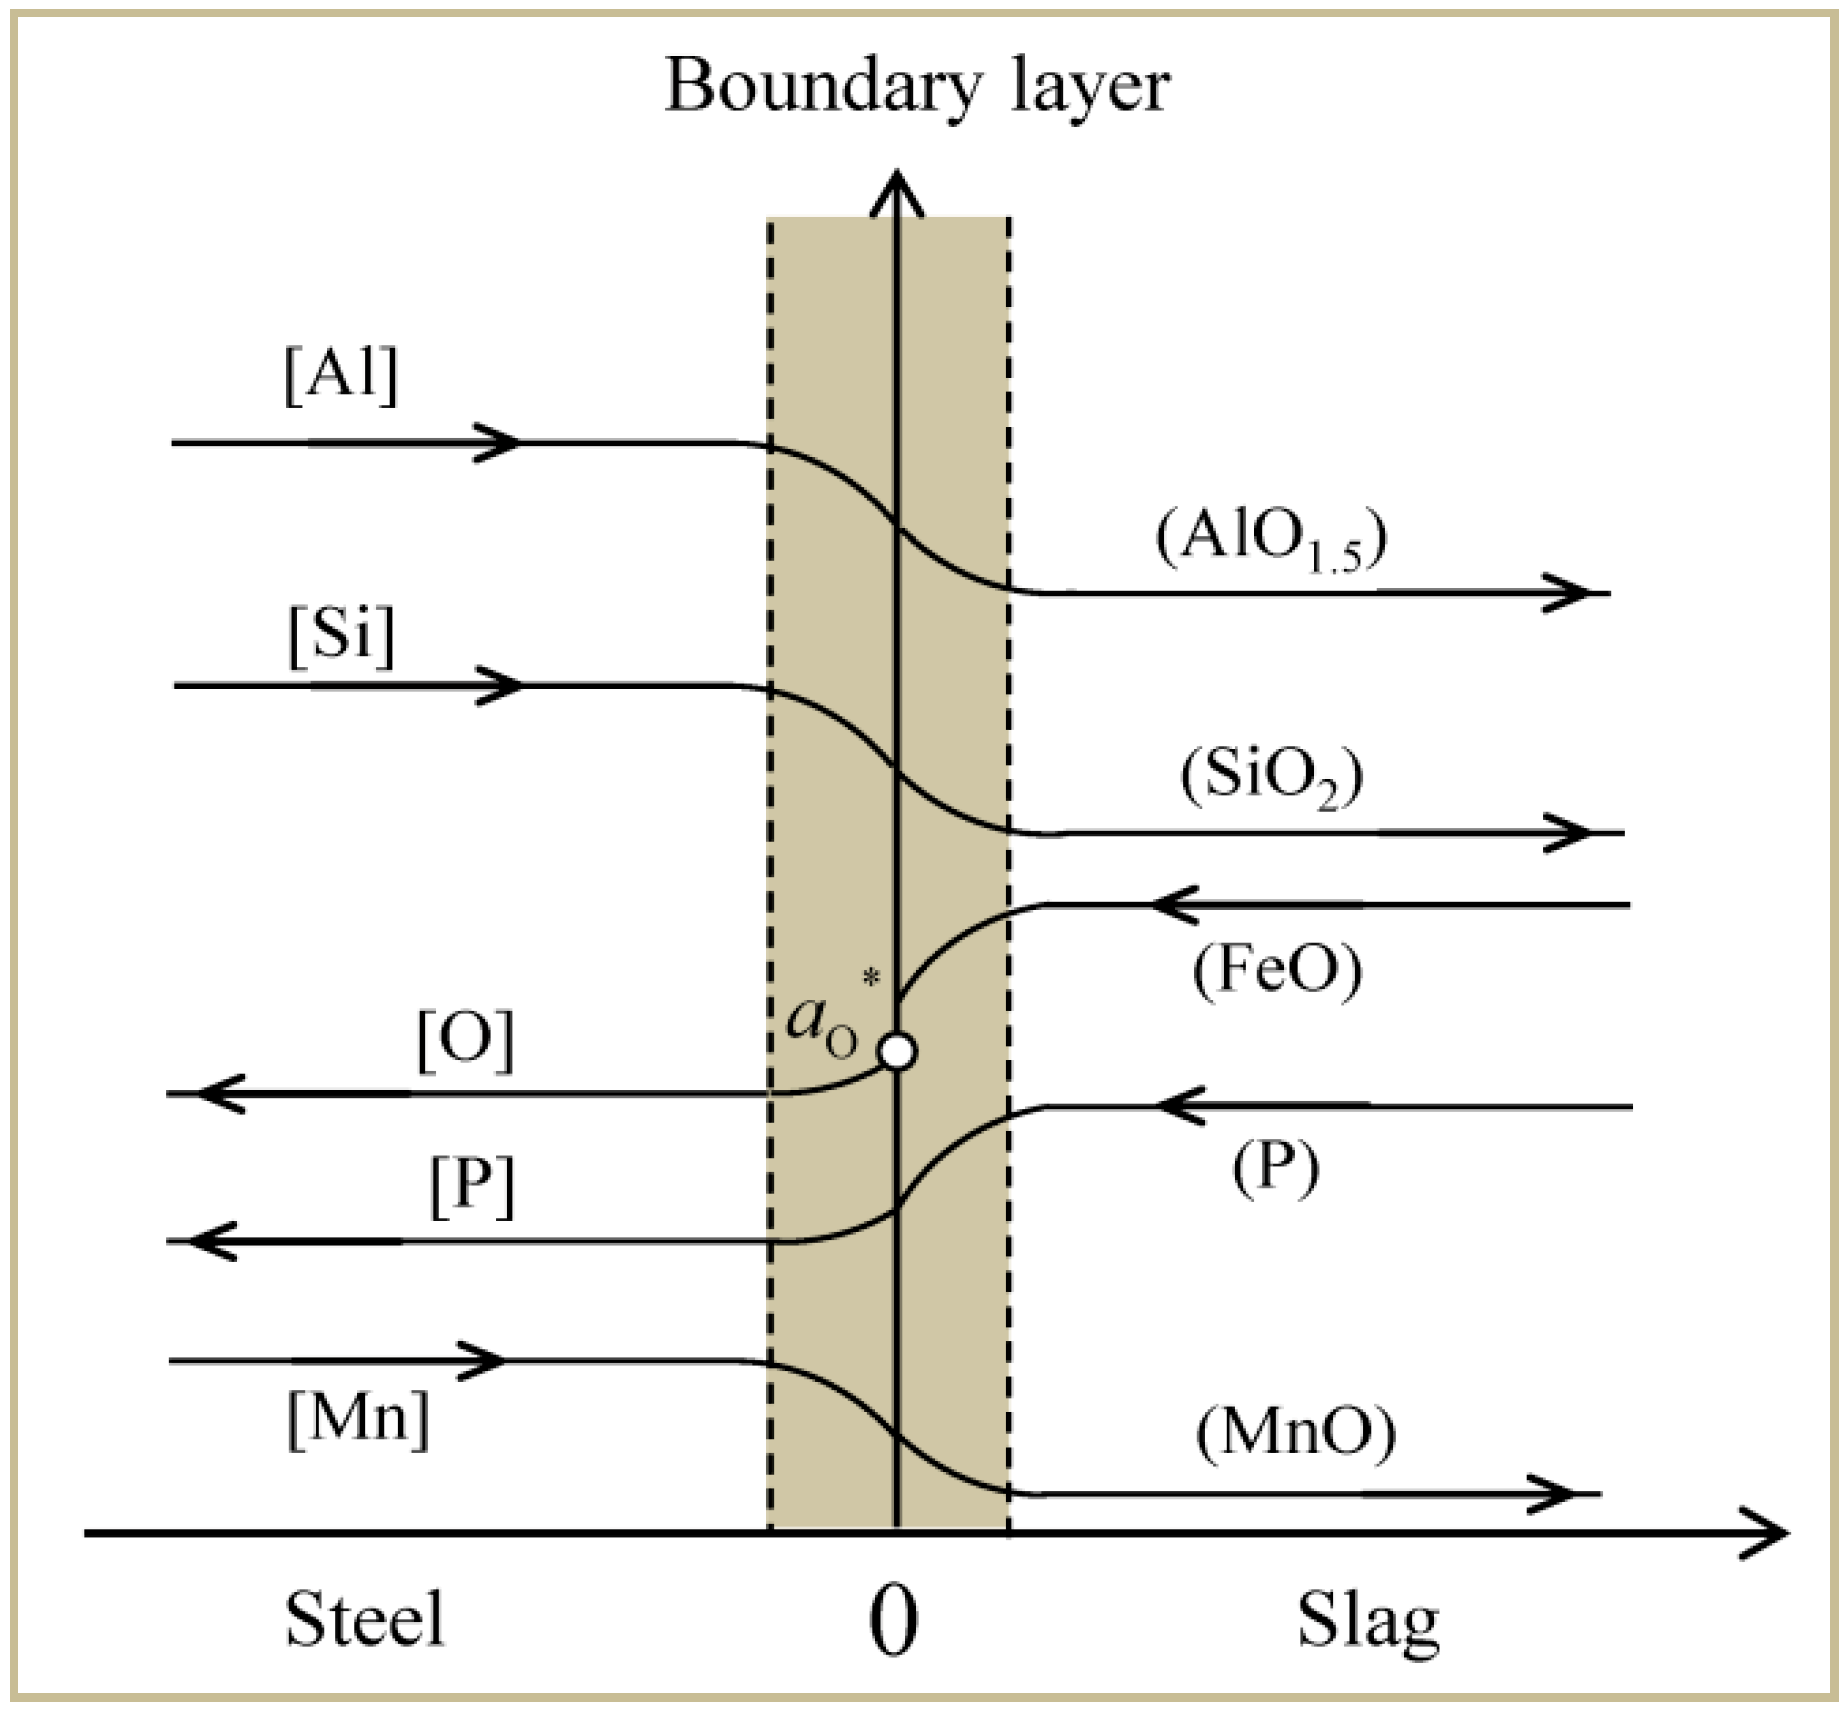
where fM is the Henry activity coefficient, γ MO x is the Raoult activity coefficient of the slag component, as illustrated in our previous work [27]. Figure 2 shows the schematic diagram of mass flux across the slag-metal interface.
To maintain electrical neutrality, the following equation of oxygen mass balance should be kept. The left-hand side of Equation (26) is the oxygen consumption and the right side hand is the oxygen supply rate. Mi is the molecular weight of the species in the steel. With Equation (26), the interface activity aO* can be obtained. Further, we can get the equilibrium phosphorus partition ratio LP with Equation (6).
1.5 M Al d [ % Al ] d t + 2 M Si d [ % Si ] d t + 1 M Mn d [ % Mn ] d t = 1 M O d [ % O ] d t + 5 2 M P d [ % P ] d t
At a certain time, the phosphorus variation in the metal and slag obey the mass balance
W m { [ % P ] [ % P ] 0 } + W s { ( % P ) ( % P ) 0 } = 0
where [%P]0 and (%P)0 are the initial phosphorus contents in the metal and slag. Equations (7), (8) and (27) can be combined and integrated so as to obtain an expression of phosphorus in the metal as a function of time.
A k P V m t = 1 1 + W m W s L P ln ( 1 + W m W s L P ) [ % P ] ( ( % P ) 0 L P + W m [ % P ] 0 W s L P ) [ % P ] 0 ( % P ) 0 L P
Equation (28) is applicable at all the slag/metal interfaces. When the phosphorus partition ratio and mass transfer coefficients are given, the variation of the phosphorus during the ESR is expected to be obtained.

3.3. Mass Transfer Coefficients

The mass transfer coefficient is a critical parameter influencing the rate of phosphorus transfer. As proposed by Fraser [28], penetration theory is used to calculate the mass transfer coefficient during ESR, which assumes the interface is continuously renewed by the eddy of fresh material from the bulk liquid, as given by
k i = 2 ( D i π t e ) 0.5
where Di is the diffusion coefficients of the species in the steel and slag, cm2/s, te is the time that an eddy is in contact with the interface. It is noted that the existing Di at high temperature are few and not very precise. Herein, the Di used in this study mainly refer to Ref. [29], in which the diffusion coefficients of species at different temperatures through line regression are calculated.

3.3.1. Mass Transfer Coefficient at Metal Film–Slag Interface

During the ESR process, the electrode tip is remelted layer by layer with the resistance heat of the molten slag, forming a thin (50–200 μm) metal film continuously. An expression for contact time on the metal film was derived by Etienne [30] with the following equation
t e = 3.35 ( 2 π cos θ 3 Q m ) 2 / 3 ( μ m g ρ m sin θ ) 1 / 3 ( R E cos θ ) 5 / 3
where θ is the cone angle of the electrode tip, Qm is the rate of volumetric melting, cm3/s. μm is the metal viscosity, 0.005 Pa/s. RE is the equivalent radius of the electrode. Due to the limited plant height, the first electrode was lifted before it completely remelted. The morphology of the electrode tip is shown in Figure 3. The electrode tip is nearly flat, with about fifteen droplets of diameter of 3 cm drip almost simultaneous just like a raindrop. Every droplet can be considered as a “small electrode” and its cone angle is considered as 10°. The average melting rate of every small electrode is 0.42 kg/min (6.30/15). After calculation, the contact time at the metal film is 2.89 s.
The mass transfer behavior has a strong dependence on temperature. It has been reported that the temperature of metal film is close to the liquidus temperature of steel (1785 K, calculated by Thermo-Calc, KTH, Sweden) and that the superheat could not exceed 20–30 K [31]. Thus, the temperature of the metal film is supposed to be more or less 1815 K (1542 °C). For the sake of computational simplicity, the diffusion coefficients were assigned as a uniform Di of 6.10 × 10⁻⁵ cm2/s for Al, Si, Mn, P, and O, 1.00 × 10⁻⁵ cm2/s for Al2O3, SiO2, P2O5, MnO and FeO at 1815 K (1542 °C) [29].

3.3.2. Mass Transfer Coefficient at the Droplet–Slag Interface

After droplet detachment from the electrode tip, it is then further heated by the molten slag. The temperature distribution of the slag and metal pool is determined by a commercial software Meltflow-ESR, developed in cooperation with Prof. A. Mitchell, the University of British Columbia, Canada and Innovative Research Inc., Plymouth, Minnesota, USA. The concrete simulation procedure was described in Ref. [32] in detail. All the related parameters including the properties of slag and steel, refining time, secondary voltage, and alternate current used in the experimental are input into the preprocessing software. After calculation, the parameters such as temperature, velocity, magnetic field, buoyance force, turbulent kinetic energy could be obtained simultaneously.
The temperature distribution of slag and metal pool predicted by Meltflow-ESR is shown in Figure 4a. A high temperature zone exists under the electrode tip. With further data processing, the result is shown in Figure 4b, from which the temperature is unevenly distributed in the slag pool. After calculation, the average temperature of the slag pool is 2020 K (1747 °C), and used to represent the temperature of the droplet in the slag pool. The velocity of the droplet is estimated by Equation (31)
v = 8 Δ ρ g R E 3 ρ s
where Δ ρ is the density difference between slag and steel. After calculation, the velocity is about 61 cm/s and the time of droplet falling is taken as 0.23 s. As proposed by Wei et al. [29] the diffusion coefficient of species in the droplet is 1.93 × 10⁻³ cm2/s while in the slag it is 7.00 × 10⁻⁵ cm2/s at 2020 K (1747 °C).

3.3.3. Mass Transfer Coefficient at Metal Pool–Slag Interface

When the droplet enters into the metal pool, it immediately mixes with the bulk and undergoes a period of cooling. The average temperature of the slag/metal pool interface is 1957 K (1684 °C). The diffusion coefficient of species at the metal side is set as 5.75 × 10⁻⁴ cm2/s while at the slag side it is 6.00 × 10⁻⁵ cm2/s [29]. The velocities at the slag and metal side are calculated via Meltflow-ESR (Developed in cooperation by Prof. A. Mitchell, the University of British Columbia, Canada and Innovative Research Inc., Plymouth, MN, USA). Then we can get the contact time at the metal pool-slag interface.

3.4. Area/Volume Ratio

At the slag-metal interface of the electrode tip, the surface area and volume of the metal film are estimated from Equations (32) and (33)
A Film = π R E 2 cos θ
V Film = π R E 2 δ ¯ 3
where δ ¯ is the thickness of metal film, calculated by [29]
δ ¯ = { 3 μ m Q m 2 π ( ρ m ρ S ) g sin θ cos θ ( 1 x 2 cos 2 θ R E 2 ) } 1 / 3
It is difficult to accurately calculate the ratio of the area/volume at the droplet/slag interface. During droplet formation, it is subjected to a pinching effect. When the droplet detaches from the electrode tip, it is still elongated. The forces of surface tension acting on the droplet attempt to return it to its spherical shape and hence set up an oscillation. As proposed by Fraser [28], it is assumed the ratio of area/volume is 24.0. The metal pool is considered to be constituted of a cylinder and a cone. Thus, the area and metal pool volume can be obtained
A Metal   Pool = π R M 2
V Metal   Pool = V Cylinder + V Cone
Up to now, all the necessary parameters used for the kinetic model have been obtained, as listed in Table 4.

3.5. Modeling Solution Procedure

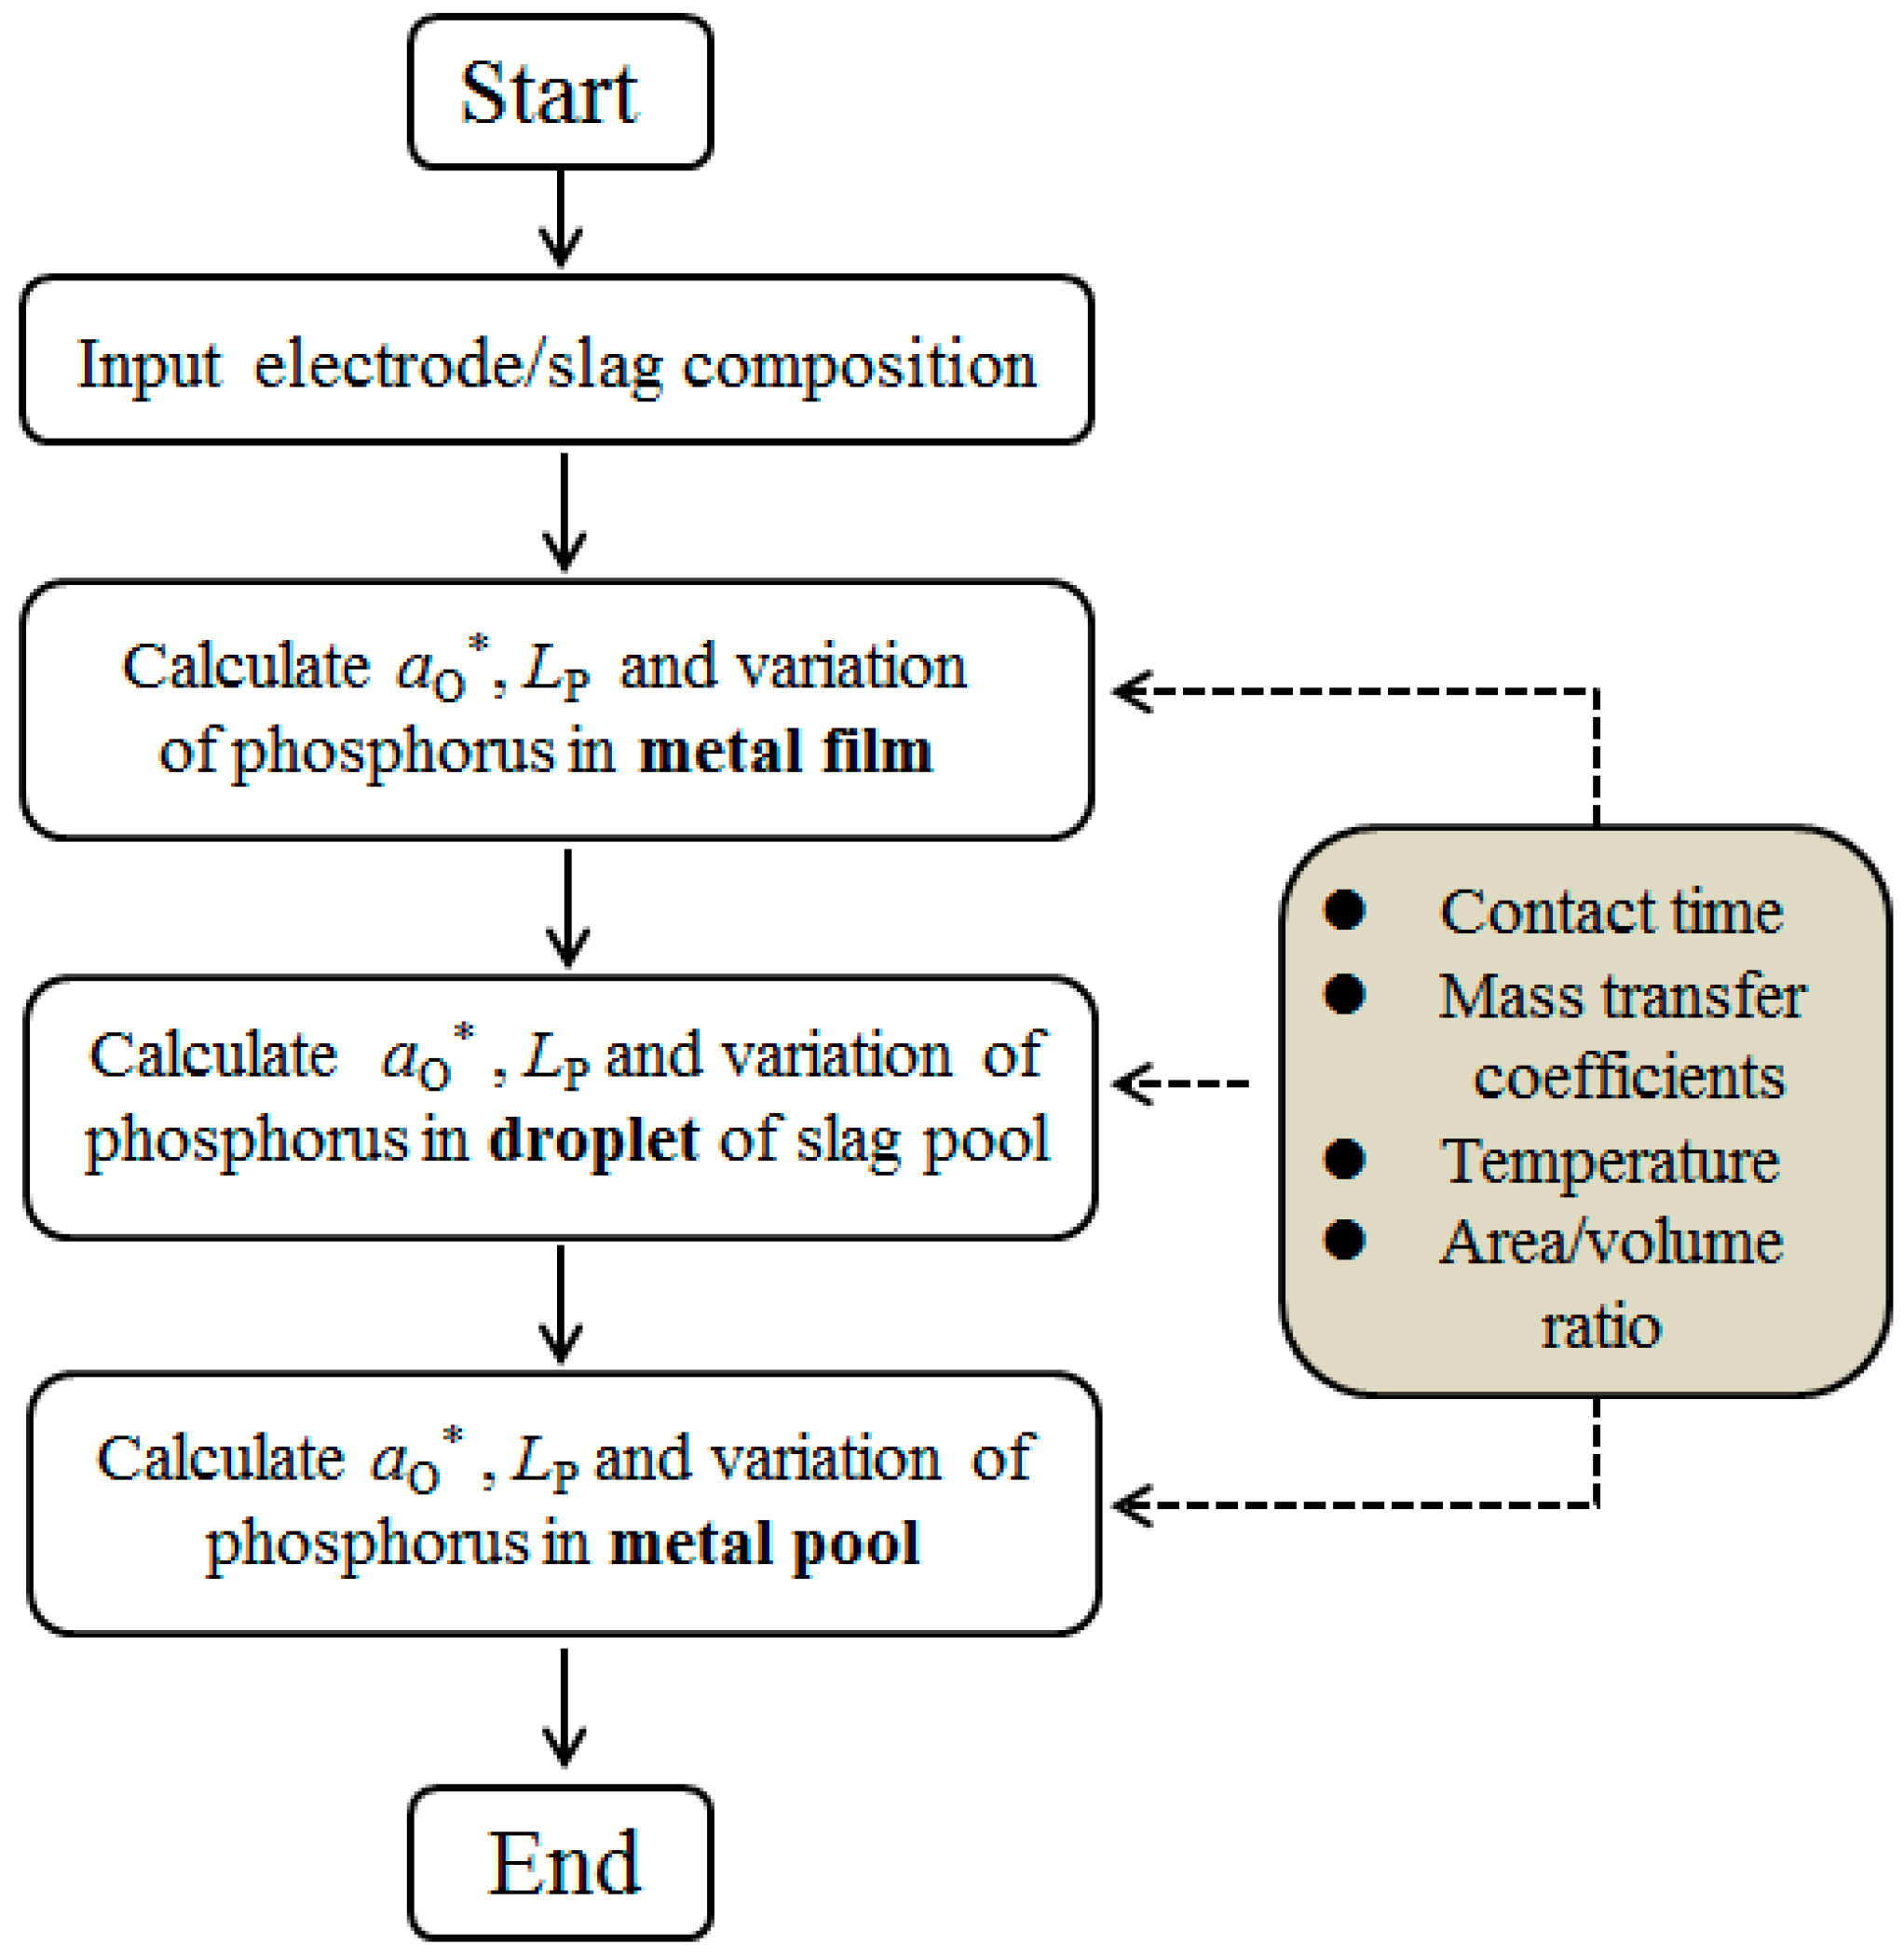
Figure 5 shows schematically the flowchart of the kinetic model. The liquid element travels sequentially through various reaction regions. The parameters including the reaction temperature, mass transfer coefficients, contact time, and area/volume at the electrode tip-, droplet-, and metal pool–slag interface are determined. Then, the equilibrium oxygen activity ao*, the phosphorus partition ratio LP, and the variation of phosphorus in the metal film, droplet and metal pool are calculated by Matlab 2016b (Natick, MA, USA), respectively.

4. Discussion

4.1. Mass Transfer Resistance of Phosphorus in Steel and Slag

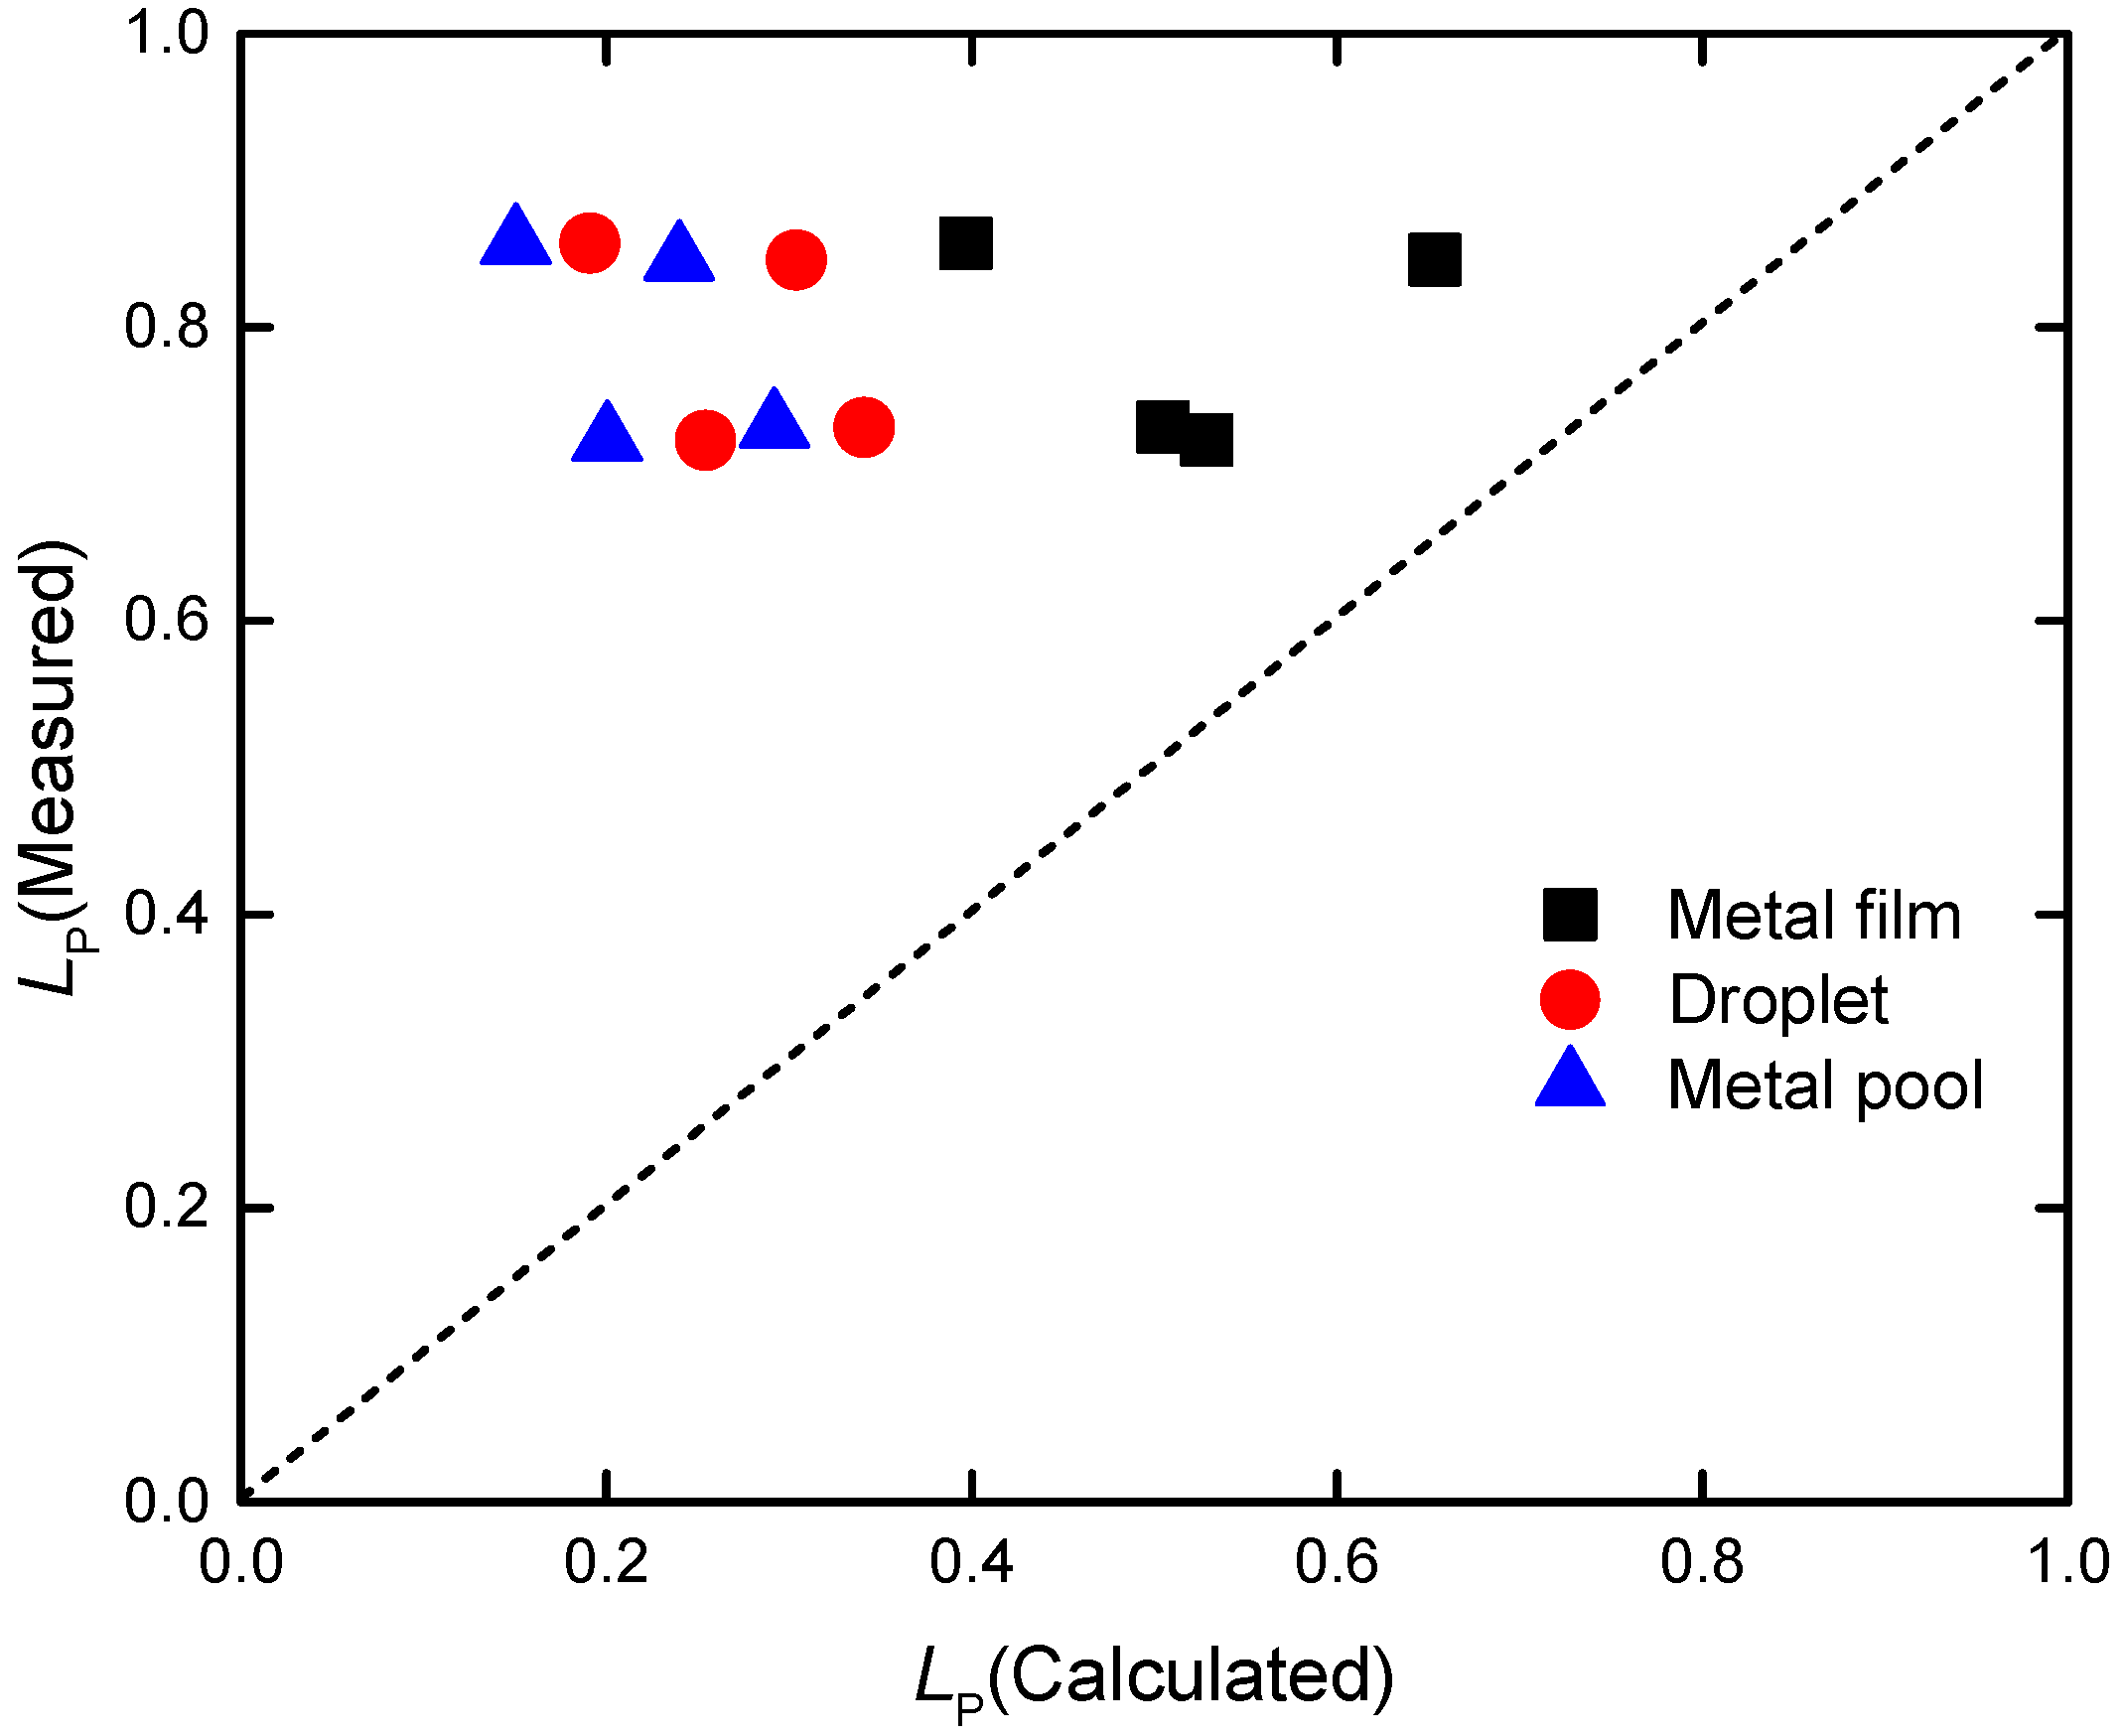
From Equation (8), the mass transfer resistance at the slag side is very much related with LP. Figure 6 shows the comparison between the calculated and measured LP. It is noted that the measured LP can be obtained from Table 2 and Table 3. It can be seen that the measured LP at various slag-metal interfaces are all larger than the calculated LP. By comparing the calculated LP at various interfaces with the measured LP, it is found that the calculated LP at the metal film-slag interface is closer to the measured LP, indicating a closer thermodynamic equilibrium can be attained. This is mainly due to the relatively low temperature of metal film-slag interface.
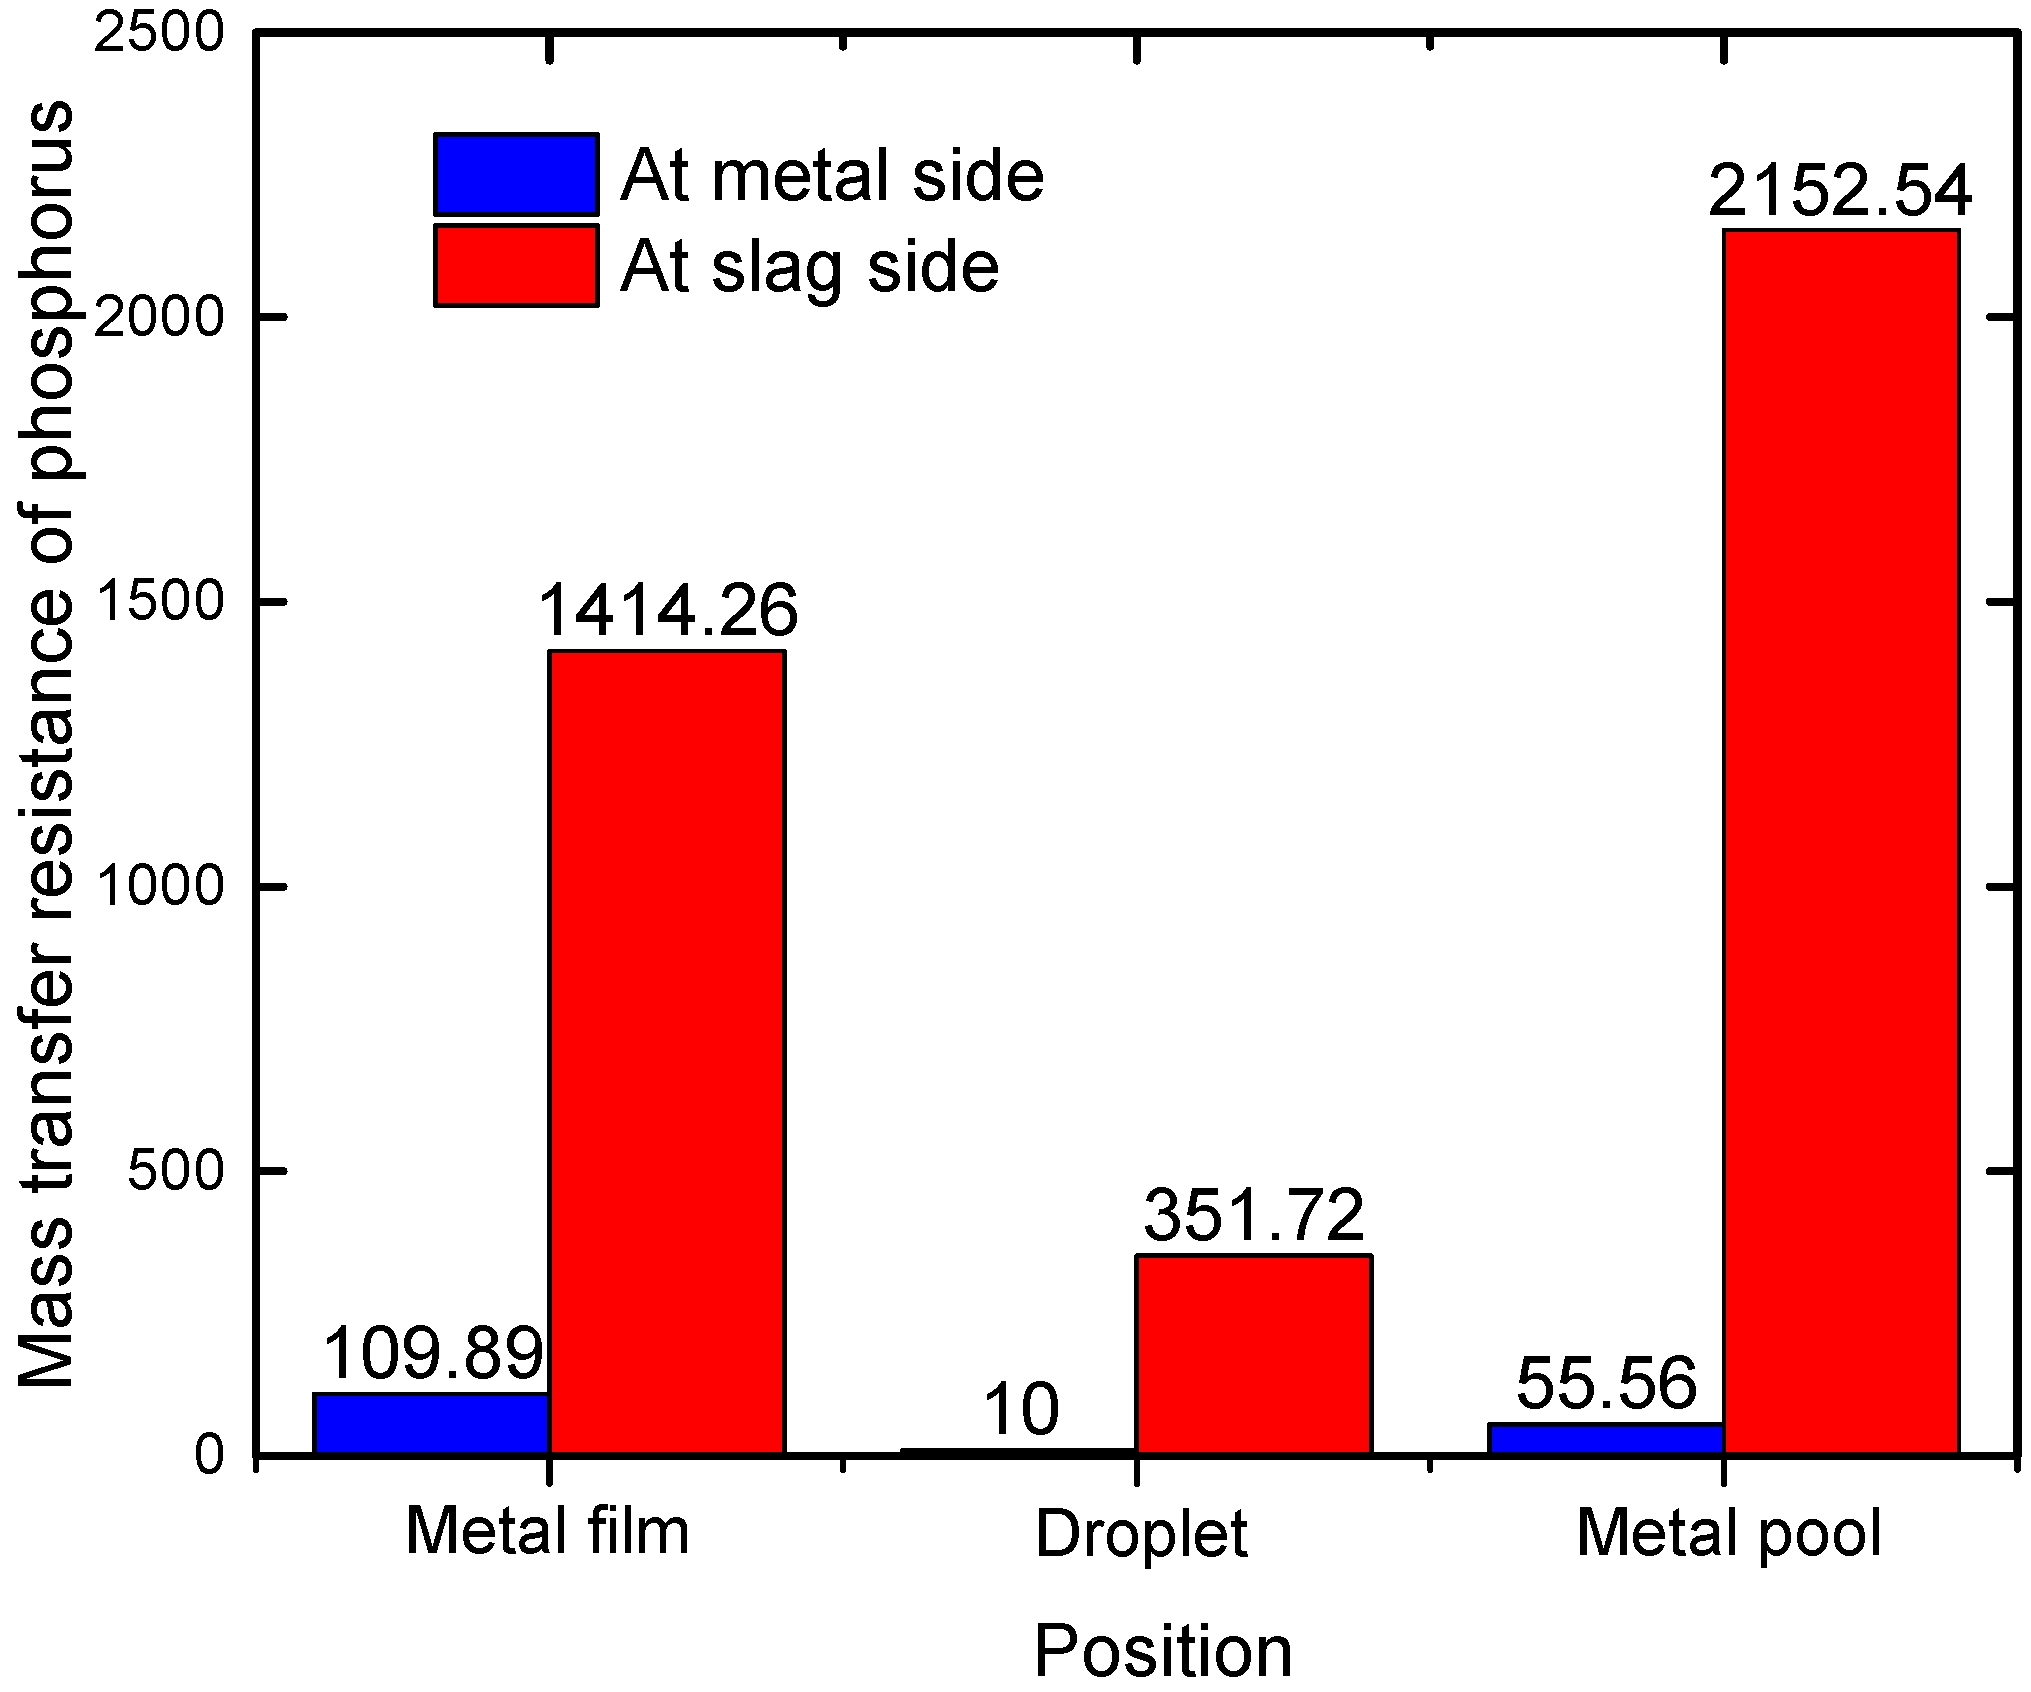
In the case of the experiment with slag A, the mass transfer resistances of phosphorus at the metal side and slag side are calculated, as shown in Figure 7. At various slag-metal interfaces, the mass transfer resistance at the slag side is higher than that at the metal side, indicating the rate-determining step of phosphorus transfer is at the slag side. By comparing the mass transfer resistance at the slag side of various interfaces, it is found the resistance at the droplet-slag interface is the smallest. This is because the kp,s in the slag pool is much larger than that at the metal film– and metal pool-interface, as given in Table 4.

4.2. Effect of Phosphorus Content in Slag

Considering an extremely smaller amount of liquid metal (Wm) than that of slag (Ws), the value of Wm/(WsLP) is very close to zero. Therefore, when calculating the variation of P during ESR, Equation (28) can be simplified into Equation (37).
A k P V m t = ln [ % P ] ( % P ) 0 L P [ % P ] 0 ( % P ) 0 L P
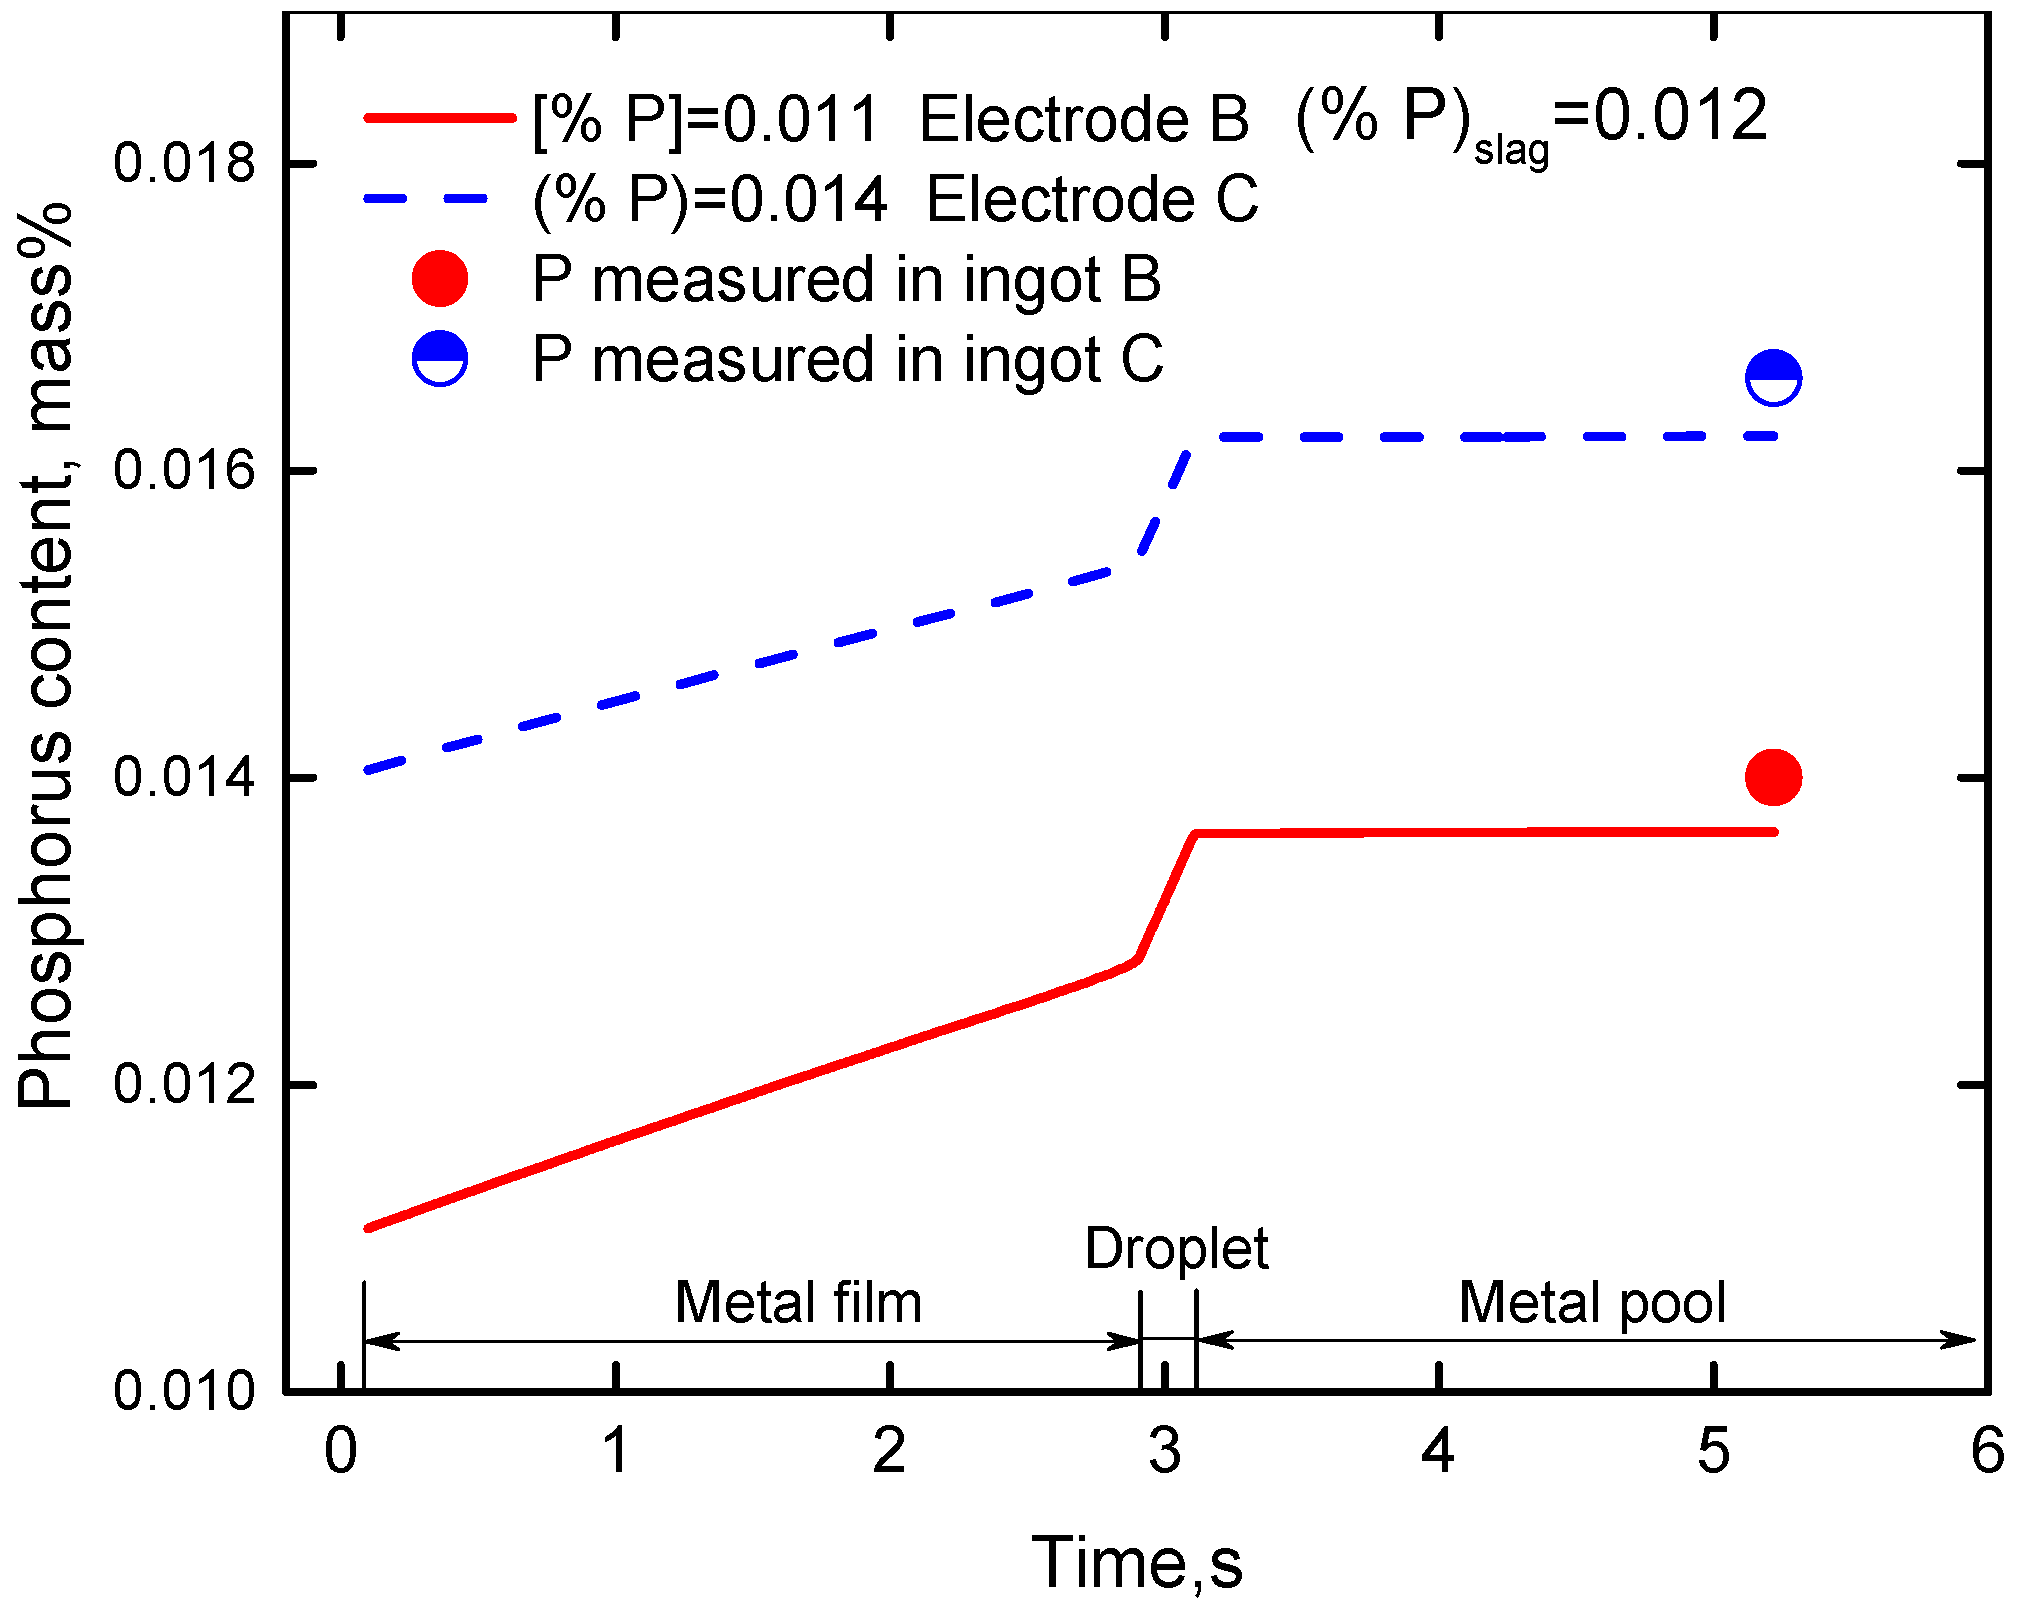
Based on Equation (37), the effect of P in the slag on the variation of P from metal film to droplet and metal pool under the same P content in the electrodes is calculated, as shown in Figure 8. With slag A, the model predicts that the P content increases from 0.011% in the electrode to 0.012% in the metal film. The obvious increase is attributed to the large area/volume ratio of 70.0 and relatively long contact time of 2.89 s between slag and metal. During droplet falling, the P content is expected to further increase from 0.012% to 0.0126%. Although the falling time of the droplet is only 0.23 s, the high temperature of the slag pool is favorable for the kinetic mass transfer of P from slag to metal. After the droplet falling into the metal pool, the content of P becomes slightly changed. From the calculated result, it can be summarized that rephosphorization mainly occurs in the metal film and the falling droplet, which corresponds well with the variation trend of dissolved oxygen during ESR [27].
With the P content in the slag increasing from 0.0090% (slag A) to 0.012% (slag B), the predicted P in the metal pool increases from 0.0126% to 0.0137%. As given in Section 4.1, the rate-determining step of phosphorus transfer is at the slag side. Therefore, a higher P content in the slag can obviously promote the mass transfer of phosphorus from slag to metal.
The red and blue symbols represent the measured P in ingot A and B, respectively. During a certain time period, the P in the metal pool changes little. Therefore, the P in the metal pool can be used to represent that in the ingot to some extent. It can be seen that the measured P in the ingots shows good agreement with the calculated results.

4.3. Effect of Phosphorus Content in the Electrode

The P content in the electrode is an important parameter influencing the ingot cleanliness. Based on the kinetic model, the effect of the initial P in the electrode on the P content in the ingot under the same P content of 0.012% in slag is calculated, as illustrated in Figure 9. From this figure, it can be seen that with the P content in the electrode increasing from 0.011% (electrode B) to 0.014% (electrode C), the corresponding P in the metal pool increases from 0.0137% to 0.0166%. The P-increment of the metal pool is nearly equal to that of the electrode. From Figure 8, the calculated P-increment of the metal pool (0.0011%) is less than the P-increment in the slag. From this point of view, decreasing P content in electrode is more favorable for a decrease of P content in the ingot.

4.4. Effect of Temperature of Slag Pool

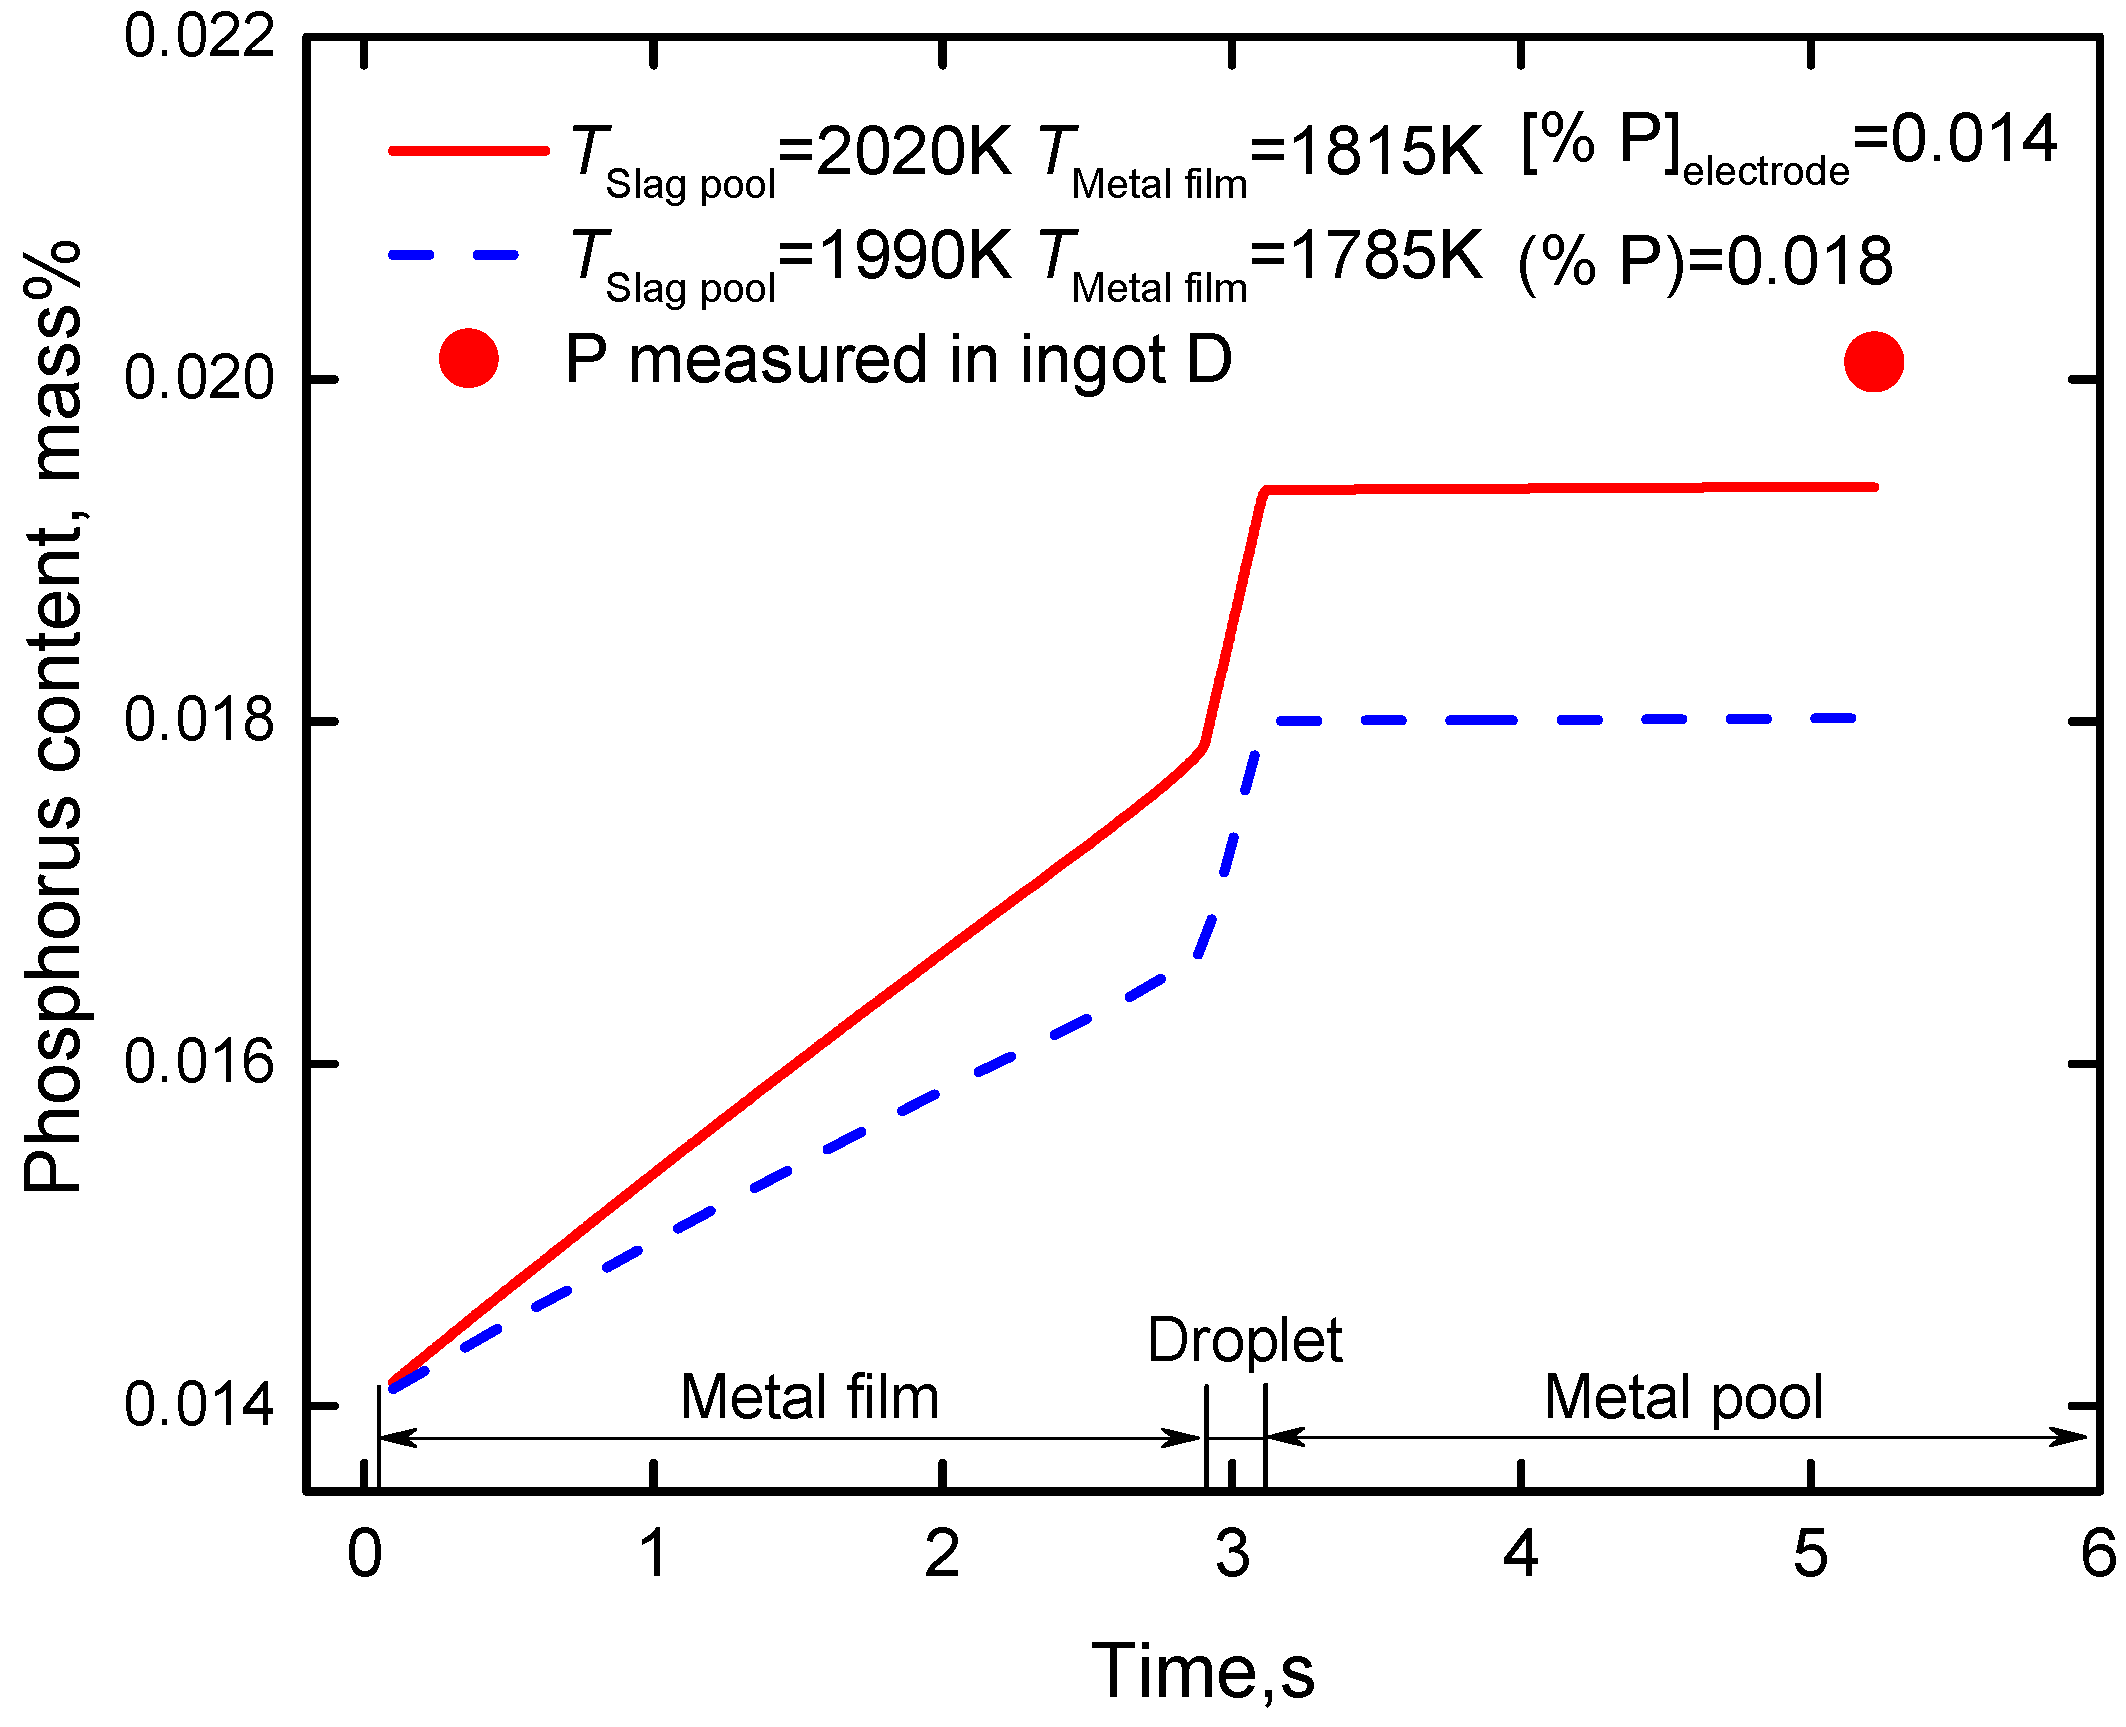
With a different slag system, electric system and so on, the temperature of the slag pool will have some difference. Figure 10 shows the effect of temperature on P content in the ingot with the same P content in electrode and slag. It can be seen with the temperature of slag pool increasing from 1990 K (1717 °C) to 2020 K (1747 °C), the predicted P in the metal pool increases from 0.0180% to 0.0194%. The measured P in the ingot also corresponds well with the calculated value. Therefore, it is suggested that the temperature of the slag pool should be controlled at a relatively low value.
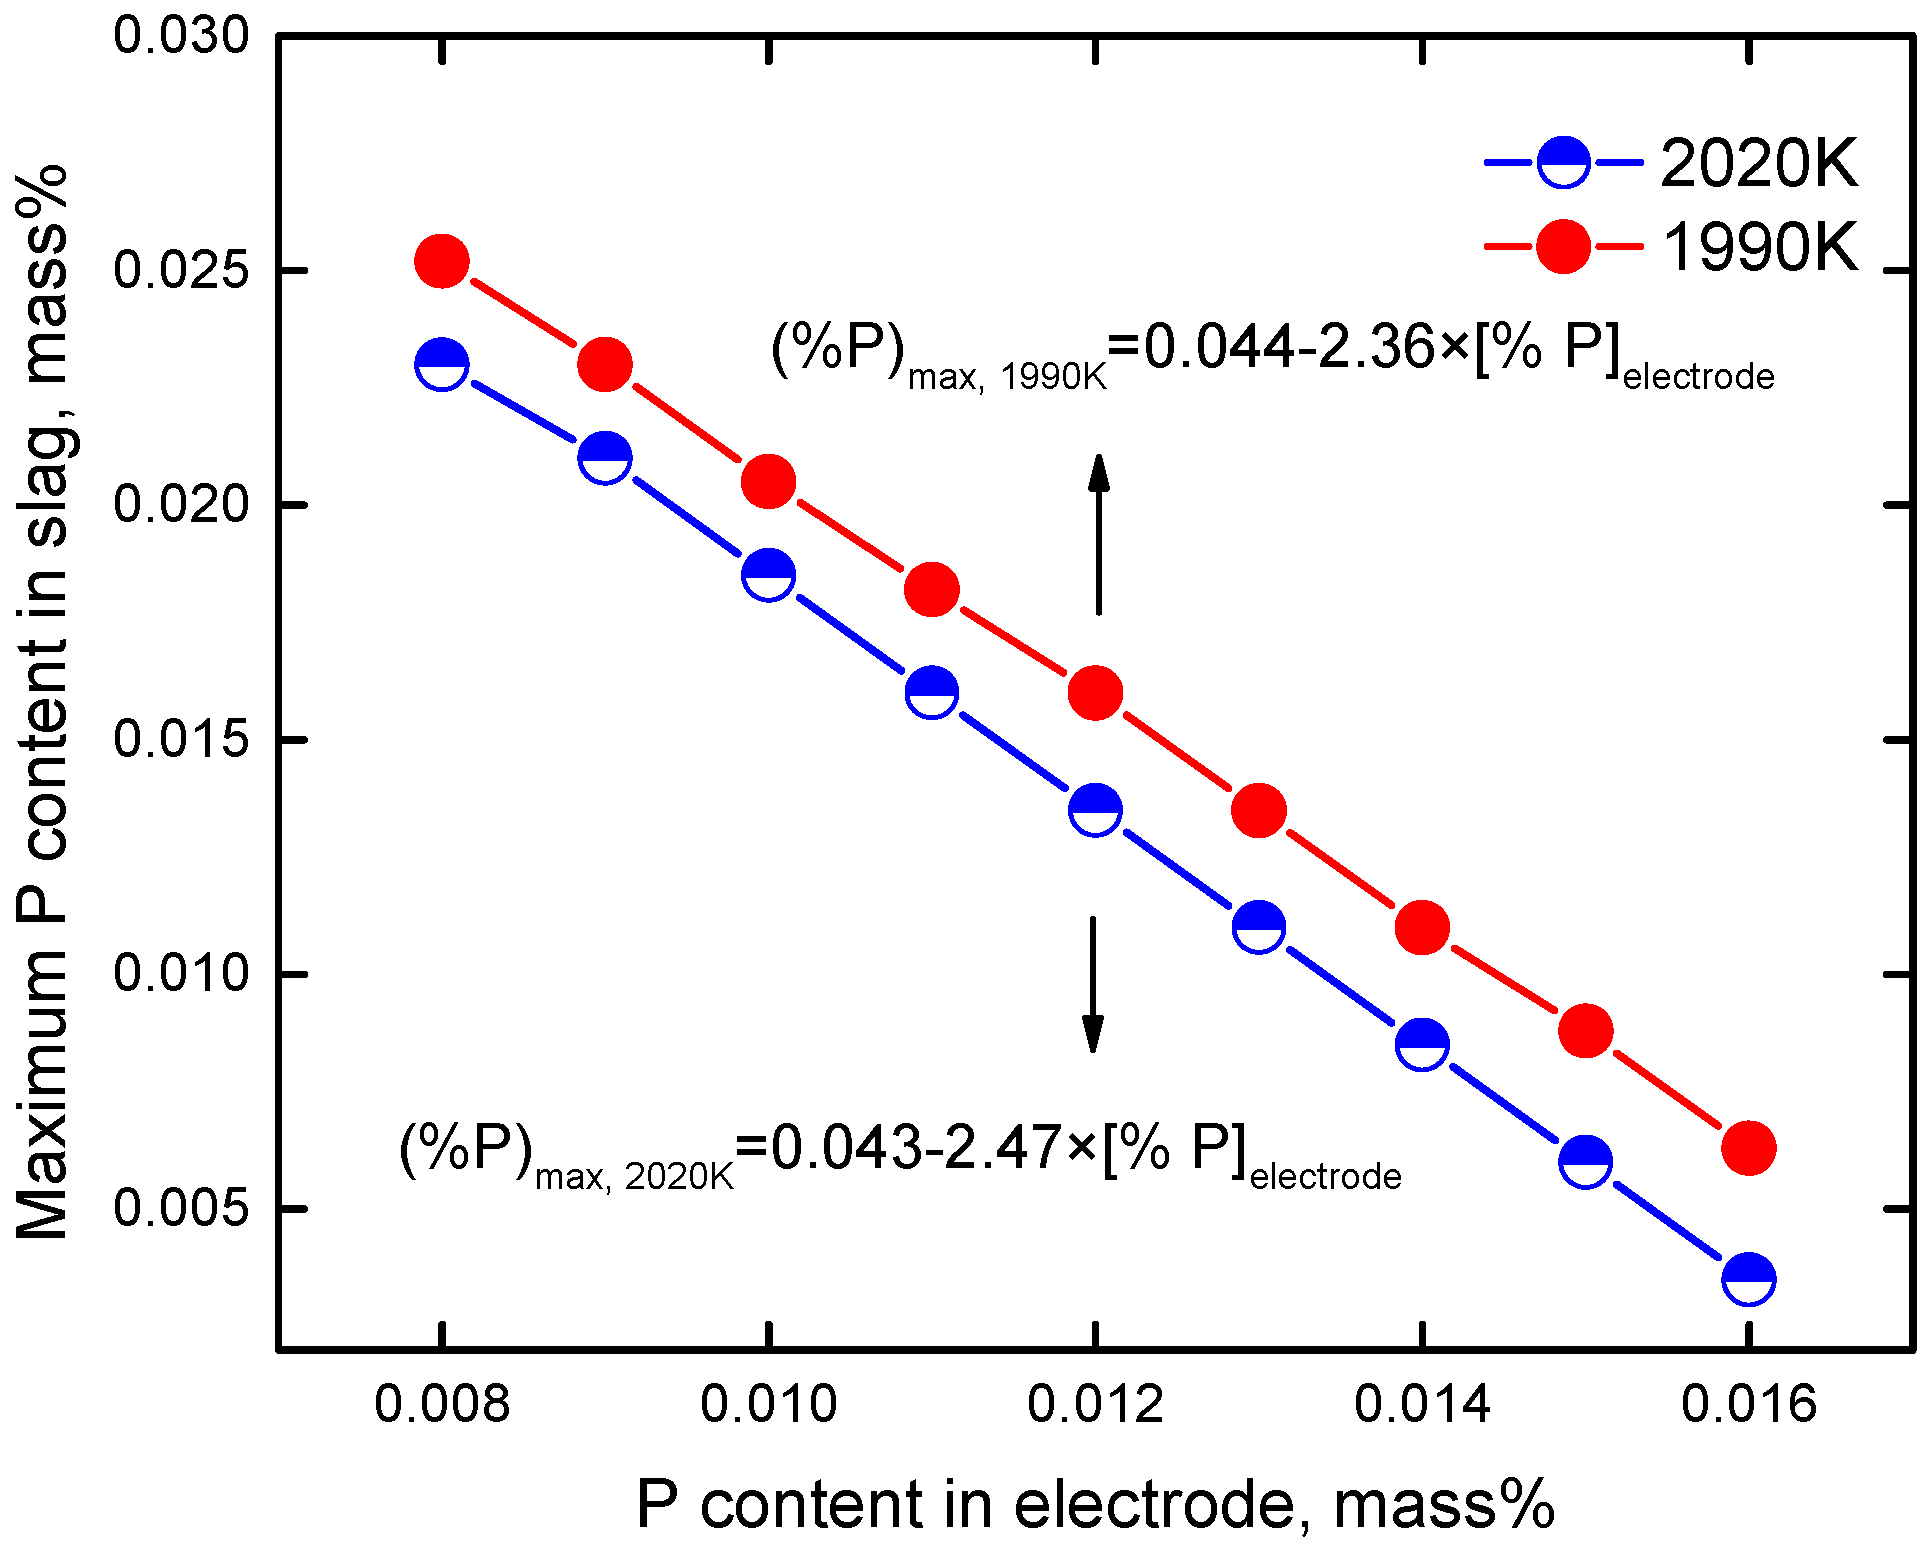
In light of the above analyses, the P content in the ingot is very much influenced by the P in the electrode and slag, and the temperature of the slag pool. As the demand for steel cleanliness becomes higher, the content of P in ingot should be controlled below 0.015%. Based on this, the corresponding maximum P content in slag A under the condition of certain P in the electrode is calculated, as shown in Figure 11. With different temperatures of the slag pool, the maximum P in the slag is negatively proportional to the P content in the electrode, as given in
At 2020 K, (%P)max = 0.043 − 2.47 × [%P]electrode
At 1990 K, (%P)max = 0.044 − 2.36 × [%P]electrode
From Figure 11, with the P content in electrode increasing, the corresponding maximum P in the slag decreases obviously. At 2020 K, the maximum P content in the slag decreases from 0.023% to 0.0035% with the P in electrode increasing from 0.0080% to 0.016%. Fluorite inevitably contains a certain amount of phosphorus. After the slag is remelted, the content of P usually varies from 0.01% to 0.02%. When the content of P in the slag is 0.02%, the maximum P in the electrode is 0.0093%.
Therefore, to guarantee the P in the ingot to be no more than 0.015%, it is suggested that the P content in the electrode should be controlled below 0.0093%. However, if the temperature of the slag pool decreases, the maximum P in the electrode could be higher. At 1990 K, the corresponding P in the electrode is 0.0103% when the P in slag is 0.02%.
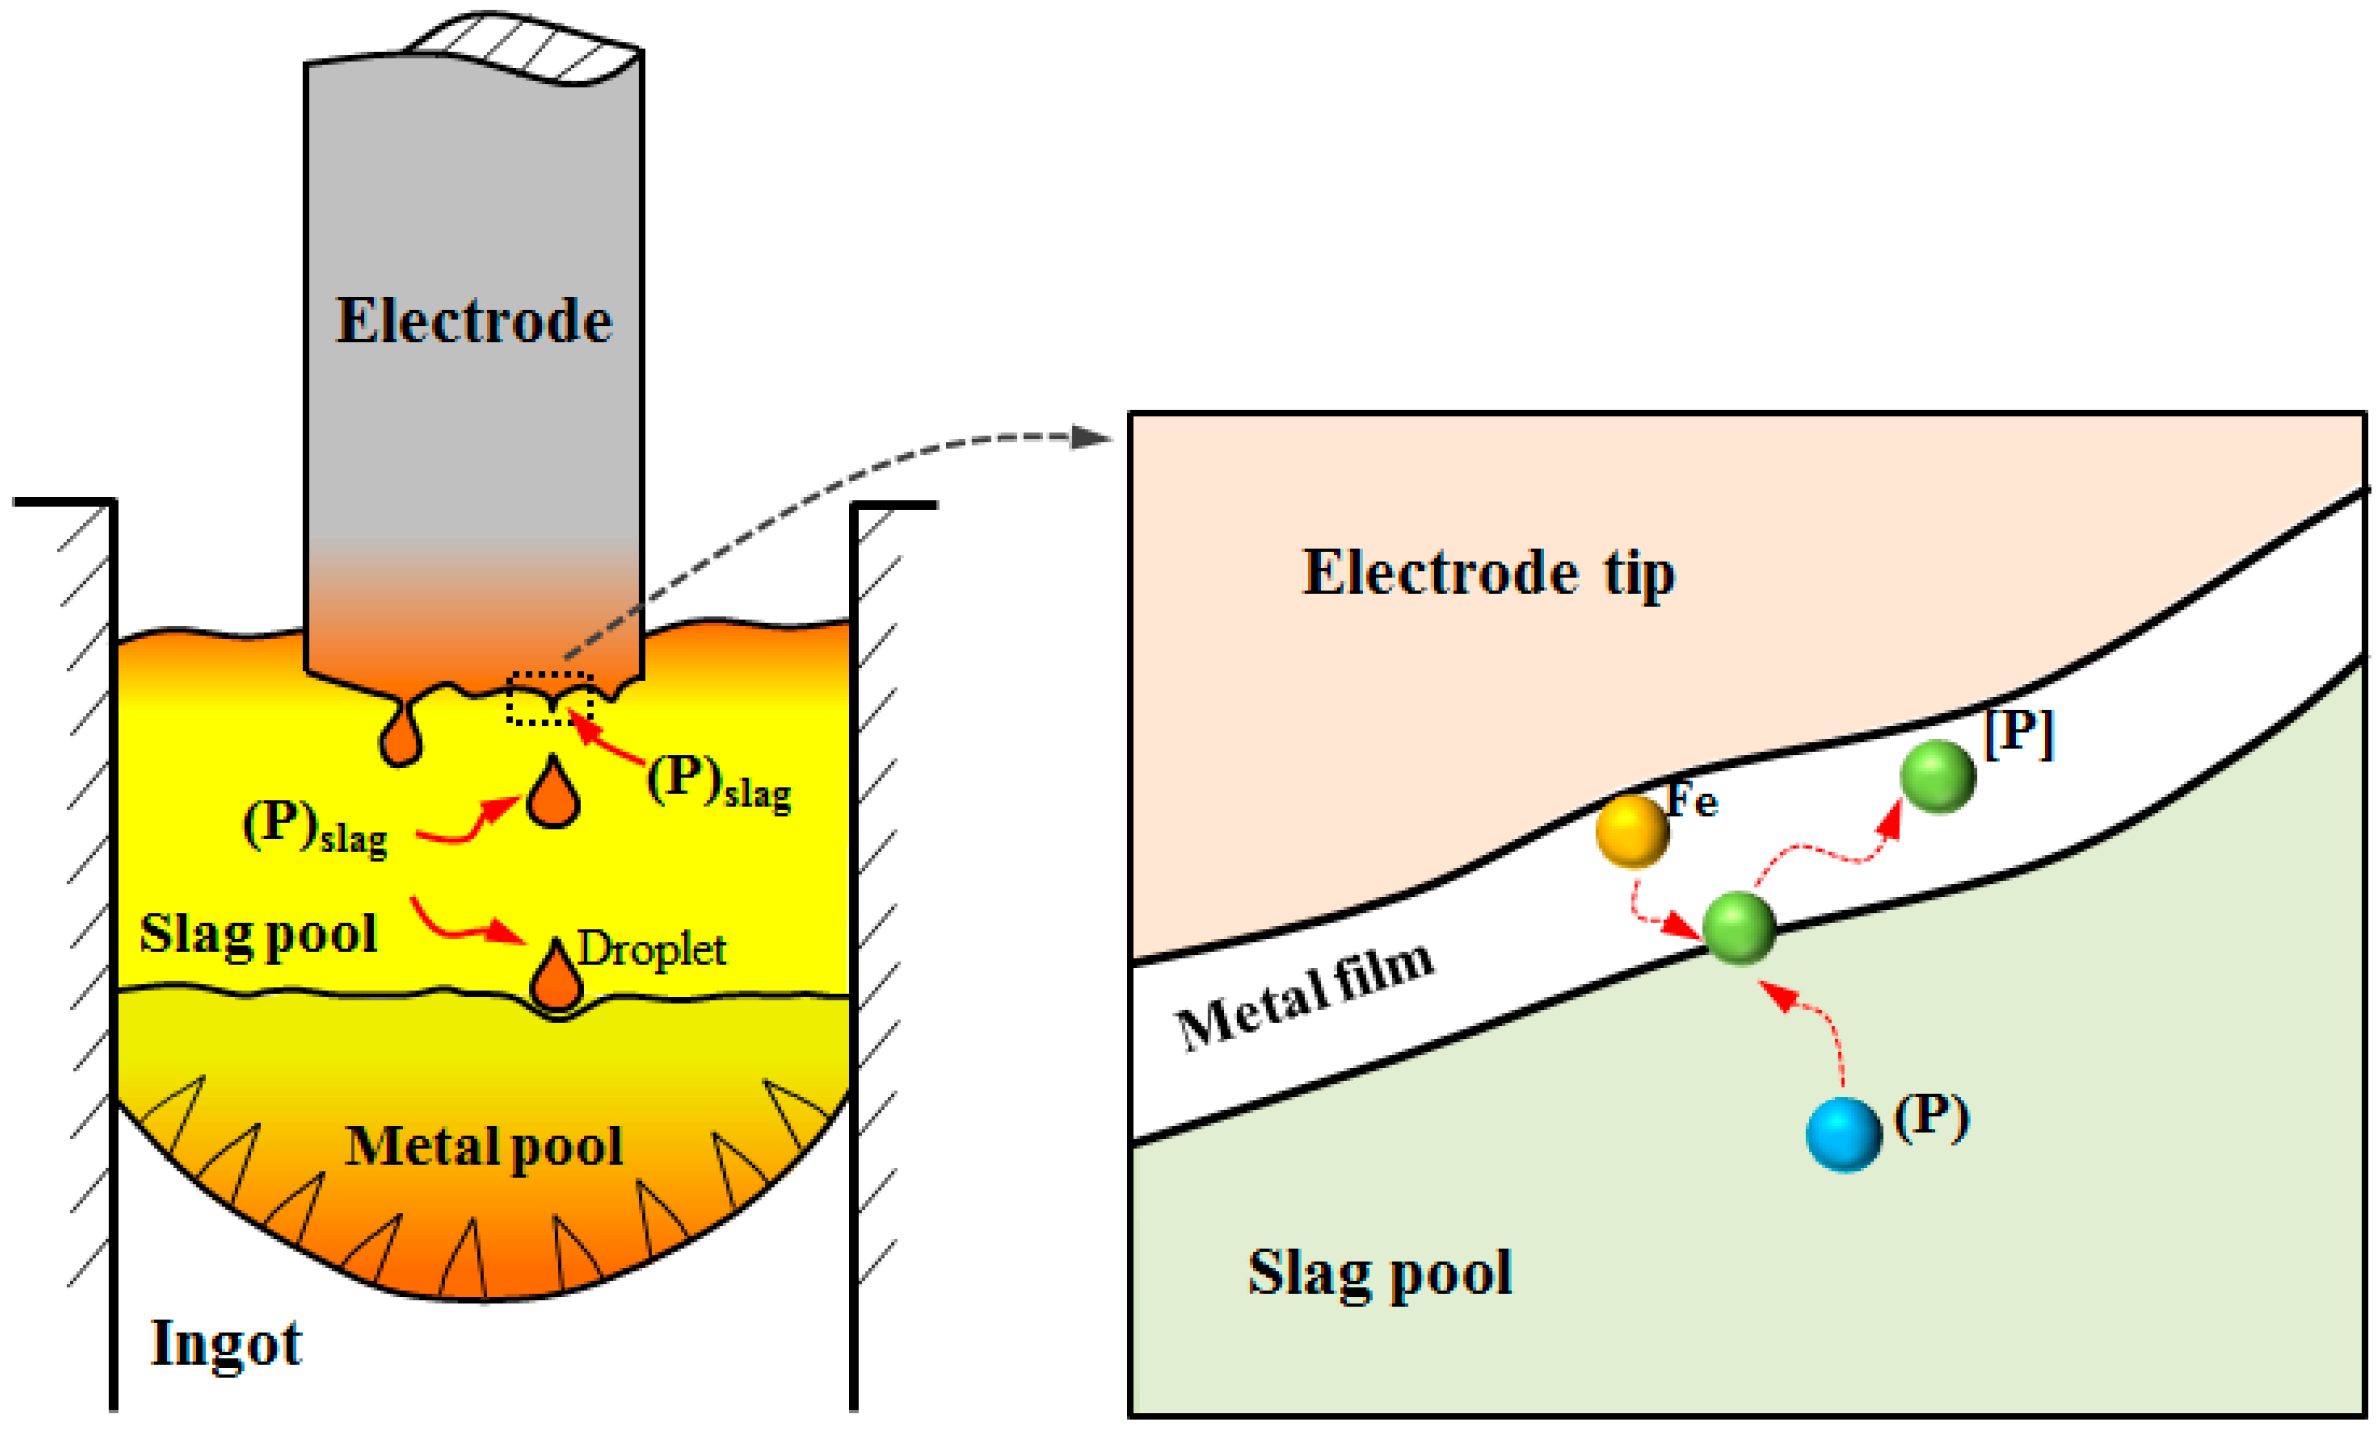
The mechanism of rephosphorization during the ESR process is summarized, as shown in Figure 12. The iron reacts with P in the slag, forming [P] at the metal film–slag interface. Further, the [P] transfers from the interface into the metal film. The large extent of rephosphorization occurs at this position. After the droplet detaching from the electrode tip, it is further heated by the molten slag. Although the falling time of the droplet is very short, the high temperature of the slag pool is favorable for the mass transfer of P from slag to metal. After the droplet falling into the metal pool, the content of P becomes slightly changed.

5. Conclusions

In order to elucidate the variation of phosphorus during ESR of G20CrNi2Mo bearing steel, a kinetic model on the basis of film and penetration theory was established, and the following conclusions obtained.
(1) Although the contents of P in the slags are less than 0.02%, the contents of P in the ingots are all higher than that in the electrodes, implying rephosphorization occurs during ESR.
(2) Based on the kinetic model, the mass transfer of phosphorus is revealed. The rate-determining step of phosphorus transfer is at the slag side. Rephosphorization mainly occurs in the metal film and falling droplet. With the increase of P in the slag and electrode and the temperature of the slag pool, the P content in the ingot shows a rising trend.
(3) To achieve a low-P ingot no more than 0.015%, the corresponding maximum P content in slag A under the condition of a certain P in the electrode was calculated, as given
At 2020 K, (%P)max = 0.043 − 2.47 × [%P]electrode
At 1990 K, (%P)max = 0.044 − 2.36 × [%P]electrode

Author Contributions

Writing—review and editing, S.L.; writing—original draft preparation, S.L.; conceptualization, G.C.; formal analysis, Y.H. and Z.M.; data curation, W.D.

Funding

This work was supported by the National Natural Science Foundation of China (No. 51874034 and No. 51674024).

Acknowledgments

The authors would like to appreciate Xining Special Steel Plant for contributing to the industrial experiment.

Conflicts of Interest

The authors declare no conflict of interest.

References

  1. Li, Z. A study on production process of G20CrNi2MoA carburizing bearing steel. Spe. St. Tech. 2010, 16, 10–14. [Google Scholar]
  2. Miao, X.; Yu, C.; Shi, C.; Du, J.; Zhu, H.; Cheng, G. Formation and control of calcium aluminates in bearing steel. J. Univ. Sci. Tech. Beijing 2008, 29, 771–775. [Google Scholar]
  3. Weber, V.; Jardy, A.; Dussoubs, B.; Ablitzer, D.; Ryberon, S.; Schmitt, V.; Hans, S.; Poisson, H. A comprehensive model of the electroslag remelting process: Description and validation. Metall. Mater. Trans. B 2009, 40, 271–280. [Google Scholar] [CrossRef]
  4. Rückert, A.; Pfeifer, H. Mathematical modelling of the flow field, temperature distribution, melting and solidification in the electroslag remelting process. Magnetohydrodynamics 2009, 45, 527–533. [Google Scholar]
  5. Matity, S.; Ballal, N.; Goldhahn, G.; Kwaalla, R. Development of ultrahigh strength low alloy steel through electroslag refining process. ISIJ Int. 2009, 49, 902–910. [Google Scholar] [CrossRef]
  6. Briant, C.; Banerji, S. Tempered martensite embrittlement in a high purity steel. Metall. Mater. Trans. A 1979, 10, 1151–1155. [Google Scholar] [CrossRef]
  7. Bloom, T.; Foshnacht, D.; Haezebrouck, D. The influence of phosphorus on the properties of sheet steel products and methods used to control steel phosphorus levels in steel product manufacturing. Iron Steelmak. 1990, 17, 35–41. [Google Scholar]
  8. Basu, S.; Lahiri, A.K.; Seetharaman, S. Phosphorus partition between liquid steel and CaO-SiO2-FeOx-P2O5-MgO slag containing 15 to 25 Pct FeO. Metall. Mater. Trans. B 2007, 38, 623–630. [Google Scholar] [CrossRef]
  9. Suito, H.; Inoue, R.; Takada, M. Phosphorus distribution between liquid iron and MgO saturated slags of the system CaO-MgO-FeOx-SiO2. Tetsu-to-Hagane 1981, 67, 2645–2654. [Google Scholar] [CrossRef]
  10. Muraki, M.; Fukushima, H.; Sano, N. Phosphorus distribution between CaO-CaF2-SiO2 melts and carbon-saturated iron. Trans. ISIJ 1985, 25, 1025–1030. [Google Scholar] [CrossRef]
  11. Shirota, Y.; Katohgi, K.; Klein, K.; Klein, K.; Engell, H.; Janke, D. Phosphate capacity of FeO-Fe2O3-CaO-P2O5 and FeO-Fe2O3-CaO-CaF2-P2O5 slags by levitation melting. Trans. ISIJ 1985, 25, 1132–1140. [Google Scholar] [CrossRef]
  12. Im, J.; Morita, K.; Sano, N. Phosphorus distribution ratios between CaO-SiO2-FetO slags and carbon-saturated iron at 1573 K. ISIJ Int. 1996, 36, 517–521. [Google Scholar] [CrossRef]
  13. Turkdogan, E. Assessment of P2O5 activity coefficients in molten slags. ISIJ Int. 2000, 40, 964–970. [Google Scholar] [CrossRef]
  14. Lee, C.; Fruehan, R. Phosphorus equilibrium between hot metal and slag. Iron Steelmak. 2005, 32, 503–508. [Google Scholar] [CrossRef]
  15. Basu, S.; Lahiri, A.; Seetharaman, S. Phosphorus partition between liquid steel and CaO-SiO2 -P2O5-MgO slag containing low FeO. Metall. Mater. Trans. B 2007, 38, 357–366. [Google Scholar] [CrossRef]
  16. Yang, X.; Duan, J.; Shi, C.; Zhang, M.; Zhang, Y.; Wang, J. A thermodynamic model of phosphorus distribution ratio between CaO-SiO2-MgO-FeO-Fe2O3-MnO-Al2O3-P2O5 slags and molten steel during a top–bottom combined blown converter steelmaking process based on the ion and molecule coexistence theory. Metall. Mater. Trans. B 2011, 42, 738–770. [Google Scholar] [CrossRef]
  17. Assis, A.; Tayeb, M.; Sridhar, S.; Fruehan, R. Phosphorus equilibrium between liquid iron and CaO-SiO2 -MgO-Al2O3-FeO-P2O5 Slag Part 1: literature review, methodology, and BOF Slags. Metall. Mater. Trans. B 2015, 46, 2255–2263. [Google Scholar] [CrossRef]
  18. Kitamura, S.; Kitamura, T.; Shibata, K.; Mizukam, Y.; Mukaw, S.; Nakagawa, J. Effect of stirring energy, temperature and flux composition on hot metal dephosphorization kinetics. ISIJ Int. 1991, 31, 1322–1328. [Google Scholar] [CrossRef]
  19. Wei, P.; Sano, M.; Hirasawa, M.; Mori, K. Phosphorus reaction between molten iron of high carbon concentration and slag containing FeO and Fe2O3. Tetsu-to-Hagane 1990, 76, 878–885. [Google Scholar] [CrossRef]
  20. Monaghan, B.; Pomfret, R.; Coley, K. The kinetics of dephosphorization of carbon-saturated iron using an oxidizing slag. Metall. Mater. Trans. B 1998, 29, 111–118. [Google Scholar] [CrossRef]
  21. Mori, K.; Fukami, Y.; Kawai, Y. Rate of dephosphorization of liquid iron-carbon alloys by molten slags. Trans. ISIJ 1988, 28, 315–318. [Google Scholar] [CrossRef]
  22. Manning, C.; Fruehan, R. The rate of the phosphorous reaction between liquid iron and slag. Metall. Mater. Trans. B 2013, 44, 37–44. [Google Scholar] [CrossRef]
  23. Sasabe, M.; Kinoshita, Y. Permeability of oxygen through molten CaO-SiO2-Al2O3 system with Fe2O3 or CaF2. Tetsu-to-Hagane 1979, 65, 1727–1736. [Google Scholar] [CrossRef]
  24. Shibata, E.; Sun, H.; Mori, K. Transfer rate of oxygen from gas into liquid iron through molen slag. Tetsu-to-Hagane 1999, 85, 27–33. [Google Scholar] [CrossRef]
  25. Kawai, Y.; Nakamura, H.; Kawakami, K.; Toyoda, T.; Ishizaka, A.; Ebisawa, T. Thermodynamics and kinetics of hot metal dephosphorization by CaO based slag containing CaF2. Tetsu-to-Hagane 1983, 69, 1755–1762. [Google Scholar] [CrossRef]
  26. Suito, H.; Inoue, R. Effect of calcium fluoride on phosphorus distribution between MgO-saturated slags of the system CaO-MgO-FeOx-SiO2 and liquid iron. Tetsu-to-Hagane 1982, 68, 1541–1550. [Google Scholar] [CrossRef]
  27. Li, S.; Cheng, G.; Miao, Z.; Chen, L.; Li, C.; Jiang, X. Kinetic analysis of aluminum and oxygen variation of G20CrNi2Mo bearing steel during industrial electroslag remelting process. ISIJ Int. 2017, 57, 2148–2156. [Google Scholar] [CrossRef]
  28. Fraser, M.; Mitchell, A. Mass transfer in the electroslag process. Pt. 2. Mass-transfer coefficients. Iron Steelmak. 1976, 3, 288–301. [Google Scholar]
  29. Wei, J.; Mitchell, A. Changes in composition during A.C. ESR- I. Theoretical development. Act. Metall. Sin. 1984, 20, 261–279. [Google Scholar]
  30. Etienne, M. Loss of reactive elements during electroslag processing of iron-base alloys. Ph.D. Thesis, University of British Columbia, Vancouver, BC, Canada, 1970. [Google Scholar]
  31. Shi, C.; Chen, X.; Guo, H.; Zhu, Z.; Ren, H. Assessment of oxygen control and its effect on inclusion characteristics during electroslag remelting of die steel. Steel Res. Int. 2012, 83, 472–486. [Google Scholar] [CrossRef]
  32. Qi, Y.; Li, J.; Shi, C.; Geng, R.; Zhang, J. Effect of directional solidification in electroslag remelting on the microstructure and cleanliness of an austenitic hot-work die steel. ISIJ Int. 2018, 58, 1275–1284. [Google Scholar] [CrossRef]
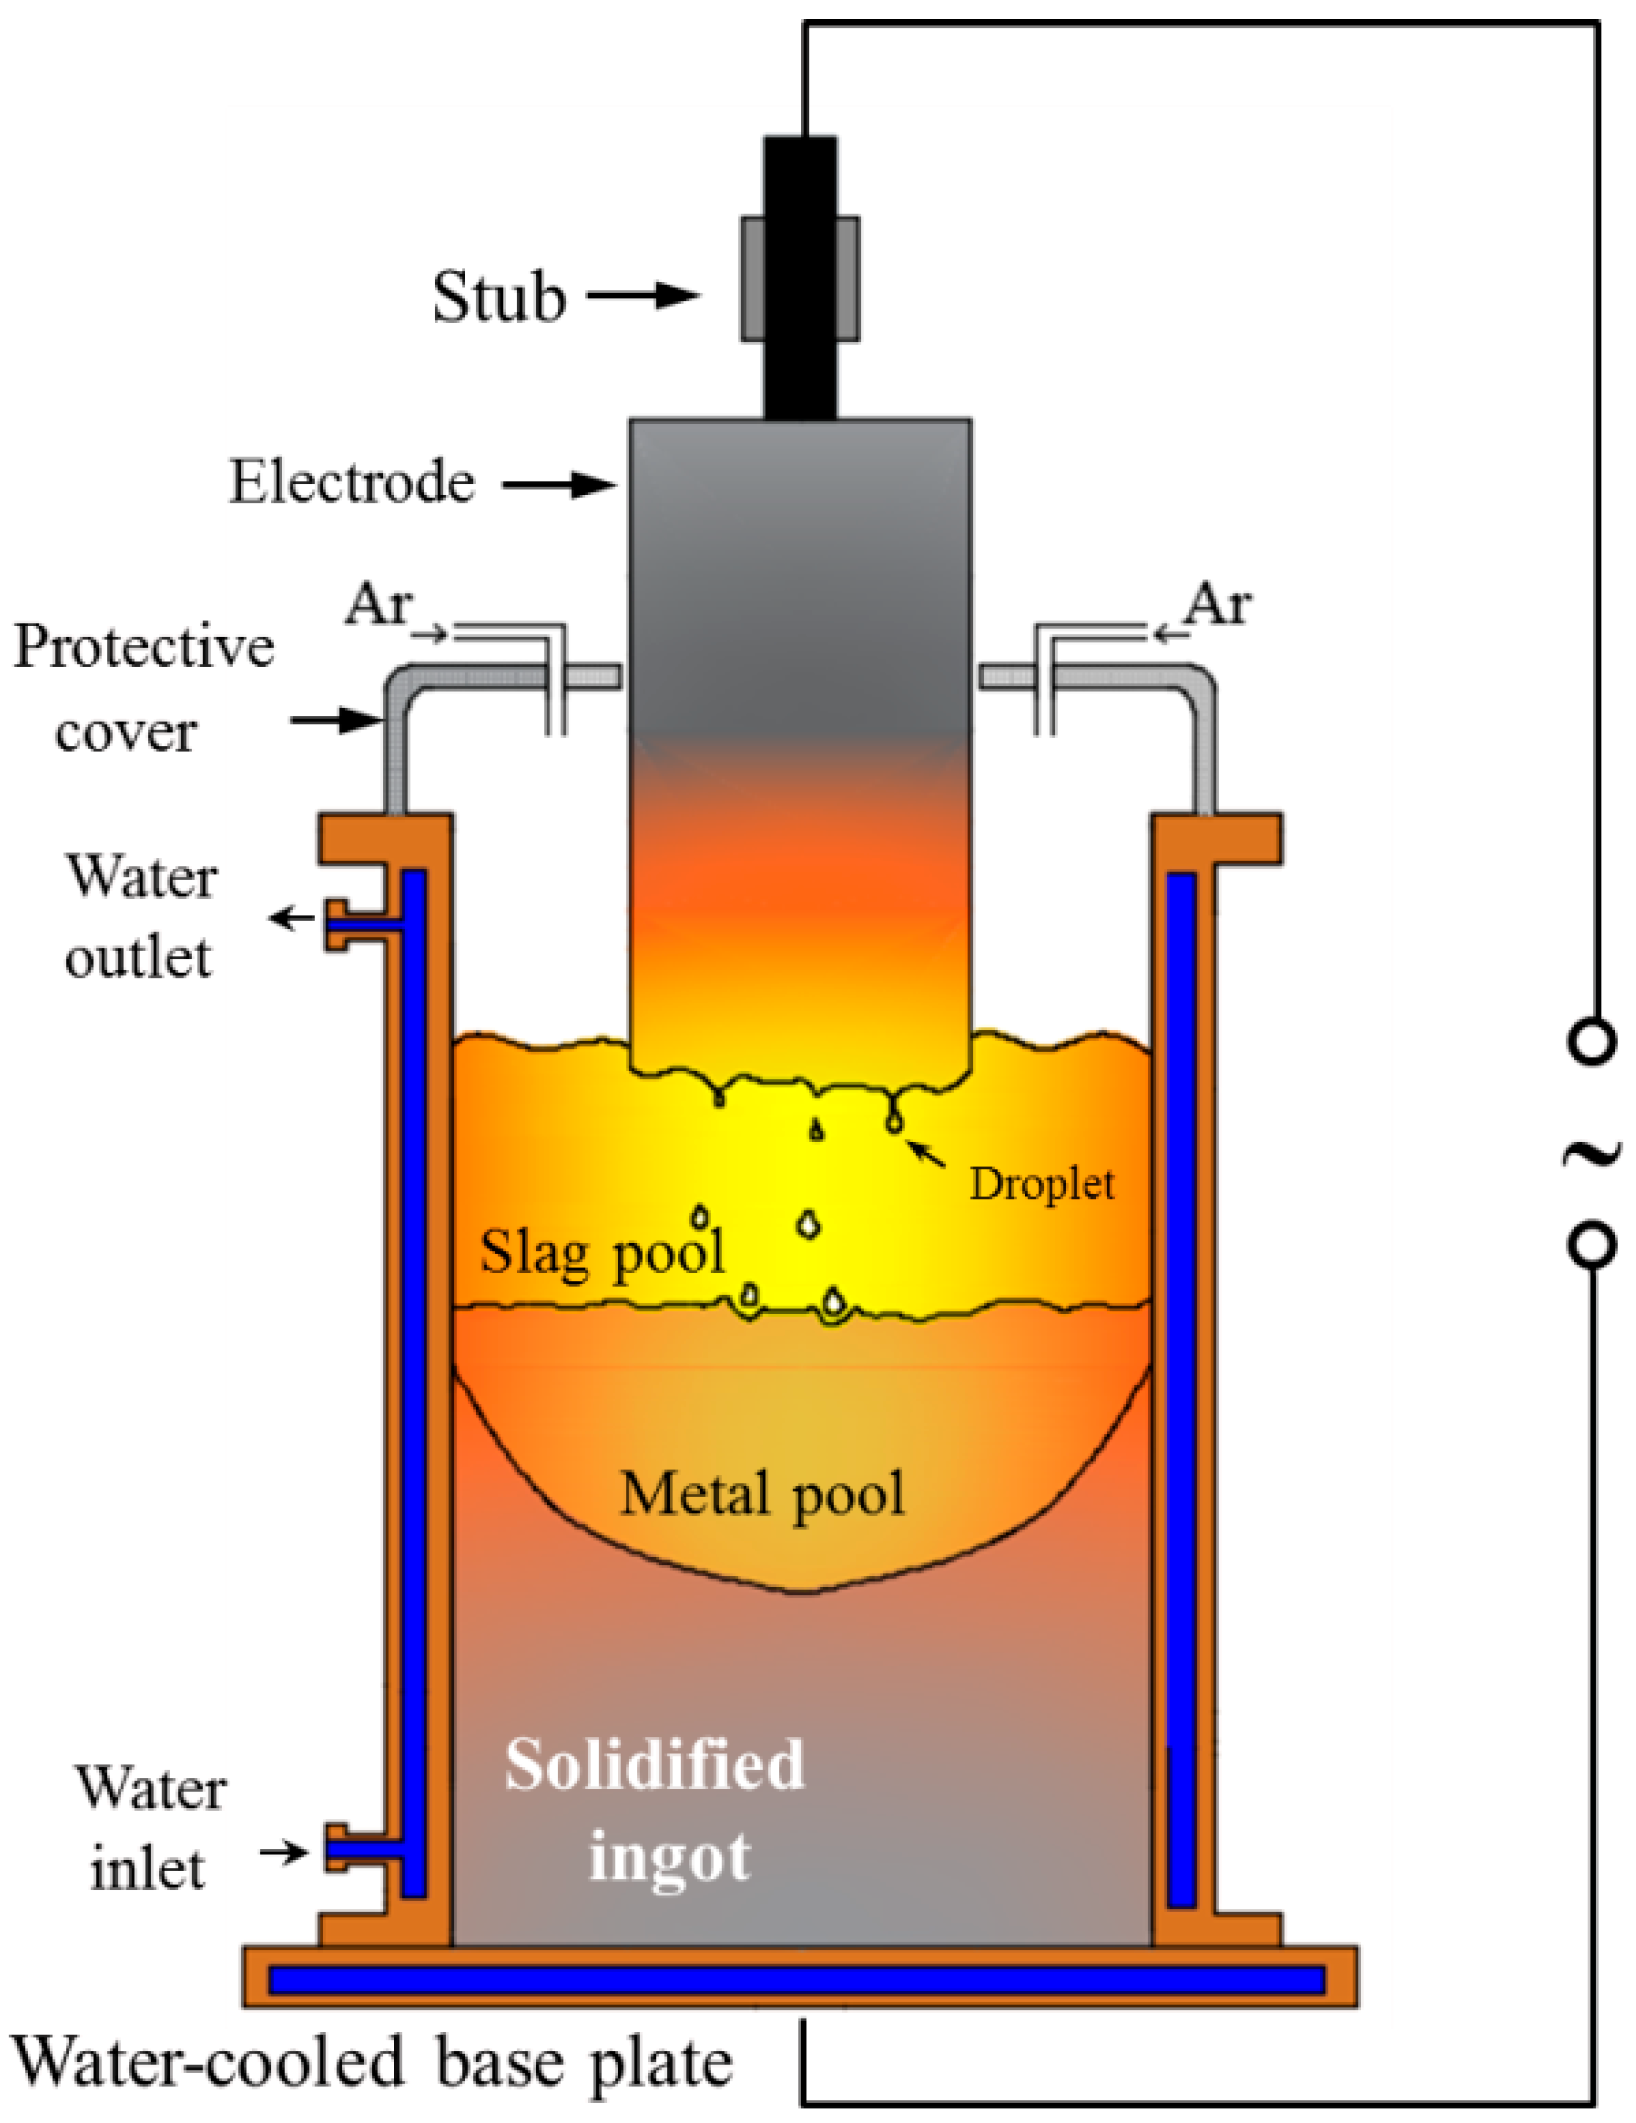
Figure 1. Schematic diagram of experimental apparatus.
Metals 09 00467 g001
Figure 2. Schematic diagram of mass flux across the slag-metal interface.
Metals 09 00467 g002
Figure 3. Morphology of the electrode tip.
Metals 09 00467 g003
Figure 4. Temperature distribution of slag pool and metal pool.
Metals 09 00467 g004
Figure 5. Flowchart of the kinetic model.
Metals 09 00467 g005
Figure 6. Comparison between calculated and measured LP.
Metals 09 00467 g006
Figure 7. Mass transfer resistance of phosphorus in steel and slag A.
Metals 09 00467 g007
Figure 8. Effect of P content in slag on P content in ingots under the same P content in the electrode.
Metals 09 00467 g008
Figure 9. Effect of P content in electrode on P content in ingots with the same P content in slag.
Metals 09 00467 g009
Figure 10. Effect of temperature of slag pool on P content in ingots under the same P in electrode and slag.
Metals 09 00467 g010
Figure 11. The corresponding maximum P content in slag A under certain P content in electrode, when the P content of the ingot is maintained at 0.015%.
Metals 09 00467 g011
Figure 12. Mechanism of rephosphorization during the electroslag remelting (ESR) process.
Metals 09 00467 g012
Table 1. The related refining parameters of the four experiments.
Exp.Voltage (V)Current (A)Temperature (K/°C)Melting Rate (kg/min)
A557000–90002005 (1732)6.30
B557000–90001997 (1724)6.20
C547000–90001993 (1720)6.15
D537000–90001988 (1715)6.12
Table 2. Chemical compositions of the slag at the beginning of refining (mass%).
Exp.CaF2Al2O3CaOMgOSiO2MnOFeOP
A30.8931.8031.765.391.830.100.270.009
B38.5343.8313.073.981.410.120.320.012
C55.7235.897.380.231.450.160.380.012
D62.1532.584.420.101.200.180.430.017
Table 3. Chemical compositions of electrode and ingots (mass%).
Exp.Compositions in ElectrodeCompositions at Bottom of Ingot
[Als][Si][Mn][P][Als][Si][Mn][P]
A0.0400.330.620.0110.0340.220.610.0123
B0.0400.330.620.0110.0290.280.600.0140
C0.0400.320.620.0140.0200.300.580.0166
D0.0400.320.620.0140.0170.310.590.0201
Table 4. The related parameters used in the model.
ParametersMetal FilmDroplet in Slag PoolMetal Pool
kP,m cm/s0.00910.100.018
kP,s cm/s0.00370.0220.0042
Temperature, (K/°C)1815 (1542)2020 (1747)1957 (1684)
Am/Vm, cm−170240.15
Residence time, s2.890.23-