Article

Leaching Kinetics of Sulfides from Refractory Gold Concentrates by Nitric Acid

by
Denis A. Rogozhnikov
,
Andrei A. Shoppert
*,
Oleg A. Dizer
,
Kirill A. Karimov
and
Rostislav E. Rusalev
Department of Non-ferrous Metals Metallurgy, Ural Federal University, Yekaterinburg 620002, Russia
*
Author to whom correspondence should be addressed.
Metals 2019, 9(4), 465; https://doi.org/10.3390/met9040465
Submission received: 5 April 2019 / Revised: 19 April 2019 / Accepted: 19 April 2019 / Published: 22 April 2019
(This article belongs to the Special Issue Leaching Kinetics of Valuable Metals)

Abstract

:
The processing of refractory gold-containing concentrates by hydrometallurgical methods is becoming increasingly important due to the depletion of rich and easily extracted mineral resources, as well as due to the need to reduce harmful emissions from metallurgy, especially given the high content of arsenic in the ores. This paper describes the investigation of the kinetics of HNO3 leaching of sulfide gold-containing concentrates of the Yenisei ridge (Yakutia, Russia). The effect of temperature (70–85 °C), the initial concentration of HNO3 (10–40%) and the content of sulfur in the concentrate (8.22–22.44%) on the iron recovery into the solution was studied. It has been shown that increasing the content of S in the concentrate from 8.22 to 22.44% leads to an average of 45% increase in the iron recovery across the entire range temperatures and concentrations of HNO3 per one hour of leaching. The leaching kinetics of the studied types of concentrates correlates well with the new shrinking core model, which indicates that the reaction is regulated by interfacial diffusion and diffusion through the product layer. Elemental S is found on the surface of the solid leach residue, as confirmed by XRD and SEM/EDS analysis. The apparent activation energy is 60.276 kJ/mol. The semi-empirical expression describing the reaction rate under the studied conditions can be written as follows: 1/3ln(1 − X) + [(1 − X)−1/3 − 1] = 87.811(HNO3)0.837(S)2.948e−60276/RT·t.

1. Introduction

Russia possesses large reserves of gold—more than 14 thousand tons—which exceeds the reserves of the world’s main producers, China and Australia, and is slightly inferior to South Africa and Canada. The Russian Federation accounts for 8% of the total world gold production and is among the three largest global producers of the precious metal. Gold-sulfide-quartz and gold-arsenic-sulfide deposits occupy a leading position in the structure of Russia’s reserves; the quality of ores is comparable to the world objects of this type [1]. Very important are gold-polysulfide deposits, characterized by relatively high concentrations of gold (3.5–7 gpt).
At the same time, there is a global problem in the metallurgical industry that the quality of processed raw materials is deteriorating due to the depletion of mineral reserves and the extraction of the richest and most easily extractable ore layers. As a result, there is a need to engage poorer and more refractory ores, which are often not amenable to traditional enrichment methods.
The deterioration of ore quality, especially with the transition to the production of lower horizons, occurs in terms of reduction of metal content as well as in terms of increasing proportion of ores with fine and emulsive impregnation of sulfides in one another and the latter in waste minerals.
The share of gold ores of non-ferrous metals, where gold is an associated valuable component, accounts for 18% of the global reserves [2]. Among them, a special place belongs to ores from which gold cannot be extracted by traditional technologies.
Refractory gold-containing ores refer to materials, the extraction of gold from which by cyanidation is low or requires significant amounts of energy and reagents [3].
Currently, it is considered proven that the refractory characteristics of gold associated with sulfides is not only due to the presence of nanoparticles of native gold [4,5,6,7], but also due to the existence of solid solution, colloidal particles, surface gold [8,9,10,11]. The size of such “invisible” gold may be on the order of nanometers, which explains why it is impossible to extract it by cyanidation, even with the use of ultrafine grinding. It has also been established that in pyrite, which is one of the main carriers of gold in refractory ores, the content of “invisible” gold is greater proportionately to the higher content of arsenic in pyrite and to the finer grain. For example, in the ores of the Twin Creeks deposit, relatively coarse-grained pyrite (10–30 µm) is associated with the lowest arsenic and gold contents (less than 1% As and 17–60 g/t Au), while fine-grained pyrites (less than 2 µm) are the highest (1–2.4% As and 600–1500 g/t Au) [12].
Also important in the detection of “invisible” gold in pyrite grains is the uneven distribution of As and Au over the grain section. A thin peripheral layer of pyrite grain is enriched with arsenic, forming the so-called arsenic pyrite Fe(As,S)2. It tends to contain most of the gold [13].
The nature of the chemical bond of gold, which is in the form of a solid solution in arsenic pyrite, has not been fully established and is the subject of discussion [12,14].
Invisible gold may also exist in arsenopyrite in the simple form of nanoparticles (Au0) and in the oxidized state (Au1+), and their ratio may vary significantly. For example, in the arsenopyrite deposits Jinya (China) [15], Elmtree (Canada) [16], Sao Bento (Brazil) [8] and Sheba (South Africa) [8,16] solid gold (Au1+) is the predominant form as compared with nanogold (Au0). On the contrary, arsenopyrite of the Olimpiadinskoe deposit (Russia) [17] contains “invisible” gold mainly in the form of nanoparticles (Au0) [10].
Traditional methods of processing such refractory materials consist in the oxidation of gold-containing minerals (pyrite or arsenopyrite) in order to destroy their crystal lattice and release the gold particles by oxidative roasting [18]. This process is associated with the oxidation of iron-containing sulfides and converting arsenic to the gaseous phase. At the same time, arsenic is one of the most dangerous and carcinogenic elements [19,20,21,22,23,24] and its content in drinking water in several countries already exceeds the concentration recommended by the World Health Organization (WHO) and the United States Environmental Protection Agency (USEPA) [25,26]. Therefore, hydrometallurgical methods of sulfide oxidation have been widely implemented in recent years. The most common of them are pressure and bacterial oxidation, and leaching after fine grinding [27].
One of the possible methods of hydrometallurgical processing of refractory sulfide raw materials is the use of HNO3 to oxidize the materials without the use of high pressure or fine grinding [28,29,30,31], as nitric acid is one of the most effective oxidizing and leaching agents [32,33].
Among the most famous technologies based on the use of HNO3: NSC-process (nitrogen species-catalyzed pressure leaching), implemented in 1984–1995 at the Sunshine plant in the USA [34]; NITROX (in atmosphere air) and ARSENO PROCESS® (use of compressed oxygen) [35]; a subspecies of ARSENO, the REDOX PROCESS® (at above 180 °C to eliminate the formation of elemental S) [36]; the HMC process (a mixture of salts of nitric and hydrochloric acids) [37]; the Caschman process and its modification Artek Caschman, which aims to process gold-containing arsenic materials using chlorine-containing reagents [3]. However, none of these is currently used commercially for one reason or another.
Therefore, it seems relevant to conduct further studies of alternative energy saving and environmentally efficient hydrometallurgical technologies for processing sulfide gold-containing raw materials using HNO3. There are only a few published works devoted to the theoretical aspects of HNO3 leaching of sulfide gold-containing concentrates [38], which demonstrates the need for additional investigation using other types of concentrates with different mineralogical compositions. At the same time, there is a sufficient amount of work showing that various types of leaching reactions of raw materials with HNO3 can be described quite accurately using the shrinking core model [39,40,41,42,43], which makes it possible to obtain more data on the limiting stages of the reactions.
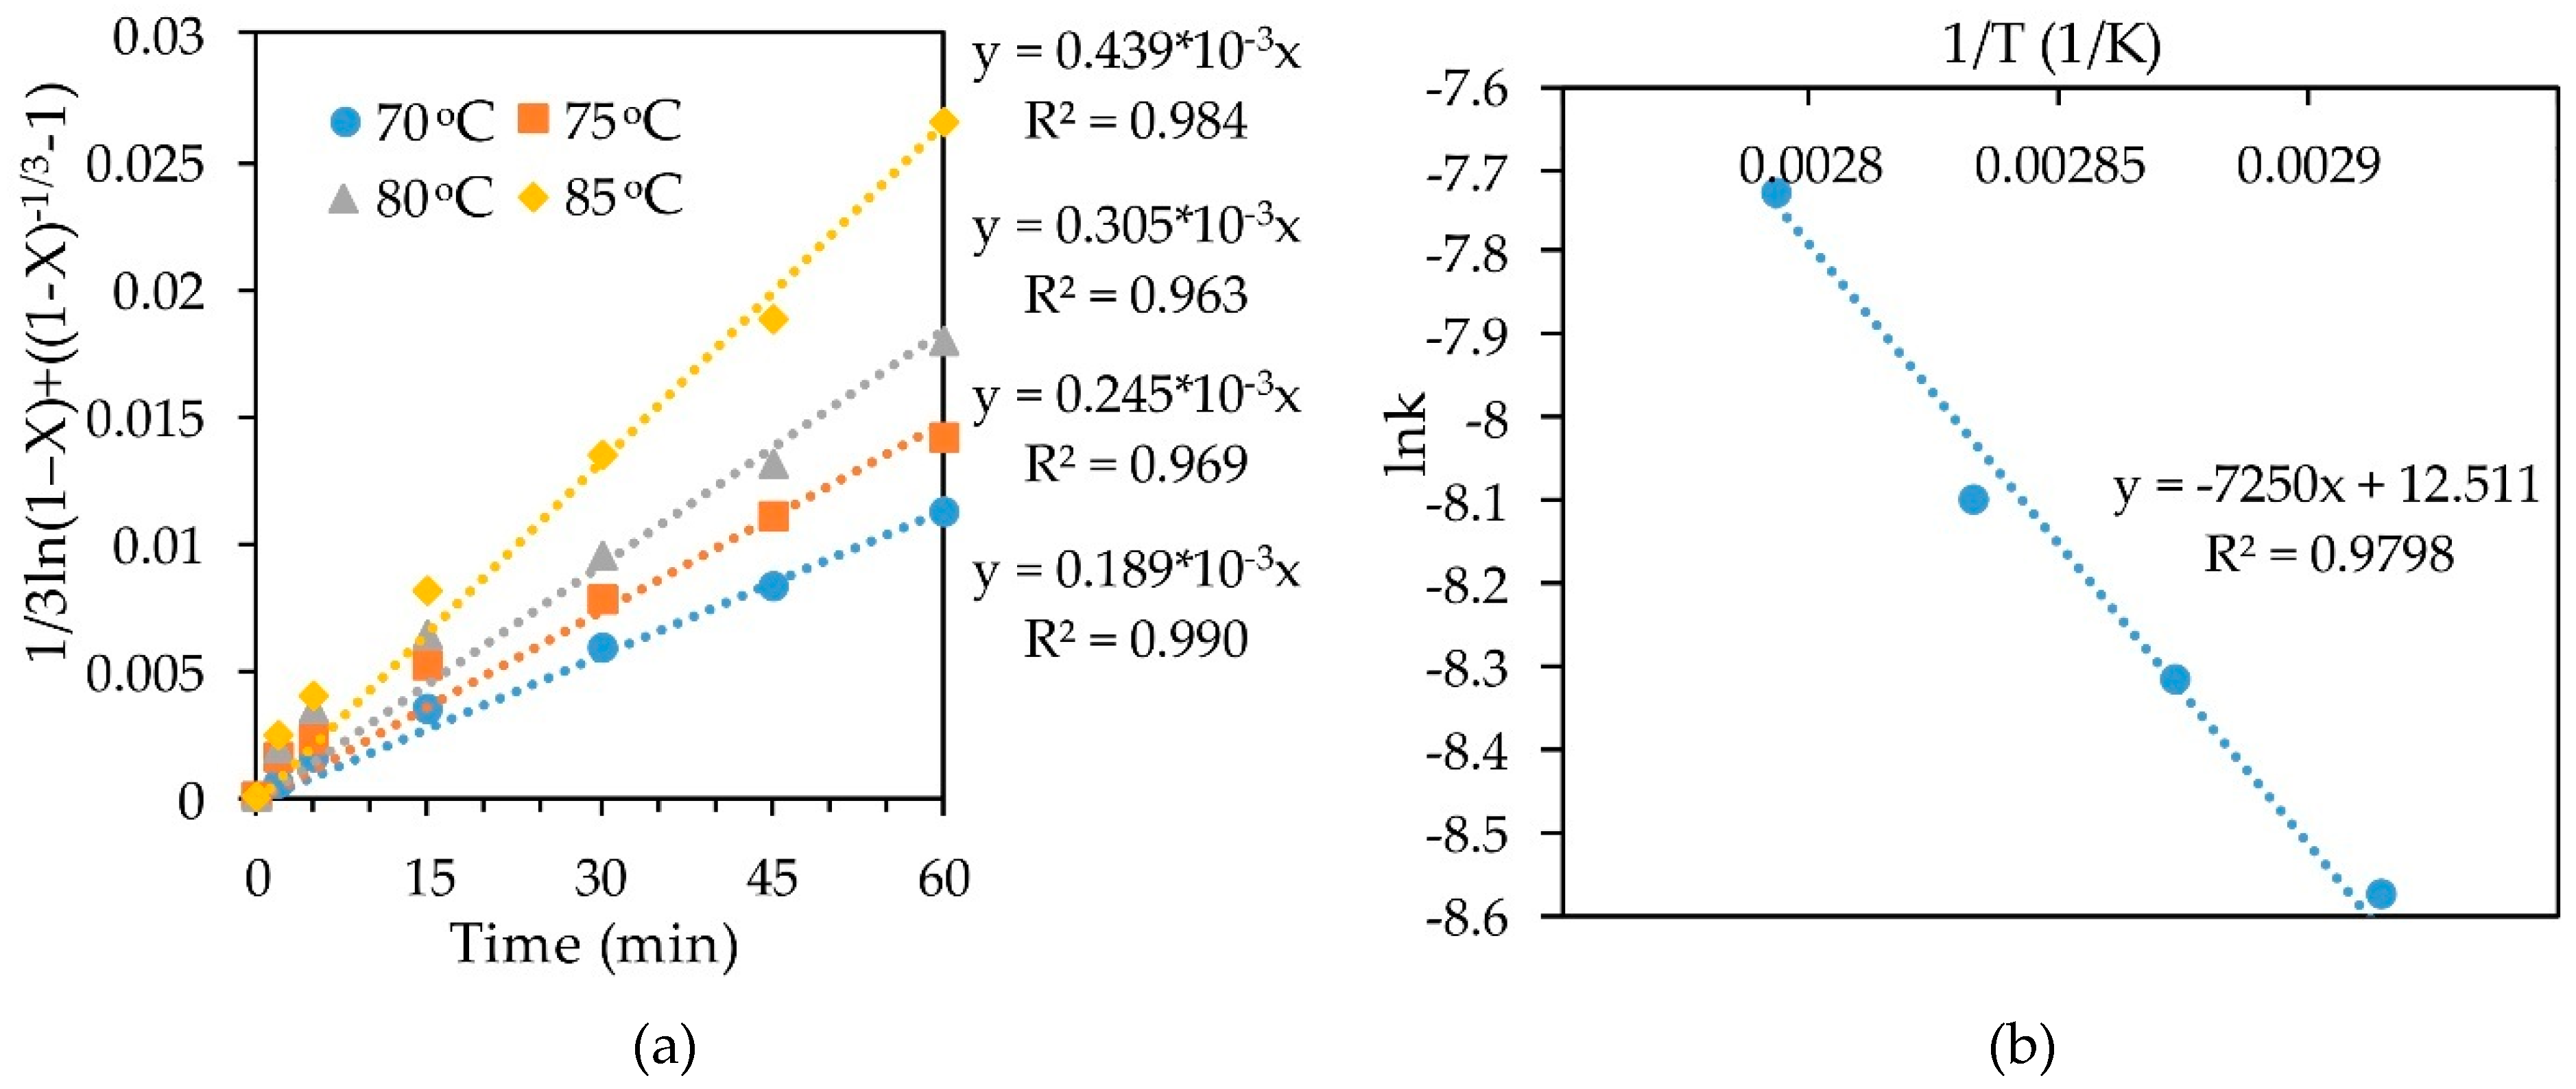
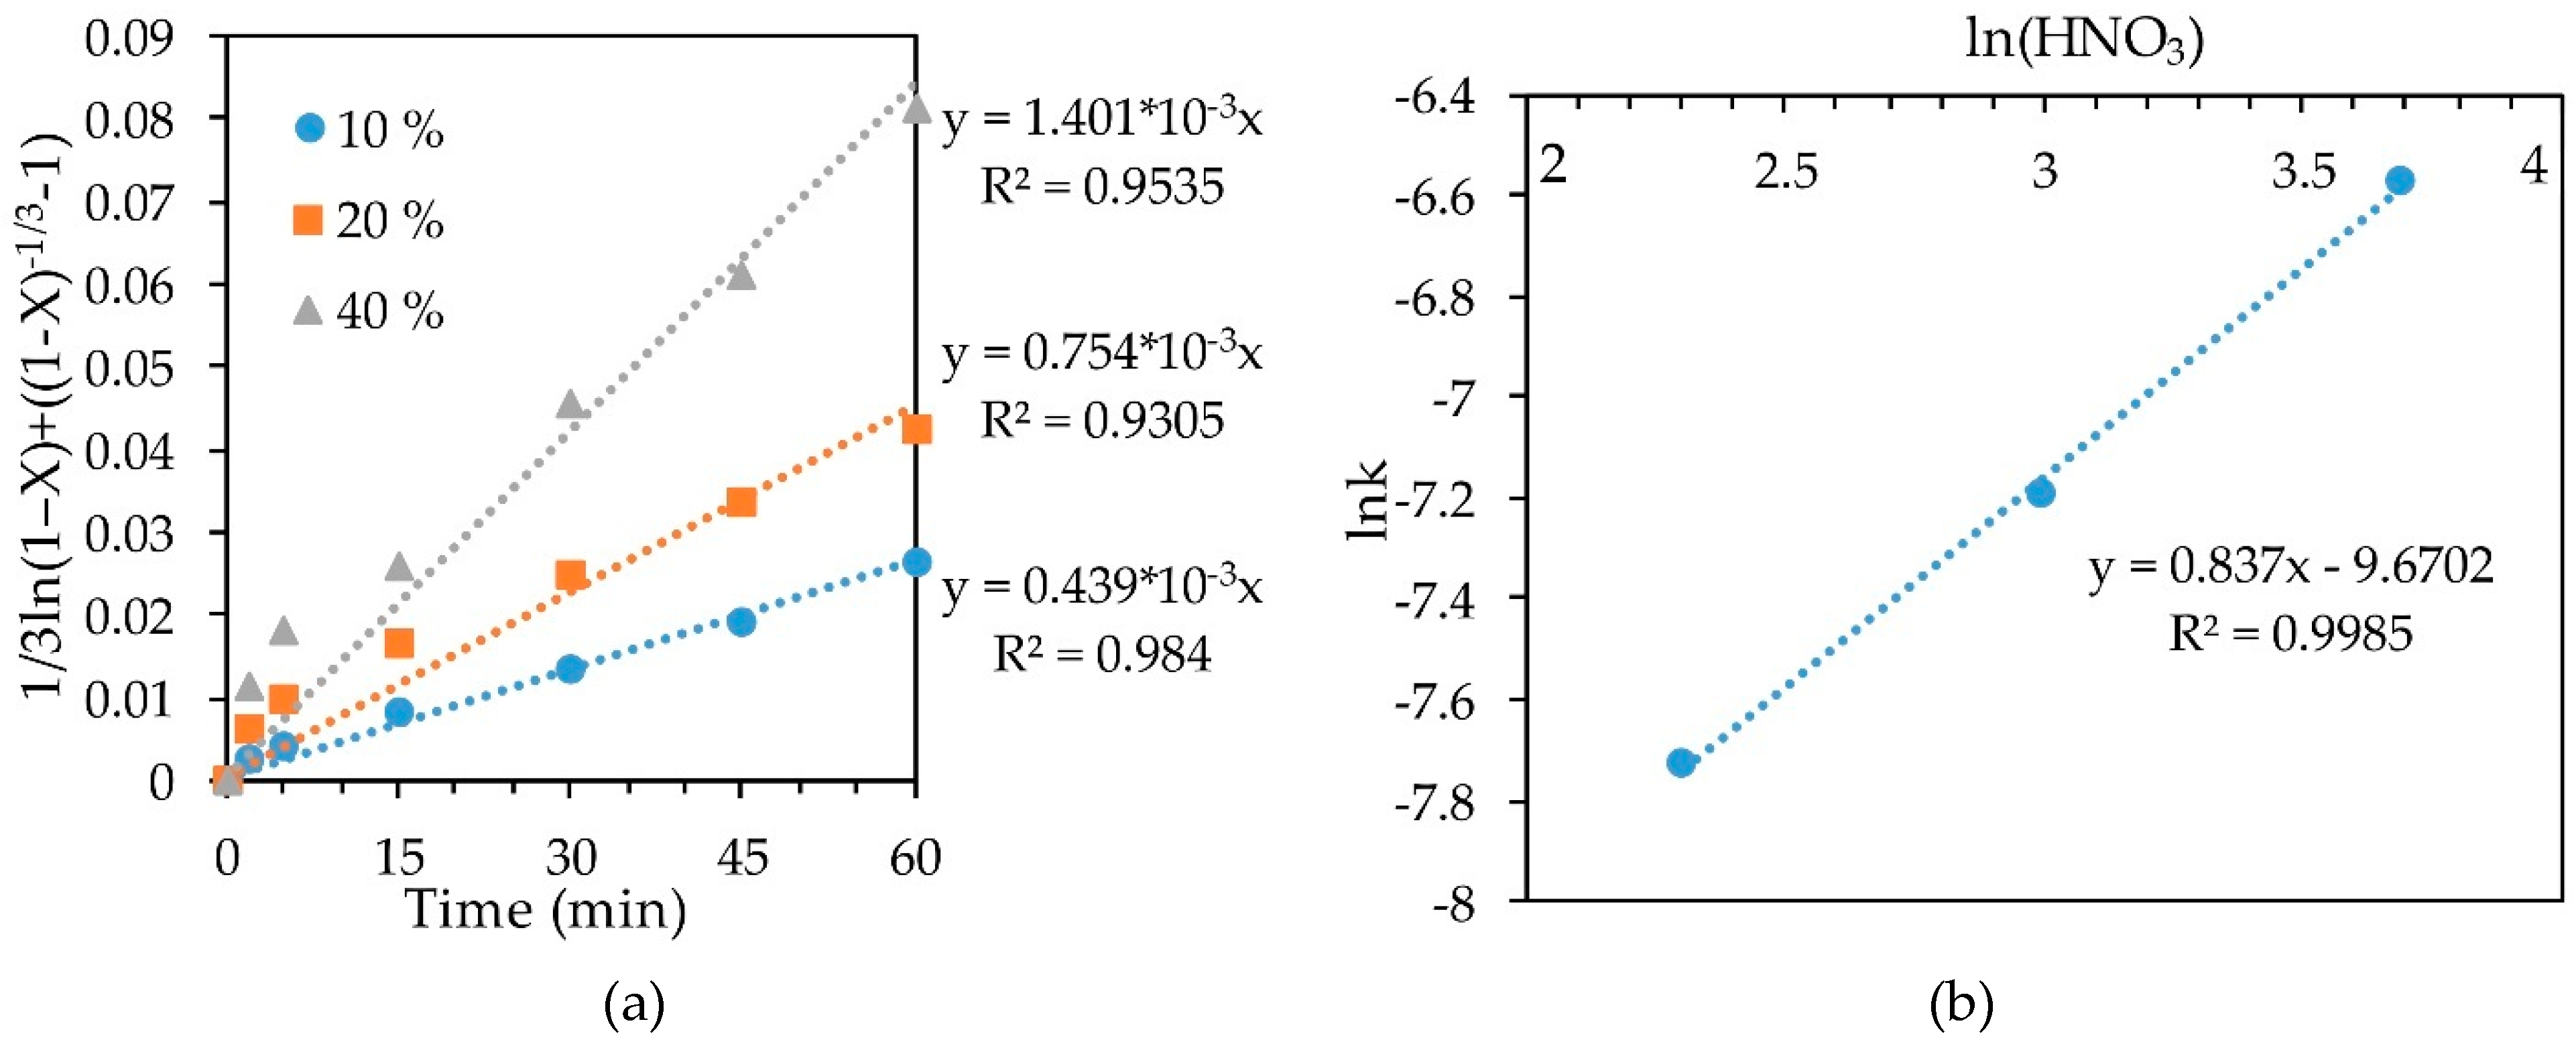
Considering the above factors, this paper studies the kinetics of HNO3 leaching of refractory gold-containing concentrates with the use of shrinking core models, focusing on the role of temperature, concentration of HNO3, which, in our opinion, has not been sufficiently studied theoretically or practically. Particular attention is paid to the initial content of sulfur in the raw materials as one of the most important factors affecting the intensity, completeness and kinetic characteristics of the leaching process.

2. Materials and Methods

2.1. Analisys

The chemical analysis of the original materials and the resulting solid products of the studied processes was performed using an Axios MAX X-ray fluorescence spectrometer (XRF) (Malvern Panalytical Ltd., Almelo, Netherlands). The chemical analysis of the obtained solutions was performed by mass spectrometry with inductively coupled plasma (ICP-MS) using an Elan 9000 instrument (PerkinElmer Inc., Waltham, MA, USA). The phase analysis was performed on an XRD 7000 Maxima diffractometer (Shimadzu Corp., Tokyo, Japan).
Scanning electron microscopy with microprobe energy dispersive analysis was performed using a JSM-6390LV microscope (JEOL Ltd., Tokyo, Japan) with the INCA Energy 450 X-Max 80 adaptor, with an accelerating voltage of 20 kV.
The study on the distribution of gold in sulfide minerals was carried out using inductively coupled plasma mass spectrometry (LA-ICP-MS—NexION 300S quadrupole mass spectrometer, PerkinElmer Inc., Waltham, MA, USA) with laser ablation of the sample with the NWR 213 adaptor for a Jeol JSM-6390LV.

2.2. Experiments

Laboratory experiments on HNO3 leaching were carried out on an apparatus consisting of a 2 dm3 borosilicate glass round bottom reactor (Lenz Laborglas GmbH & Co. KG, Wertheim, Germany), with openings for injecting HNO3, as well as for temperature control and removal of nitrous gases through a water-cooled reflux condenser. The reactor was thermostated. The materials were stirred using an overhead mixer at 400 rpm, which ensured uniform density of the pulp. A portion of the concentrate weighing 60 g was added to a prepared solution of HNO3 of a required concentration. At the end of the experiment, the leaching pulp was filtered in a Buchner funnel (ECROSKHIM Co., Ltd., St. Petersburg, Russia); the solutions were sent for ICP-MS analysis; the leaching cake was washed with distilled water, dried at 100 °C to constant weight, weighed and sent for XRF analysis. All the experiments were performed three times and the mean values are presented here.
To trap the nitrous gases formed during the leaching process and to regenerate HNO3, we used a system consisting of three successively connected absorption columns filled with distilled water and a sanitary column with a solution of thiourea to recover the residual amount of oxides to elemental nitrogen.

2.3. Materials and Reagents

The materials used in the study are three samples of refractory gold-containing sulfide flotation concentrates (size 90% less than 74 microns) from a Russian deposit of Yenisei ridge (Yakutia), obtained under different enrichment conditions. The compositions of the samples are presented in Table 1. The chemical agents were of analytical grade; the water had been purified by distillation using a GFL-manufactured device (GFL mbH, Burgwedel, Germany).
Figure 1 shows the X-ray diffraction pattern of the phase composition of the original concentrate-3. Table 2 presents the results of the mineralogical composition study of the concentrate samples. The results were obtained in X-ray phase analysis and X-ray microanalysis.
Figure 2 presents a general view of concentrate-3 in backscattered electrons. The red dots indicate the place of LA-ICP-MS analysis; the analytical point diameter is 25 microns.
The study showed the almost complete absence of gold in antimonite. The concentration of gold in pyrite is fairly evenly distributed and does not exceed 16 gpt. The arsenopyrite distribution is uneven. The gold content ranges from 1 to 172 gpt (Table 3).

3. Results and Discussion

3.1. Chemistry of HNO3 Leaching

As shown by the results of the LA-ICP-MS method with the NWR 213 adaptor, a characteristic feature of the material is that most of the gold is enclosed in finely disseminated form in the crystalline lattice of pyrite and arsenopyrite. Therefore, the main goal of the process is to reveal these two sulfide minerals. Their interaction with HNO3 can follow these typical reactions (Equations (1)–(7)):
FeS2 + 8HNO3 = Fe(NO3)3 + 2H2SO4 + 2H2O + 5NO,
2FeS2 +10HNO3 = Fe2(SO4)3 + H2SO4 + 4H2O + 10NO,
FeS2 + 18HNO3 = Fe(NO3)3 + 7H2O + 2H2SO4 + 15NO2,
2FeS2 + 8HNO3 = Fe2(SO4)3 + S0 + 8NO + 4H2O,
FeAsS + 17HNO3 = Fe(NO3)3 + H3AsO4 + H2SO4 + 14NO2 + 6H2O,
FeAsS + 14HNO3 = FeAsO4 + H2SO4 + 14NO2 + 6H2O,
3FeAsS + 12HNO3 = 3FeAsO4 + 2H2SO4 + S0 + 12NO + 4H2O.
In addition, at the initial moment, NO+ ions could be formed, which, according to Anderson et al. [44], acts as the strongest oxidizer in such systems.
Previously, we had studied the thermodynamic characteristics for the above interactions [33]. The study found that the oxidation potential of the system is to be maintained at 0.6 V or higher for reactions with transfer of iron and arsenic into the solution. A high oxidation potential is also necessary for the sulfide S2− to be oxidized into sulfate SO42− with minimized formation of elemental S0 that impedes a more complete oxidation of sulfide minerals and reduces subsequent recovery of gold. The results of the performed thermodynamic studies and laboratory experiments allowed us to establish the ranges of the leaching process parameters: temperature of 70–100 °C, acid concentration of 10–60% at L:S 20:1. Lower values of L:S are also possible; however, it was previously found that at low values of L:S and a high acid concentration, the reaction is very intense, which impedes temperature control, while the degree of extraction in this case changes slightly [33].

3.2. The Effect of Process Parameters on the Oxidation of Sulfides

According to Table 1 and Table 2 and Figure 1, it is obvious that the concentrates studied in this work differ greatly in the content of sulfides; therefore, the study considered only the kinetics of HNO3 leaching of each of the concentrates. The effect of temperature, HNO3 concentration and sulfur content on iron extraction in HNO3 leaching is shown in Figure 3. Iron recovery was considered as the main component indicating the degree of sulfide oxidation, as it is included in both pyrite and arsenopyrite. For each of the concentrates, experiments were carried out at three different HNO3 concentrations and at four temperatures. Figure 3a–c, for example, shows the kinetic leaching curves of concentrate-1 at a concentration of nitric acid of 10, 20 and 40%, respectively, that could be used to evaluate the influence of HNO3 concentration on leaching efficiency. It is possible to evaluate the influence of sulfur content in concentrate on the oxidation of sulfides, for example, by comparing Figure 3a,d,g.
It can be concluded that temperature has a significant effect on iron recovery. Increasing the temperature from 70 to 85 °C effected an increase in iron extraction from concentrate-1 from 35.53 to 48.52% after 1 h of leaching with a 10% solution of HNO3. A similar effect of temperature on iron extraction was observed for all types of concentrates and HNO3 concentrations.
It is obvious that the increase in the concentration of nitric acid should accelerate the reaction rate of sulfide oxidation, since the excess acid facilitates the diffusion of the reagent to the reaction interface. The data on Figure 3 allows one to conclude that the concentration of HNO3 has approximately the same effect on iron extraction as temperature. Increasing the concentration of HNO3 from 10 to 40% for all temperatures and concentrates can increase the degree of iron extraction by an average of 20%.
The sulfur content in the concentrate has the greatest effect on the extraction of iron. Thus, an increase in sulfur content from 8 to 22% makes it possible to increase iron recovery into the solution by an average of 45% at all temperatures and concentrations of HNO3. This is most likely due to the fact that the increase in the content of sulfides in the raw material make easier the diffusion of the reagent to them even on the last stage of the process.
Thus, particular parameters must be in place to achieve a more complete extraction of iron, and accordingly, the oxidation of sulfides for different samples of the concentrate. For example, a low-sulfur concentrate requires the maximum temperature at a high concentration of HNO3, while for a high-sulfur concentrate, a temperature of 70 °C and a 10% HNO3 solution is sufficient.

3.3. Characteristics of Solid Residue

The cake obtained as a result of HNO3 leaching of the samples was subjected to scanning electron microscopy to study changes in the morphology of the sample in the course of the leaching process. Figure 4 shows micrographs of the original sample and the cake obtained by leaching.
As can be seen from Figure 2 and Figure 4a, the original concentrate consists of particles ranging in size from 1 to 100 μm, and the surface of the particles is rather smooth. In the course of leaching (Figure 4b), a large number of cavities form on the surface of the particles, which is associated with the dissolution of sulfide minerals. Figure 5 shows micrographs of solid residue of concentrate-3 (points 001-010) and concentrate-1 (points 011-019), differing by the degree of extraction.
Energy dispersive spectroscopy was used to determine the chemical composition at different points of the samples (Table 4).
The measurement results in Table 4 confirm the presence of a large amount of unoxidized sulfides in the cake of the first sample and the almost complete absence of sulfur in the second cake, which agrees well with the results of the analysis of the liquid phase. Therefore, the surface of the particles of the concentrate-3 cake does not have a layer formed by the reaction product, elemental sulfur, which is also confirmed by the results of X-ray phase analysis, as shown in Figure 6. The absence of the reaction product on the surface of the concentrate-3 solid residue also explains the faster kinetics of leaching of the concentrate with high sulfur content because diffusion limitation is lower in this case. The absence of elemental sulfur could be attributed to the high intensity of the process, amount of the heat of exothermic reactions and the amount of gas produced that can lead to a higher oxidation potential.

3.4. Kinetic Model

Since the degree of sulfide oxidation is greatly influenced by the temperature and concentration of HNO3, the leaching of refractory gold-containing concentrates with HNO3 can be controlled by diffusion as well as by kinetic stages. That is, the slowest stage can be the reagent diffusion towards the reaction surface as well as the chemical reaction itself. To determine the limiting step, it is necessary to conduct a study of the kinetics.
The shrinking core model (SCM) is generally used to describe the kinetics of heterogeneous reactions involving non-porous materials. The SCM assumes that the process rate is controlled either by the diffusion of the reactant to the surface through the diffusion layer (a liquid film), or by the diffusion through the product layer, or by a surface chemical reaction. During leaching, the inert layer of solids shrinks toward the center. A porous film of the reaction product is formed around the inert core.
The slowest stage with the greatest resistance is the limiting step, and its intensification allows to increase the leaching efficiency.
The equations describing the several limiting stages of SCM [45] are given in Table 5. A large number of studies [40,42] show that the new version of SCM proposed by Dickenson and Heal [46] may be preferable to describe the kinetics of leaching reactions controlled by interfacial transfer and diffusion through the product layer (Equation (7) in Table 5).
According to Equation (7) in Table 5, if the interfacial transfer and diffusion through the product layer represent the limiting stage, then the function 1/3ln(1 − X) + [(1 − X)−1/3 − 1] on the time “t” will be a straight line with the slope angle “k”.
For the kinetic analysis using SCM, the equations for leaching of refractory gold-containing concentrate-1 at a 10% concentration of HNO3, presented in Table 5, were evaluated. The obtained data made it possible to determine the correlation coefficient (R2) showing the average square deviation of the experimental data from the straight line. The results of the calculations are shown in Table 6.
As can be seen from the data obtained, SCM Equations (4)–(6) in Table 6 are poorly suited to describing these leaching reactions, since the correlation coefficient is less than 0.9. It is also obvious that the kinetic data best of all correspond to the new shrinking core model at all temperatures, which indicates diffusion limitations during leaching reactions.
The slope k for each straight line obtained by substituting the experimental data of leaching concentrate-1 with a 10% HNO3 solution into the SCM Equation (Figure 7a) was calculated. Then Arrhenius plots for the dependence of lnk on inverse temperature (Figure 7b) were used. Building a straight line y = ax + b in this plane of coordinates made it possible to find the coefficient a, which determines the slope of straight line. Knowing the slopes in these coordinates, allowed to find the apparent activation energy of 60.276 kJ/mol, using Arrhenius law. According to the literature data [39,47], a high value of the activation energy is not always representative of the kinetic controlled reaction.
The slope of the straight lines (Figure 8a) obtained by substituting the concentrate-1 leaching results into the SCM equation at 70 °C at various concentrations of HNO3 was plotted as lnk-ln(HNO3) to determine the order with respect to nitric acid (Figure 8b). The resulting empirical order with respect to nitric acid concentration was 0.837.
In the same way, we determined the empirical order with respect to sulfur content in the concentrate by plotting the dependence lnk-lnS for leaching various concentrates with a 10% solution of nitric acid at 70 °C (Figure 9). The order with respect to sulfur was 2.948, which confirms the conclusions about the pronounced effect of the sulfide content in the concentrate on the degree of iron recovery.
Substituting the Arrhenius equation (Equation (8)) into the equation of the new SCM model (Equation (7) in Table 5) gives Equation (9).
k = koeEa/RT,
1/3ln(1 − X) + [(1 − X)−1/3 − 1] = koe−Ea/RT·t.
In Equation (9), the Arrhenius constant ko depends on the initial parameters of the process, including the initial sulfur content in the concentrate and the concentration of HNO3 in the initial solution; hence, Equation (9) can be represented as follows (Equation (10)).
1/3ln(1 − X) + [(1 − X)−1/3 − 1] = ko(HNO3)n(S)me-Ea/RT·t,
where n and m are orders of concentration of HNO3 and sulfur content in the original concentrate, respectively.
Based on the previously obtained results, the following equation for leaching refractory gold-containing concentrate with HNO3 (Equation (11)) can be derived:
1/3ln(1 − X) + [(1 − X)−1/3 − 1] = ko(HNO3)0.837(S)2.948e−60276/RT·t.
Building off the Arrhenius plots for all temperatures, HNO3 concentrations and concentrates gives coefficients b of straight lines at a fixed slope a = 7250. The obtained values of the “b” coefficients and the corresponding correlation coefficients R2 are shown in Table 7. To determine ko, an exponent from the “a” coefficient was taken, and then it was divided by (HNO3)0.837(S)2.948. The determined average ko value was 87.811.
Substituting this value into Equation (11) gives the following empirical equation describing the leaching process under study (Equation (12)):
1/3ln(1 − X) + [(1 − X)−1/3 − 1] = 87.811(HNO3)0.837(S)2.948e−60276/RT·t,
Table 8 shows the calculated correlation coefficient (R2) of experimental data and data obtained using Equation (12). As can be seen from the table, the obtained empirical expression shows a high degree of convergence with experimental data at almost all temperatures, concentrations of HNO3 and sulfur contents in the concentrate.

4. Conclusions

The kinetics of dissolution of refractory sulfide gold-containing concentrates by a solution of HNO3 in the temperature range of 70–85 °C was investigated. The data obtained allowed one to draw the following conclusions:
Increasing the temperature from 70 to 85 °C effected an increase in iron extraction from concentrate-1 from 35.53 to 48.52% after 1 h of leaching with a 10% solution of HNO3. Increasing the concentration of HNO3 from 10 to 40% has same effect. Changing sulfur content in the concentrate produces a much greater effect. The highest degree of iron recovery in 1 h for high-sulfur concentrate was 98.10%, while recovery from low-sulfur concentrate under the same conditions was 67.83%.
EDS and XRD showed elemental sulfur and non-leached arsenopyrite in the residue from leaching of low-sulfur concentrate, while quartz was the main phase in the residue from leaching of high-sulfur concentrate.
The iron recovery from the concentrate is well described by a new shrinking core model, which suggests that the speed of the process is controlled by interfacial diffusion and diffusion through the product layer. The calculated apparent activation energy was 60.276 kJ/mol, and the reaction order with respect to the initial concentration of HNO3 was 0.837; the reaction order with respect to the initial S content in the concentrate was 2.948. The obtained data allowed us to derive a semi-empirical equation describing the leaching kinetics of iron:
1/3ln(1 − X) + [(1 − X)−1/3 − 1] = 87.811(HNO3)0.837(S)2.948e−60276/RT·t
Comparison of the experimental data obtained in the whole range of the studied parameters and the derived equation showed high convergence of the results. Thus, it can be concluded that the increase of sulfur content in the concentrate can be used to ensure more energy-efficient oxidation of sulfide minerals. The focus of our further research will be the study of HNO3 regeneration and methods of arsenic disposal in the form of environmentally friendly compounds. The new study will aim at finding the optimal conditions for the process and could lay the basis for the development of an alternative commercial technology.

Author Contributions

Conceptualization, D.A.R.; methodology, K.A.K. and A.A.S.; validation, O.A.D., R.E.R.; formal analysis, K.A.K., D.A.R.; investigation, A.A.S. and O.A.D.; resources, R.E.R., D.A.R.; data curation, D.A.R.; writing—original draft preparation, A.A.S.; writing—review and editing, K.A.K., D.A.R.; visualization, R.E.R., O.A.D.; supervision, A.A.S.; project administration, D.A.R.; funding acquisition, D.A.R.

Funding

The research was funded by the Russian Science Foundation, grant number 18-19-00186. The SEM/EDS and microprobe analysis were funded by State Assignment, grant number 11.4797.2017/8.9.

Acknowledgments

Ekaterinburg Non-Ferrous Metal Processing Plant JSC are acknowledged for providing materials. Technicians at Ural Branch of Russian Academy of Sciences are acknowledged for their assistance with XRD, XRF, SEM, EDS, and ICP-MS analysis.

Conflicts of Interest

The authors declare no conflict of interest. The funders had no role in the design of the study; in the collection, analyses, or interpretation of data; in the writing of the manuscript, or in the decision to publish the results.

References

  1. Genkin, A.D.; Wagner, F.E.; Krylova, T.L.; Tsepin, A.I. Gold-bearing arsenopyrite and its formation condition at the Olympiada and Veduga gold deposits (Yenisei Range, Siberia). Geol. Ore Deposits 2002, 44, 52–68. [Google Scholar]
  2. Strižko, L.S. Metallurgija zolota i sereba; Misis: Moskva, Russia, 2001; ISBN 978-5-87623-083-6. (In Russian) [Google Scholar]
  3. Vikentyev, I.V. Invisible and microscopic gold in pyrite: Methods and new data for massive sulfide ores of the Urals. Geol. Ore Deposits 2015, 57, 237–265. [Google Scholar] [CrossRef]
  4. Marsden, J.; House, I. The Chemistry of Gold Extraction, 2nd ed.; Society for Mining, Metallurgy, and Exploration: Littleton, CO, USA, 2006; ISBN 978-0-87335-240-6. [Google Scholar]
  5. Majzlan, J.; Chovan, M.; Andráš, P.; Newville, M.; Wiedenbeck, M. The nanoparticulate nature of invisible gold in arsenopyrite from Pezinok (Slovakia). Neues JB. Miner. Abh. 2010, 187, 1–9. [Google Scholar] [CrossRef]
  6. Palenik, C.S.; Utsunomiya, S.; Reich, M.; Kesler, S.E.; Wang, L.; Ewing, R.C. “Invisible” gold revealed: Direct imaging of gold nanoparticles in a Carlin-type deposit. Am. Mineral. 2004, 89, 1359–1366. [Google Scholar] [CrossRef]
  7. Yang, S.; Blum, N.; Rahders, E.; Zhang, Z. The nature of invisible gold in sulfides from the Xiangxi Au-Sb-W ore deposit in northwestern Hunan, People’s Republic of China. Can Mineral. 1998, 36, 1361–1372. [Google Scholar]
  8. Cabri, L.J.; Newville, M.; Gordon, R.A.; Crozier, E.D.; Sutton, S.R.; McMahon, G.; Jiang, D.-T. Chemical speciation of gold in arsenopyrite. Can. Mineral. 2000, 38, 1265–1281. [Google Scholar] [CrossRef]
  9. Chen, T.T.; Cabri, L.J.; Dutrizac, J.E. Characterizing gold in refractory sulfide gold ores and residues. JOM 2002, 54, 20–22. [Google Scholar] [CrossRef]
  10. Chryssoulis, S.L.; McMullen, J. Mineralogical investigation of gold ores. In Developments in Mineral Processing; Elsevier: Amsterdam, The Netherlands, 2005; Volume 15, pp. 21–71. ISBN 978-0-444-51730-2. [Google Scholar]
  11. Nabojčenko, S.S. (Ed.) Avtoklavnaja gidrometallurgija cvetnych metallov; GOU UGTU-UPI: Ekaterinburg, Russia, 2002; ISBN 978-5-321-00065-6. (In Russian) [Google Scholar]
  12. Simon, G.; Kesler, S.E.; Chryssoulis, S. Geochemistry and textures of gold-bearing arsenian pyrite, Twin Creeks, Nevada; implications for deposition of gold in carlin-type deposits. Econ. Geol. 1999, 94, 405–421. [Google Scholar] [CrossRef]
  13. Fleet, M.E.; Mumin, A.H. Gold-bearing arsenian pyrite and marcasite and arsenopyrite from Carlin Trend gold deposits and laboratory synthesis. Am. Mineral. 1997, 82, 182–193. [Google Scholar] [CrossRef]
  14. Tauson, V.L. Gold solubility in the common gold-bearing minerals: Experimental evaluation and application to pyrite. Eur. J. mineral. 1999, 11, 937–948. [Google Scholar] [CrossRef]
  15. Zhou, Y.; Wang, K. Gold in the Jinya Carlin-type Deposit: Characterization and Implications. JMMCE 2003, 2, 83–100. [Google Scholar] [CrossRef]
  16. Cabri, L.; Chryssoulis, S.L.; Villiers, J.; Laflamme, J.H.G.; Buseck, P.R. The nature of “invisible” gold in arsenopyrite. Can. Mineral. 1989, 27, 353–362. [Google Scholar]
  17. Genkin, A.D.; Bortnikov, N.S.; Cabri, L.J.; Wagner, F.E.; Stanley, C.J.; Safonov, Y.G.; McMahon, G.; Friedl, J.; Kerzin, A.L.; Gamyanin, G.N. A multidisciplinary study of invisible gold in arsenopyrite from four mesothermal gold deposits in Siberia, Russian Federation. Econ. Geol. 1998, 93, 463–487. [Google Scholar] [CrossRef]
  18. Liu, X.; Li, Q.; Zhang, Y.; Jiang, T.; Yang, Y.; Xu, B.; He, Y. Improving gold recovery from a refractory ore via Na2SO4 assisted roasting and alkaline Na2S leaching. Hydrometallurgy 2019, 185, 133–141. [Google Scholar] [CrossRef]
  19. James, K.A.; Meliker, J.R.; Nriagu, J.O. Arsenic. In International Encyclopedia of Public Health (Second Edition); Quah, S.R., Ed.; Academic Press: Oxford, UK, 2017; pp. 170–175. ISBN 978-0-12-803708-9. [Google Scholar]
  20. Shoppert, A.; Loginova, I.; Rogozhnikov, D.; Karimov, K.; Chaikin, L. Increased As Adsorption on Maghemite-Containing Red Mud Prepared by the Alkali Fusion-Leaching Method. Minerals 2019, 9, 60. [Google Scholar] [CrossRef]
  21. Safiur Rahman, M.; Khan, M.D.H.; Jolly, Y.N.; Kabir, J.; Akter, S.; Salam, A. Assessing risk to human health for heavy metal contamination through street dust in the Southeast Asian Megacity: Dhaka, Bangladesh. Sci. Total Environ. 2019, 660, 1610–1622. [Google Scholar] [CrossRef] [PubMed]
  22. Quansah, R.; Armah, F.A.; Essumang, D.K.; Luginaah, I.; Clarke, E.; Marfoh, K.; Cobbina, S.J.; Nketiah-Amponsah, E.; Namujju, P.B.; Obiri, S.; et al. Association of Arsenic with Adverse Pregnancy Outcomes/Infant Mortality: A Systematic Review and Meta-Analysis. Environ. Health Perspect. 2015, 123, 412–421. [Google Scholar] [CrossRef] [Green Version]
  23. Chung, J.-Y.; Yu, S.-D.; Hong, Y.-S. Environmental Source of Arsenic Exposure. J. Prev. Med. Public Health 2014, 47, 253–257. [Google Scholar] [CrossRef]
  24. Ferrante, M.; Napoli, S.; Grasso, A.; Zuccarello, P.; Cristaldi, A.; Copat, C. Systematic review of arsenic in fresh seafood from the Mediterranean Sea and European Atlantic coasts: A health risk assessment. Food Chem. Toxicol. 2019, 126, 322–331. [Google Scholar] [CrossRef]
  25. Arsenic. Available online: https://www.who.int/news-room/fact-sheets/detail/arsenic (accessed on 17 April 2019).
  26. Sorg, T.J.; Chen, A.S.C.; Wang, L. Arsenic species in drinking water wells in the USA with high arsenic concentrations. Water Res. 2014, 48, 156–169. [Google Scholar] [CrossRef]
  27. Adams, M.D. (Ed.) Advances in Gold Ore Processing, 1st ed.; Developments in mineral processing; Elsevier: Amsterdam, The Netherlands, 2005; ISBN 978-0-444-51730-2. [Google Scholar]
  28. Paphane, B.D.; Nkoanet, B.B.M.; Oyetunjit, O.A. Kinetic studies on the leaching reactions in the autoclave circuit of the Tati Hydrometallurgical Demonstration Plant. J. South. Afr. Inst. Min. Metall. 2013, 113, 485–489. [Google Scholar]
  29. Hourn, M. Refractory leaching solutions. Aust. Min. 2009, 101, 20. [Google Scholar]
  30. Zaytsev, P.; Fomenko, I.; Chugaev, V.L.; Shneerson, M.Y. Pressure oxidation of double refractory raw materials in the presence of limestone. Tsvetn. Met. 2015, 41–49. [Google Scholar] [CrossRef]
  31. Dreisinger, D. Hydrometallurgical process development for complex ores and concentrates. J. South. Afr. Inst. Min. Metall. 2009, 109, 253–271. [Google Scholar]
  32. Rogozhnikov, D.A.; Mamyachenkov, S.V.; Anisimova, O.S. Nitric Acid Leaching of Copper-Zinc Sulfide Middlings. Metallurgist 2016, 60, 229–233. [Google Scholar] [CrossRef]
  33. Rogozhnikov, D.A.; Rusalev, R.E.; Dizer, O.A.; Naboychenko, S.S. Nitric acid loosening of rebellious sulphide concentrates containing precious metals. Tsvetn. Met. 2018, 16, 38–40. [Google Scholar] [CrossRef]
  34. Anderson, C.G.; Harrison, K.D.; Krys, L.E. Theoretical considerations of sodium nitrite oxidation and fine grinding in refractory precious-metal concentrate pressure leaching. Miner. Metall. Proc. 1996, 13, 4–11. [Google Scholar] [CrossRef]
  35. Van Weert, G.; Fair, K.J.; Schneider, J.C. Prochem’s NITROX Process. CIM Bull. 1986, 79, 84–85. [Google Scholar]
  36. Beattie, M.J.V.; Ismay, A. Applying the redox process to arsenical concentrates. JOM 1990, 42, 31–35. [Google Scholar] [CrossRef]
  37. La Brooy, S.R.; Linge, H.G.; Walker, G.S. Review of gold extraction from ores. Miner. Eng. 1994, 7, 1213–1241. [Google Scholar] [CrossRef]
  38. Gao, G.; Li, D.; Zhou, Y.; Sun, X.; Sun, W. Kinetics of high-sulphur and high-arsenic refractory gold concentrate oxidation by dilute nitric acid under mild conditions. Miner. Eng. 2009, 22, 111–115. [Google Scholar] [CrossRef]
  39. Gok, O.; Anderson, C.G.; Cicekli, G.; Cocen, E.I. Leaching kinetics of copper from chalcopyrite concentrate in nitrous-sulfuric acid. Physicochem. Probl. Mi. 2014, 50, 399–413. [Google Scholar]
  40. Huang, Y.; Dou, Z.; Zhang, T.; Liu, J. Leaching kinetics of rare earth elements and fluoride from mixed rare earth concentrate after roasting with calcium hydroxide and sodium hydroxide. Hydrometallurgy 2017, 173, 15–21. [Google Scholar] [CrossRef]
  41. Kocan, F.; Hicsonmez, U. Leaching kinetics of celestite in nitric acid solutions. Int. J. Min. Met. Mater. 2019, 26, 11–20. [Google Scholar] [CrossRef]
  42. Li, K.; Chen, J.; Zou, D.; Liu, T.; Li, D. Kinetics of nitric acid leaching of cerium from oxidation roasted Baotou mixed rare earth concentrate. J. Rare Earth. 2019, 37, 198–204. [Google Scholar] [CrossRef]
  43. Fajaryanto, R.; Nurqomariah, A. Silvia Acid leaching and kinetics study of cobalt recovery from spent lithium-ion batteries with nitric acid. In Proceedings of the 3rd International Tropical Renewable Energy Conference “Sustainable Development of Tropical Renewable Energy” (i-TREC 2018), Bali, Indonesia, 6–8 September 2018; Volume 67. [Google Scholar] [CrossRef]
  44. Anderson, C.G.; Twidwell, L.G. Hydrometallurgical processing of gold-bearing copper enargite concentrates. Can. Metall. Quart. 2008, 47, 337–346. [Google Scholar] [CrossRef]
  45. Levenspiel, O. Chemical Reaction Engineering, 3rd ed.; Wiley: New York, NY, USA, 1999; ISBN 978-0-471-25424-9. [Google Scholar]
  46. Dickinson, C.F.; Heal, G.R. Solid-liquid diffusion controlled rate equations. Thermochim. Acta 1999, 340–341, 89–103. [Google Scholar] [CrossRef]
  47. Baba, A.A.; Adekola, F.A. Hydrometallurgical processing of a Nigerian sphalerite in hydrochloric acid: Characterization and dissolution kinetics. Hydrometallurgy 2010, 101, 69–75. [Google Scholar] [CrossRef]
Figure 1. X-ray diffraction (XRD) pattern of the phase composition of concentrate-3.
Metals 09 00465 g001
Figure 2. General view of concentrate-3 in backscattered electrons: AsP—arsenopyrite, Py—pyrite, Sbn—stibnite (antimonite), Ag—silver, dark gray grains—silicate minerals.
Metals 09 00465 g002
Figure 3. The dependence of iron extraction in the leaching of refractory gold-containing concentrate on temperature: (a) concentrate-1 and 10% HNO3 concentration; (b) concentrate-1 and 20% HNO3 concentration; (c) concentrate-1 and 40% HNO3 concentration; (d) concentrate-2 and 10% HNO3 concentration; (e) concentrate-2 and 20% HNO3 concentration; (f) concentrate-2 and 40% HNO3 concentration; (g) concentrate-3 and 10% HNO3 concentration; (h) concentrate-3 and 20% HNO3 concentration; (i) concentrate-3 and 40% HNO3 concentration.
Metals 09 00465 g003
Figure 4. Scanning electron microscopy (SEM) images of the original sample of concentrate-3 (a) and the cake obtained by leaching (b).
Metals 09 00465 g004
Figure 5. SEM images of solid residue with the EDS points: (a) solid residue of concentrate-3 leaching and (b) solid residue of concentrate-1 leaching.
Metals 09 00465 g005
Figure 6. XRD patterns of the solid residue of the concentrate-3 and concentrate-1.
Metals 09 00465 g006
Figure 7. Calculation of slope k (a) and dependence of lnk-1/T (b) for leaching concentrate-1 with 10% HNO3.
Metals 09 00465 g007
Figure 8. Calculation of slope k (a) and dependence lnk-ln(HNO3) (b) for leaching conc-1 at 70 °C.
Metals 09 00465 g008
Figure 9. Calculation of slope k (a) and dependence of lnk-lnS (b) for leaching of various concentrates at a temperature of 70 °C with a 10% HNO3.
Metals 09 00465 g009
Table 1. Chemical composition of samples of refractory gold-containing sulfide concentrates, wt.%.
ElementAlAsFeSSiSbKCaMgAu (gpt)Other
Concentrate-12.383.007.268.2219.502.961.157.252.1715–2046.11
Concentrate-25.154.6813.1413.0822.022.252.491.351.023034.82
Concentrate-32.4913.2023.6022.447.722.511.840.730.5560–8024.92
Table 2. The results of the mineralogical composition study of the concentrate samples.
MineralFormulaConcentrate-1Concentrate-2Concentrate-3
wt.%
QuartzSiO236.4335.6310.97
PyriteFeS210.7920.7229.57
ArsenopyriteFeAsS6.5210.1828.68
StibniteSb2S34.133.153.50
MuscoviteKAl2[AlSi3O10](OH)211.7019.1512.24
CalciteCaCO39.14--
DolomiteCaMg(CO3)216.496.213.01
Other-4.804.9612.03
Table 3. Gold content in minerals 1 of flotation concentrate-3, gpt.
ElementPyritePyriteArsenopyriteAntimoniteArsenopyrite
Au15.7711.2313.613.4765.71
ElementArsenopyriteArsenopyriteArsenopyriteArsenopyriteArsenopyrite
Au1.71172.4526.3612.480.558
1 The materials were determined according to the content of Fe, As, Sb, S. Sulfur was used as an internal standard.
Table 4. Results of energy dispersive spectroscopy analysis, wt.%.
ElementAlSiSFeAsTotal
Point 0015.993.10.00.30.7100.0
Point 0032.694.41.01.30.6100.0
Point 0052.595.90.70.30.6100.0
Point 0077.585.01.03.03.6100.0
Point 00929.469.40.20.80.3100.0
Point 00114.585.53.32.93.9100.0
Point 00139.141.19.713.626.4100.0
Point 001510.621.09.028.530.9100.0
Point 00176.752.98.26.325.9100.0
Table 5. The shrinking core model (SCM) equations [45].
#Limiting StepEquation
1Diffusion through the product layer (sp) 1 − 3(1 − X)2/3 + 2(1 − X) = kt
2Diffusion through the product layer (pp)X2 = kt
3Diffusion through the product layer (cp)X + (1 − X)ln(1 − X) = kt
4Diffusion through the liquid film (sp)X = kt
5Surface chemical reactions (cp) 1 − (1 − X)1/2 = kt
6Surface chemical reactions (sp) 1 − (1 − X)1/3 = kt
7New shrinking core model1/3ln(1 − X) + [(1 − X)−1/3 − 1] = kt
sp—spherical particles, pp—plate particles, cp—cylinder particles, k—a chemical constant, X—the degree of iron recovery into the solution, and t—the leaching time.
Table 6. SCM equations fitting.
#SCM EquationR2
70 °C75 °C80 °C85 °C
11 − 3(1 − X)2/3 + 2(1 − X) 0.9760.9350.9220.954
2X20.9620.9050.8830.918
3X + (1 − X)ln(1 − X)0.9730.9280.9130.946
4X0.5590.3340.2590.348
51 − (1 − X)1/20.6240.4360.3740.477
61 − (1 − X)1/30.6450.4610.4100.517
71/3ln(1 − X) + [(1 − X)−1/3 − 1]0.9900.9690.9630.984
Table 7. Arrhenius constant determination.
SHNO3aR2ko
81012.510.98085.917
82012.990.99586.173
84013.660.99884.973
131013.970.97288.673
132014.630.99995.291
134015.120.99987.348
221015.610.98696.532
222016.110.96488.930
224016.540.99576.464
Table 8. Comparison of experimental data and the obtained empirical equation.
HNO3Concentrate-1Concentrate-2Concentrate-3
707580857075808570758085
10%0.9880.9970.9950.9840.9270.9400.9400.9560.9960.9630.9640.972
20%0.9350.9920.9920.9230.9570.9610.9510.9480.9710.9720.9810.981
40%0.9490.9950.9960.9960.9600.9560.9600.9600.9590.9410.9300.918

