Article

Modification of Non-Metallic Inclusions in Oil-Pipeline Steels by Ca-Treatment

1
Department of Materials Science and Engineering, KTH Royal Institute of Technology, Brinellvägen 23, 10044 Stockholm, Sweden
2
Department of Functional Nanosystems and Hightemperature Materials, National University of Science and Technology (MISIS), Leninsky Prospect 4, 119049 Moscow, Russia
*
Author to whom correspondence should be addressed.
Metals 2019, 9(4), 391; https://doi.org/10.3390/met9040391
Submission received: 18 January 2019 / Revised: 7 March 2019 / Accepted: 25 March 2019 / Published: 28 March 2019
(This article belongs to the Special Issue Ironmaking and Steelmaking)

Abstract

:
Corrosion rate in different steel grades (including oilfield pipeline steels) is determined by the presence of non-metallic inclusions (NMI) in steels. Specifically, the effect of different inclusions on the quality of steels depends on their characteristics such as size, number, morphology, composition, and physical properties, as well as their location in the steel matrix. Therefore, the optimization and control of NMI in steels are very important today to obtain an improvement of the material properties of the final steel products. It is well known that a Ca-treatment of liquid steels in ladle before casting is an effective method for modification of non-metallic inclusions for improvement of the steel properties. Therefore, the NMI characteristics were evaluated in industrial steel samples of low carbon Ca-treated steel used for production of oil-pipelines. An electrolytic extraction technique was used for extraction of NMI from the steel samples followed by three-dimensional investigations of different inclusions and clusters by using SEM in combination with EDS. Moreover, the number and compositions of corrosion active non-metallic inclusions were estimated in hot rolled steel samples from two different heats. Finally, the corrosion resistance of these steels can be discussed depending on the characteristics of non-metallic inclusions present in the steel.

1. Introduction

The increasing energy consumption and demands for oil and natural gas requires safe and effective possibilities to transport them under high pressure for long distances to customers. Therefore, the requirements to the material properties of steels, which are used for oil- or gas-pipelines, increase year by year. In previous studies [1,2,3] it was found that the hydrogen induced cracking (HIC) and sulfide stress cracking (SSC) are main reasons of corrosion and damages in pipeline steels during transportation of oil and natural gas containing H2S and H2O. Specifically, the corrosion is induced by the penetration of hydrogen atoms from oil or gas into the steel, their accumulation on surfaces of microdefects in the steel matrix (such as grain boundaries, pores, and non- metallic inclusions), and initiations of cracks due to a high internal pressure from the formed H2 gas [4,5,6].
Generally, the corrosion resistance of steels depends mostly on the following steel characteristics: (1) the content of alloying elements (chromium, nickel and copper), which are involved in the formation of protective films of corrosion products on the steel surface, (2) the steel microstructure, and (3) the presence of components in the steel structure that cause an increased levels of stress as well as contribute to the destruction of protective films. Such components of the structure include, in particular, non-metallic inclusions (NMI) of unfavorable chemical compositions, and isolation of excess phases, including nanoscale phases. The content of chromium, nickel, and copper, which is necessary to ensure a high corrosion resistance, can be reduced in the absence of unfavorable structural components in the steel bar.
Based on detailed investigations of the HIC and SSC defects in different pipeline steels [7,8], it was found that the non-metallic inclusions (such as MnS and Al2O3, CaO-Al2O3 or complex inclusions containing Al2O3 and CaO) are one of the major reasons for hydrogen induced corrosions. An addition of Ca during ladle treatment of the liquid steel is a commonly used technique for modification of MnS inclusions (due to reduction of size and aspect ratio of inclusions) and improvement of the corrosion resistance of steels [3,9].
It is known that the main cause of high corrosion rates of oilfield pipelines is contaminations of steel by certain harmful non-metallic inclusions, which are precipitated in steel during the ladle treatment and casting process. Such inclusions are called corrosion-active non-metallic inclusions [10,11]. However, these non-metallic inclusions in modern steels have usually a complex chemical composition, where often the influence of the composition on the corrosion is not fully known. Previous authors have reported negative effects on the corrosion resistance of oil-field pipeline steels due to two types of non-metallic inclusions [10,11]. The first type is non-metallic inclusions based on calcium aluminates, which sometimes contain magnesium and silicon oxides. The second type is complex inclusions, which have a core of calcium aluminate (at different ratios of CaO and Al2O3), manganese sulfide or another inclusion, but surrounded by a calcium sulfide shell. It should be noted that non-metallic inclusions, regardless of their type, affect the resistance of steel to local corrosion, according to the same mechanism as any other heterogeneity.
Today, various methods can be used to assess non-metallic inclusions in different steels and alloys with a high accuracy. The conventional method for evaluation of NMI is the two-dimensional (2-D method) investigations of non-metallic inclusions on polished surfaces of steel samples by using light optical microscopy (LOM) or scanning electron microscopy (SEM). However, three-dimensional (3-D method) investigations of NMI in various steels by using an electrolytic extraction technique combined with SEM investigation have been applied over the last 10 to 20 years. The latter method shows a number of significant advantages compared to the conventional 2-D method [12,13,14,15,16,17].
In this study, the electrolytic extraction technique was applied for the 3-D investigations of non-metallic inclusions in industrial steels. In addition, the number and compositions of corrosion active NMI were investigated in hot rolled steel samples to evaluate the corrosion resistance of these steels depending on the characteristics of non-metallic inclusions present in the steels.

2. Materials and Methods

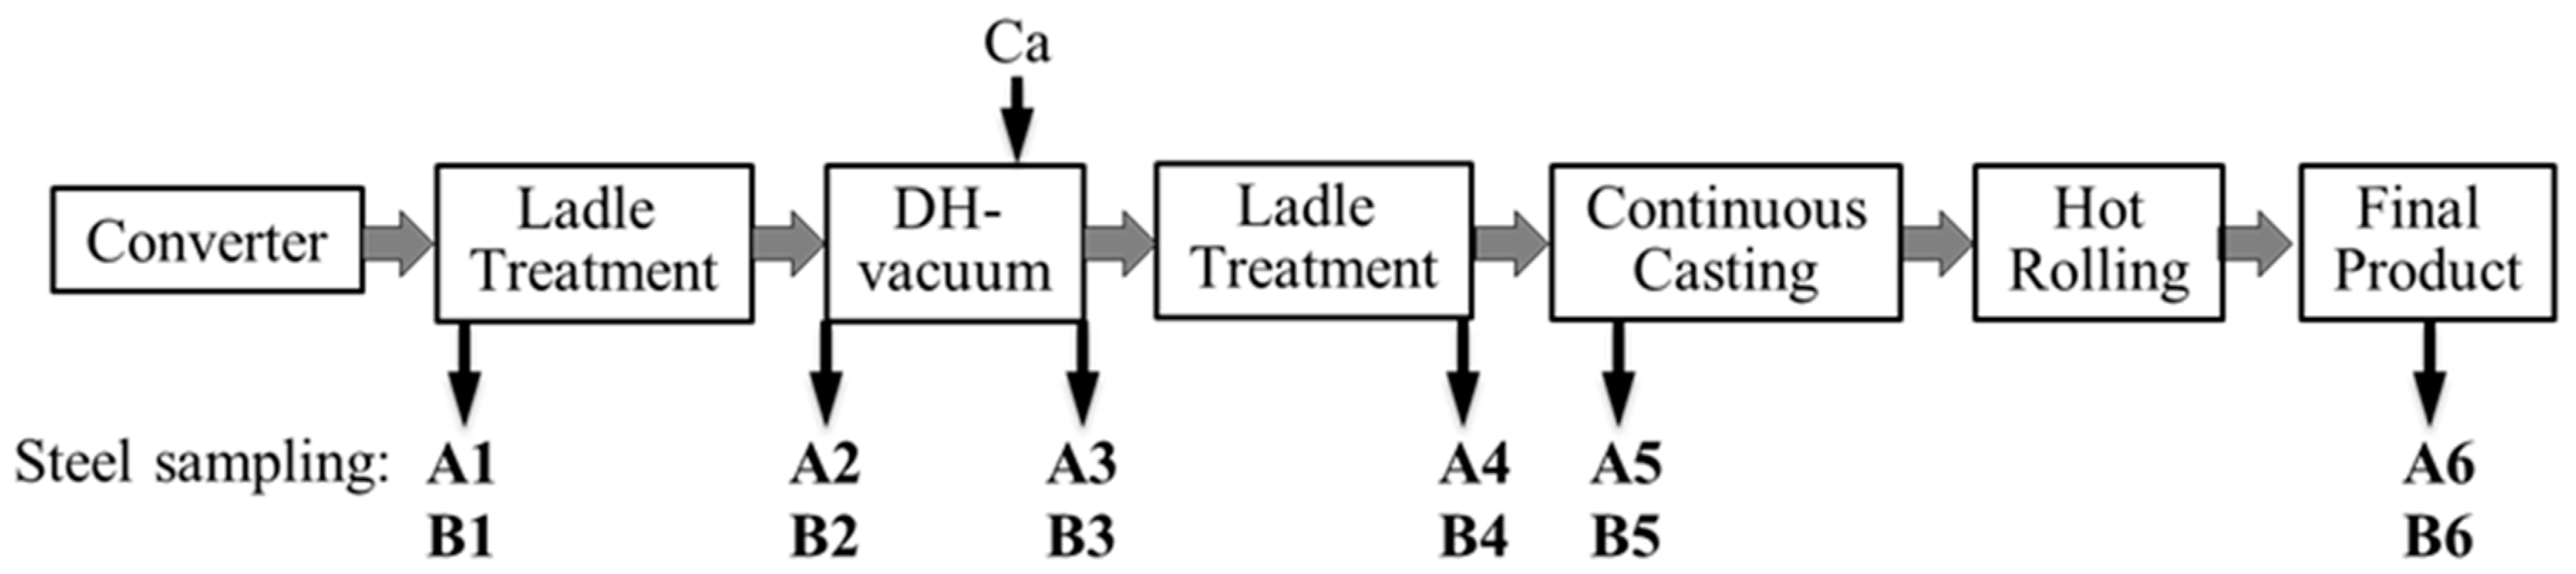
2.1. Steel Production and Sampling

In this study, steel samples from two industrial heats (Heat A and Heat B) of low-carbon steels for production of oil-pipeline were used for the evaluation of the non-metallic inclusion characteristics as well as their effect on the corrosion properties of steels. The production technology of the steels included the converter, primary ladle treatment, DH-vacuum treatment, final treatment in the ladle furnace, continuous casting, and hot rolling processes. The main technological parameters and alloy contents in both heats were very similar. Furthermore, the same amount of aluminum wire was added in both heats, but in Heat A it was added during the vacuum treatment of the melt while in Heat B it was added during the final ladle treatment before casting. During the ladle refining, a modification of the non-metallic inclusions was done by an addition of calcium carbide to the liquid steel during the DH-vacuum treatment. However, the amount of calcium carbide added in Heat A (0.25 kg/ton) was significantly larger than that in Heat B (0.23 kg/ton). Moreover, the addition of the calcium carbide in Heat A was done 10 min earlier than that in Heat B. The slabs after continuous casting were rolled under similar conditions, according to the required mechanical and structural properties of the sheet with a thickness of 8 mm. A schematic illustration of production technology and steel sampling for two investigated heats (Heat A and Heat B) for oil-pipeline steel are shown in Figure 1. It should be pointed out that the modification of inclusion characteristics were investigated only in the followed steel samples: samples A2 and B2—initial conditions of non-metallic inclusions before Ca-treatment; samples A4, B4 and A5, B5—modified NMI after Ca-treatment before and during casting, respectively; samples A6 and B6—NMI in the final steel product after hot rolling.

2.2. Evaluation of the Non-Metallic Inclusions and Microstructure in Steel Samples

As mentioned earlier, non-metallic inclusions were investigated in steel samples taken from two heats (Heats A and B) of low carbon steels, which are used for the production of oil-pipelines. The characteristics of non-metallic inclusions in steel samples (such as composition, morphology, size and number) were evaluated by using the electrolytic extraction (EE) technique in combination with SEM, which has successfully been applied for precise 3-D investigations of inclusions and clusters in different steel grades, as was reported in separate articles [17]. A 10% AA electrolyte (10% acetylacetone-1% tetramethylammonium chloride-methanol) was used for dissolution of the metal matrix. The non-metallic inclusions, which were more stable and did not dissolved in the electrolyte, were collected on a surface of a membrane polycarbonate (PC) film filter (having a 0.4 µm open-pore diameter) by filtration of the electrolyte after the completed extraction. Figure 2 shows a schematic illustration of the electrolytic extraction process and typical SEM images of non-metallic inclusions on film filters after an electrolytic extraction. The following electric parameters were used during the electrolytic extractions of steel samples: electric current—40–60 mA, voltage—2.9–4.5 V, electric charge—500 or 1000 Coulomb. Furthermore, the weight of the dissolved steel during EE process varied from 0.11 up to 0.23 g depending on electric parameters.
The size, number, composition and morphology of different inclusions on surfaces of film filters were determined by using scanning electron microscope (SEM) in combination with energy dispersive spectroscopy (EDS). The compositions of 10–25 typical inclusions were determined by using the EDS and the data was recalculated to the main oxide and sulfide components of inclusions. Specifically, the lengths (L) and widths (W) of each inclusion or cluster were measured on the SEM images. The number of measured inclusions for each sample varied from 150 to 430 inclusions, depending on the sampling occasion and cleanness of steel. The equivalent size (deq) for each inclusion was determined as the average value between measured length and width: deq = (L + W)/2. The number of inclusions per unit volume of steel sample (NV) for each size interval was calculated as follows:
N V = n · A f A o b s · ρ m W d i s
where n is the number of inclusions in the given size interval. The parameters Af and Aobs are the total area of the PC film filter containing inclusions after filtration (1200 mm2) and the area of filter observed by SEM. Furthermore, ρm is the density of the steel (~0.0078 g/mm3) and Wdis is the weight of the steel dissolved during the electrolytic extraction.
For the evaluation of corrosion active non-metallic inclusions, hot rolled steel samples A6 and B6 were polished and quickly etched (up to 60 s) in a reagent developed on the basis of the Obergoffer reagent, which is usually used to detect structural inhomogeneity in steels. Then, the active non-metallic inclusions causing corrosion were investigated quantitatively and qualitatively on the metal surfaces of the samples by using SEM in combination with EDS. Figure 3 shows typical SEM images including corrosion active non-metallic inclusion on steel surfaces of both heats after etching. Number and compositions of the corrosion active inclusions having diameter larger than 5 µm were evaluated in steel samples A6 and B6. The corrosion resistance and quality of steel products from Heats A and B were judged by the presence or quantitative characteristics of corrosion active non-metallic inclusions and areas affected by corrosion.
The microstructures of steel samples A6 and B6 have been revealed after using a common etching procedure for the given steel grade and investigated by using a light optical microscope at different magnifications.

3. Results and Discussions

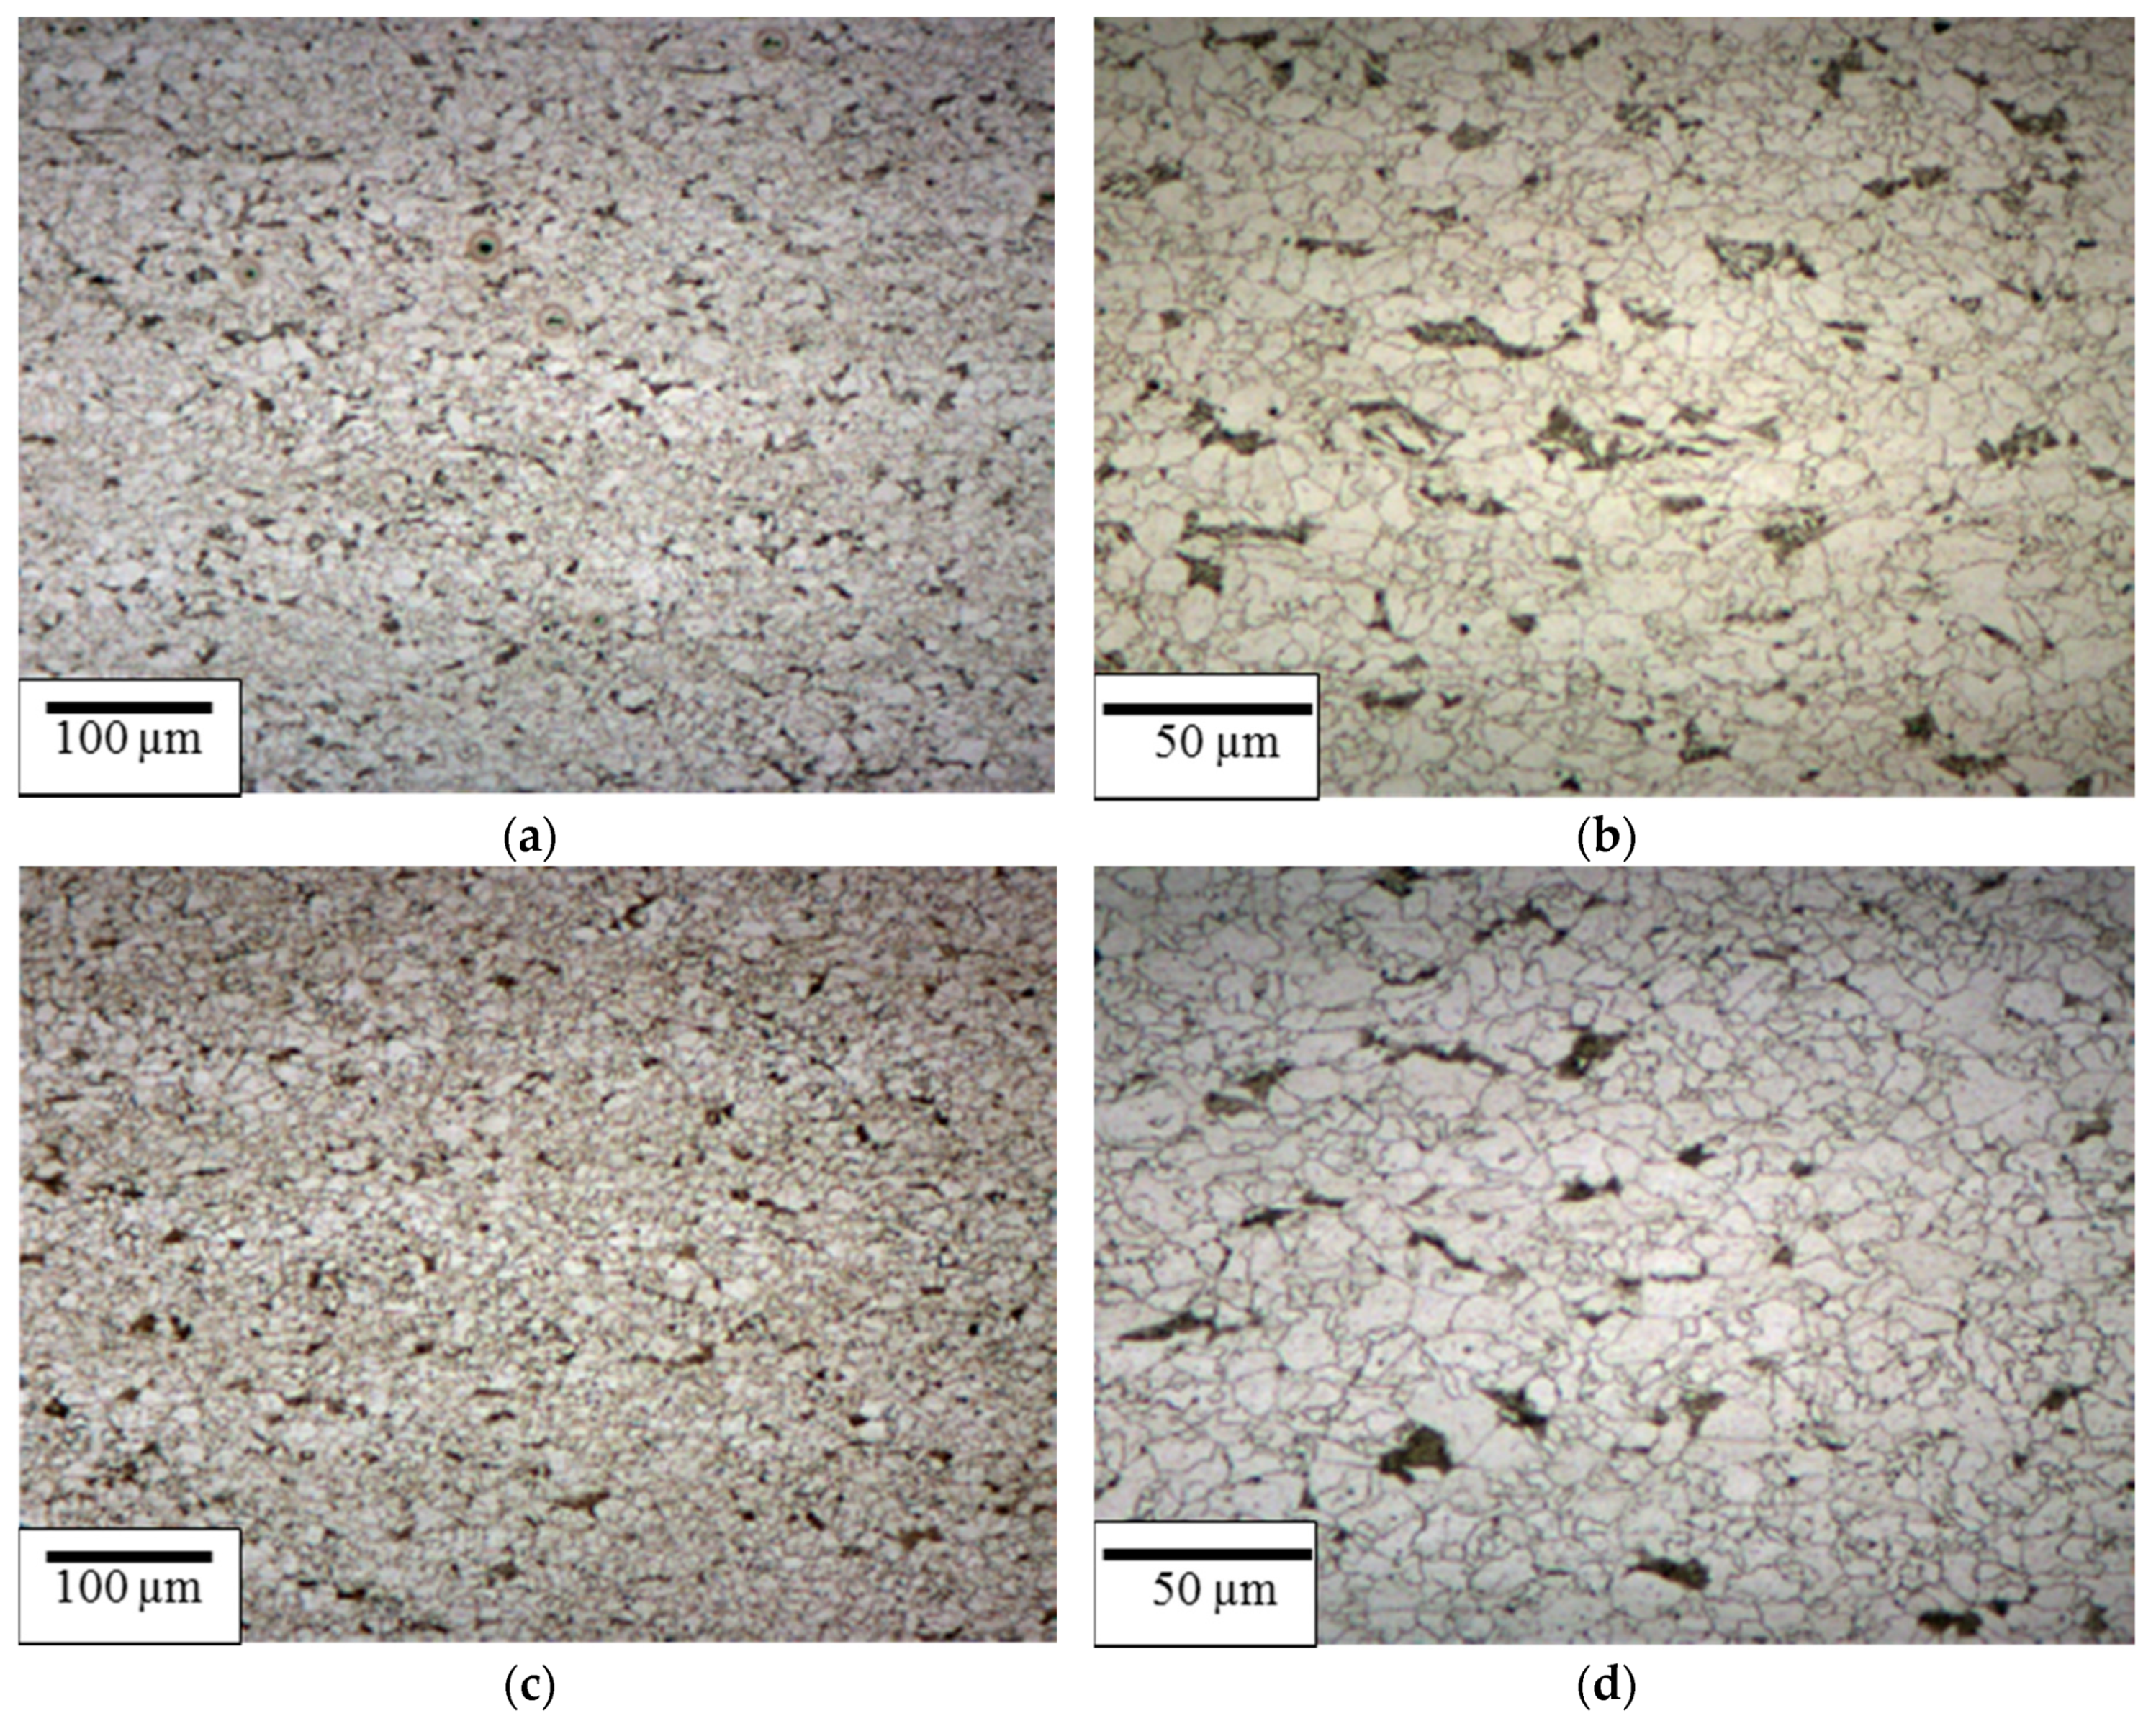
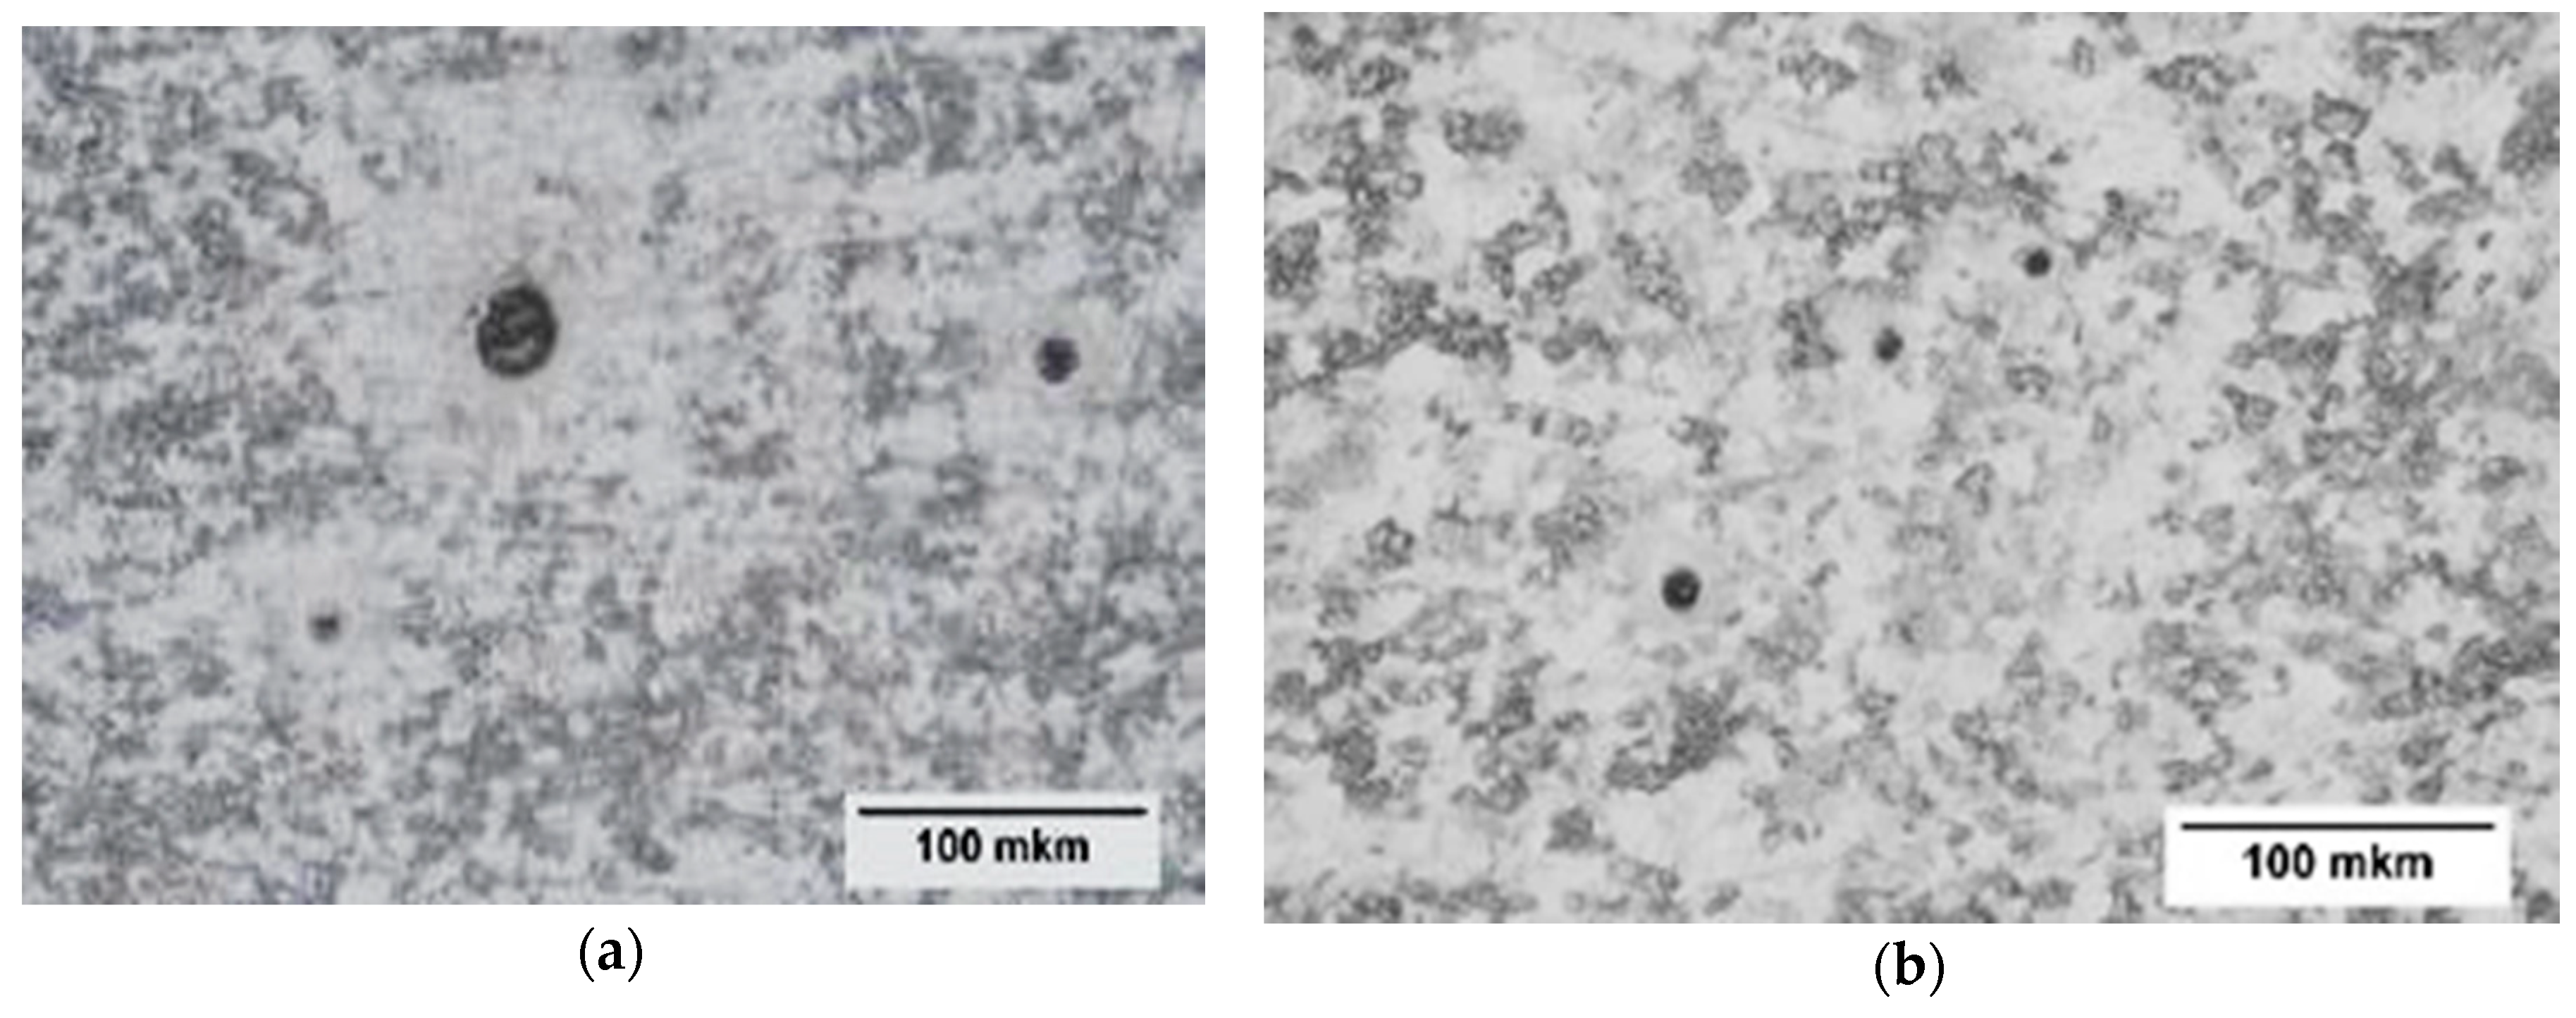
3.1. Evaluation of Composition and Microstructure of Steels

The chemical compositions of steel samples taken from both heats after hot rolling are given in Table 1. It can be seen that the contents of main elements in steels of both heats are very similar. Only the contents of Al, Ca, and S are slightly higher and the N content is lower in Heat A compared to Heat B, which can effect on characteristics of non-metallic inclusions.
Typical microstructures observed in both hot rolled steels (Samples A6 and B6) are shown in Figure 4. The results show that the microstructures of steel samples from both heats are very similar.
Based on the obtained results, it may be safely suggested that the chemical compositions and microstructures are very similar in both investigated heats. Thus, these parameters cannot explain the significant differences the corrosion resistances between these two heats.

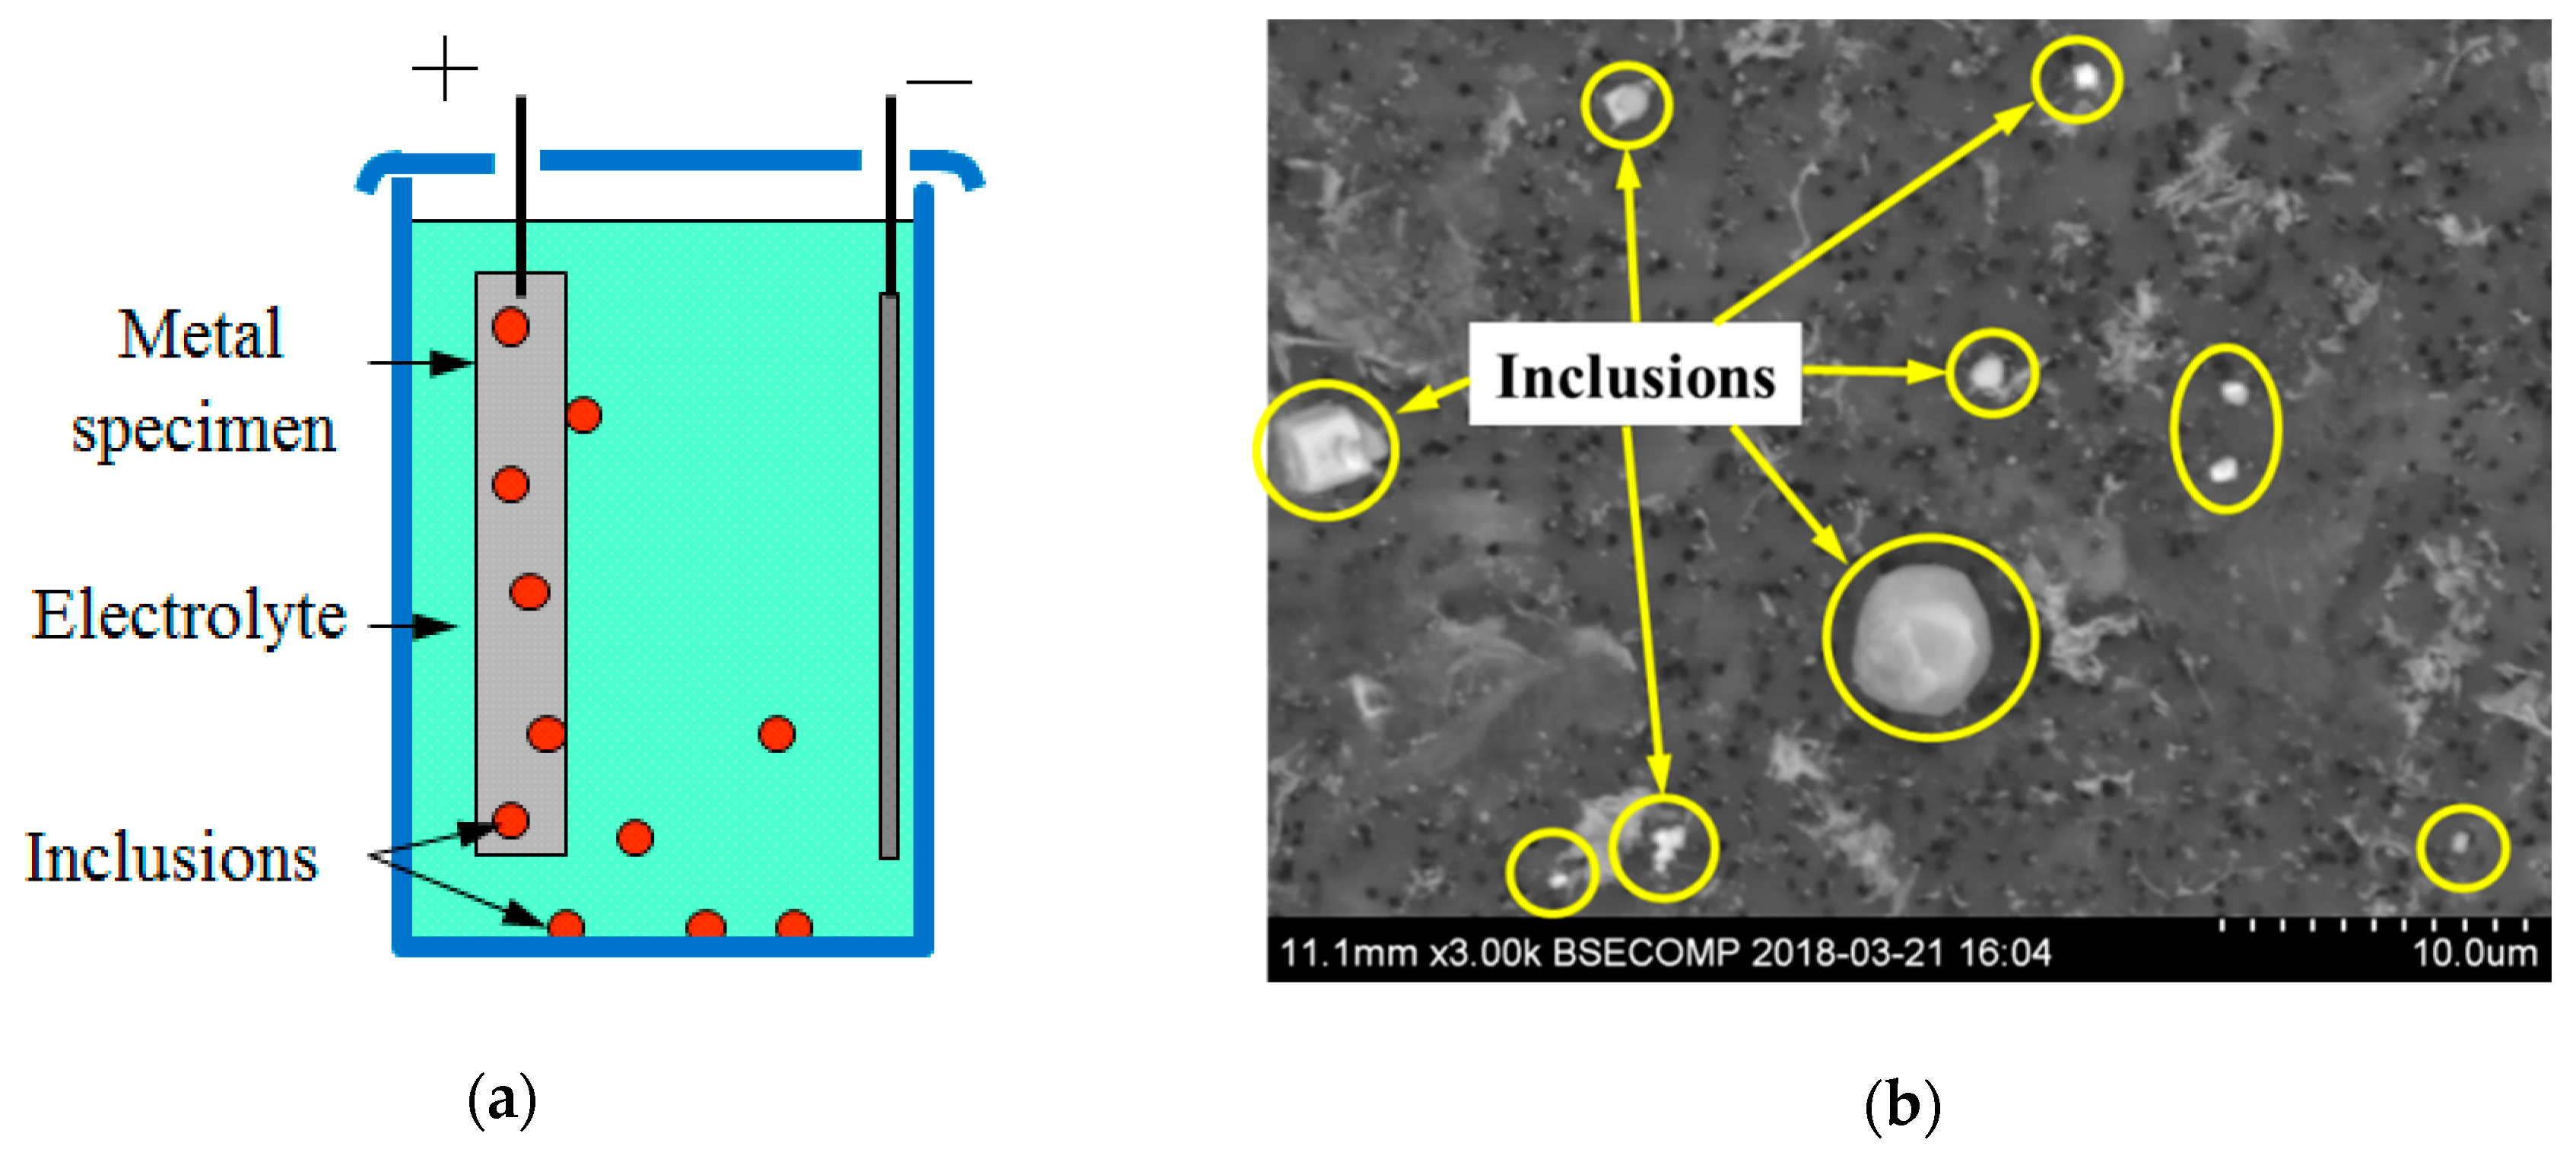
3.2. Evaluation of NMI Characteristics after Electrolytic Extraction

The results show that despite that the production route and final steel compositions of both heats were very similar the characteristics of the non-metallic inclusions in these heats have significant differences.
The main characteristics of non-metallic inclusions (such as composition, morphology, number and size) were investigated on film filter after electrolytic extraction of steel samples from both heats, as explained earlier. The typical NMI were classified into six different groups, which are presented in Table 2. It can be seen that Type I inclusions (A, AM) are regular and irregular inclusions and clusters containing mostly pure Al2O3 or Al2O3-MgO. The content of other components such as CaO, CaS and SiO2 in these NMI are less than 17%. Also, the size of these observed NMI varied from 0.5 to 7.9 µm. The Type I inclusions and clusters were observed in samples A2 and B2 after alloying and deoxidation of the melt of both heats.
Type II inclusions (ASi) can have spherical or irregular shapes and sizes in the range from 0.7 up to 5.6 µm. They contain mostly 21–94% of SiO2 and 5–78% of Al2O3. It should be pointed out that these inclusions were only observed in samples B2 from Heat B.
Type III inclusions (CAM + CS) are spherical or irregular inclusions containing a complex oxide core (9–69% CaO, 2–54% Al2O3, 0–22% MgO and 0–7% SiO2) and an outer layer consisting of CaS (9–62%). The size of these NMI varied from 0.9 to 5.2 µm. Also, this type of NMI was observed in all steel samples taken after a Ca addition as well as in the final product of both heats (samples A4–A6 and B4–B6).
Type IV inclusions (CS) also contain an oxide core and a larger outer layer consisting of CaS. The content of CaS in these inclusions during the EDS analysis could reach values up to between 97 to 100%. In addition, most of these inclusions have spherical or slightly elongated shapes. However, the NMI of Type IV were observed only in sample A6 from the final product of Heat A. The size of these inclusions was in the range from 2.5 to 7.4 µm. Moreover, it should be noted that the average value of aspect ratio for this type inclusions (AR = L/N = 2.2) is significantly larger than that for Types III, V, and VI (1.1–1.4).
Type V (CAM + CS + TN) and Type VI (TN) complex inclusions contain an oxide core and an outer precipitation of CaS and TiN. Therefore, these NMI have spherical/irregular or regular (cubic) shapes. The outer layer can contain 1–53% TiN and 0–50% CaS in the Type V inclusions and 78–100% TiN and only 0–13% CaS in the Type VI inclusions. These inclusions were observed to different extents in the steel samples A4–A6 and B4–B6 in both heats. The sizes varied from 1.1 to 5.0 µm for Type V inclusions and from 0.7 to 4.3 µm for Type VI inclusions.
The frequencies of NMI (in percentages) in various steel samples from both heats are shown in Figure 5 and sorted based on the type of inclusions and the stage of the steel production where the samples have been taken. It can be seen that the frequency of Type III inclusions (CAM + CS) decreases significantly from 98% (A4) to 36% (A6) in Heat A and from 89% (B4) to 20% (B6) in Heat B. The amount of Type IV inclusions (CS) in the final product of Heat A (sample A6) is only ~4%. However, the average size of these CaS inclusions (~5.3 µm) is considerable larger than the sizes for the other NMI. On the other hand, the frequency of NMI containing TiN (Type V and Type VI) increases from 2% (A4) to 59% (A6) in Heat A and from 11% (B4) to 80% (B6) in Heat B. This tendency may be explained by the precipitation of large amounts of small TiN, due to the cooling and solidification of the steel melt during sampling as well as during continuous casting.
It should be pointed out that the characteristics of TiN inclusions (size, number, concentration and morphology) precipitated during solidification of the steel melt in samples A4, A5 and B4, B5 can be significantly different compared to those in the final product after the completed hot rolling operation (samples A6 and B6). Therefore, the particle size distributions for the main inclusions (Types III, V and VI) as well as for all observed inclusions are compared in Figure 6 for samples A6 and B6 from both heats. It is apparent that the number and size of inclusions of Type III (CAM + CS) and Type V (CAM + CS + TN) inclusions are significantly smaller in Heat B compared to in Heat A, as shown in Figure 6a,b. However, the number of small size TiN inclusions (Type VI) in sample B6 is significantly larger compared to in sample A6 (Figure 6c), due to the higher content of N in steel in Heat B compared to Heat A. As a result, the total number of all inclusions is larger while the size of inclusions is smaller in steel sample B6 than those in sample A6.
The modification of the NMI compositions in different steel samples is shown in the three phase CaO-Al2O3-CaS diagram in Figure 7 for both heats. It is apparent that the initial oxide inclusions of Type I and Type II (grey zones in diagrams) contained Al2O3, MgO and SiO2 are modified in both heats after a Ca addition. As a result, the contents of CaO in the oxide core and CaS in the outer layer increases significantly. For instance, the Type III oxide inclusions in samples A4 and B4 (blue zones) can contain 40 to 90% of CaO. Then, the CaO content in Type III inclusions decreases, while the CaS content in these complex inclusions increases in steel samples A5, A6 and B5, B6. Especially, the CaS content increases up to the values between ~97 to 100% in outer layer of the Type IV inclusions in the A6 sample of Heat A (Figure 7a). However, most inclusions of Type III in the B6 sample of Heat B contain less than 45% of CaS (Figure 7b).

3.3. Modification of Inclusions by Ca-Treatment

The modification of oxide inclusions by Ca-treatment of oil-pipeline steels in the ladle is shown in Figure 8.
It is apparent that the Ca-addition into the melt will firstly modify the Type I (Al2O3 and Al2O3-MgO) and Type II (Al2O3-SiO2) oxide inclusions present in samples A2 and B2 into liquid or semi-liquid CaO-Al2O3-MgO inclusions of Types III and V, which are present in steel samples A4–A6 and B4–B6. Some amounts of CaS can also precipitate on the surface of these oxide inclusions depending on the concentration of S and Ca in the melt. A presence of the TiN phase on the surface of some Type V inclusions in samples A4, B4, A5, and B5 can be explained by the heterogeneous precipitation of TiN during the fast cooling and solidification of the melt in the samplers. Also, a slow solidification of the melt during the following continuous casting of steel provides larger segregations of S and N in some zones of the melt. As a result, the A6 and B6 steel samples taken from the final product contained Type IV (CS) and Type VI (TN) inclusions consisting of large outer layers of CaS and TiN, respectively. It should be noted that the Type VI inclusions were observed in both steel samples A6 and B6. However, the Type IV inclusions were only observed in the A6 sample, which had high S contents.

3.4. Evaluation of Corrosion Active Non-Metallic Inclusions

The corrosion resistance of two investigated hot rolled steels (Heats A and B) were evaluated and discussed based on the characteristics of the non-metallic inclusions observed in these steels. The numbers of corrosion active NMI per unit area (NA) in the given steels are given in Table 3. It can be seen that a larger number of corrosion-active inclusions having diameters larger 5 µm were detected in steel samples from Heat A than from Heat B.
The results also showed that the morphology and compositions of the observed corrosion active NMI in dark pits on surfaces of steels A and B correspond to the large size inclusions observed in steel samples A6 and B6. Some typical corrosion active non-metallic inclusions in hot rolled steels after etching are shown in Figure 9.
According to obtained results with respect to the characteristics of non-metallic inclusions and corrosion active inclusions in the investigated steels, it can be safely suggested that steel B will have a better corrosion resistance compared to steel A. The corrosion resistances of the given steels were evaluated according to the NACE Standards TM0284 (“Evaluation of Pipeline and Pressure Vessel Steels for Resistance to Hydrogen-Induced Cracking”) and TM0177-2005 (“Laboratory Testing of Metals for Resistance to Sulfide Stress Cracking and Stress Corrosion Cracking in H2S Environments”). The obtained results confirmed that steel B has a better corrosion resistance than steel A. However, detailed investigations of the effect of different non-metallic inclusions on the corrosion resistance of Ca treated hot rolled steels for oil-pipelines will be presented and discussed in a separate article.

4. Conclusions

The non-metallic inclusions were investigated in industrial steel samples taken from different stages of the steel production process and for two heats (Heat A and Heat B) of low carbon Ca-treated steel used for oil-pipelines. An electrolytic extraction (EE) technique was used for the extraction of NMI from the steel samples for the followed three-dimensional investigations of different inclusions and clusters by using SEM. Moreover, the number and compositions of corrosion active non-metallic inclusions were evaluated in hot rolled steel samples from both heats. The obtained results can be summarized as follows:
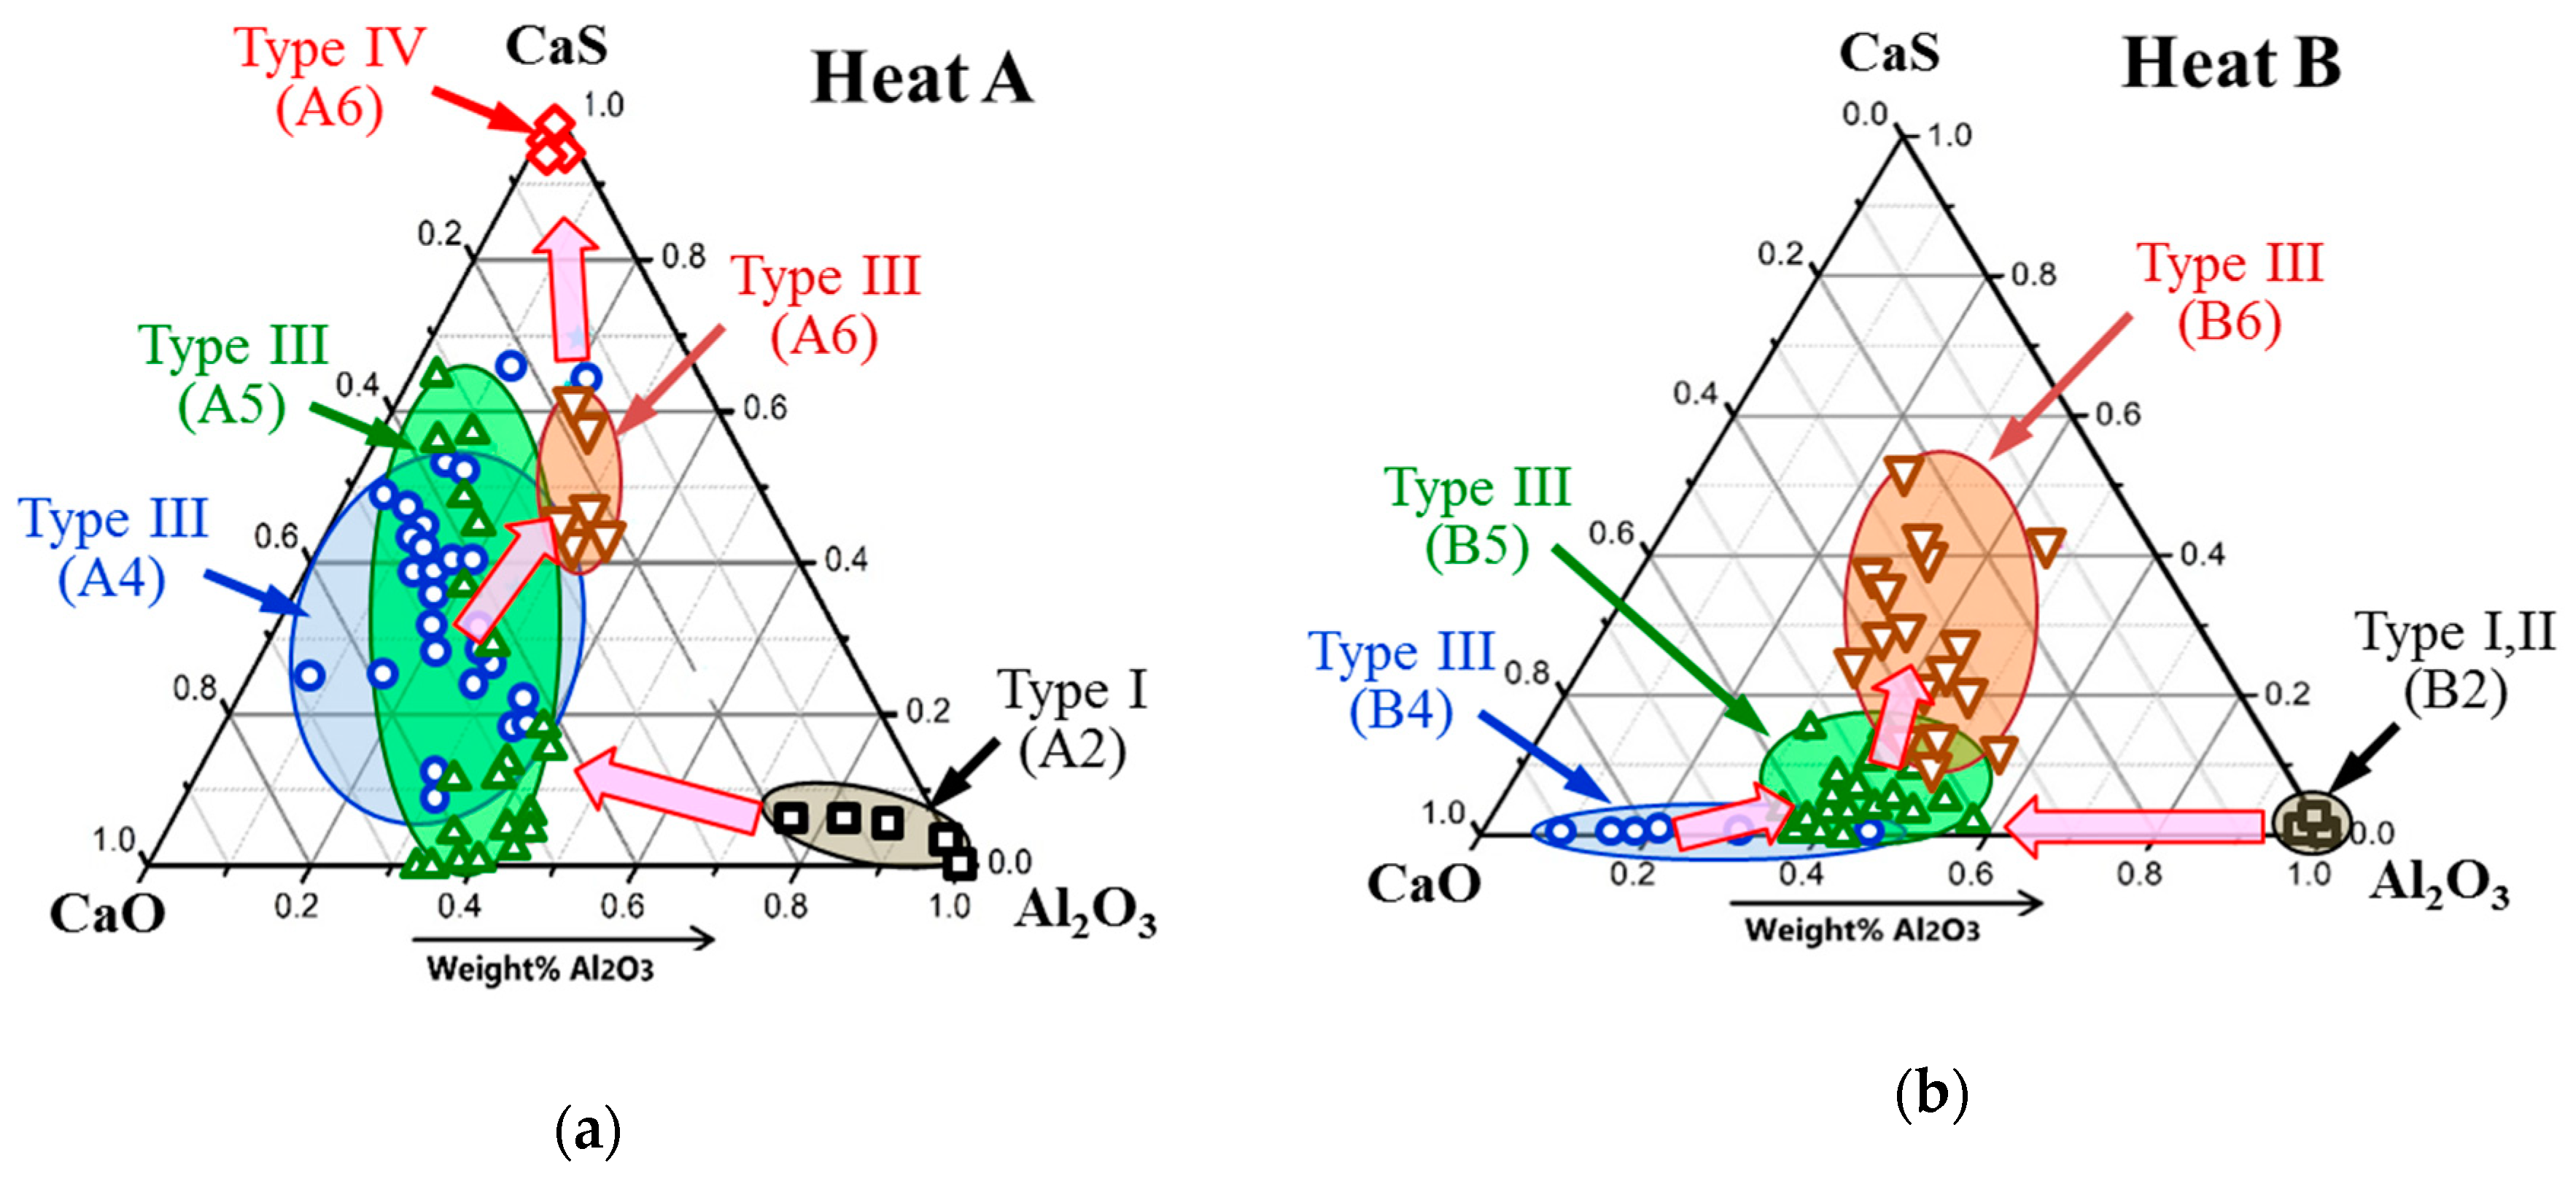
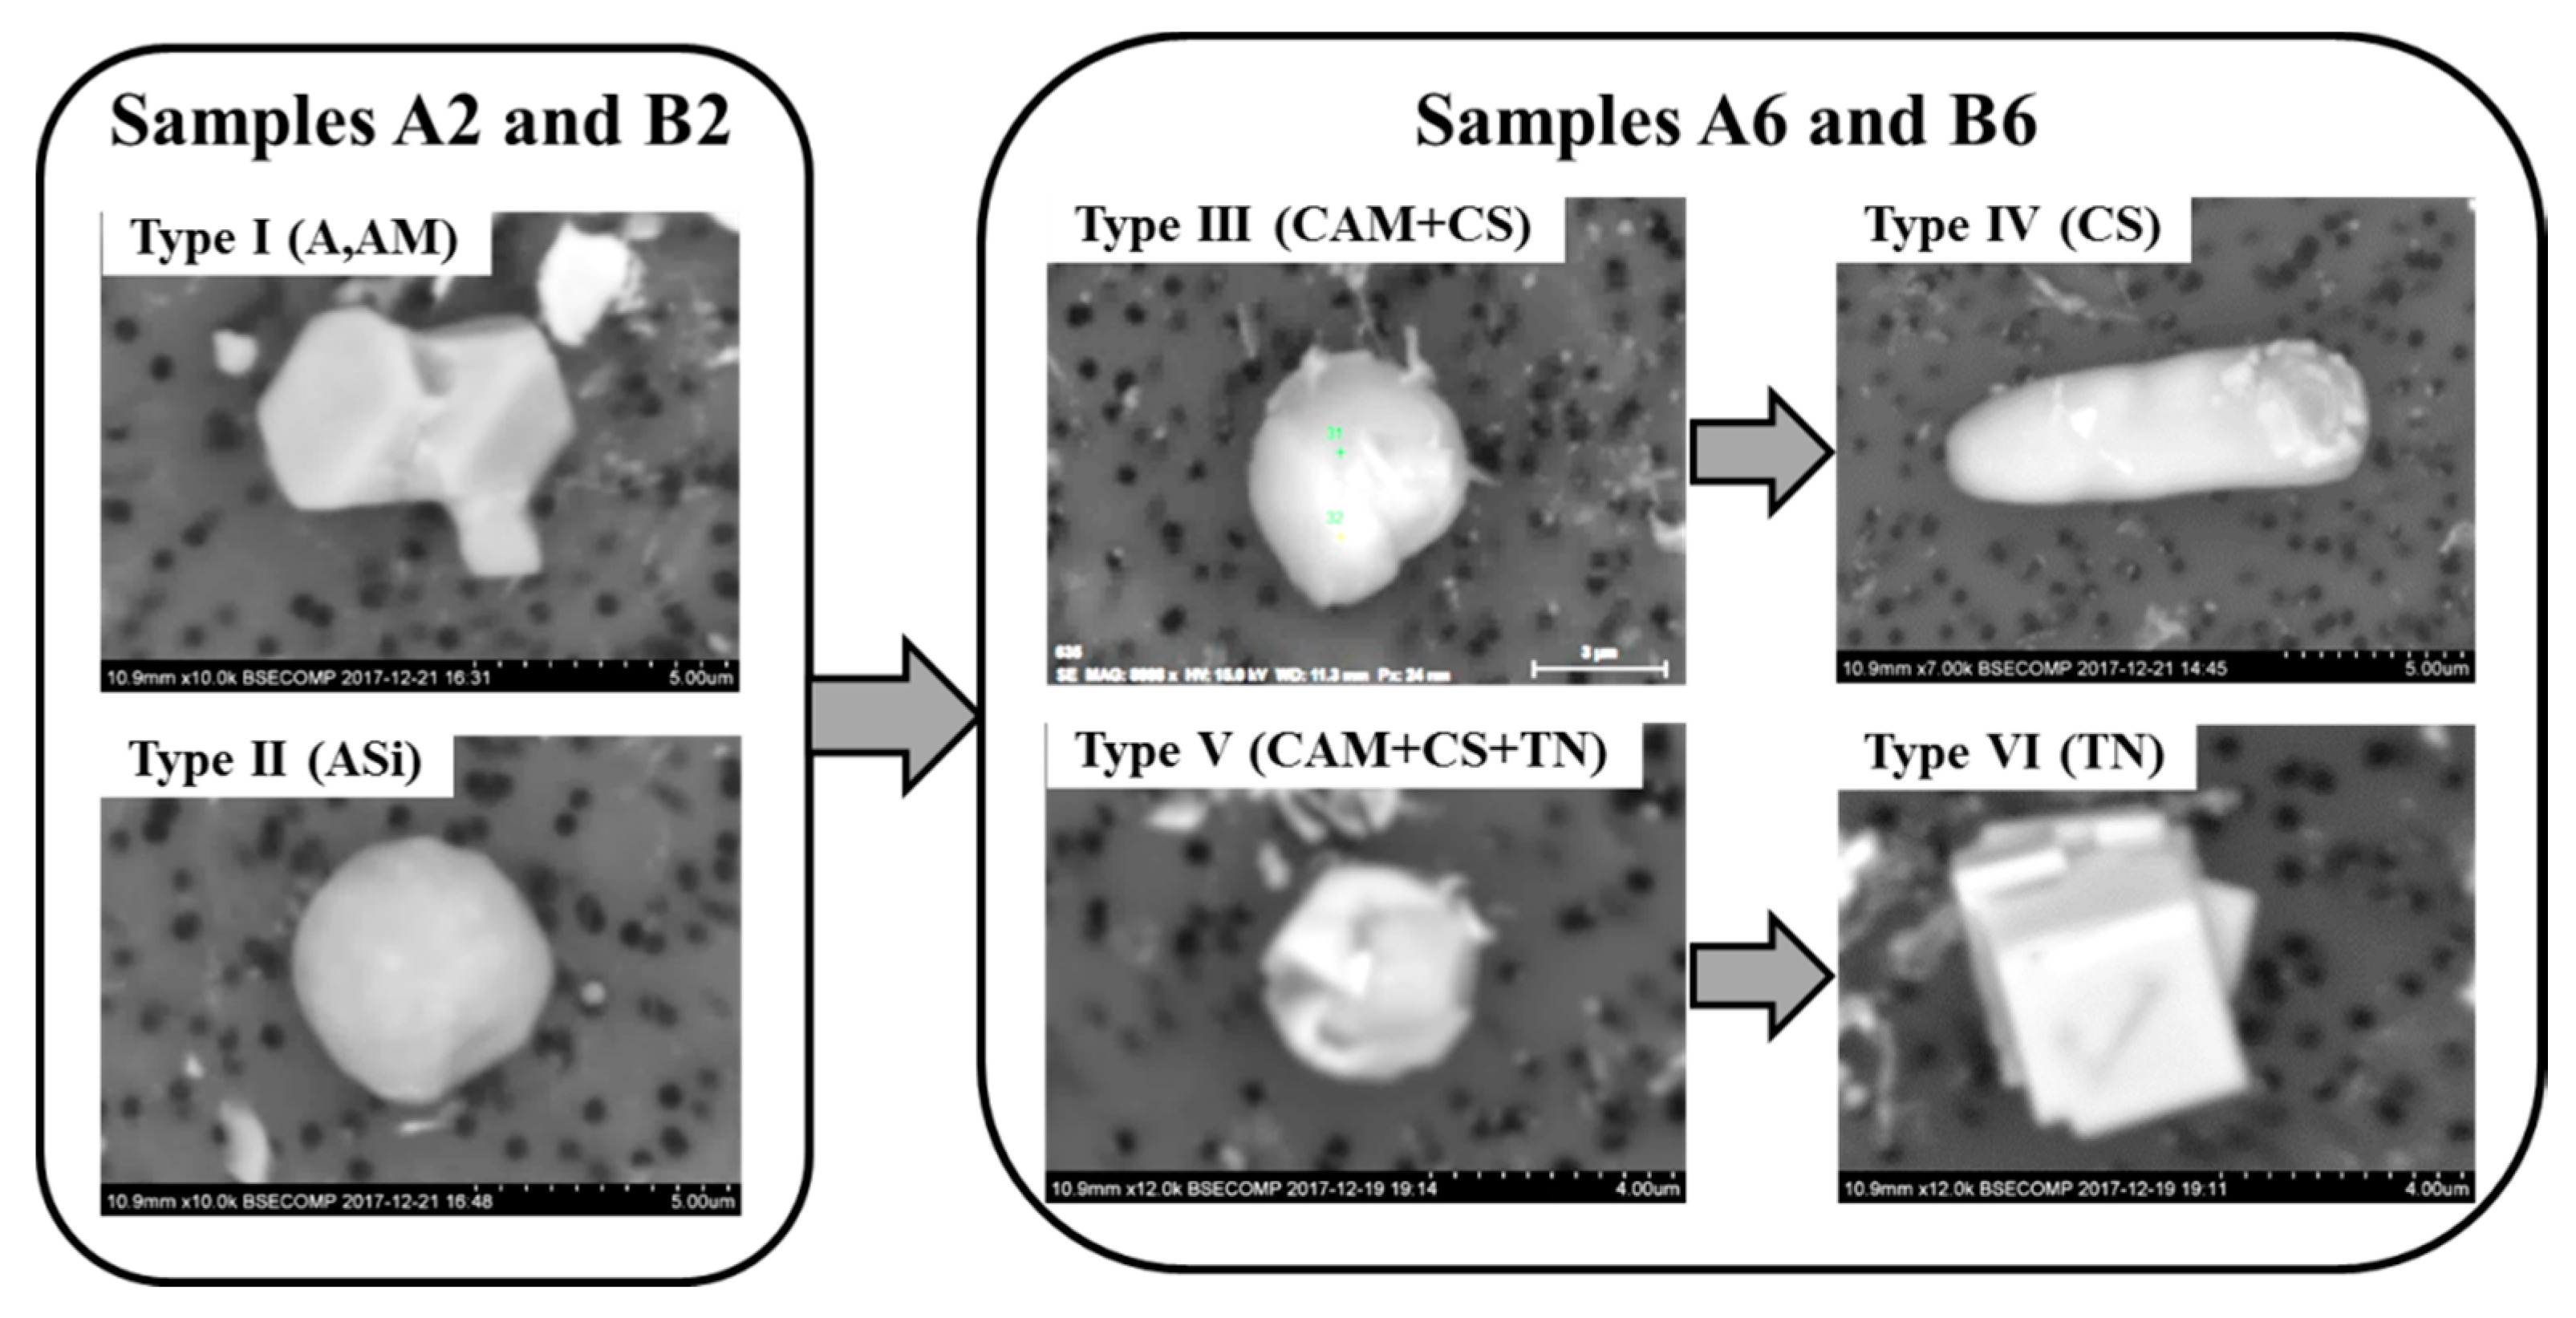
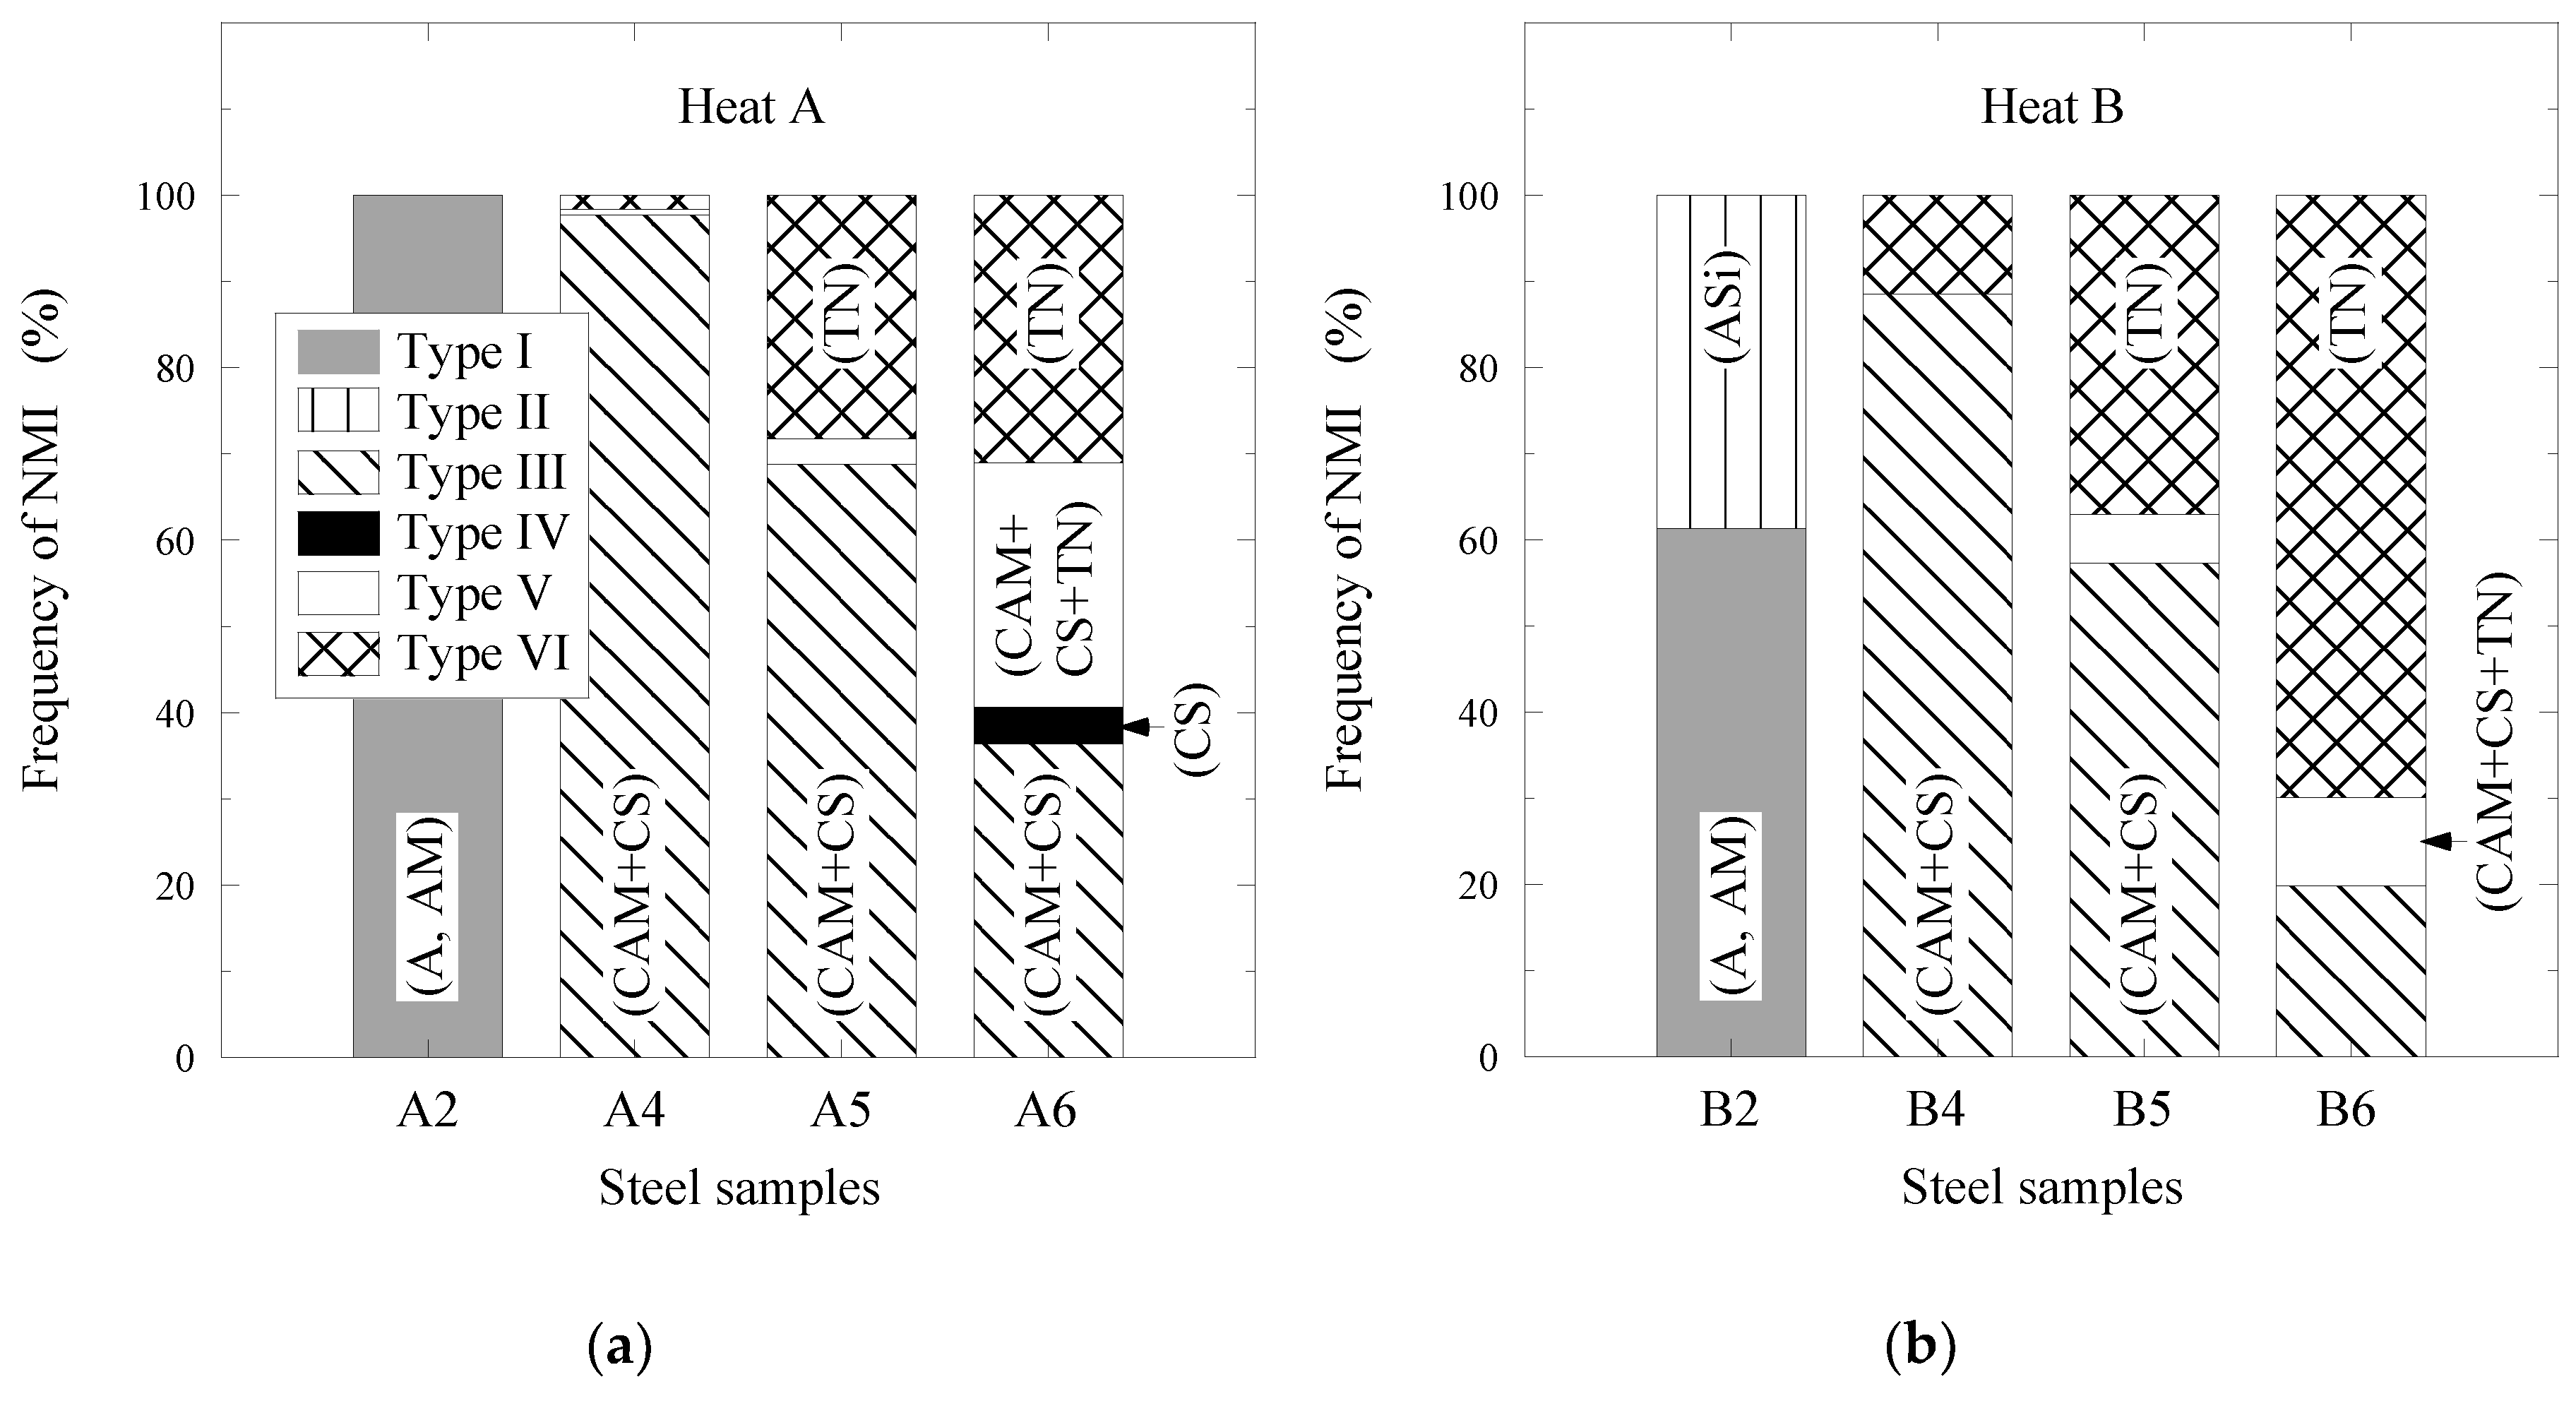
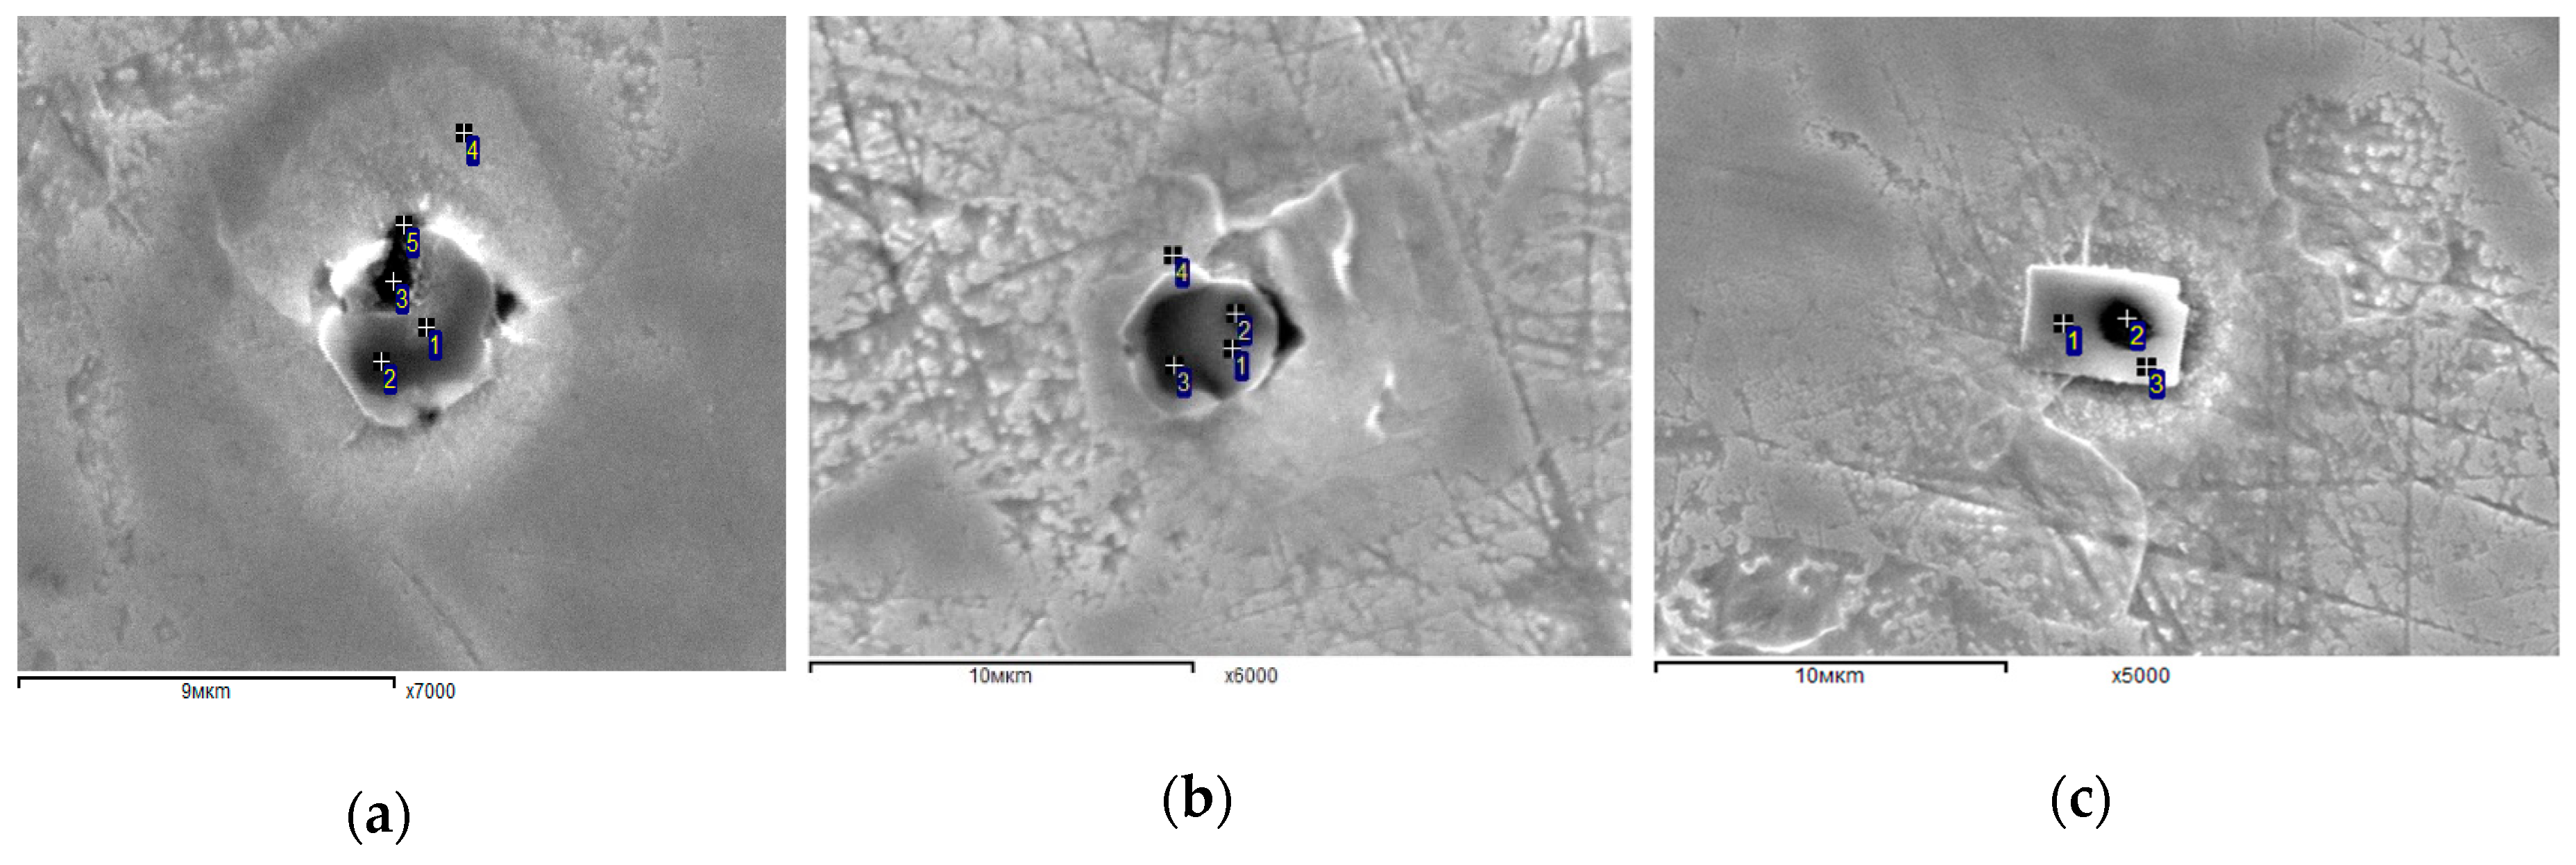
  • After Ca-treatment, the initial oxide NMI (Type I—Al2O3/Al2O3-MgO inclusions and clusters and Type II—Al2O3-SiO2 inclusions) in steel samples A2 and B2 were modified to CaO-Al2O3-MgO inclusions. The oxide cores of Type III inclusions in steel samples taken after an addition of Ca (samples A4 and B4) contained about 40–90% of CaO in both heats. Then, the content of CaS significantly increased in the outer layer in Type III inclusions (up to 10–45% in the B6 sample and ~40–60% in the sample A6) and in the Type IV inclusions (up to 97–100% in A6 sample). Also, some amounts of TiN were found to precipitate in the outer layer of Type V (up to 53%) and Type VI (78–100%) inclusions during the solidification of steel.
  • The frequency of Type III oxy-sulfide inclusions in the steel samples after Ca-treatment decreases drastically from ~98% to 36% in Heat A and from ~89% to 20% in Heat B, while the frequency of Types V and VI inclusions containing TiN increased significantly up to values between 59% and 80% in the steel samples A6 and B6, respectively.
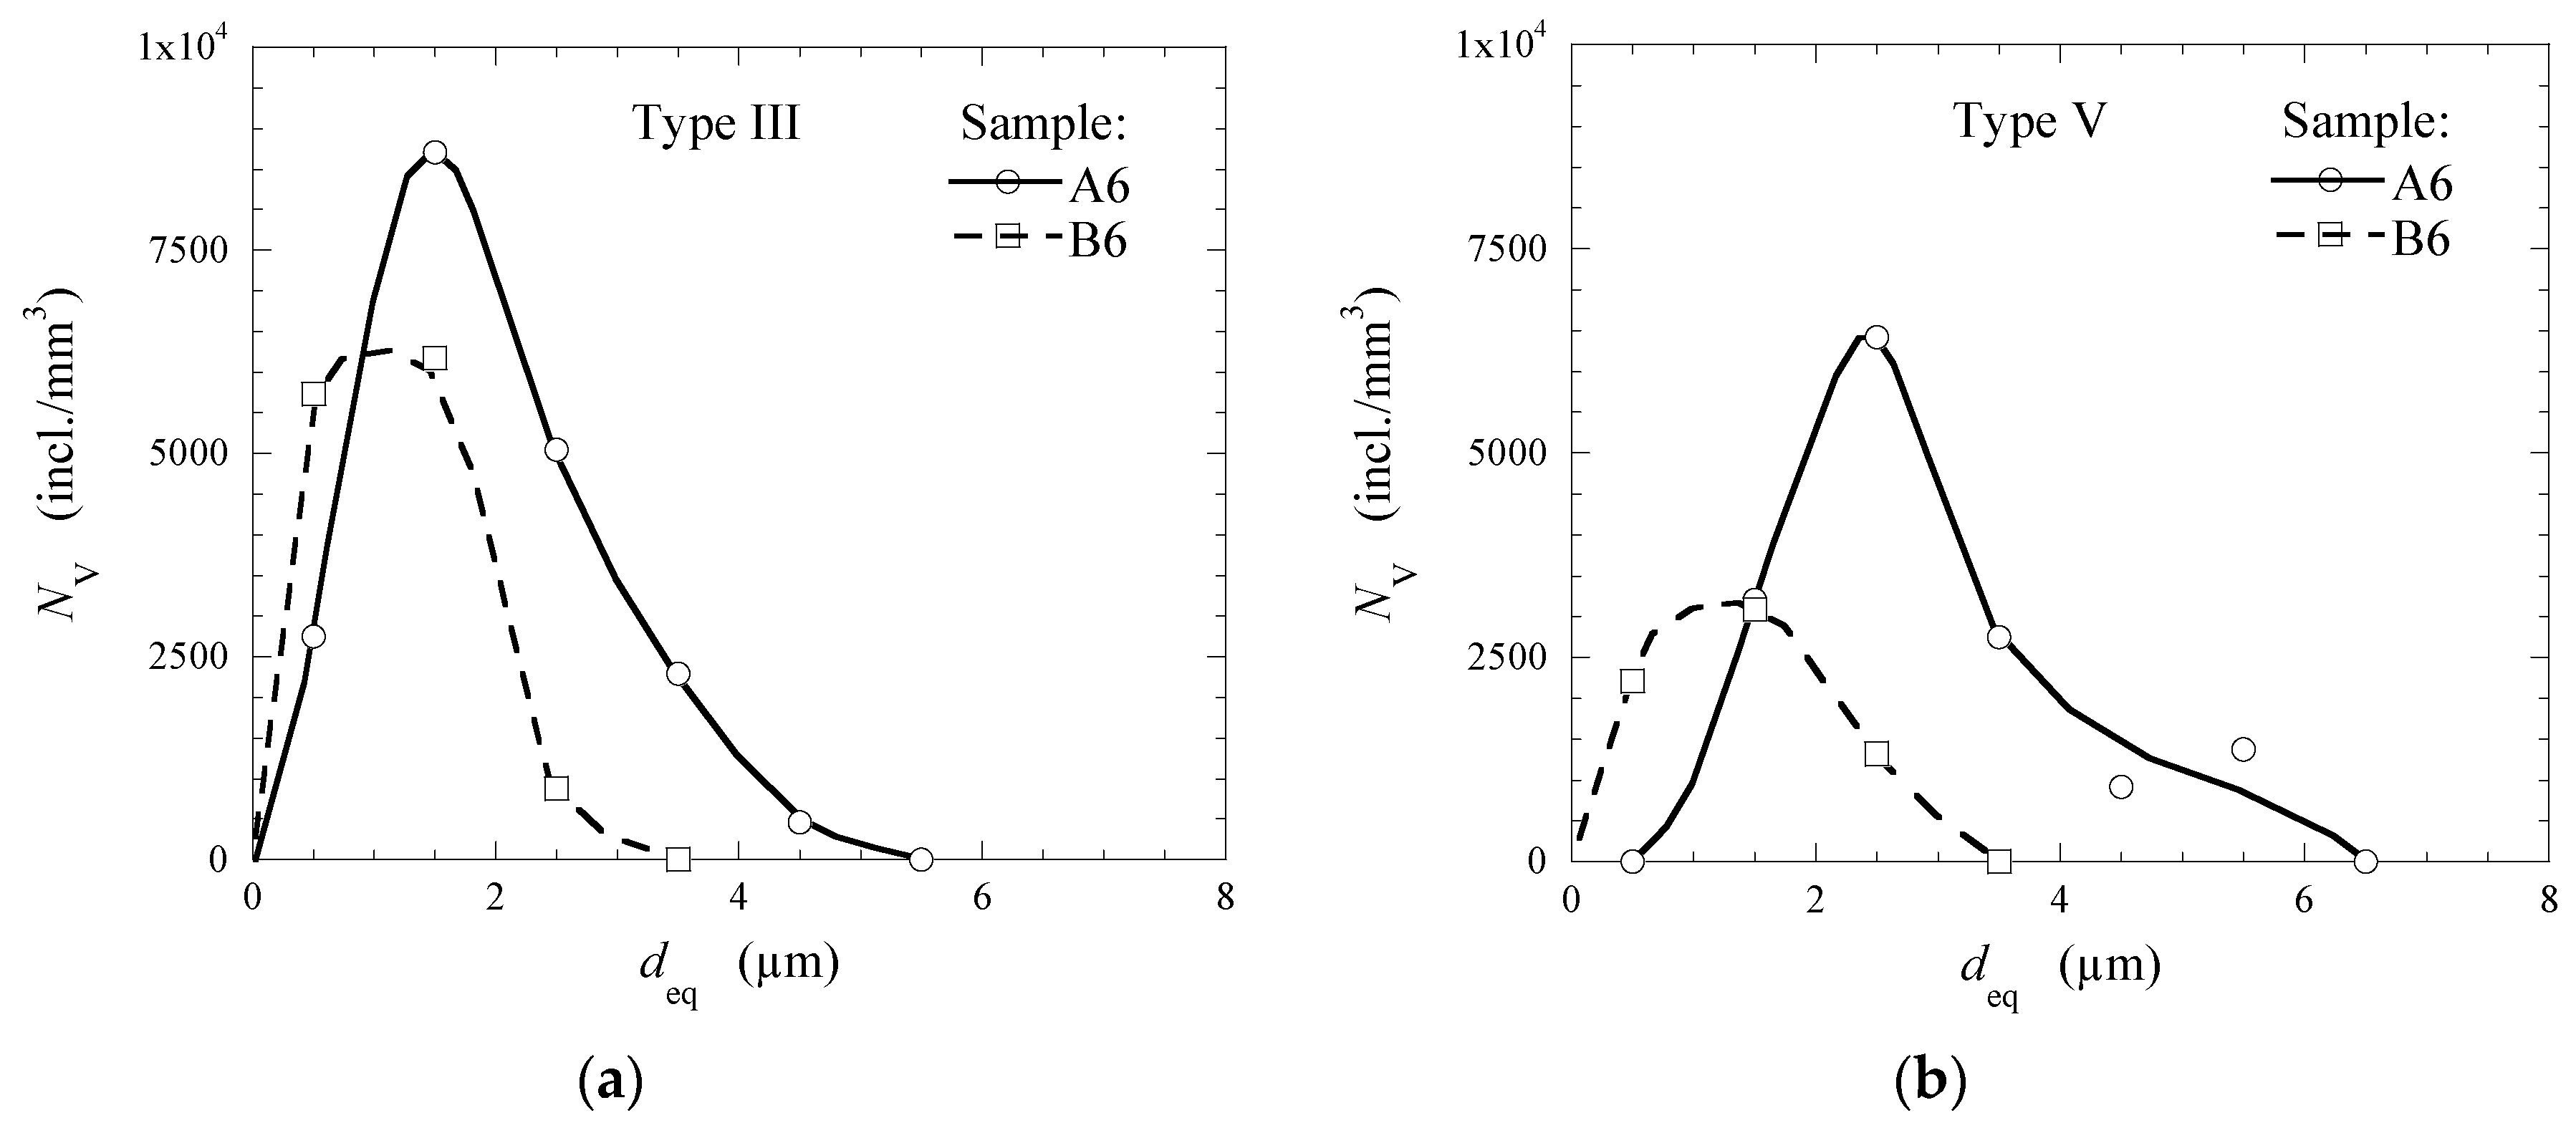
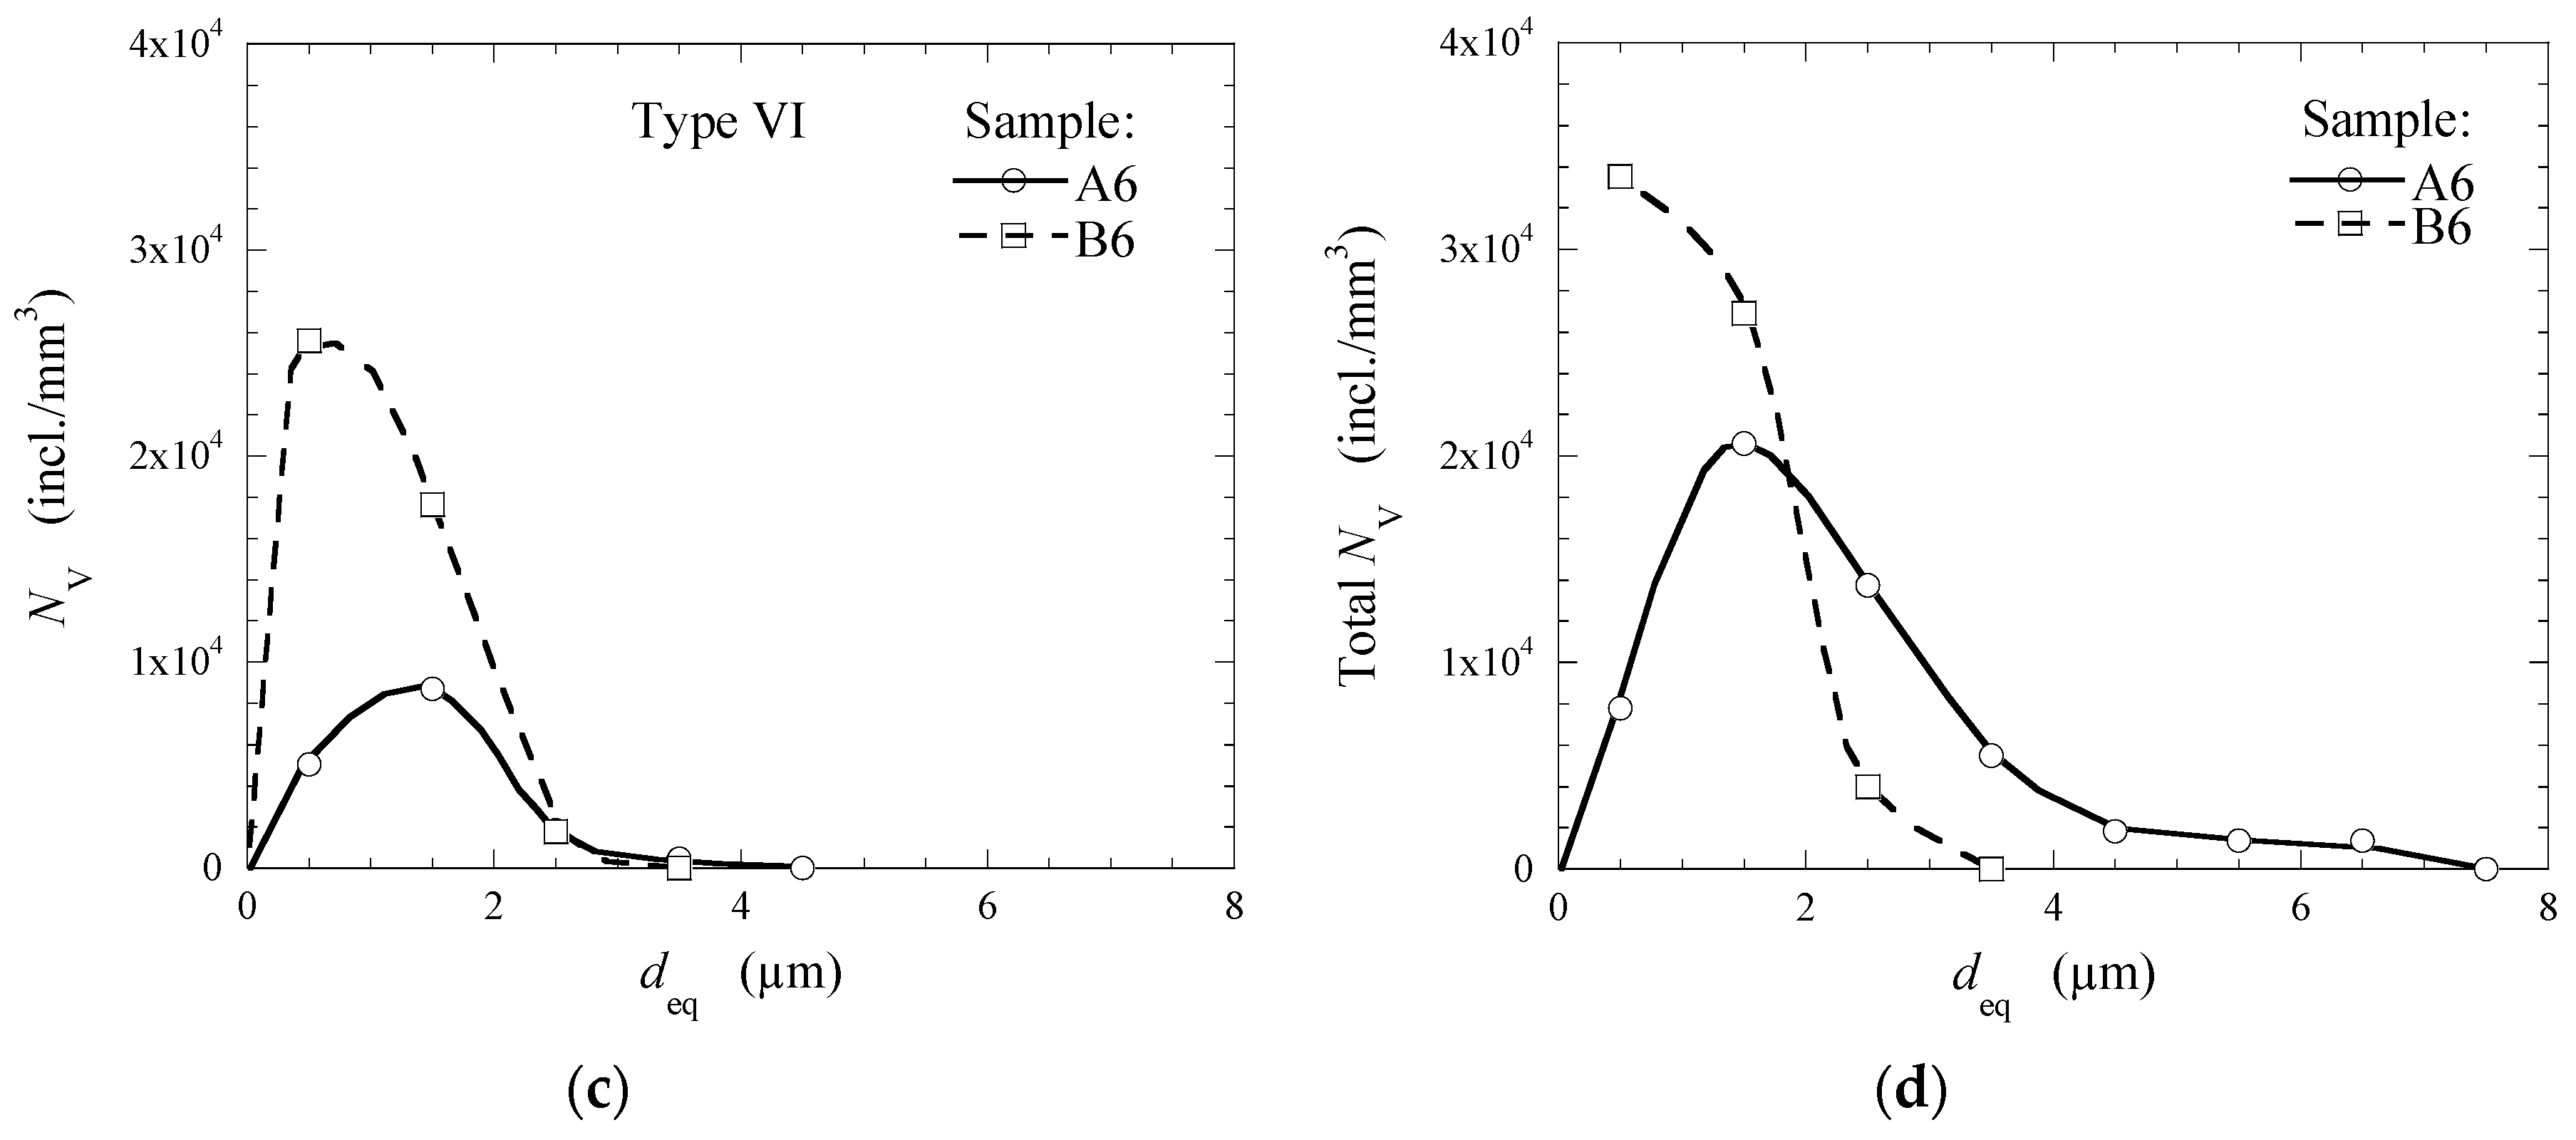
  • Although the total number of inclusions in the Heat B is larger than that in the Heat A, the average and maximum sizes of the observed inclusions in Heat B are significantly smaller than those in Heat A. Especially, the average size of the CaS inclusions of Type IV (~5.3 µm), which were only observed in the final product of Heat A, is significantly larger compared to the other types of NMI (1.1–2.8 µm) in both heats.
  • The final product of the Heat A has larger amounts (~2.4 times) of the discovered corrosion-active non-metallic inclusions in the size range of 5–7 μm compared to the level in Heat B. Also, most of the corrosion-active non-metallic inclusions correspond to large size inclusions of Types III, IV, V, and VI, which were observed in both heats.

Author Contributions

Conceptualization, A.V.K., and D.K.; methodology, E.S., and A.V.K.; investigation, E.S., and A.V.K.; resources, D.K., and P.G.J.; writing—original draft preparation, E.S., and A.V.K.; writing—review and editing, D.K., and P.G.J; supervision—D.K., and P.G.J.

Funding

This research received no external funding.

Conflicts of Interest

The authors declare no conflict of interest.

References

  1. Carneiro, R.A.; Ratnapuli, R.C.; Lins, V.F.C. The Influence of Chemical Composition and Microstructure of API Linepipe Steels on Hydrogen Induced Cracking and Sulfide Stress Corrosion Cracking. Mater. Sci. Eng. A 2003, 357, 104–110. [Google Scholar] [CrossRef]
  2. Xue, H.B.; Cheng, Y.F. Characterization of Inclusions of X80 Pipeline Steel and its Correlation with Hydrogen-induced Cracking. Corros. Sci. 2011, 53, 1201–1208. [Google Scholar] [CrossRef]
  3. Yin, X.; Sun, Y.H.; Yang, Y.D.; Deng, X.X.; McLean, A. Effects of Non-Metallic Inclusions and Their Shape Modification on the Properties of Pipeline Steel. In Proceedings of the AISTech Conference Proceedings—7th International Conference on the Science and Technology of Ironmaking, Cleveland, OH, USA, 4–7 May 2015; PR-368-358-2015. pp. 3388–3406. [Google Scholar]
  4. Tetelman, A.S.; Robertson, W.D. The Mechanism of Hydrogen Embrittlement Observed in Iron-Silicon Single Crystals; Ft. Belvoir Defense Technical Information Center: Fort Belvoir, VA, USA, 1961.
  5. Oriani, R.A.; Josephic, P.H. Hydrogen-enhanced Load Relaxation in a Deformed Medium-carbon Steel. Acta Metall. 1979, 27, 997–1005. [Google Scholar] [CrossRef]
  6. Herring, D.H. Hydrogen Embrittlement. Wire Forming Technology International. 2010. Available online: http://www.heat-treat-doctor.com/documents/Hydrogen%20Embrittlement.pdf (accessed on 17 December 2018).
  7. Huang, F.; Liu, J.; Deng, Z.; Cheng, J.; Lu, Z.; Li, X. Effect of microstructure and inclusions on hydrogen induced cracking susceptibility and hydrogen trapping efficiency of X120 pipeline steel. Mater. Sci. Eng. A 2010, 527, 6997–7001. [Google Scholar] [CrossRef]
  8. Kim, W.K.; Koh, S.U.; Yang, B.Y.; Kim, K.Y. Effect of Environmental and Metallurgical Factors on Hydrogen Induced Cracking of HSLA Steels. Corros. Sci. 2008, 50, 3336–3342. [Google Scholar] [CrossRef]
  9. Moon, J.; Kim, S.J.; Lee, C. Role of Ca Treatment in Hydrogen Induced Cracking of Hot Rolled API Pipeline Steel in Acid Sour Media. Met. Mater. Int. 2013, 19, 45–48. [Google Scholar] [CrossRef]
  10. Lube, I.I.; Pecheritsa, A.A.; Neklyudov, I.V.; Rodionova, I.G.; Zaitsev, A.I.; Marchenko, L.G.; Emel’yanov, A.V.; Stolyarov, V.I. Study of the effect of process parameters in steel production on the content of corrosion-active nonmetallic inclusions in corrosion-resistant pipes. Metallurgist 2005, 49, 269–275. [Google Scholar] [CrossRef]
  11. Mitrofanov, A.V.; Petrova, M.V.; Kirillov, I.E.; Rodionova, I.G.; Udod, K.A.; Endel’, N.I. Factors affecting housing and utilities pipe corrosion resistance. Metallurgist 2016, 60, 76–80. [Google Scholar] [CrossRef]
  12. Karasev, A.V.; Suito, H. Analysis of Size Distributions of Primary Oxide Inclusions in Fe-10 mass pct Ni-M (M = Si, Ti, Al, Zr, and Ce) Alloy. Metall. Mater. Trans. B 1999, 30, 259–270. [Google Scholar] [CrossRef]
  13. Ohta, H.; Suito, H. Characteristics of Particle Size Distribution of Deoxidation Products with Mg, Zr, Al, Ca, Si/Mn and Mg/Al in Fe-10mass% Ni Alloy. ISIJ Int. 2006, 46, 14–21. [Google Scholar] [CrossRef]
  14. Doostmohammadi, H.; Karasev, A.; Jönsson, P.G. A Comparison of a Two-Dimensional and a Three-Dimensional Method for Inclusion Determinations in Tool Steel. Steel Res. Int. 2010, 81, 398–406. [Google Scholar] [CrossRef]
  15. Kanbe, Y.; Karasev, A.; Todoroki, H.; Jönsson, P.G. Analysis of Largest Sulfide Inclusions in Low Carbon Steel by Using Statistics of Extreme Values. Steel Res. Int. 2011, 82, 313–322. [Google Scholar] [CrossRef]
  16. Kanbe, Y.; Karasev, A.; Todoroki, H.; Jönsson, P.G. Application of Extreme Value Analysis for Two- and Three-Dimensional Determinations of the Largest Inclusion in Metal Samples. ISIJ Int. 2011, 51, 593–602. [Google Scholar] [CrossRef]
  17. Karasev, A.; Jönsson, P.G. Assessment of Non-Metallic Inclusions in Different Industrial Steel Grades by Using the Electrolytic Extraction Method. In Proceedings of the 5th International Conference on Process Development in Iron and Steelmaking SCANMET-V, Luleå, Sweden, 12–15 June 2016; pp. 1–7. [Google Scholar]
Figure 1. Schematic illustration of the process steps and sampling times.
Metals 09 00391 g001
Figure 2. (a) Schematic illustration of the electrolytic extraction process; (b) SEM image of some typical non-metallic inclusions present on a film filter after a completed electrolytic extraction.
Metals 09 00391 g002
Figure 3. Typical SEM images of corrosion active non-metallic inclusion in steel samples after etching: (a) from Heat A; (b) from Heat B.
Metals 09 00391 g003
Figure 4. Typical microstructures observed in steel samples: (a) Heat A (magnification of ×200); (b) Heat A (magnification of ×500); (c) Heat B (magnification of ×200); (d) Heat B (magnification of ×500).
Metals 09 00391 g004
Figure 5. Different types of inclusions observed in steel samples: (a) Heat A; (b) Heat B.
Metals 09 00391 g005
Figure 6. Particle size distributions for different non-metallic inclusions observed in the final products in Heat A and Heat B (samples A6 and B6): (a) Type III inclusions; (b) Type V inclusions; (c) Type VI inclusions; (d) all inclusions.
Metals 09 00391 g006aMetals 09 00391 g006b
Figure 7. Modification of typical oxide and oxy-sulfide inclusions in steel samples: (a) Heat A; (b) Heat B.
Metals 09 00391 g007
Figure 8. Modification of oxide inclusions by Ca-treatment of oil-pipeline steel.
Metals 09 00391 g008
Figure 9. Typical corrosion active non-metallic inclusions observed after etching of hot rolled oil-pipeline steel samples: (a) Type III (CAM + CS), (b) Type V (CAM + CS + TN) and (c) Type VI (TN).
Metals 09 00391 g009
Table 1. Contents of main elements in steels from both heats (wt%).
SteelCSiMnCrNiCuAlTiCaSN
A0.060.240.630.430.170.330.0250.0190.00200.0020.005
B0.050.230.670.430.180.350.0220.0210.00140.0010.007
Table 2. Classification of typical non-metallic inclusions observed in different steel samples.
Type of NMI 1CompositionSize (µm)Sample
Metals 09 00391 i001
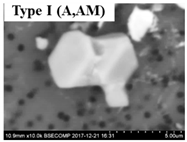
Al2O3—75–84%,
MgO—0–19%,
CaO—0–17%,
CaS—0–5%.
0.5–7.9A2, B2
Metals 09 00391 i002
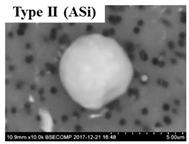
Al2O3—5–78%,
SiO2—21–94%,
MgO—0–2%,
CaO—0–4%,
CaS—0–5%.
0.7–5.6B2
Metals 09 00391 i003
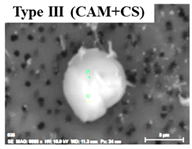
CaO—9–69%,
Al2O3—2–54%,
MgO—0–22%,
SiO2—0–7%,
CaS—9–62%.
0.9–5.2A4–A6 B4–B6
Metals 09 00391 i004
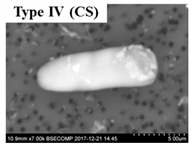
CaS—97–100%,
Al2O3—0–2%,
MgO—0–1%,
CaO—0–2%.
2.5–7.4A6
Metals 09 00391 i005CaO—4–45%,
Al2O3—4–45%,
MgO—0–19%,
SiO2—1–5%,
CaS—0–50%,
TiN—1–53%.
1.1–5.0A4–A6, B5–B6
Metals 09 00391 i006
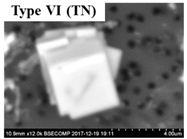
TiN—78–100%,
Al2O3—0–5%,
MgO—0–5%,
CaO—0–5%,
CaS—0–13%.
0.7–4.3A4–A6, B4–B6
1 A—Al2O3; M—MgO; Si—SiO2; C—CaO; CS—CaS; TN—TiN.
Table 3. Quantitative analysis of corrosion active non-metallic inclusions in hot rolled steels. NMI: non-metallic inclusions.
Steel NA of Corrosion Active NMI (incl./mm2)
A8.5
B3.5

