Article

Prediction and Knowledge Mining of Outdoor Atmospheric Corrosion Rates of Low Alloy Steels Based on the Random Forests Approach

1
School of Automation and Electrical Engineering, University of Science and Technology Beijing, Beijing 100083, China
2
Institute of Advanced Materials & Technology, University of Science and Technology Beijing, Beijing 100083, China
*
Author to whom correspondence should be addressed.
Metals 2019, 9(3), 383; https://doi.org/10.3390/met9030383
Submission received: 11 March 2019 / Revised: 19 March 2019 / Accepted: 23 March 2019 / Published: 26 March 2019

Abstract

:
The objective of this paper is to develop an approach to forecast the outdoor atmospheric corrosion rate of low alloy steels and do corrosion-knowledge mining by using a Random Forests algorithm as a mining tool. We collected the corrosion data of 17 low alloy steels under 6 atmospheric corrosion test stations in China over 16 years as the experimental datasets. Based on the datasets, a Random Forests model is established to implement the purpose of the corrosion rate prediction and data-mining. The results showed that the random forests can achieve the best generalization results compared to the commonly used machine learning methods such as the artificial neural network, support vector regression, and logistic regression. In addition, the results also showed that regarding the effect to the corrosion rate, environmental factors contributed more than chemical compositions in the low alloy steels, but as exposure time increases, the effect of the environmental factors will gradually become less. Furthermore, we give the effect changes of six environmental factors (Cl concentration, SO2 concentration, relative humidity, temperature, rainfall, and pH) on corrosion with exposure time increasing, and the results illustrated that pH had a significant contribution to the corrosion of the entire process. The paper also dealt with the problem of the corrosion rate forecast, especially for changing environmental factors situations, and obtained the qualitative and quantitative results of influences of each environmental factor on corrosion.

1. Introduction

Due to the addition of alloying elements such as Cr, Ni, Cu, P, etc. [1], low alloy steels (abbreviated as LAS) have a better corrosion resistance than carbon steels [2,3]. Therefore, LAS have been widely used for many constructions such as bridges [4,5], cargo oil tanks [6], pipelines [7], and more. During the service period, the LAS would suffer complex corrosion degradation and eventually fail its service performance, which could result in enormous economic and human-life losses [8]. Therefore, how to forecast the corrosion status of LAS and further predict the remaining life has an important practical engineering significance.
In recent years, with the development of machine-learning algorithms, many studies have used machine-learning technology to establish the corrosion model and to implement the prediction of the corrosion status [9,10,11,12,13,14,15,16,17]. For example, Kamrunnahar [9,10], Jiang [11], Shirazi [12], and Shi [13] used artificial neural networks (abbreviated as ANN) to build the corrosion behavior model [9,10] or prediction model [11,12,13] of one specific alloy material. Fang established a corrosion loss prediction model of metallic materials in an atmospheric environment based on support vector regression (abbreviated as SVR) [14]. Panchenko studied the law of corrosion as a function of the exposure time, and according to the mining law, he utilized the power function [15] and power-linear [16] function to implement the long-term prediction of corrosion. Shi analyzed and built a prediction model of the corrosion density data using a hidden Markov chain method [17]. However, in most of the above works, the objective was just one single material [9,10,11,12,13,14,17] or had one single input variable [15,16]. When extended to the corrosion prediction of various materials in a variety of environmental conditions, there still exist some problems in the above methods, leading to poor performance on the datasets.
According to analysis, the corrosion datasets of various materials in multiple environments conditions presented three main characteristics, including: (1) non-linearity, the interaction between steel and surrounding environment makes the corrosion process very complex and non-linear; (2) small samples, under outdoor conditions, the acquisition of each corrosion sample requires a long exposure time, that is to say, there needs one year or even several years to obtain just one sample; and 3) steep-manifold, this property refers to the fact that though one input variable value had a slight change, it may lead the corrosion rate to change significantly [18]. The three characteristics add up to a challenge for the establishment of corrosion models.
The Random Forests model (abbreviated as RF) [19] is one of the most popular machine-learning algorithms available today. Due to the advantages such as simple-structure, easy-implementation [19], anti-overfitting nature [20], etc., RF has been widely used in many fields, such as image recognition [21], geography [22], economics [23], manufacturing [24], agriculture [25] and nanomaterials [26]. Compared to ANN and SVR, RF has a deeper model structure and works better for datasets with steep-manifold characteristic [27]. Besides, RF is also suitable for datasets with small samples and non-linearity [20,28]. Recently, some researchers have applied RF to the field of corrosion. Hou used RF to establish a mapping relationship between corrosion current and corrosion type and achieved a good result [29,30]. Therefore, we believe that the RF can be used to build the model of outdoor atmospheric corrosion datasets and further to do corrosion knowledge mining.
In this paper, the collected corrosion samples are described in Section 2. The RF model structure is discussed in Section 3. Prediction results and data-mining results are shown in Section 4. The summary of the data analysis and conclusions are presented in Section 5.

2. Materials

The paper collected the corrosion results of 17 kinds of LAS in 6 atmospheric test sites in China over 16 years as experimental datasets. All of the collected samples were from China Corrosion and Protection Gateway, a professional organization for the collection, management, and sharing of corrosion data. In the collected datasets, each sample consisted of material, environment, exposure time and corresponding corrosion rate. Among them, the first three are the input features and the corrosion rate is the output. The objective of the paper is to build the mapping relationship from the input to the output. The detailed information of the materials, environment, and corrosion rate of the samples are illustrated in the following paragraphs.

2.1. Materials

The paper collected 17 LAS as the experimental material. In order to utilize the material as an input feature, the element compositions are used as the quantitative feature of the material. The detailed information of elemental compositions of 17 LAS are shown in Table 1.
Table 1 gives the elemental compositions of the different LAS. In the modeling process, each material would be represented by 7 input variables (except Fe).

2.2. Test Sites and Environmental Factors

According to the collected datasets, the steels were exposed at the outdoor atmospheric condition of 6 typical climate stations of China. For each steel, several parallel specimens with sizes of 100 mm × 100 mm × 5 mm were prepared, and all specimens were positioned at 45° to the horizontal angle. We take the 1st, 2nd, 4th, 8th, and 16th years as the sampling time period, and at each period, we get back 5 specimens to analyze and calculate the corrosion rates for each of them. Their average value is the final collected corrosion rate. The geographical distribution and climate type of test stations are shown in Figure 1a, and the on-site pictures of exposure tests are shown in Figure 1b.
Figure 1a illustrates the geographical distribution of six places, and Figure 1b shows the outdoor experiment scene. In the paper, we collected 6 environmental factors to represent different sites. The environmental factors information is shown in Table 2.
Table 2 gives the 6 environmental factors which can be used for the representation of different sites. According to Table 1, there are 7 input variables for the representation of the material. In addition, the exposure time is also considered as an important input variable. Therefore, the input for modeling is a 14-dimensions variable.

2.3. Corrosion Rate Measurements

The corrosion rate of the steels in the paper is represented by the corrosion thickness loss. The calculation equation is as follows:
Rate = Δ m S Δ t ρ
where, Rate is the corrosion thickness loss (μm/a or μm/year), Δm represents the weight loss (g), S is the initial total surface area of the specimen (m2), Δt is the exposure time (year), and ρ is the density of LAS (g/cm3).
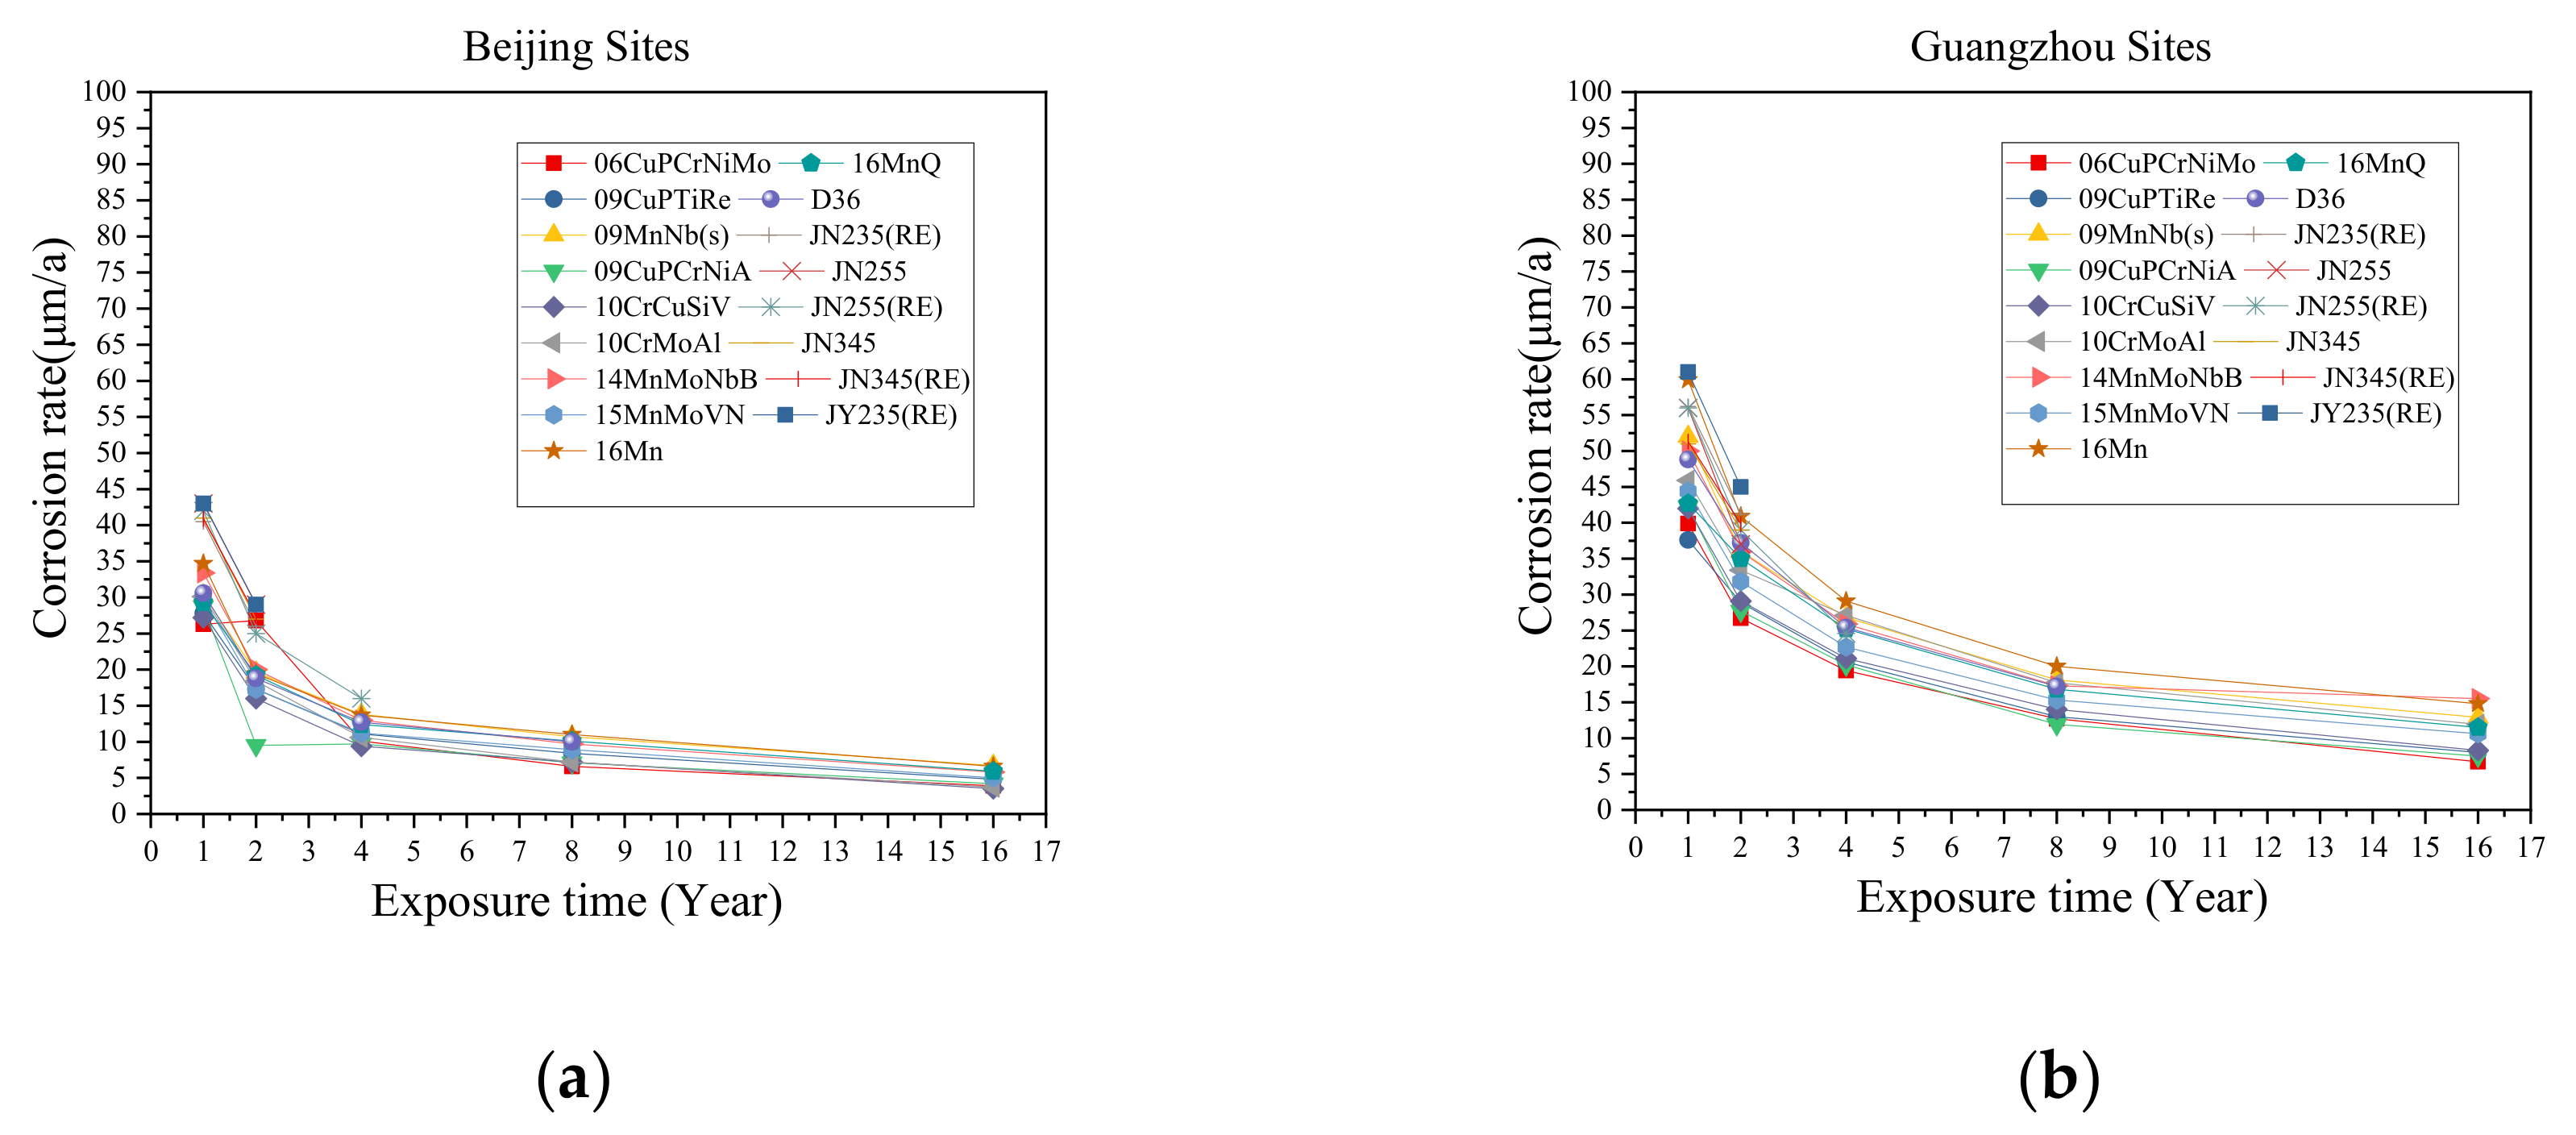
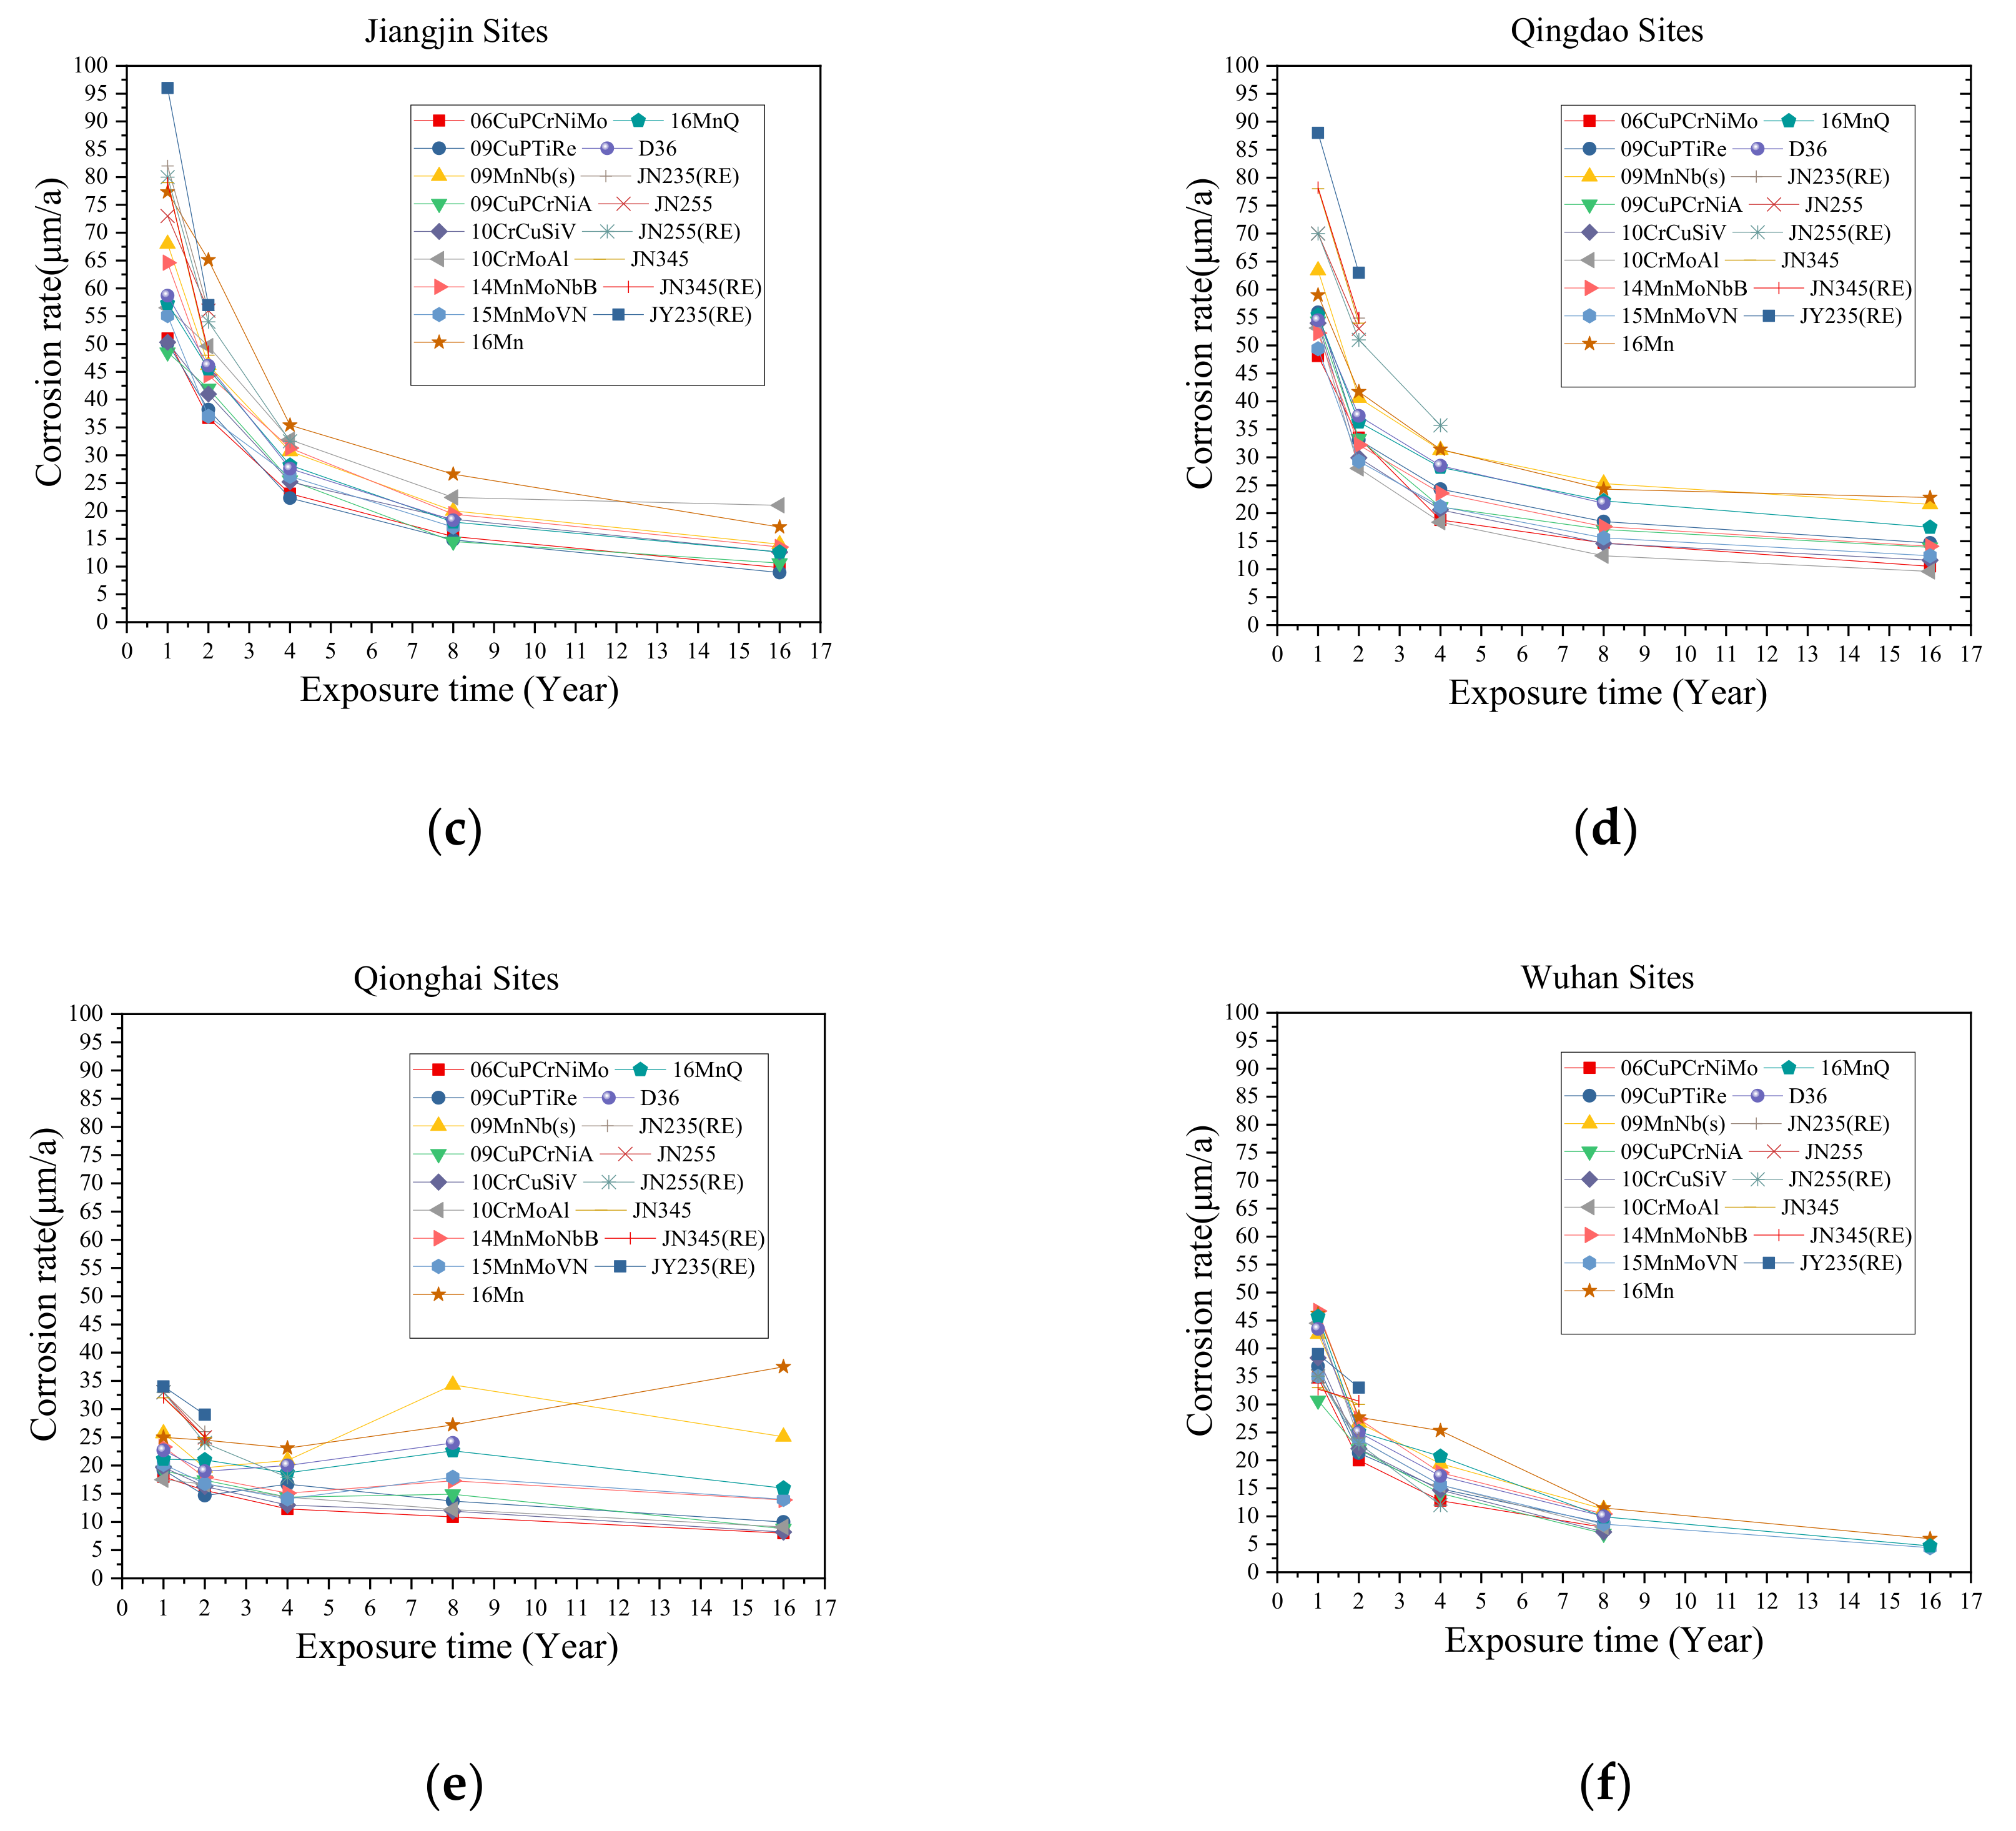
We visualized the corrosion rate change of 17 LAS in 6 sites versus exposure time in Figure 2.
After removing some samples whose input variables are seriously missing, the paper collected 409 corrosion samples as for datasets.

3. Methods

3.1. Random Forests

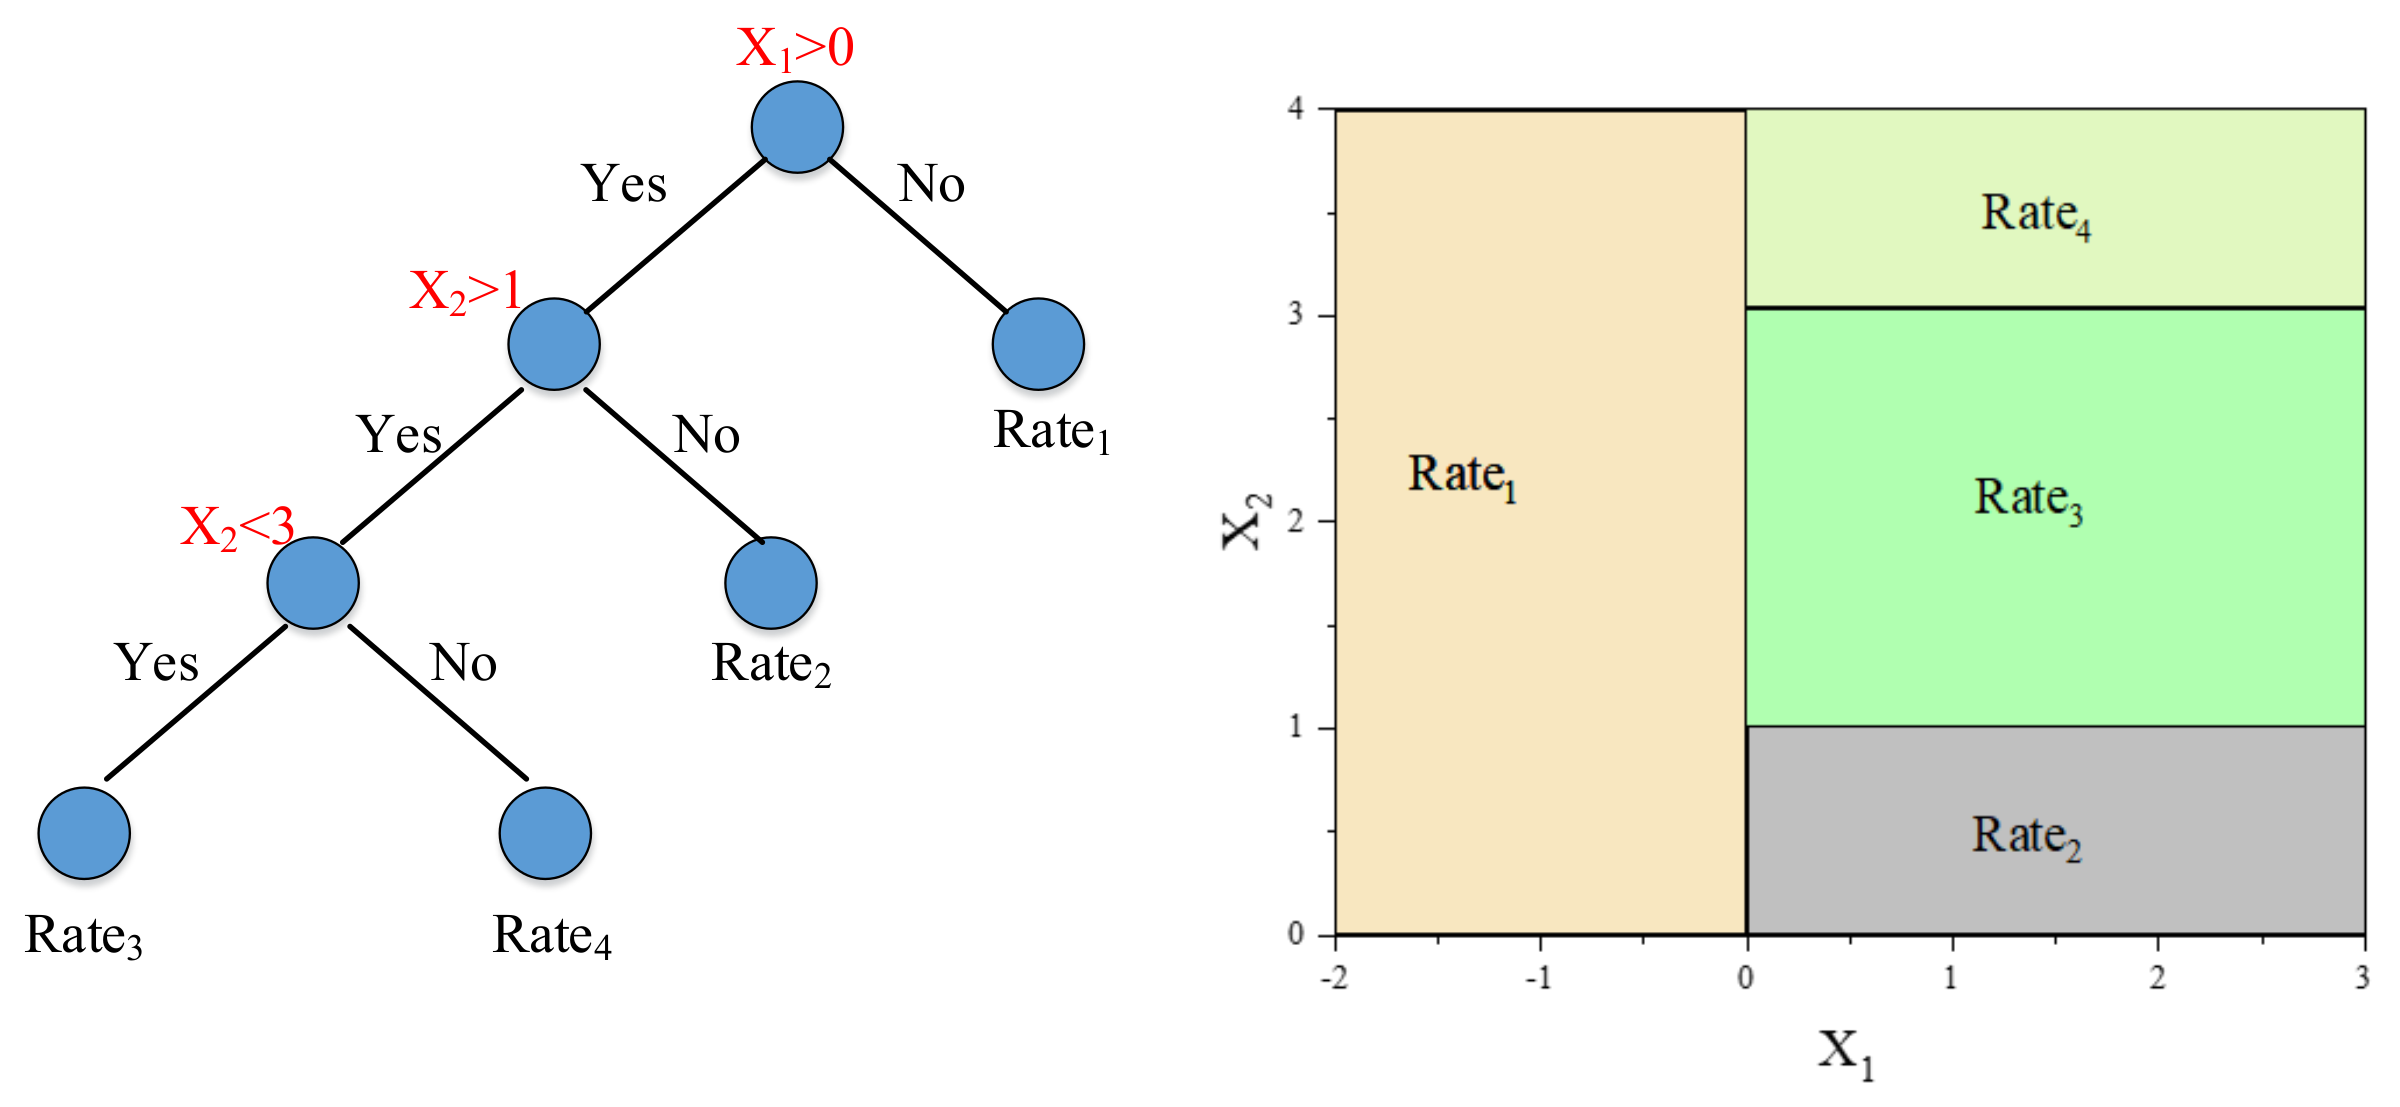
The Random Forests (RF) method is an ensemble learning method for classification or regression problems. The RF consists of a multiple trees model, of which each tree would output a prediction result corresponding to the given input features. The combination of all prediction outcomes from those tree models would form the final result of RF. Therefore, the foundation of RF is the tree model and the utilized tree model in this paper is the Classification and Regression Tree (abbreviated as CART) model. Figure 3 shows an example of a simple CART model for prediction of the corrosion rate.
According to Figure 3, assuming that the input is a two-dimensions variable: X1 and X2. If X1 ≤ 0, then the prediction rate is Rate1; if X1 > 0 and X2 ≤ 1, then Rate2; if X1 > 0 and 1 < X2 < 3, then Rate3; if X1 > 0 and X2 ≥ 3, then Rate4.
Although CART can implement the purpose of corrosion rate prediction, the individual model may lead to the over-fitting phenomenon. In order to avoid overfitting and improve the generalization ability of the prediction model, a series of CARTs are combined by using bootstrap samples of datasets (i.e., randomly selected subsets of data as training samples for each CART). Meanwhile, a subset of the features is also randomly selected at each branch node of the CART.
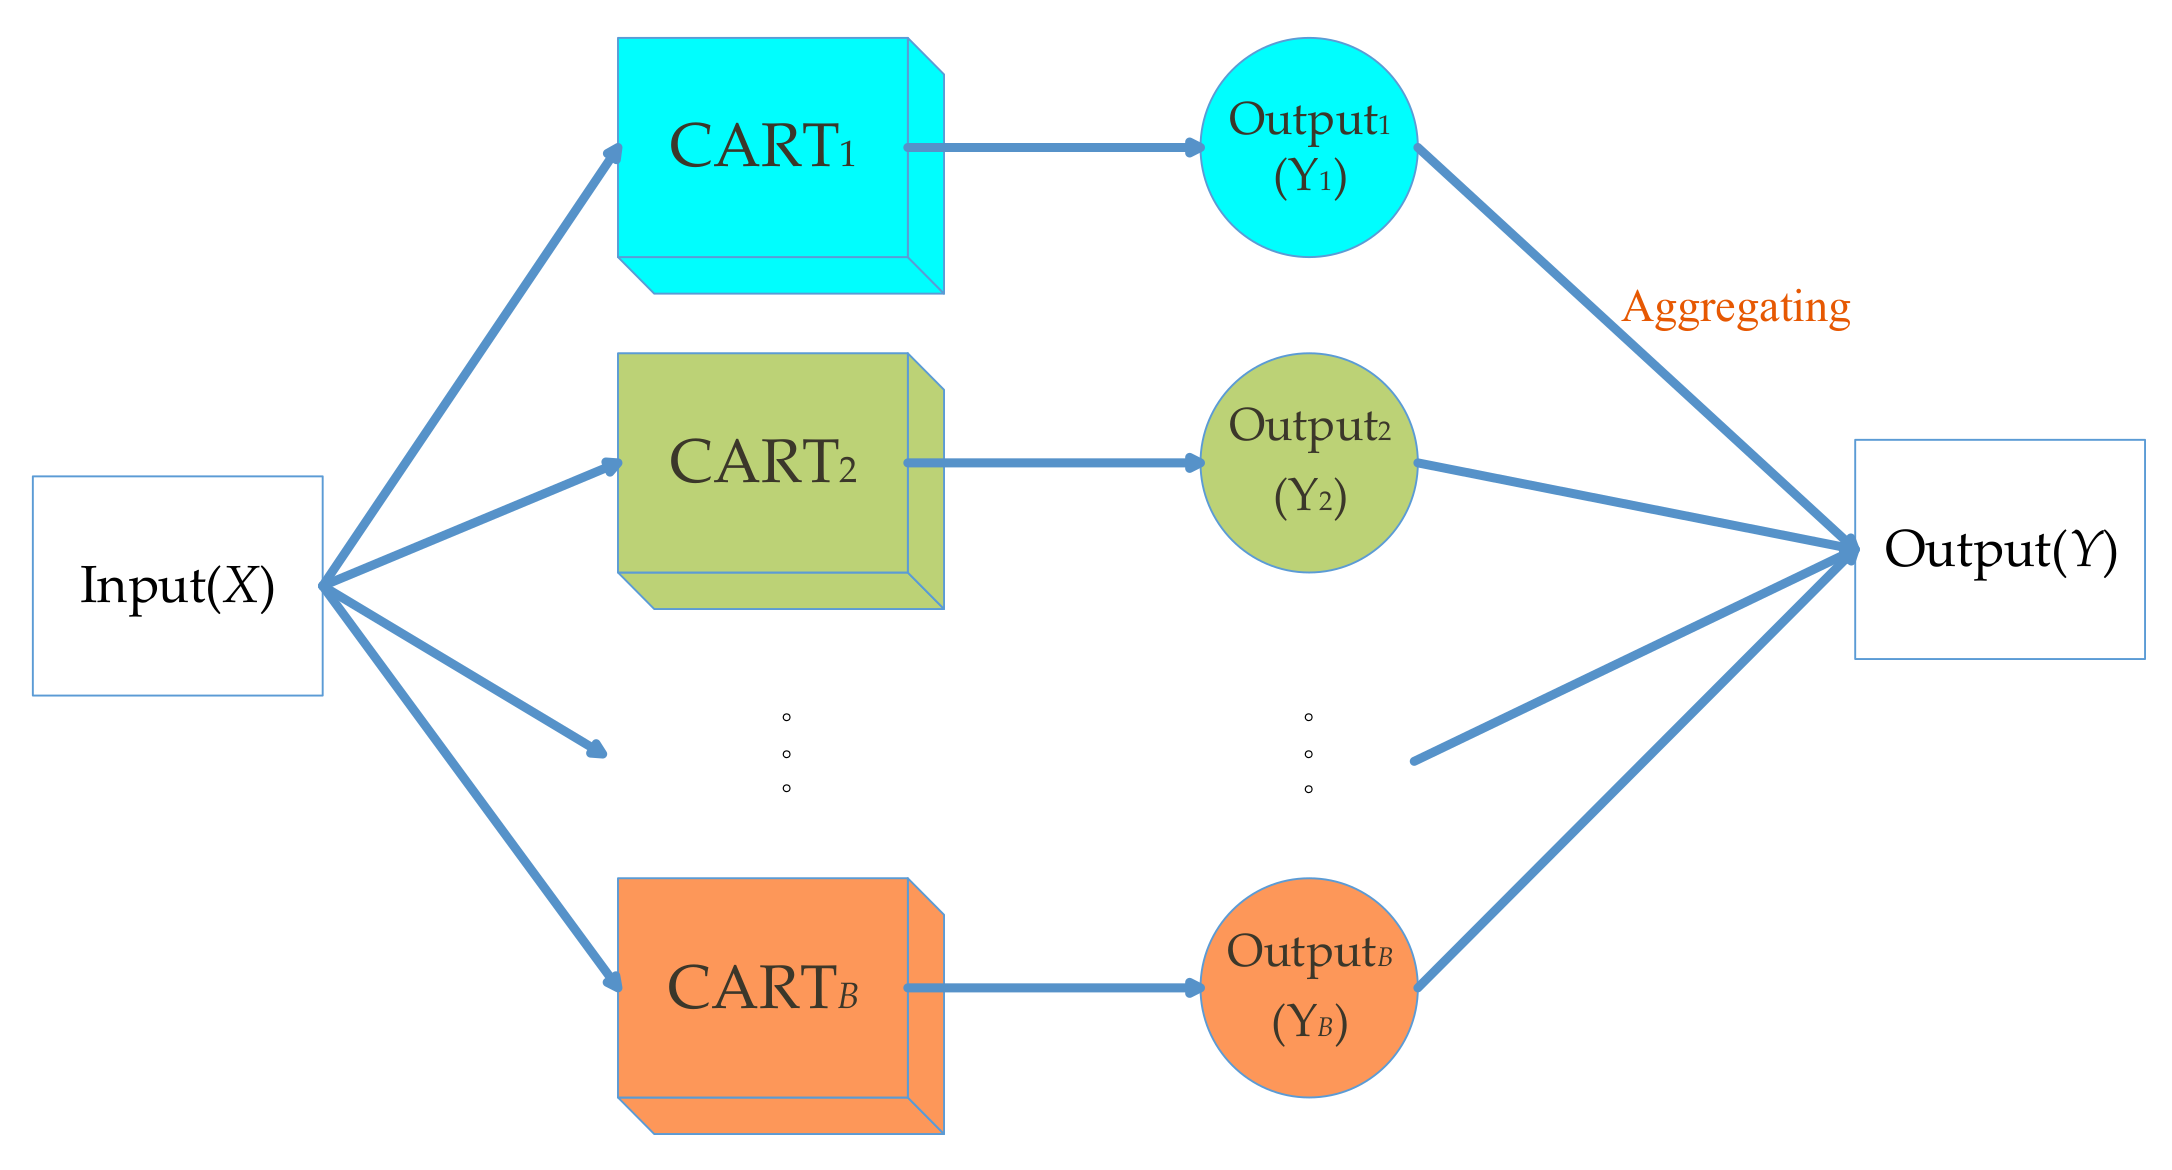
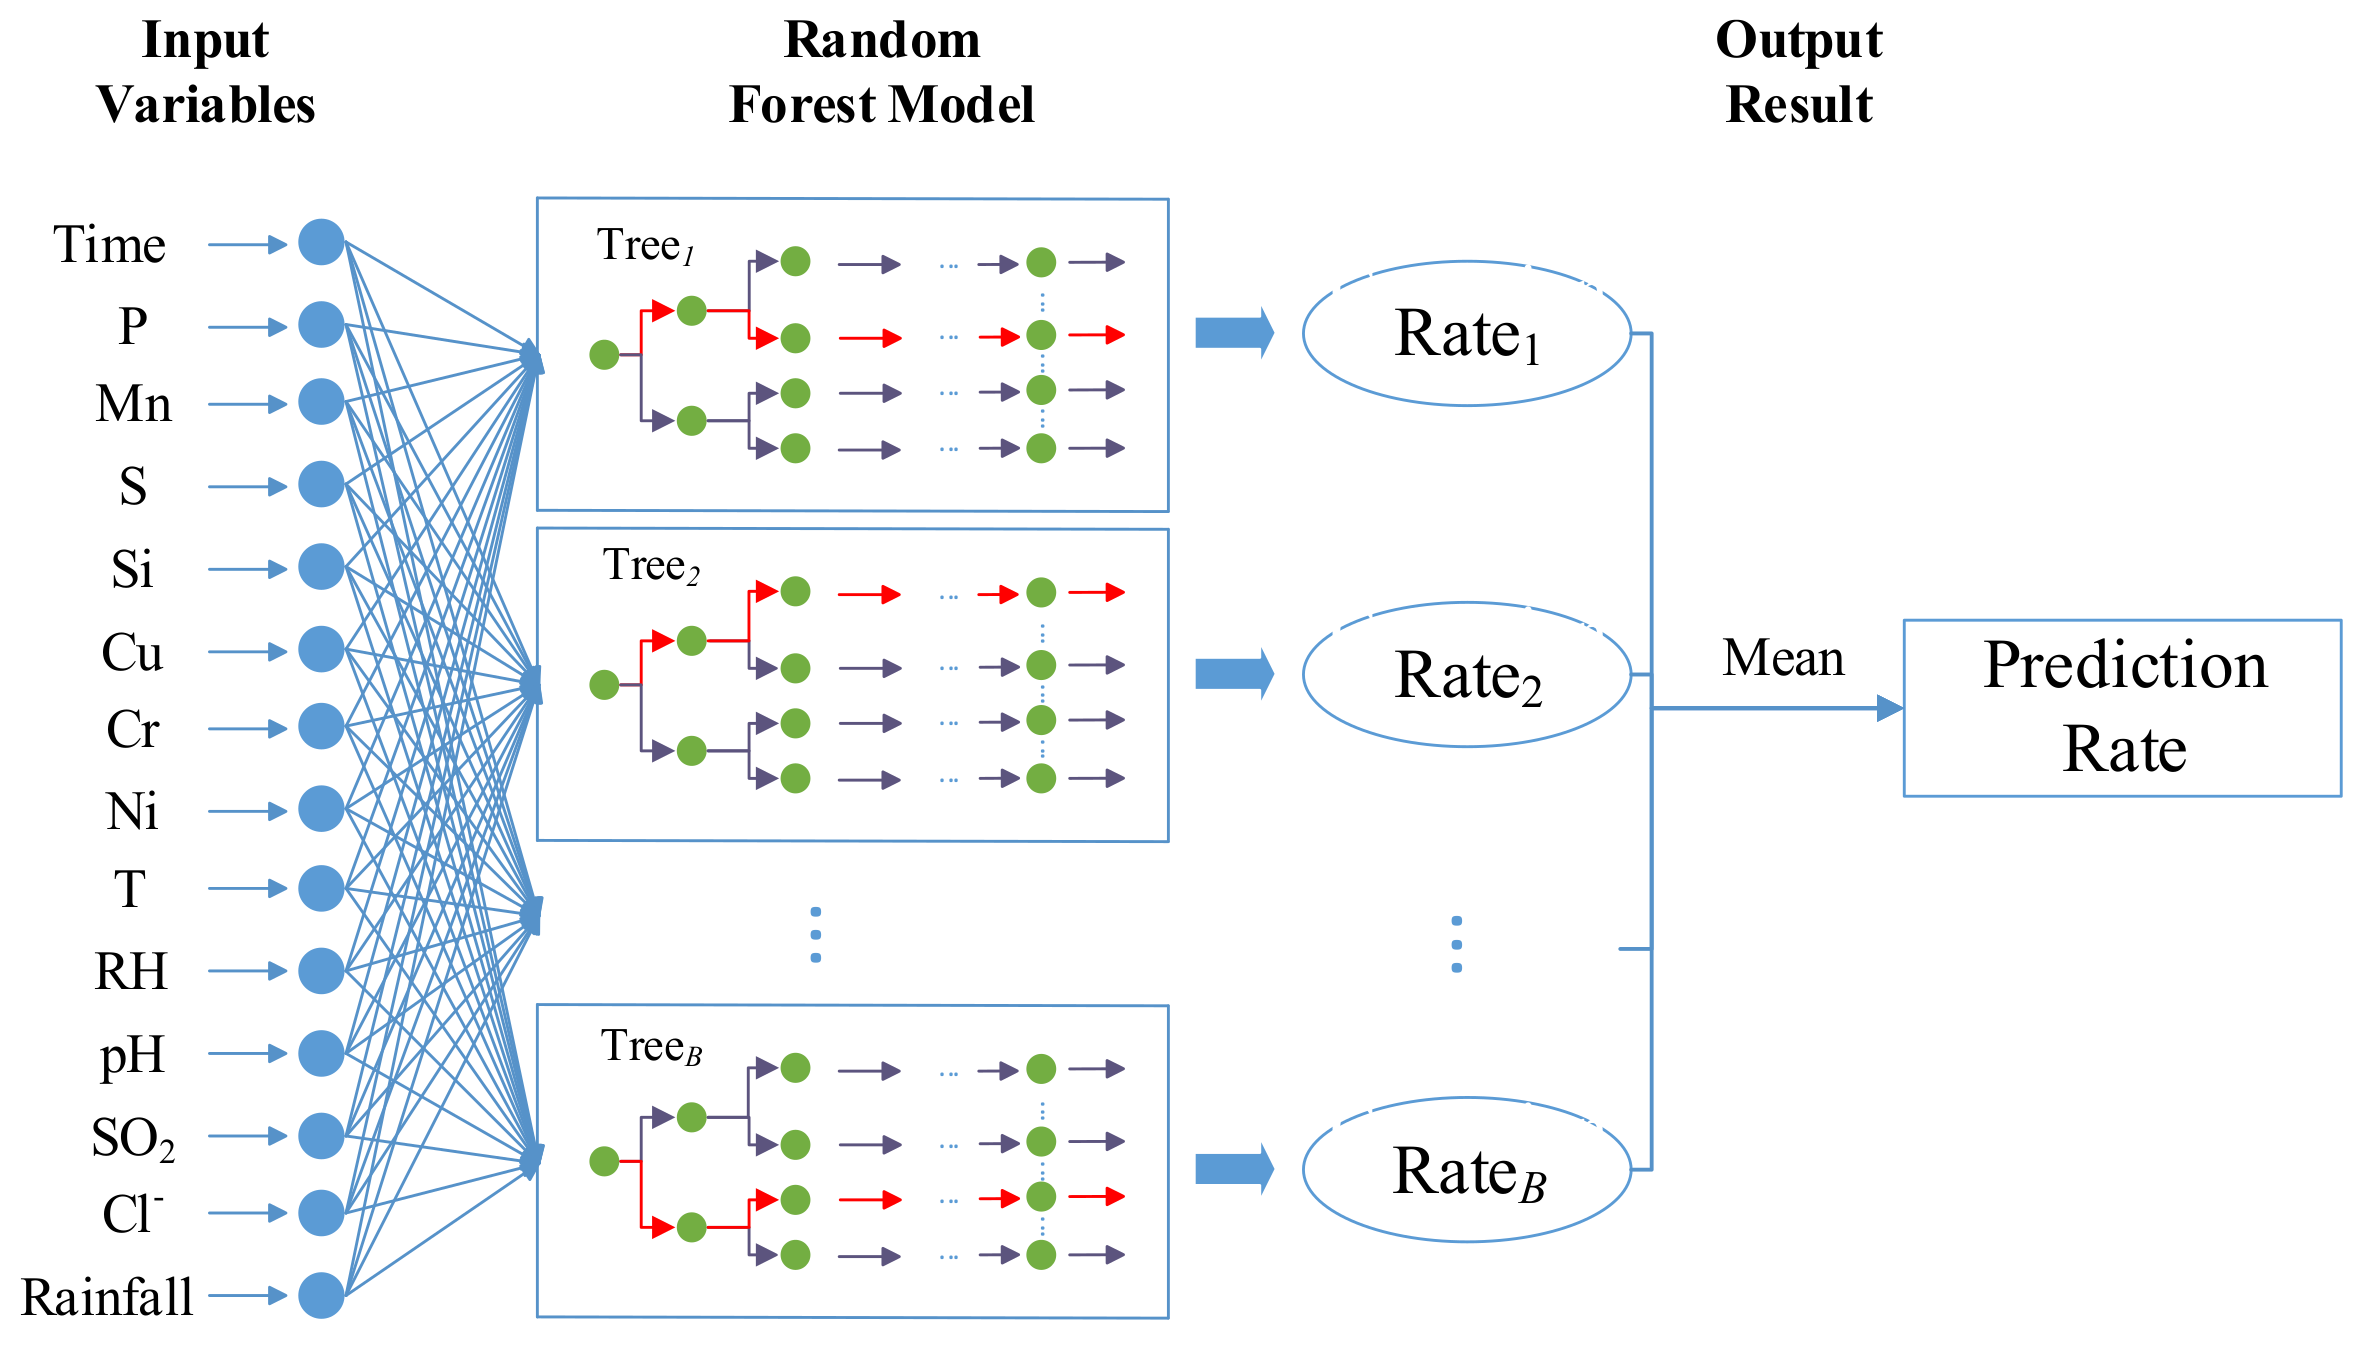
Assume that there are B CART models in the RF. For a new input variables X, the i-th CART would output a prediction value Yi (i = 1, 2, 3, …, B). The ensemble of all prediction value is the final prediction results of RF. The process is shown in Figure 4.
As mentioned above, for each CART model, there are some samples that are not selected during training and can be utilized for evaluating the error of the CART model. This is known as the out-of-bag (OOB) sample, and these samples are not only used to implement the estimation of generalization of the model but also can be used to quantify the importance of the input features contributing to the prediction accuracy of the model.
Suppose that there is a random forest consisting of B CART models and the dimensions of input variables is p. Then, the calculation process of each input variable’s contribution to the prediction results is shown as follows [29]:
  • For CART i, where i = 1, 2, …, B:
    Identify the selected samples for the training process of CART model and unselected samples which belong to the OOB objects.
    Estimate the OOB error εi.
    For each variable x j , j { 1 , 2 , , p } . We first permute the values of xj randomly. Then, estimate the model error εij by the OOB samples with permuted values. We obtain the difference dij = εij – εi.
  • After the operation of the above process. For variable xj, we can obtain the mean value d j ¯ = i = 1 B d i j / B and the corresponding standard deviation, σj.
  • Compute the importance estimation of the variable xj by I m p j = d j ¯ / σ j .
  • Normalize the results of importance estimation to range [0, 1] by I m p j = I m p j / m = 1 p I m p m .
The I m p j indicates the influence of variable xj. If the variable had a significant effect on the prediction results, the permuted value would lead to a greater difference error. Therefore, the value of I m p j is larger too.

3.2. Evaluation Criteria

For evaluating the fitting error (training samples) and generalization error (testing samples) of the model., the paper used three criteria for the results. The three criteria methods are:
(1)
Mean absolute percentage error (MAPE)
MAPE = 1 N n = 1 N y n y n y n × 100 %
where N is the number of datasets, y n and yn represents the prediction and true value of n-th sample. The smaller MAPE, the better the prediction of the model.
(2)
Root mean square error (RMSE)
RMSE = 1 N n = 1 N ( y n y n ) 2
The smaller RMSE, the better prediction of the models.
(3)
Determination coefficients (R2)
R 2 = 1 n = 1 N ( y n y n ) 2 n = 1 N ( y ¯ y n ) 2
where, y ¯ = n = 1 N y n / N is the mean of the true values of all samples. With R2 approaching to the 1, the model becomes better.

4. Results and Discussion

4.1. Modeling of Random Forests and Application on Corrosion Dataset

The purpose of this paper is to use the Random Forests (RF) technique to build regression models that are utilized to forecast the corrosion rate of LAS under the outdoor atmospheric condition and various corrosion knowledge mining. For building the random forest of collected corrosion datasets and validating the performance of the model, we divided the 409 corrosion samples into training datasets (272 samples) and testing datasets (137 samples). The training samples are used to train model along with its parameters, and the testing samples are the inputs to the trained model to evaluate the generalization performance. The implementation of our work uses the scikit-learning package supported by the Python computer language [31]. The detailed forecasting process of this paper is shown in Figure 5.
As shown in Figure 5, if input a test sample with 14-dimension variables to the trained Random Forest model, according to the input values, each tree in the model would output a prediction value, and then we aggregate these results and select the mean value as the final prediction results.
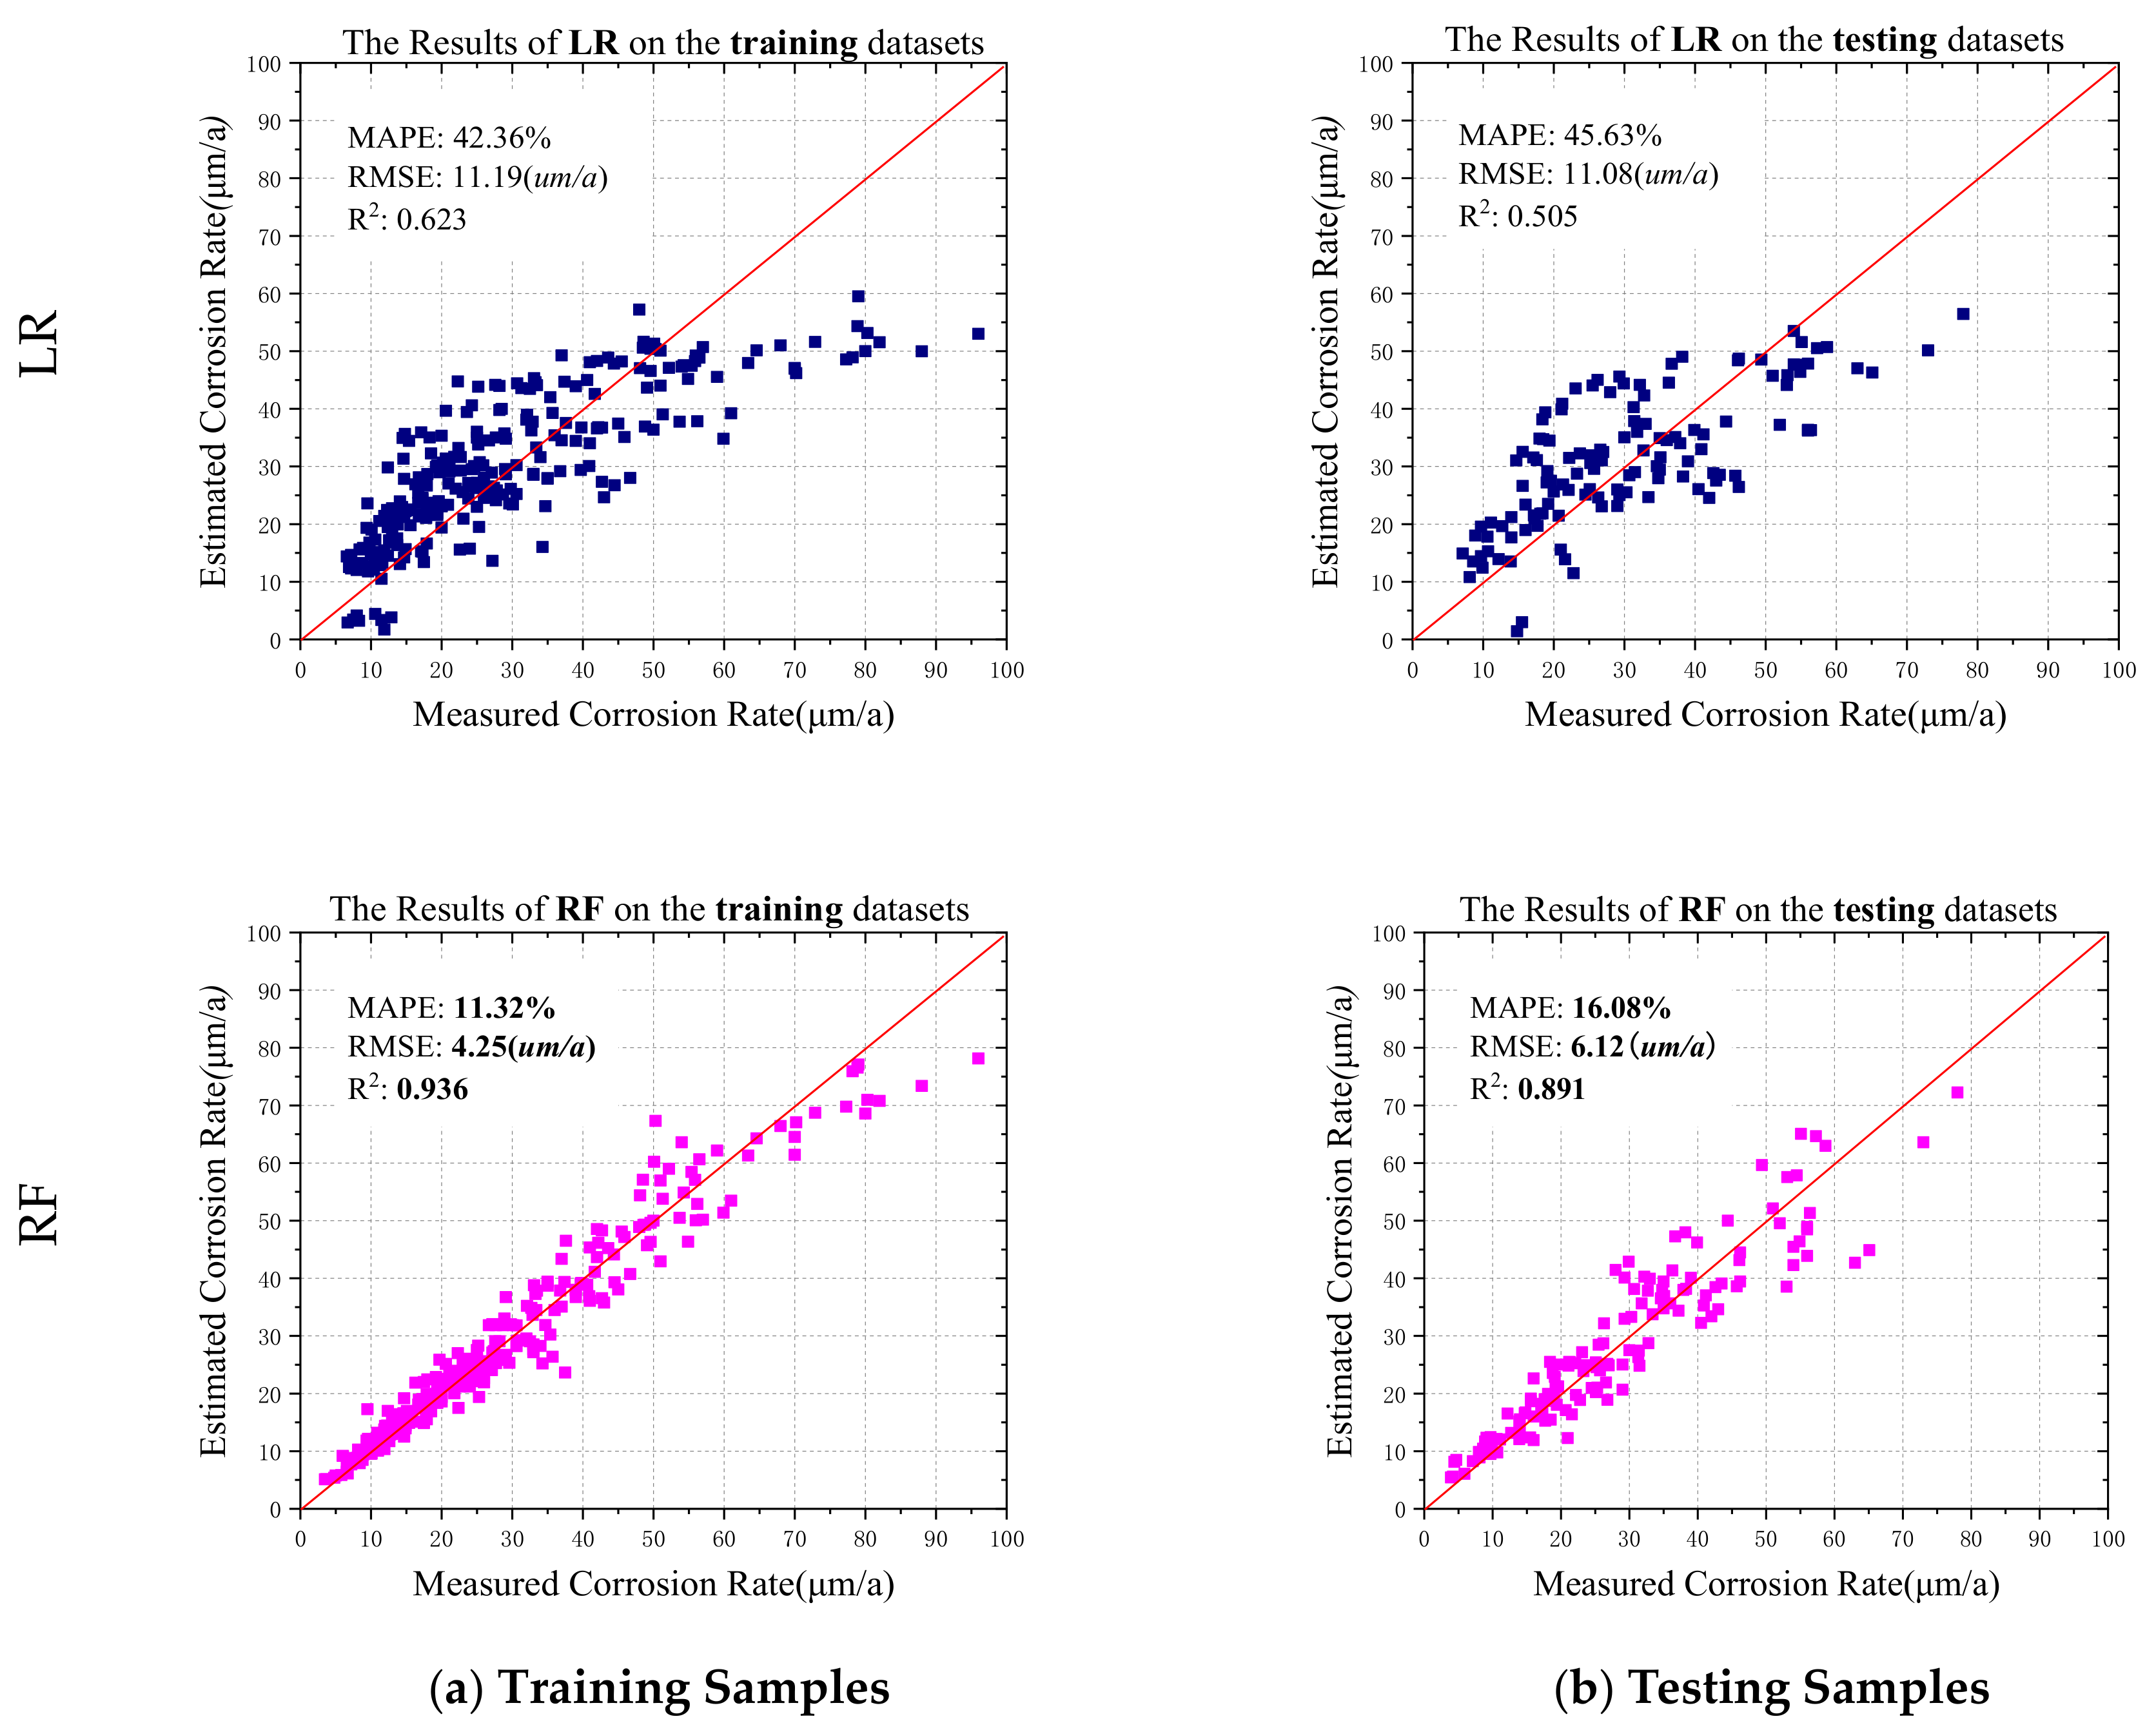
We calculate the error of training samples and testing samples respectively, and compared with the results of the artificial neural network (ANN), support vector regression (SVR) and logistic regression (LR). The comparisons of the four methods are shown in Figure 6.
Figure 6 shows the prediction results of ANN, SVR, LR, RF on training and testing samples, and the abscissa coordinates represent the measured corrosion rate. The ordinate coordinates represent the estimated corrosion rate, and the diagonal line is the true-forecast line. The closer the scatter points are to the diagonal line, the better the performance. Firstly, from the results on the training dataset, it can be seen that the training error of the RF is the lowest, and the MAPE, RMSE, and R2 are 11.32%, 4.25 (μm/a) and 0.936, respectively. From the testing datasets, the generalization performance of RF is also best, and the MAPE, RMSE, R2 are 16.08%, 6.12 (μm/a), 0.891. Therefore, RF can obtain better results compared with the other three algorithms.
According to the characteristics of the collected corrosion datasets and prediction results, we give some conclusions as follows: 1) The SVR is very unsatisfactory on these samples. We believe it is the steep-manifold structure in the corrosion data that leads to the poor performance of SVR. SVR belongs to stable classifiers [20] which cannot extract the effects of subtle changes in the input, especially when the number of samples is small too. While unstable classifiers such as ANN can have better results on these samples, RF can also achieve good results due to the fact that the tree model is a typical unstable classifier too. 2) Although ANN can identify the slight changes in the input variables and deal with the non-linearity, it needs a lot of samples to train the model. Therefore, ANN cannot get reliability results with small training samples. In comparison, RF can obtain good results regardless of whether the number of training samples is large or small. Meanwhile, RF also can solve the non-linear problem in the datasets. In conclusion, when dealing with the corrosion datasets with small-sample, steep-manifold and non-linearity characteristics, RF can achieve better performance than the other three commonly used machine-learning methods and can build a more reliable mapping relationship.

4.2. Variable Importance Ranks According to the Model

According to the corrosion knowledge, the whole atmospheric corrosion process can be divided into two stages: The initial stage and stationary stage [32]. The former refers to the early stage of corrosion. During this period, the electrochemical reaction of LAS and the effects of the surrounding environmental factors appear to be fierce, the corrosion productions grow faster, and the corresponding corrosion rate is larger. In the stationary stage, the generation of the corrosion productions becomes slow at this time, and corrosion rate tends to be constant. At different stages, the importance ranks of the variables may change. For exploring the different contributions of multiple variables in different exposure time, the paper built 5 different RF models based on 5 sub-datasets, of which each sub-dataset hosts the same exposure time (1, 2, 4, 8, 16 years). The processes and modeling results are shown in Figure 7.
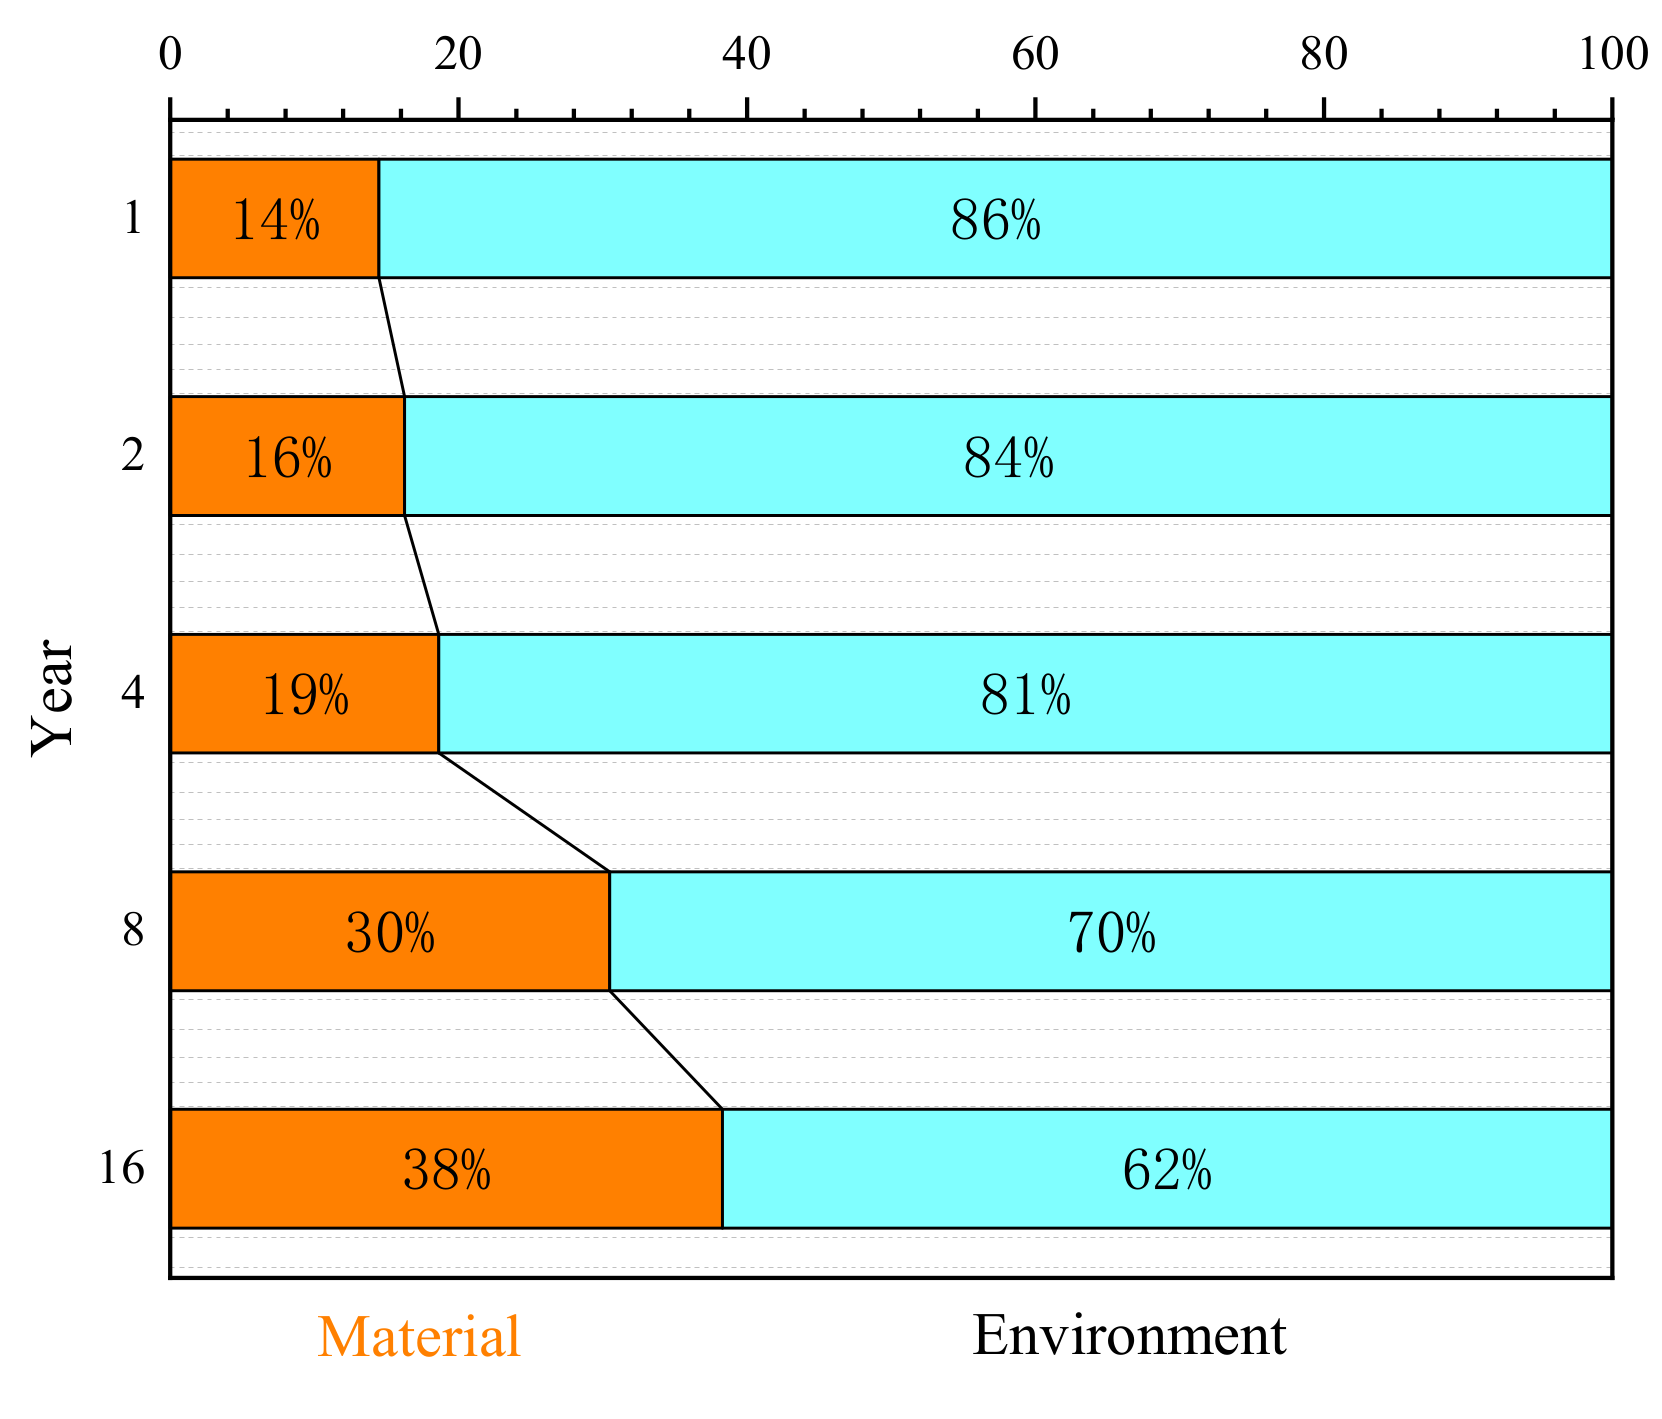
Figure 7 shows how to build five RF models based on five different sub-datasets. In each sub-dataset, the exposure times of all samples contained are equal. In this way, it can avoid the effect of time on the corrosion rate and focus on studying the effects of chemical elements and environmental factors on the corrosion rate. According to the established models, the paper gives the change of variables over time. Firstly, we consider 7 chemical elements as one single variable (material), and 6 environmental factors as the other single variable (environment). The contributions of material and environment in different models are shown in Figure 8.
We divided the corrosion process into two stages by the experience which showed that the corrosion of LAS would become stable in about 6–8 years for less corrosive environments or 4–6 years in more corrosive environments [32]. In the paper, we set the split time between the two stages at the 5th year. This means that if the exposure time is less than 5 years, it belongs to the initial stage, and if the time is more than 5 years, it is the stationary stage. Figure 8 revealed that at the initial stage, the environment plays a significant role in the corrosion, and the contributions are always larger than 80%. With the exposure time increasing, the corrosion production is also increased, and these products would hinder the following electrochemical reaction between the environment and the material. However, with different materials and environments, the corresponding corrosion products show different properties. At the initial stage, the products generated on the surface of the material are insufficient to form a protective layer. At this time, the main effect on corrosion is the environmental factors, as shown in Figure 8 (1, 2, 4 years). By the time of the stationary stage, there would be enough products to shield the LAS from environments and to inhibit further corrosion [33]. This kind of difference caused by corrosion products would lead to a great difference in the corrosion protection performance of the layer [1,32,33]. Therefore, the material itself can exert much more influence on corrosion during the stationary stage than that in the initial stage, as shown in Figure 8.
Although the importance of material rose up along with the increasing exposure time, the environment still showed more important effects, as shown in Figure 8. Moreover, although collected corrosion datasets contain the chemical compositions of each material, they still need the quantitative value of the microstructure that plays an important role in the corrosion process. Accordingly, the paper will analyze the effects of 6 environmental factors on corrosion in detail. The effects of alloying elements on corrosion will be studied in detail in our future work.
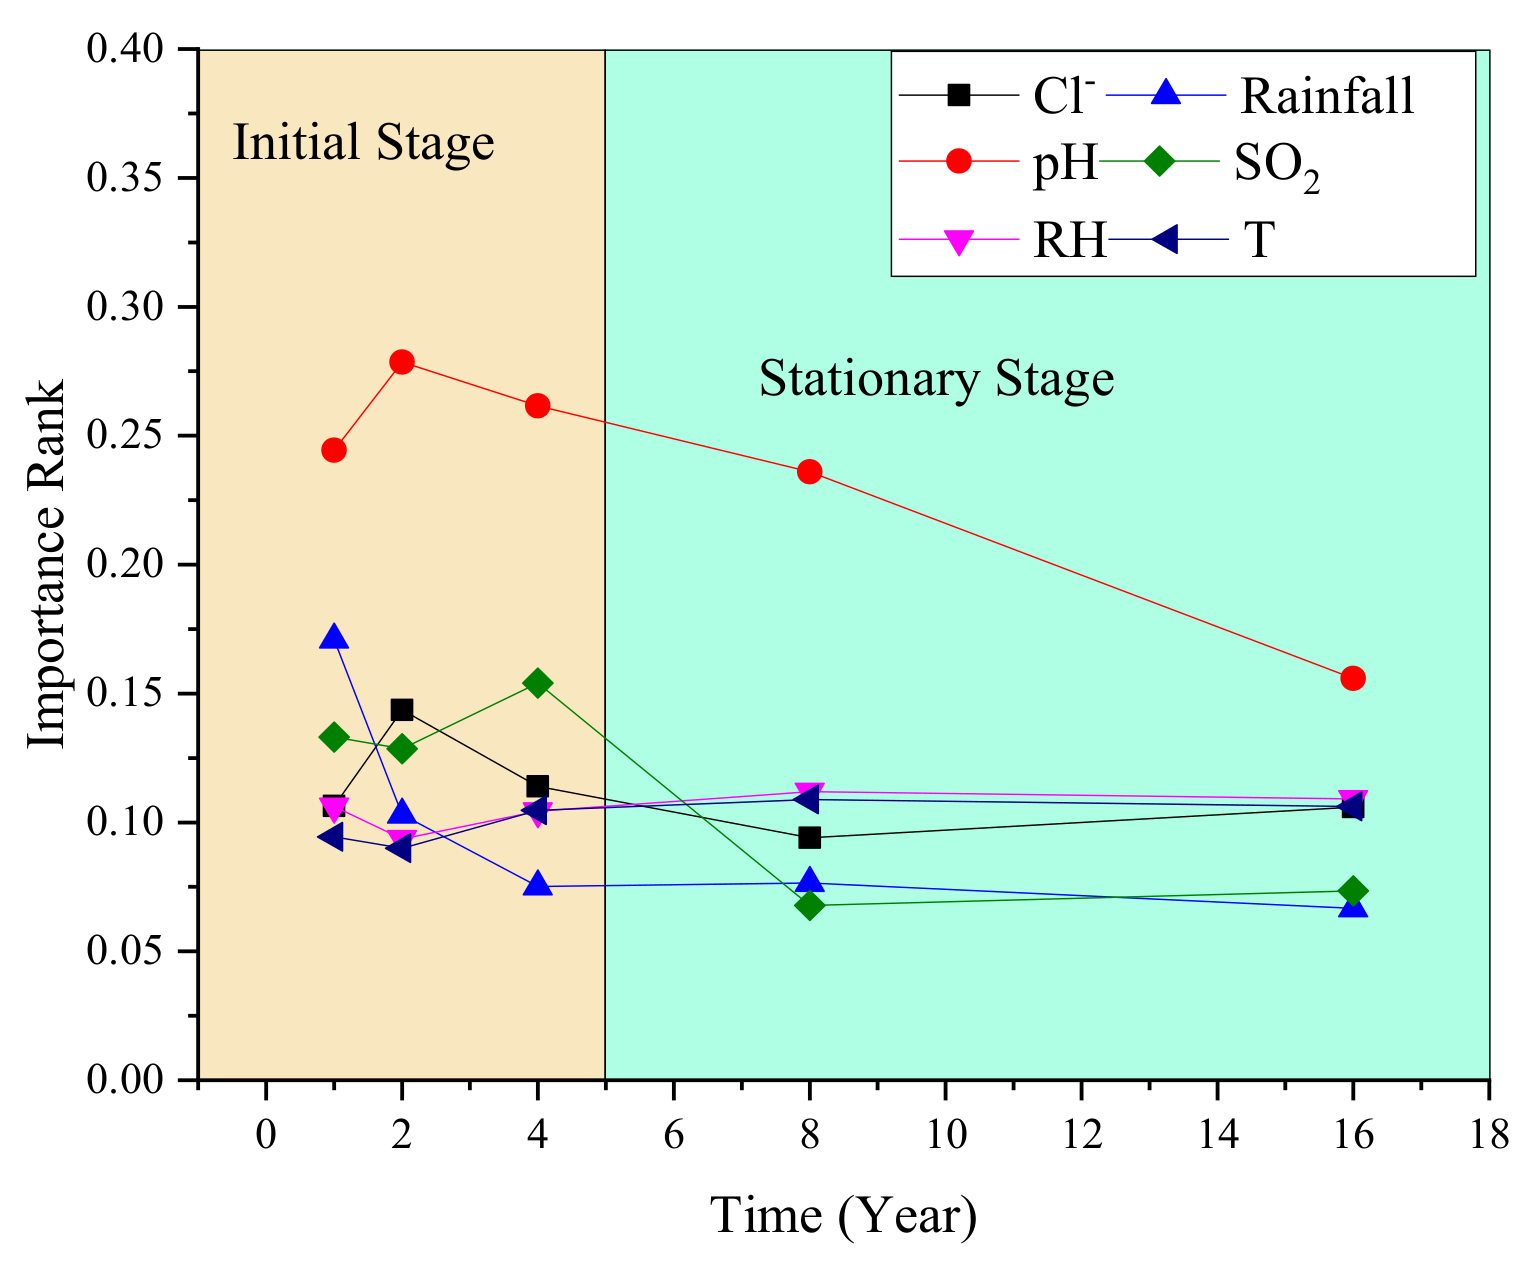
Based on the proposed RF model as shown in Figure 7, the paper gives the importance change information of each environmental factor on the corrosion vs. time dimension, and the results are shown in Figure 9.
According to the results from Figure 9, it can be seen that six environmental factors played different roles at the initial stage and stationary stage. The detailed analysis is as follows:
  • Figure 9 shows that pH always plays the most important role at the two corrosion stages. This is because low pH in rainfall can help to dissolve the corrosion products to iron ions and form non-aggregated “flowing” rusts [33]. With lower pH, the more dissolved product ions resulted in a larger corrosion rate [33,34,35].
  • At the initial stage, air pollutants such as SO2 and Cl had more effects on corrosion than T, RH. The pollutant could promote the electrochemical reaction on the surface of the material, accelerate the corrosion process, and increase the corrosion rate [36,37,38].
  • At the stationary stage, the influence of SO2 is much less than Cl, T, and RH. Figure 9 indicated that Cl, T, and RH played a second important role on corrosion at this time. Relevant results were also proved in previous work [36,37,38]. As for the influence change of SO2, it is because SO2 could promote the phase transformation to a more stable structure of α-FeOOH [37]. Therefore, the SO2 plays a major role at the initial stage, but has a lower effect on corrosion at the stationary stage.
  • Rainfall had a secondary important effect on corrosion in the first year, but the influence would rapidly decrease as time increased. From the 4th year, the influence of rainfall always is the lowest.

4.3. The Effect of Environmental Factors

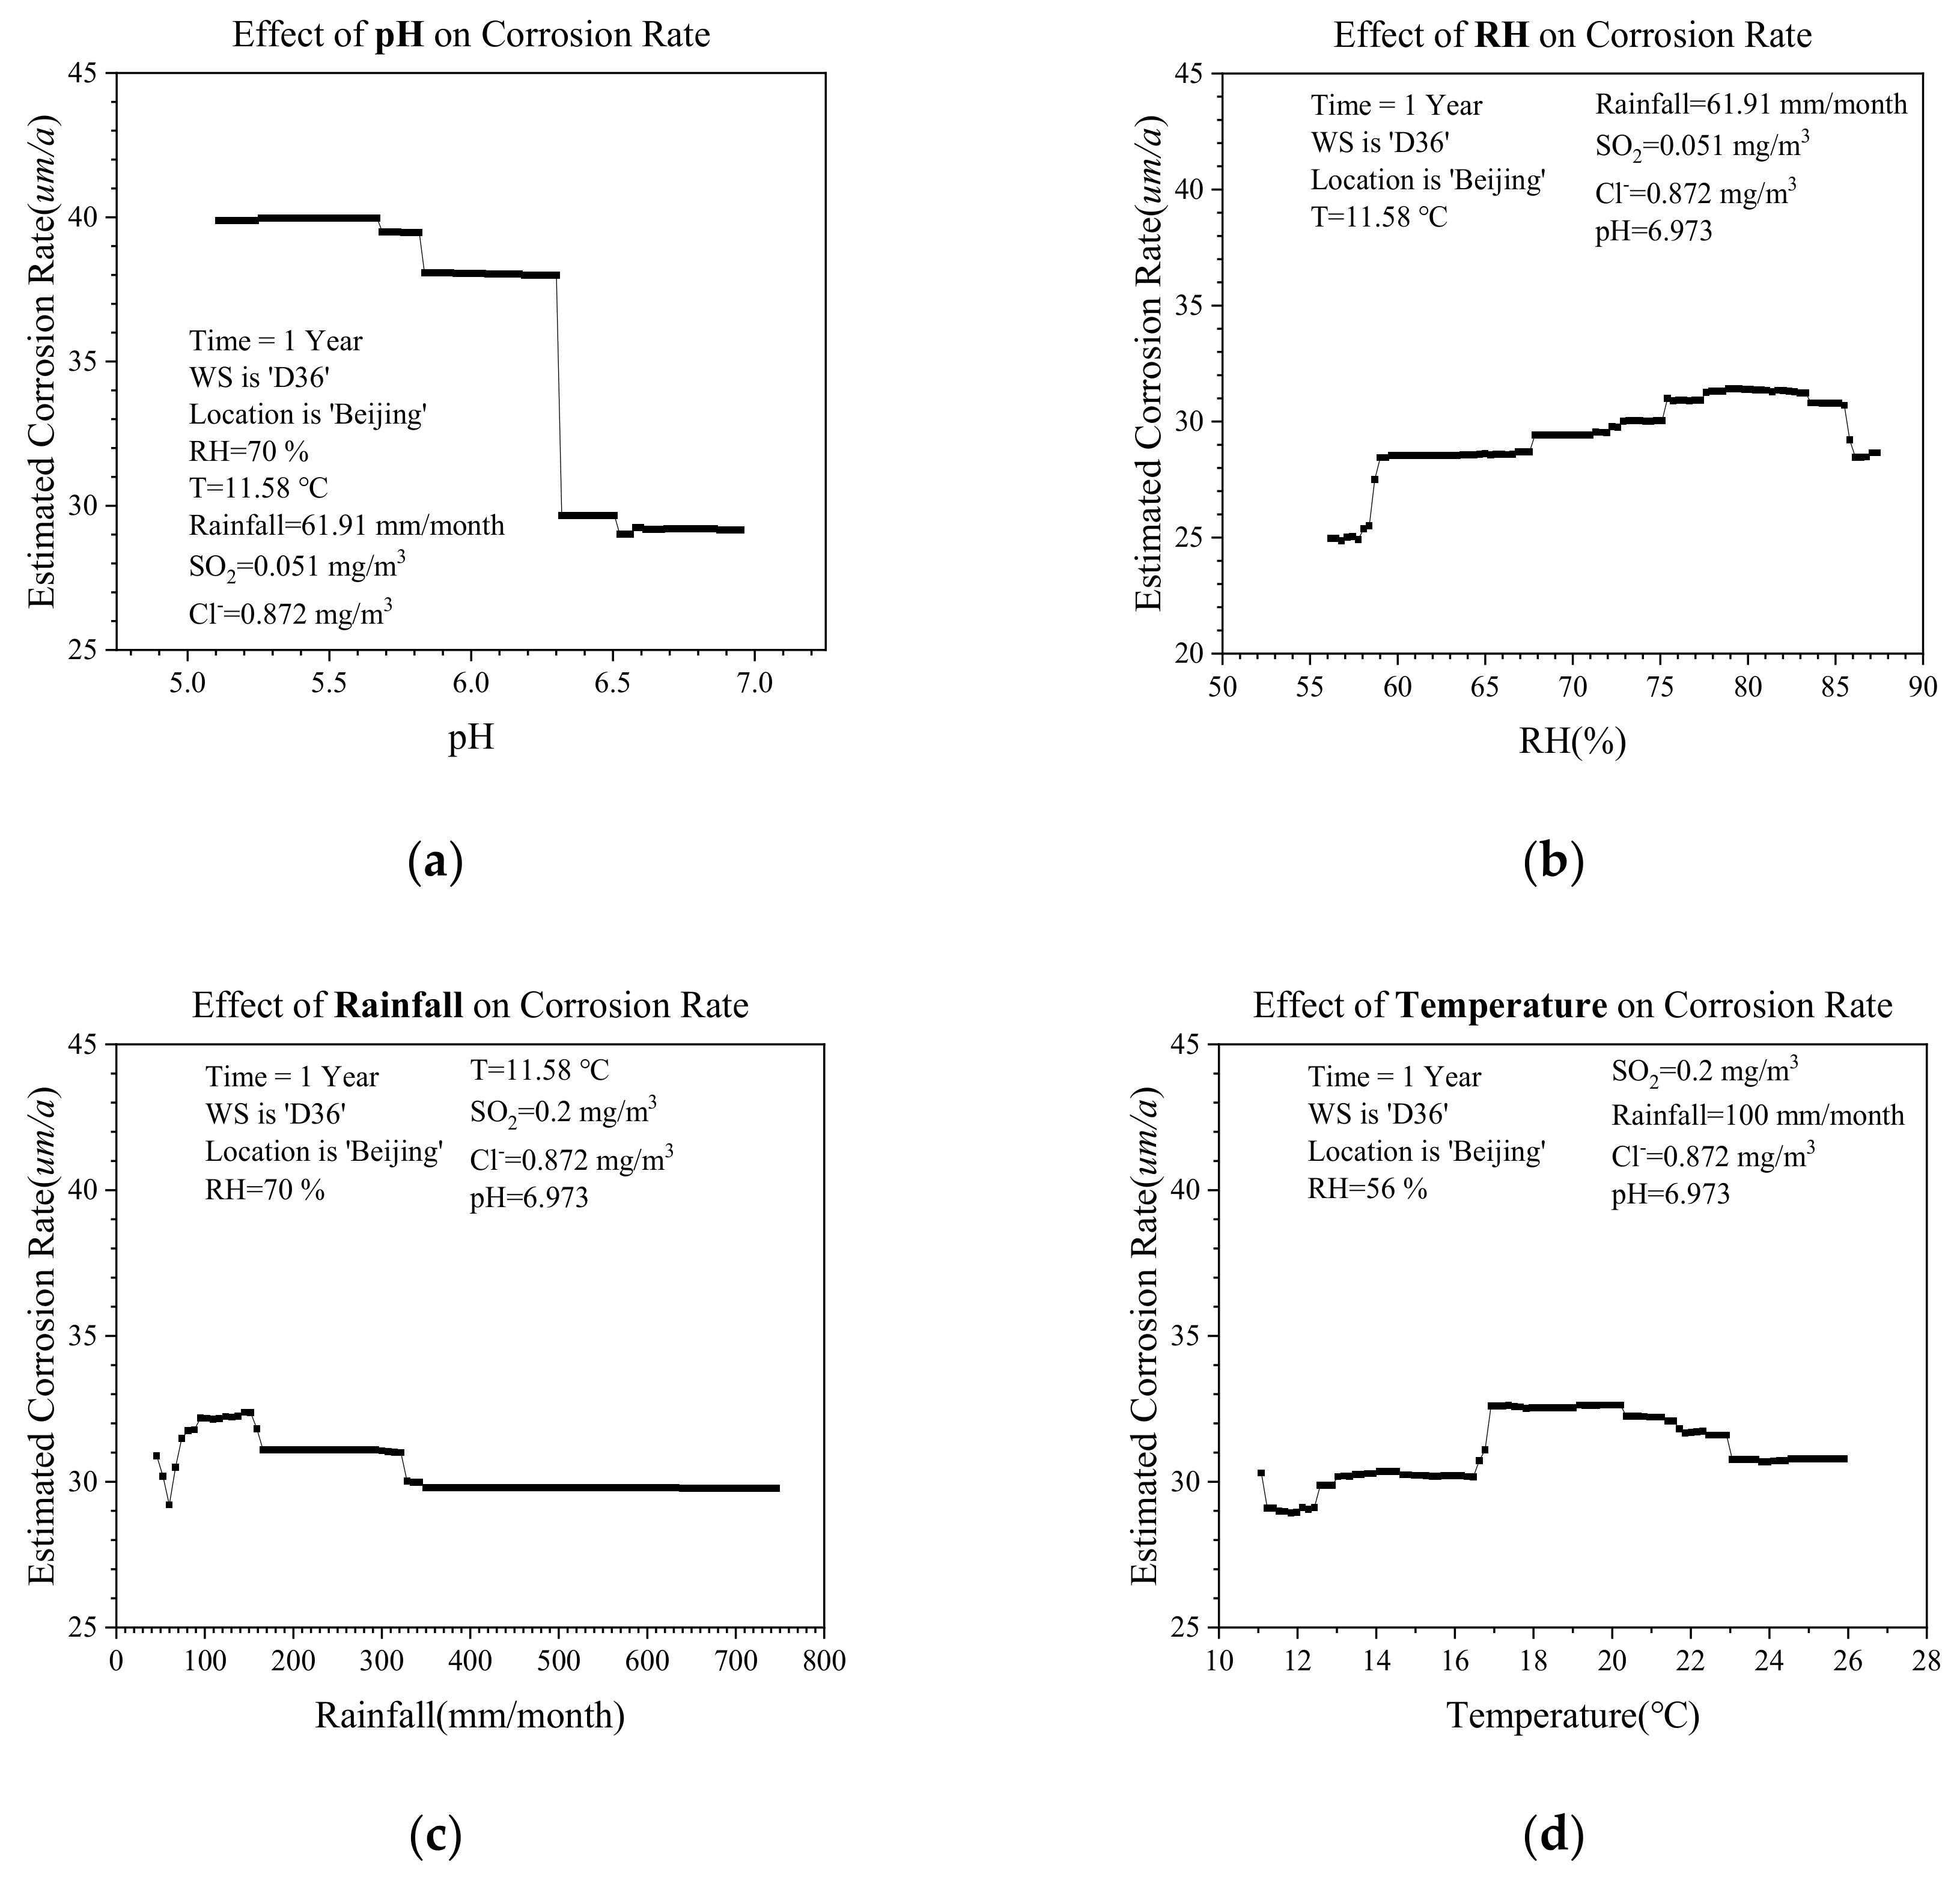
The RF model developed in this study for predicting the outdoor atmospheric corrosion rate of LAS can be seen as a non-linear function of a few input variables. After the modeling process is finished, we used the model to forecast the corrosion rate when just one of the environmental factors value was changed while the remaining variables maintained constant. The forecast results are illustrated in Figure 10.
As mentioned above, the inputs of the model include material, time, and environment. In this study, we only consider corrosion rate predictions when environmental factors change. In Figure 10, we fixed the material to be ‘D36’, the location to be ‘Beijing’, and the time to be ‘1 year’. Then, when the values of the six environmental factors are sequentially changed, the model is used to predict the corresponding corrosion rate. According to the sub-figures, we can give some qualitative and quantitative analysis of environmental factors effects on corrosion:
  • Figure 10a demonstrated that with a lower pH value, LAS had a higher corrosion rate. This is because the lower pH would generate more hydrogen ions, which can promote more severe dissolution of corrosion products [39]. Therefore, lower pH resulted in more damages to the products, which otherwise can play a protective role for the material [33,34,35]. According to the results in Figure 10a, it can be seen that when the value of pH crossed over the threshold around 6.29, there is a sudden change in the corrosion rate. For this threshold value, we explain that for the atmospheric corrosion of ‘D36’ in ‘Beijing’, when the pH of rain is lower than about 6.29, the hydrogen ion dissolves the metal, which accelerates the corrosion rate and may lead to part of the rust-protective layer being completely dissolved. This means that the corresponding area of ‘D36’ is not protected by the rust-layer, and it would lead to the sudden change of the corrosion rate.
  • Figure 10b shows that there is a large increase in corrosion rate when the RH reaches about 59%. In the range of 55–85%, the corrosion rate and RH increase simultaneously. However, when the value of RH is larger than 85%, the corrosion rate decreases conversely.
  • When the value of rainfall ranges from 100 (mm/month) to 147 (mm/month), the corresponding corrosion rate is the largest. After that, the corrosion rate gradually decreases as the rainfall increases.
  • As for the temperature effect on corrosion, Figure 10d illustrated that when temperature values range from 11–17 °C, the higher temperature could promote the corrosion, and the largest corrosion rate happens when the temperature is in ranges from 17–20 °C; afterwards, the corrosion rate would decrease, though the temperature still increases. For this case, the explanation is that when the temperature in Beijing was higher than 20 °C, there existed a severe evaporation process. Therefore, on the surface of LAS, it is harder to form the electrolyte film, which is a necessity for corrosion.
  • Figure 10e shows that SO2 can promote the corrosion process, i.e., the higher SO2 corresponds to the higher corrosion rate. Besides, we also give a threshold of 0.61 (mg/cm3), which can lead to the sudden change of the corrosion rate.
  • The effect of Cl in Figure 10f illustrated that the threshold of Cl was about 0.89 (mg/cm3). The higher Cl will accelerate the corrosion rate. Figure 10f also shows that the influence of Cl concentration on the corrosion rate is not larger. For this result, we explain it from two aspects: Firstly, the exposure time in Figure 10f is ‘1 year’, and according to the results from previous sections, it can be seen that the importance of Cl is lower than the pH, rainfall, and SO2. In addition, the paper used Cl concentration in the air to represent the chloride ion. However, there are works saying that the Cl deposition/concentration in microclimate around the specimen may have an important influence on corrosion [5]. In this regard, we will design a new outdoor experiment to collect the microclimate around the specimen and to improve the results of this part in future works.

5. Conclusions

The paper utilized the Random Forests method to build an outdoor atmospheric corrosion prediction model for low alloy steels. Moreover, the paper drew some conclusions about corrosion knowledge from the model. The summaries are as follows:
  • The paper analyzed the characteristics of various LAS in various environments and built the prediction model using the random forests, artificial neural network, support vector regression, and logistic regression methods. The comparison results show that the Random Forests model can obtain the best fitting results on training samples and generalization results on testing samples. It indicated that the random forests can better implement the mapping relationship between corrosion factors and rates.
  • By building five RF models with different exposure times, the paper obtained the effect changes of six environmental factors on corrosion with time. The results show that pH always plays the most important role at the entire corrosion process; SO2 and Cl were more important for corrosion than T and RH at the initial stage; and Cl, T, RH, and pH had a major influence on corrosion at the stationary stage, while rainfall just plays a major role in the 1st year.
  • After the modeling, the paper forecasted the corrosion rate when one of six environmental factors changed, and other variables were constant. According to the forecast results, the paper can give qualitative and quantitative analysis of the influences of six environmental factors on corrosion.
The successful development of RF on the corrosion datasets provides a powerful tool for building predictive models and knowledge-mining of LAS corrosion in outdoor atmospheres. However, limited by the lack of quantitative of LAS microstructure in the collected datasets, the paper did not discuss the effects of chemical composition and microstructure on corrosion in detail. The related work will be further studied in the near future.

Author Contributions

Y.Z. developed the model and wrote the paper; T.Y. tested the model and wrote the paper; D.F. supervised the whole experiment process; D.Z. and X.L. provided the experimental data for the model built.

Funding

This research was funded by the National Key R&D Program of China, grant number 2017YFB0702104.

Acknowledgments

The authors are thankful to Dequan Wu and Zibo Pei of University of Science and Technology Beijing, for providing useful advice for this study.

Conflicts of Interest

The authors declare no conflict of interest.

References

  1. Morcillo, M.; Chico, B.; Díaz, I.; Cano, H.; De la Fuente, D. Atmospheric corrosion data of weathering steels. A review. Corros. Sci. 2013, 77, 6–24. [Google Scholar] [CrossRef] [Green Version]
  2. Kihira, H.; Senuma, T.; Tanaka, M.; Nishioka, K.; Fujii, Y.; Sakata, Y. A corrosion prediction method for weathering steels. Corros. Sci. 2005, 47, 2377–2390. [Google Scholar] [CrossRef]
  3. Kamimura, T.; Hara, S.; Miyuki, H.; Yamashita, M.; Uchida, H. Composition and protective ability of rustlayer formed on weathering steel exposed to various environments. Corros. Sci. 2006, 48, 2799–2812. [Google Scholar]
  4. Gao, X.; Zhu, M.; Sun, C.; Fu, G. Dynamic Recrystallization Behavior and Microstructure Evolution of Bridge Weathering Steel in Austenite Region. Steel Res. Int. 2013, 84, 377–386. [Google Scholar] [CrossRef]
  5. Krivy, V.; Kuzmova, M.; Kreislova, K.; Urban, V. Characterization of corrosion products on weathering steel bridges influenced by chloride deposition. Metals 2017, 7, 336. [Google Scholar] [CrossRef]
  6. Li, H.; Chai, F.; Yang, C.F.; Li, C.; Luo, X.B. Corrosion behavior of low alloy steel for cargo oil tank under upper deck conditions. J. Iron Steel Res. Int. 2018, 25, 120–130. [Google Scholar] [CrossRef]
  7. Liu, Z.; Gao, X.; Du, L.; Li, J.; Zhou, X.; Wang, X.; Wang, Y.; Liu, C.; Xu, G.; Misra, R.D.K. Hydrogen assisted cracking and CO2 corrosion behaviors of low-alloy steel with high strength used for armor layer of flexible pipe. Appl. Surf. Sci. 2018, 440, 974–991. [Google Scholar] [CrossRef]
  8. Li, X.; Zhang, D.; Liu, Z.; Li, Z.; Du, C.; Dong, C. Materials science: Share corrosion data. Nature 2015, 527, 441–442. [Google Scholar] [CrossRef] [Green Version]
  9. Kamrunnahar, M.; Urquidi-Macdonald, M. Prediction of corrosion behavior using neural network as a data mining tool. Corros. Sci. 2010, 52, 669–677. [Google Scholar] [CrossRef]
  10. Kamrunnahar, M.; Urquidi-Macdonald, M. Prediction of corrosion behaviour of Alloy 22 using neural network as a data mining tool. Corros. Sci. 2011, 53, 961–967. [Google Scholar] [CrossRef]
  11. Jiang, G.; Keller, J.; Bond, P.L.; Yuan, Z. Predicting concrete corrosion of sewers using artificial neural network. Water Res. 2016, 92, 52–60. [Google Scholar] [CrossRef] [PubMed] [Green Version]
  12. Shirazi, A.Z.; Mohammadi, Z. A hybrid intelligent model combining ANN and imperialist competitive algorithm for prediction of corrosion rate in 3C steel under seawater environment. Neural Comput. Appl. 2017, 28, 3455–3464. [Google Scholar] [CrossRef]
  13. Shi, J.; Wang, J.; Macdonald, D.D. Prediction of primary water stress corrosion crack growth rates in Alloy 600 using artificial neural networks. Corros. Sci. 2015, 92, 217–227. [Google Scholar] [CrossRef]
  14. Fang, S.F.; Wang, M.P.; Qi, W.H.; Zheng, F. Hybrid genetic algorithms and support vector regression in forecasting atmospheric corrosion of metallic materials. Comput. Mater. Sci. 2008, 44, 647–655. [Google Scholar] [CrossRef]
  15. Panchenko, Y.M.; Marshakov, A.I. Prediction of first-year corrosion losses of carbon steel and zinc in continental regions. Materials 2017, 10, 422. [Google Scholar] [CrossRef]
  16. Panchenko, Y.M.; Marshakov, A.I.; Nikolaeva, L.A.; Kovtanyuk, V.V.; Igonin, T.N.; Andryushchenko, T.A. Comparative estimation of long-term predictions of corrosion losses for carbon steel and zinc using various models for the Russian territory. Corros. Eng. Sci. Technol. 2017, 52, 149–157. [Google Scholar] [CrossRef]
  17. Shi, Y.; Fu, D.; Zhou, X.; Yang, T.; Zhi, Y.; Pei, Z.; Zhang, D.; Shao, L. Data mining to online galvanic current of zinc/copper Internet atmospheric corrosion monitor. Corros. Sci. 2018, 133, 443–450. [Google Scholar] [CrossRef]
  18. Melchers, R.E. Effect of small compositional changes on marine immersion corrosion of low alloy steels. Corros. Sci. 2004, 46, 1669–1691. [Google Scholar] [CrossRef]
  19. Breiman, L. Random forests. Mach. Learn. 2001, 45, 5–32. [Google Scholar] [CrossRef]
  20. Zhou, Z.H. Ensemble Methods: Foundations and Algorithms. Chapman and Hall/CRC: Boca Raton, FL, USA, 2012. [Google Scholar]
  21. Yang, B.; Cao, J.M.; Jiang, D.P.; Lv, J.D. Facial expression recognition based on dual-feature fusion and improved random forest classifier. Multimed. Tools Appl. 2018, 77, 20477–20499. [Google Scholar] [CrossRef]
  22. Rahmati, O.; Pourghasemi, H.R.; Melesse, A.M. Application of GIS-based data driven random forest and maximum entropy models for groundwater potential mapping: A case study at Mehran Region, Iran. Catena 2016, 137, 360–372. [Google Scholar] [CrossRef]
  23. Quintana, D.; Sáez, Y.; Isasi, P. Random Forest Prediction of IPO Underpricing. Appl. Sci. 2017, 7, 636–651. [Google Scholar] [CrossRef]
  24. Yuk, E.; Park, S.; Park, C.S.; Baek, J.G. Feature-learning-based printed circuit board inspection via speeded-up robust features and random forest. Appl. Sci. 2018, 8, 932–945. [Google Scholar] [CrossRef]
  25. Park, S.; Im, J.; Jang, E.; Rhee, J. Drought assessment and monitoring through blending of multi-sensor indices using machine learning approaches for different climate regions. Agric. For. Meteorol. 2016, 216, 157–169. [Google Scholar] [CrossRef]
  26. Oh, E.; Liu, R.; Nel, A.; Gemill, K.B.; Bilal, M.; Cohen, Y.; Medintz, I. Meta-analysis of cellular toxicity for cadmium-containing quantum dots. Nat. Nanotechnol. 2016, 11, 479–493. [Google Scholar] [CrossRef]
  27. Bengio, Y. Learning deep architectures for AI. Found. Trends in Mach. Learn. 2009, 2, 1–127. [Google Scholar] [CrossRef]
  28. Zhou, Z.H.; Feng, J. Deep forest: Towards an alternative to deep neural networks. In proceeding of the 26th International Joint Conference on Artificial Intelligence, Melbourne, Australia, 19–25 August 2017. [Google Scholar]
  29. Hou, Y.; Aldrich, C.; Lepkova, K.; Machuca, L.L.; Kinsella, B. Analysis of electrochemical noise data by use of recurrence quantification analysis and machine learning methods. Electrochim. Acta 2017, 256, 337–347. [Google Scholar] [CrossRef]
  30. Hou, Y.; Aldrich, C.; Lepkova, K.; Kinsella, B. Identifying corrosion of carbon steel buried in iron ore and coal cargoes based on recurrence quantification analysis of electrochemical noise. Electrochim. Acta 2018, 283, 212–220. [Google Scholar] [CrossRef]
  31. Ng, D.P.; Wu, D.; Wood, B.L.; Fromm, J.R. Computer-aided detection of rare tumor populations in flow cytometry: An example with classic Hodgkin lymphoma. Am. J. Clin. Pathol. 2015, 144, 517–524. [Google Scholar] [CrossRef]
  32. Panchenko, Y.M.; Marshakov, A.I.; Igonin, T.N.; Kovtanyuk, V.V.; Nikolaeva, L.A. Long-term forecast of corrosion mass losses of technically important metals in various world regions using a power function. Corros. Sci. 2014, 88, 306–316. [Google Scholar] [CrossRef]
  33. Tamura, H. The role of rusts in corrosion and corrosion protection of iron and steel. Corros. Sci. 2008, 50, 1872–1883. [Google Scholar] [CrossRef] [Green Version]
  34. Zhao, M.C.; Liu, M.; Song, G.L.; Atrens, A. Influence of pH and chloride ion concentration on the corrosion of Mg alloy ZE41. Corros. Sci. 2008, 50, 3168–3178. [Google Scholar] [CrossRef]
  35. Wicke, D.; Cochrane, T.A.; O’Sullivan, A.D.; Cave, S.; Derksen, M. Effect of age and rainfall pH on contaminant yields from metal roofs. Water Sci. Technol. 2014, 69, 2166–2173. [Google Scholar] [CrossRef] [PubMed]
  36. Wang, Z.; Liu, J.; Wu, L.; Han, R.; Sun, Y. Study of the corrosion behavior of weathering steels in atmospheric environments. Corros. Sci. 2013, 67, 1–10. [Google Scholar] [CrossRef]
  37. Mendoza, A.R.; Corvo, F. Outdoor and indoor atmospheric corrosion of non-ferrous metals. Corros. Sci. 2000, 42, 1123–1147. [Google Scholar] [CrossRef]
  38. Dan, Z.; Muto, I.; Hara, N. Effects of environmental factors on atmospheric corrosion of aluminium and its alloys under constant dew point conditions. Corros. Sci. 2012, 57, 22–29. [Google Scholar] [CrossRef]
  39. Hu, Y.B.; Dong, C.F.; Sun, M.; Xiao, K.; Zhong, P.; Li, X.G. Effects of solution pH and Cl- on electrochemical behavior of an aermet100 ultra-high strength steel in acidic environments. Corros. Sci. 2011, 53, 4159–4165. [Google Scholar] [CrossRef]
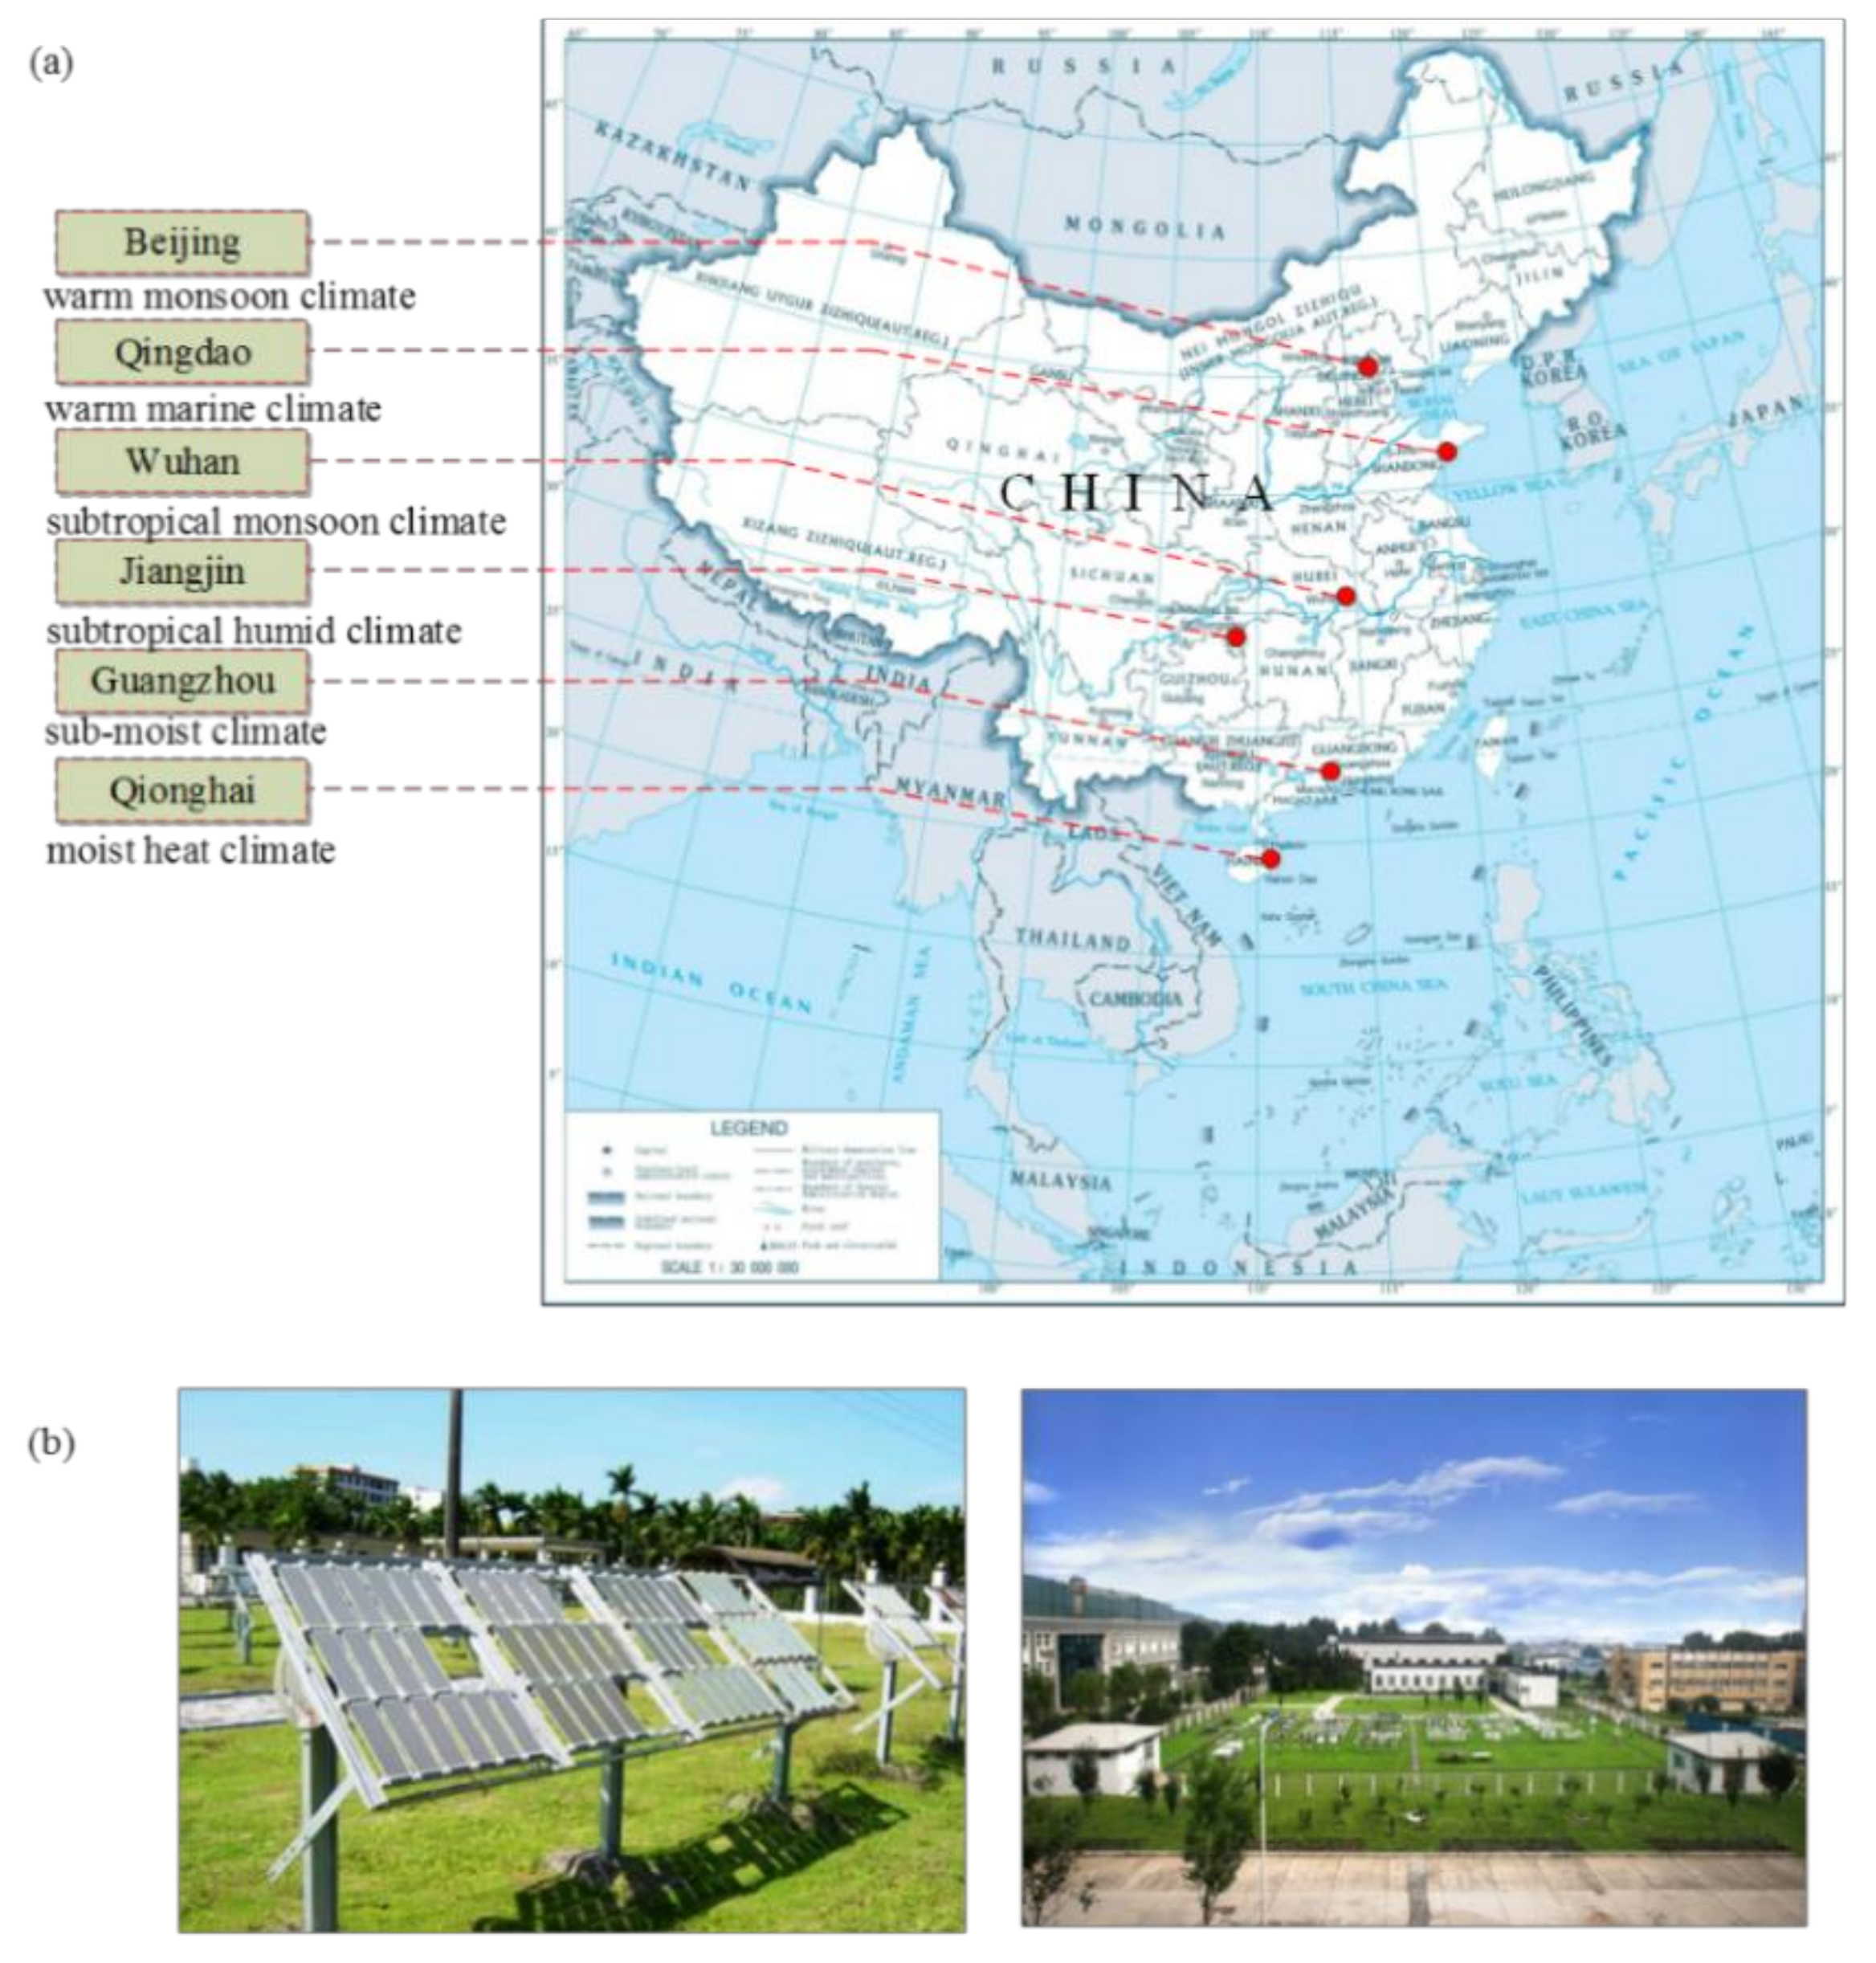
Figure 1. (a) The geographical distribution and climate types of 6 test stations; (b) the on-site pictures of exposure test.
Metals 09 00383 g001
Figure 2. Corrosion rates of 17 LAS versus exposure time in different site: (a) Beiing, (b) Guangzhou, (c) Jiangjin, (d) Qingdao, (e) Qionghai, (f) Wuhan.
Metals 09 00383 g002aMetals 09 00383 g002b
Figure 3. An example of a single Classification and Regression Tree (CART) model.
Metals 09 00383 g003
Figure 4. Prediction process of the Random Forests model.
Metals 09 00383 g004
Figure 5. The process of forecasting the corrosion rate based on the Random Forest (RF) model.
Metals 09 00383 g005
Figure 6. The prediction results of artificial neural network (ANN), support vector regression (SVR), logistic regression (LR), and RF on training (a) and testing (b) samples.
Metals 09 00383 g006aMetals 09 00383 g006b
Figure 7. The process and the validations of the five different RF models for different times.
Metals 09 00383 g007
Figure 8. The percentage variations of the contribution variations of the material and environment vs. exposure time.
Metals 09 00383 g008
Figure 9. The importance changes of the six environmental factors vs. exposure time.
Metals 09 00383 g009
Figure 10. Corrosion rate prediction when changing one of the environmental factors. (a) pH, (b) RH, (c) Rainfall, (d) Temperature, (e) SO2, (f) Cl.
Metals 09 00383 g010aMetals 09 00383 g010b
Table 1. Element compositions of 17 low alloy steels (LAS) in the collected datasets.
AlloyElement Compositions, wt. %
MnSPSiCrCuNiFe
06CuPCrNiMo0.40.0230.050.17-0.17-Balance
09CuPCrNiA0.40.0230.0150.260.10.050.02Balance
09CuPTiRe0.40.0190.080.28-0.29-Balance
09MnNb(s)1.180.0240.0270.20.10.050.1Balance
10CrCuSiV0.310.0020.010.620.830.250.1Balance
10CrMoAl0.450.0020.0120.350.980.09-Balance
14MnMoNbB1.530.010.0220.340.10.05-Balance
15MnMoVN1.520.0040.0260.40.10.05-Balance
16Mn1.40.0250.0090.360.10.05-Balance
16MnQ1.370.0230.030.30.10.070.05Balance
D361.40.0180.0220.390.050.05-Balance
JN235(RE)0.5160.0250.030.30.10.07-Balance
JN2550.670.0060.0160.070.020.050.05Balance
JN255(RE)0.390.0050.010.620.830.250.1Balance
JN3450.390.0050.110.050.90.40.65Balance
JN345(RE)0.360.0110.0890.28-0.29-Balance
JY235(RE)0.270.010.0890.28-0.29-Balance
Table 2. Environmental factors and their statistics.
FactorsUnitAverageMinimumMaximum
Average Relative Humidity (RH)%75.0956.1787.71
Average Temperature (T)°C17.5811.0826.05
Rainfallmm/month159.7445.64753
SO2 concentration (SO2)mg/cm30.0890.0150.302
pH of rain (pH)-6.145.116.97
Chloride concentration (Cl)mg/cm30.2210.00011.967