Article

Study on Intensification Behavior of Bismuth Ions on Gold Cyanide Leaching

School of Minerals Processing and Bioengineering, Central South University, Changsha 410083, China
*
Author to whom correspondence should be addressed.
Metals 2019, 9(3), 362; https://doi.org/10.3390/met9030362
Submission received: 16 February 2019 / Revised: 11 March 2019 / Accepted: 15 March 2019 / Published: 20 March 2019

Abstract

:
Gold cyanide leaching is inefficient with conventional cyanidation. Bismuth ions can improve the efficiency of gold cyanidation by intensifying gold dissolution. The electrochemical behavior, structure information, and surface product of gold anodic dissolution were studied during the intensification of bismuth ions on gold cyanide leaching. The electrochemical analysis showed that the bismuth ions can not only improve anode current density, but also make gold dissolve at a lower potential, increase the corrosion current and intensify gold anodic dissolution. The microstructure analysis showed that bismuth ions intensified the cyanide corrosion of the gold surface, causing a large number of loose honeycombs, gullies, pits, and large holes on the gold surface. The XPS, FT-IR, and Raman analysis showed that there is weak information of C≡N in the spectrum of Bi intensification contrasting to that of conventional cyanidation. Cyanide compounds may be the insoluble AuCNads, which does not deposit on the surface of gold plate after Bi intensification cyanidation. The insoluble intermediate AuCNads is likely to react promptly with CN- to form soluble Au(CN ) 2 , making less insoluble AuCNads deposits on the gold surface. Therefore, bismuth ions can promote the dissolution of insoluble AuCNads, prevents its passivation film to cover around the gold plate, keeps cyanide good contact with gold, and finally accelerates the cyanide dissolution of gold.

1. Introduction

Gold is an important strategic material and plays an important role in the development of national economy and social progress. Due to its advantages of chemical stability, simple process and low cost, cyanidation has become the main gold extraction method in the gold industry and has been applied in more than 80% of the gold mines in the world [1]. However, one of the most important limiting factors for this method is the gold leaching rate. In the process of gold cyanide leaching, a dense passivation film is easily formed on the gold surface, which seriously affects the gold leaching [2,3]. Therefore, the key of the cyanidation is how to improve the leaching rate of gold.
As we know, gold cyanide leaching is an electrochemical process that involved the anodic dissolution of gold and cathodic reduction of oxygen and other oxidants [4,5,6]. Hydrogen peroxide assisted leaching and oxygen enriched leaching that achieve good results in actual production is only a cathodic intensification [7,8]. The anodic reaction rate has become the main factor restricting the further improvement of gold leaching rate. Since the middle of the last century, researchers have discovered several heavy metal ions such as lead, mercury, bismuth, and thalium to intensify anodic dissolution of gold [9,10,11,12]. However, the strengthening mechanism has not been fully understood, which cannot explain the anodic dissolution and intensification.
In previous studies, the electrochemical kinetics of heavy metal ions to intensify the anodic dissolution of gold had been investigated [13,14]. The catalysis effect of heavy metal ions on gold leaching has been analyzed theoretically and verified on different gold-containing materials. In addition, the co-intensification of heavy metal ions, and oxidants were also briefly discussed [15]. However, the intensification behavior and mechanism of bismuth ions on gold leaching is still lacing of systematically understood, especially for bismuth ions. Meanwhile, bismuth ions can be circulated back to the leaching system, so little pollution will be caused by the usage of bismuth. In this study, the pure gold plates were used to avoid the interference of other factors in the leaching system. The electrochemical behaviors, structure information, and surface products of gold dissolution were researched and analyzed the intensification of bismuth ions on gold cyanide leaching. The study on the relationship between the gold dissolution and the intensifier revealed the enhanced effect of bismuth ions on gold cyanide leaching. These results may provide useful information for the industrial application of gold intensifying leaching.

2. Materials and Methods

2.1. Materials

The cylindrical gold plate (Φ7.0 mm × 2.0 mm) with 99.99% purity was employed to analyze the effect of bismuth ions on gold dissolution. The gold leaching agent and alkali used in the experiment were NaCN and NaOH, respectively. The soluble salt Bi(NO3)3 as an anode intensifier was applied with a concentration of 10−5 M. In electrochemical experiments, HNO3 and absolute ethanol were used for electrode treatment, and KNO3 was used for electrolyte. The chemical reagents were of analytical grade.

2.2. Methods

2.2.1. Gold Dissolution

The cylindrical gold plate was disposed before gold cyanide dissolution. Firstly, the gold plate was rubbed and polished with 0.06 A metallographic sandpaper. Secondly, the gold plate was processed with high temperature treatment using an alcohol burner. Finally, the gold plate was ultrasonically cleaned for 8 min with the cleaning solutions of distilled water, 10% dilute nitric acid, distilled water, anhydrous ethanol, and distilled water successively.
After disposed, the gold plate was bonded on the stirring rod of speed regulation stirrer. The stirring rod with gold plate was put in the bottom of solution with a NaCN concentration of 0.3% and a pH of 12. Meanwhile, a certain amount of Bi(NO3)3 was added to the solution for Bi intensification cyanidation, while there was no heavy metal ions in conventional cyanidation. The stirrer was rotated at a speed of 400 rpm and leaching time began to be recorded. After leaching for a certain period of time, the gold plate was cleaned with distilled water and dried with natural air-drying. Afterwards, the weight of gold plate was weighed, and its microstructure and surface products were analyzed.

2.2.2. Electrochemistry

The electrochemical tests were conducted on the Model 1273 from Princeton EG & G PARC (TN, USA). The working electrode was a rotating gold disk electrode, the reference electrode was the saturated Ag-AgCl electrode, and the auxiliary electrode was a large area bright metal platinum electrode. By analyzing the cyclic voltammetry and tafel curves, the redox behavior of gold in a wide range of potentials could be quickly observed in the cyanide leaching system. The NaCN concentration, electrode speed, pH, and temperature were 0.3%, 100 rpm, 11.0, and 25°, respectively. The electrochemical tests and data analysis were performed by the power suite electrochemical workstation.

2.2.3. Microstructure and Surface Product Analysis

The microstructure and surface products of the gold plate after conventional and Bi intensification cyanidation were analyzed by Scanning Electron Microscope (SEM), X-ray Photoelectron Spectrometer (XPS), and Fourier Transform Infrared Spectroscopy (FT-IR), Raman. The SEM analysis was conducted using a JSM-6360LV (Beijing, China) to compare the morphology changes of gold leaching. The XPS was manipulated in Ka 1063 X-ray photoelectron spectrometer by Thermo Fisher Scientific (New York, NY, USA), analyzed the elemental composition and bonding properties of the surface product, whose vacuum degree was better than 1 × 10⁻⁷ Pa, X-ray source, and energy were Al Ka and 50 eV, respectively. The Infrared spectrum was performed in a Nexsus 670 IR spectrometer manufactured by Nicolet (Green Bay, WI, USA) with a spectral range of 50~7400 cm−1 and spectral resolution of 0.09 cm−1. The Raman analysis was using a LabRAM HR800 microscopy laser Raman spectroscopy of Horiba Jobin Yvon (Paris, France). The spectral range: 400 nm~1050 nm, spectral repeatability: no more than 0.2 cm−1.

3. Results

3.1. Effect of Bismuth Ions on Gold Dissolution

To avoid the interference of other factors, the intensification behavior of bismuth ions on gold dissolution was analyzed by the pure gold plate. The concentration of bismuth ions was 10−5 M and its effect on gold dissolution at different times was shown in Figure 1. It indicated that the quality loss of the gold plate during Bi intensification cyanidation was far greater than that of conventional cyanidation. After 3 h of Bi intensification dissolution, the quality loss per unit area of the gold plate was as high as 0.911 mg/cm2, while the conventional dissolution was only 0.294 mg/cm2. Even though having 12 h of conventional dissolution, the quality loss per unit area of the gold plate was 1.094 mg/cm2 that near to the quality loss after 3 h Bi intensification cyanidation. At any time, the quality loss per unit area of the gold plate with Bi intensification cyanidation was higher than that with conventional cyanidation. It means that the gold dissolution can be strongly intensified by bismuth ions.

3.2. Electrochemical Behavior

3.2.1. Gold Dissolution Behavior by Cyclic Voltammetry

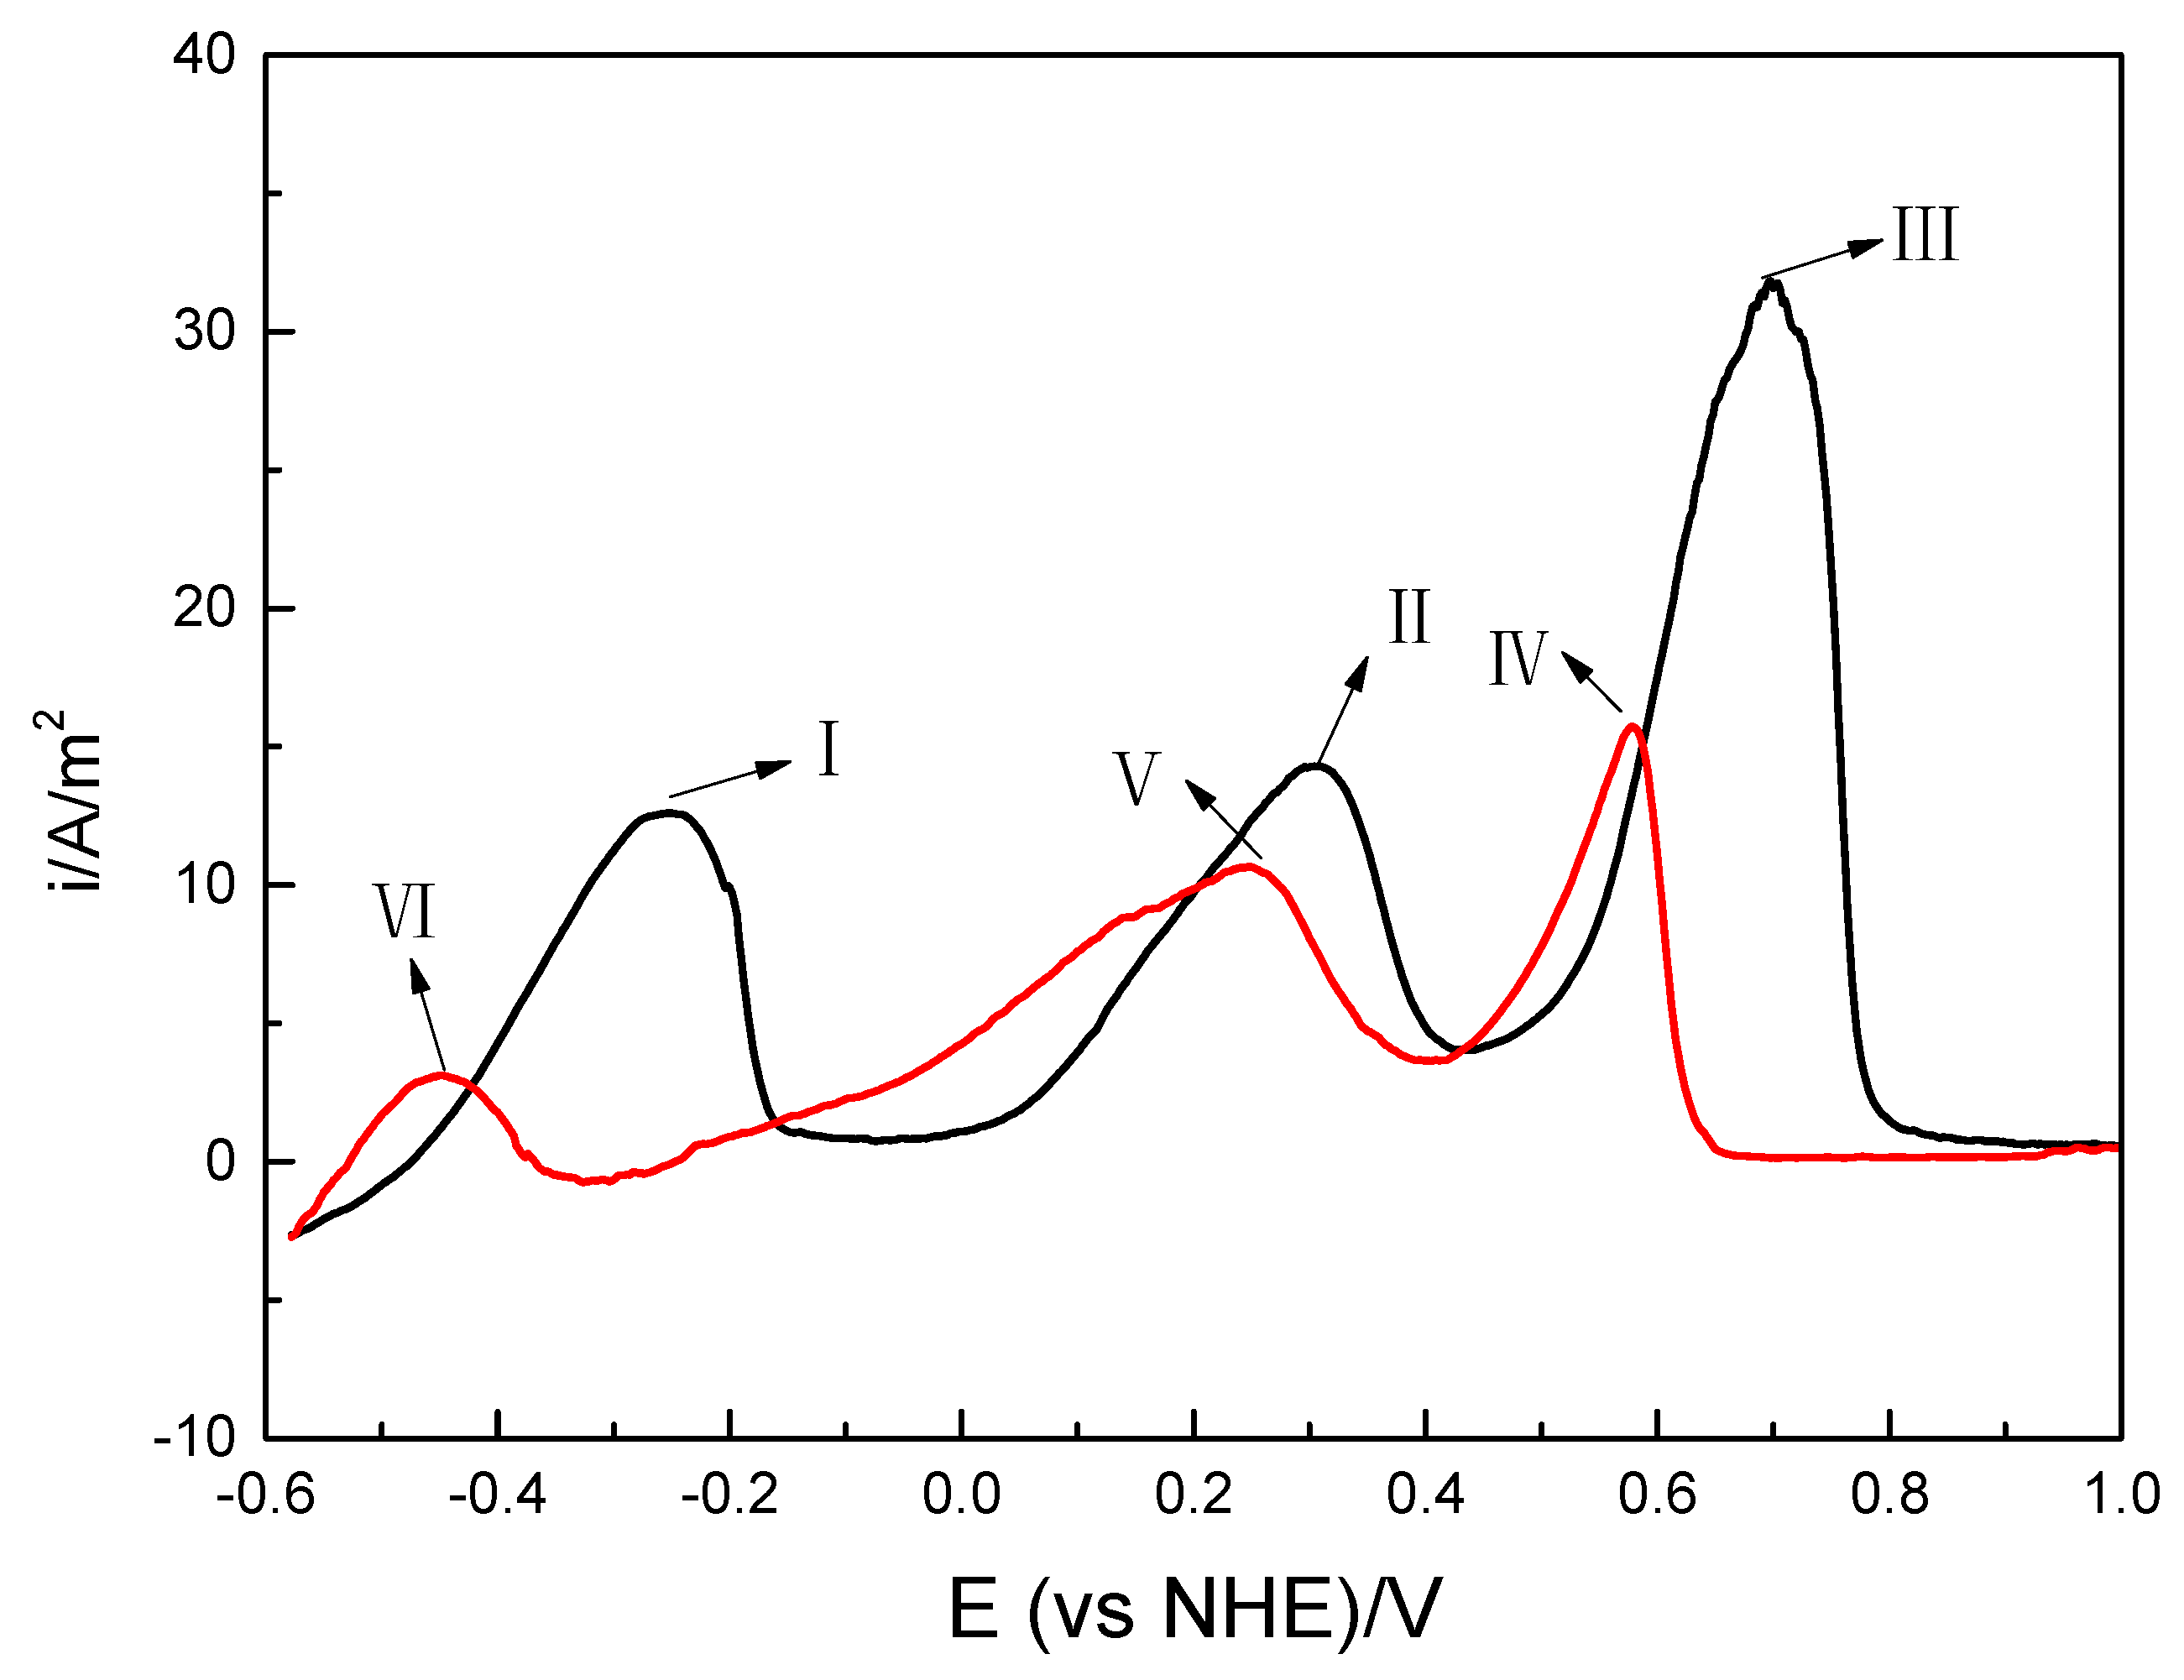
The gold dissolution behavior in conventional cyanidation was observed by CV (cyclic voltammetry) and the result was shown in Figure 2. The shape and feature parameters of the oxidized part in the curve were consistent with the finding of Kudry and Jiang Tao [16,17,18]. The anodic dissolution of gold plate appears three oxidative peaks within the potential range of −0.6 to 0.8 V, indicating that the gold plate in cyanide leaching has undergone three different oxidative dissolutions. The three potential peaks were about at −0.25 V, 0.3 V, and 0.7 V, and their currents were 0.48 mA, 0.52 mA, and 1.25 mA, respectively. The anodic peak I was the dissolution of gold or the formation of oxidation film. In the potential range of −0.15 V to 0.1 V, there were almost no current through the electrode and gold that reaches a steady state of passivation. It indicated that the formed passivation film has a good protective effect on the gold electrode. The anodic peak II was formed at about 0.3 V, and the gold achieved second active dissolution. The peak III was higher than that of peak I and peak II, indicated that the direct oxidation dissolves without intermediate adsorption products. Due to the oxidation reaction of gold dominant, there was no peak of oxide reduction in reverse scanning. While three obvious peaks of forward oxidation current (IV, V, and VI) appear at 0.6 V, 0.25 V, and −0.5 V, respectively, which was similar to the oxidation characteristic of many small molecules with CV negative scan [19,20,21]. These peaks reveal a special voltammetric behavior caused by the intermediate products AuCNads [22].
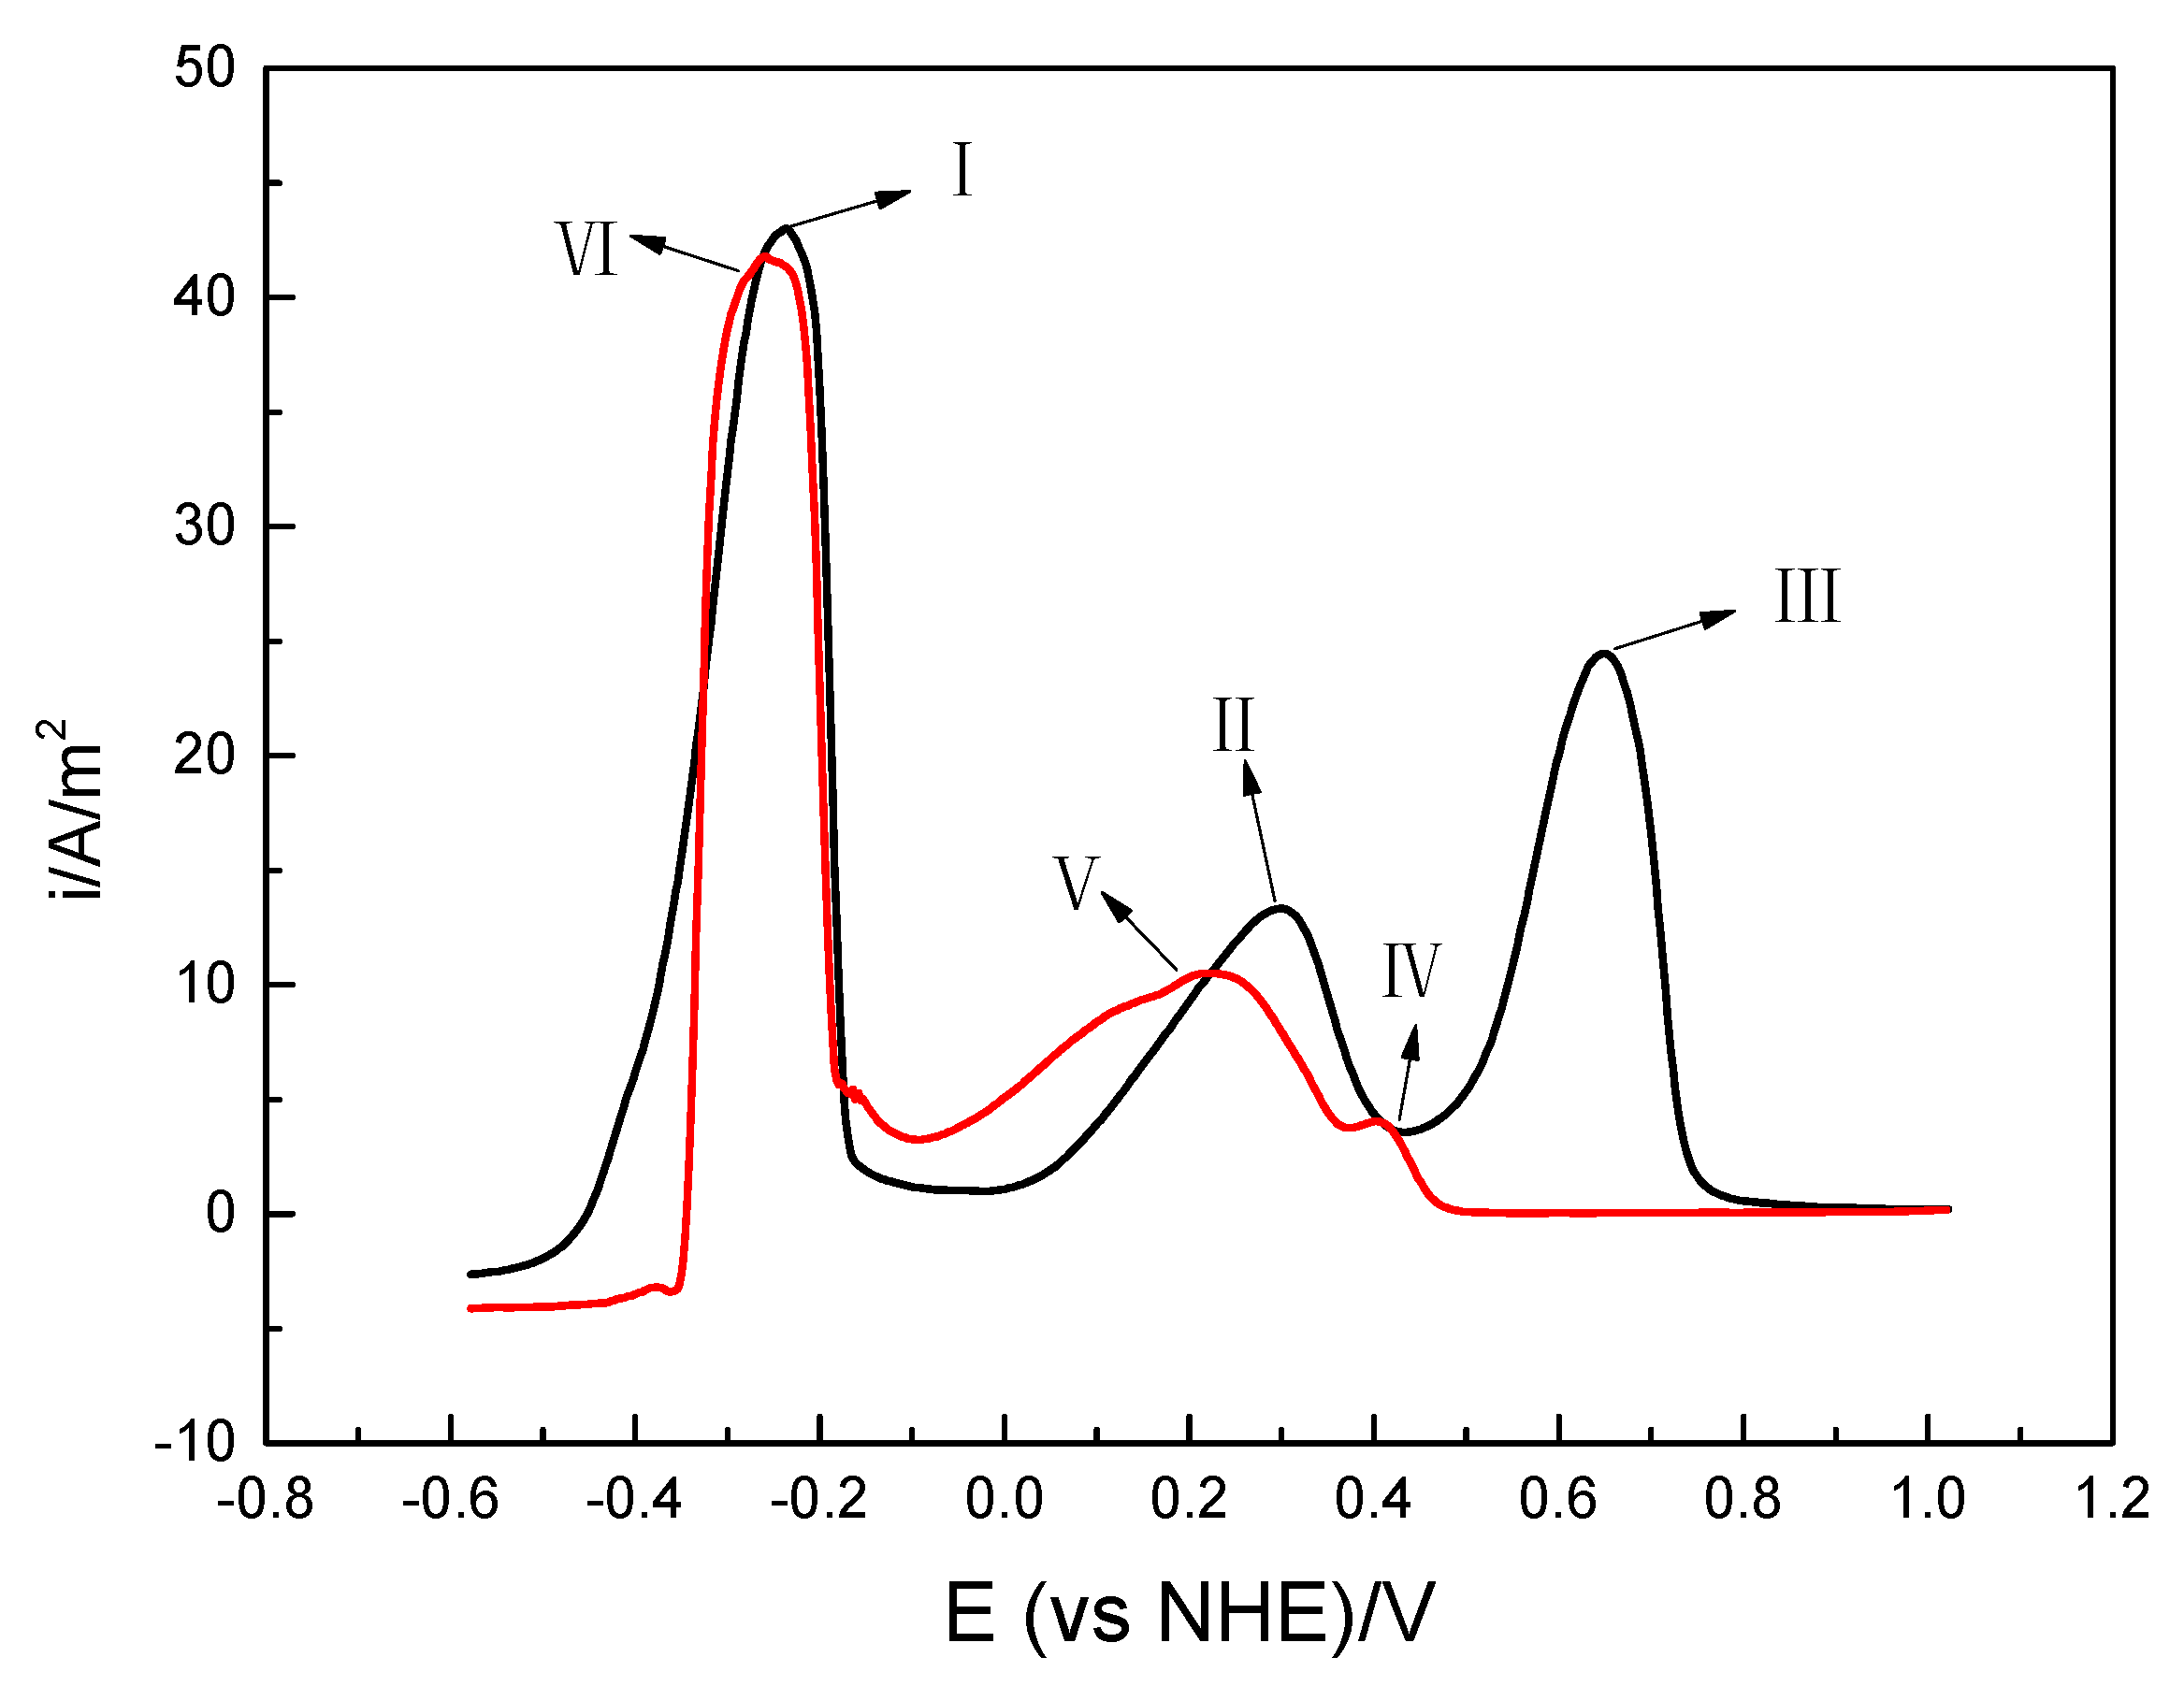
Similarly, the gold dissolution behavior in the Bi intensification cyanidation was observed by cyclic voltammetry, the result was shown in Figure 3. There were also three obvious oxidation peaks within the potential range of −0.6 V to 1.0 V, indicated that the gold undergoes three different oxidation dissolution similar to conventional cyanidation. While the potentials were about −0.3 V, 0.3 V, and 0.65 V, and their currents were at 1.70 mA, 0.5 mA, and 0.8 mA, respectively. Compared with Figure 2, the basic shape of CV plot did not change significantly, indicating that the same oxidation dissolution reactions have occurred in Bi intensification cyanidation. However, the position of the oxidation peak was negatively shifted, indicating that the gold could be oxidized and dissolved at a lower potential under the condition of Bi intensification. The current of peak I was three times that of conventional cyanidation, indicating that the anodic dissolution rate of gold significantly increased under the condition of Bi intensification. In the process of reverse scanning, there were also three obvious peaks of oxidation current (IV, V, and VI) that appear at 0.4 V, 0.2 V, and −0.3 V, respectively. Bismuth ions may destroy passivation film on the gold surface, increase the corrosion current, and improve the anodic dissolution of gold.

3.2.2. Gold Dissolution Behavior by Tafel Curves

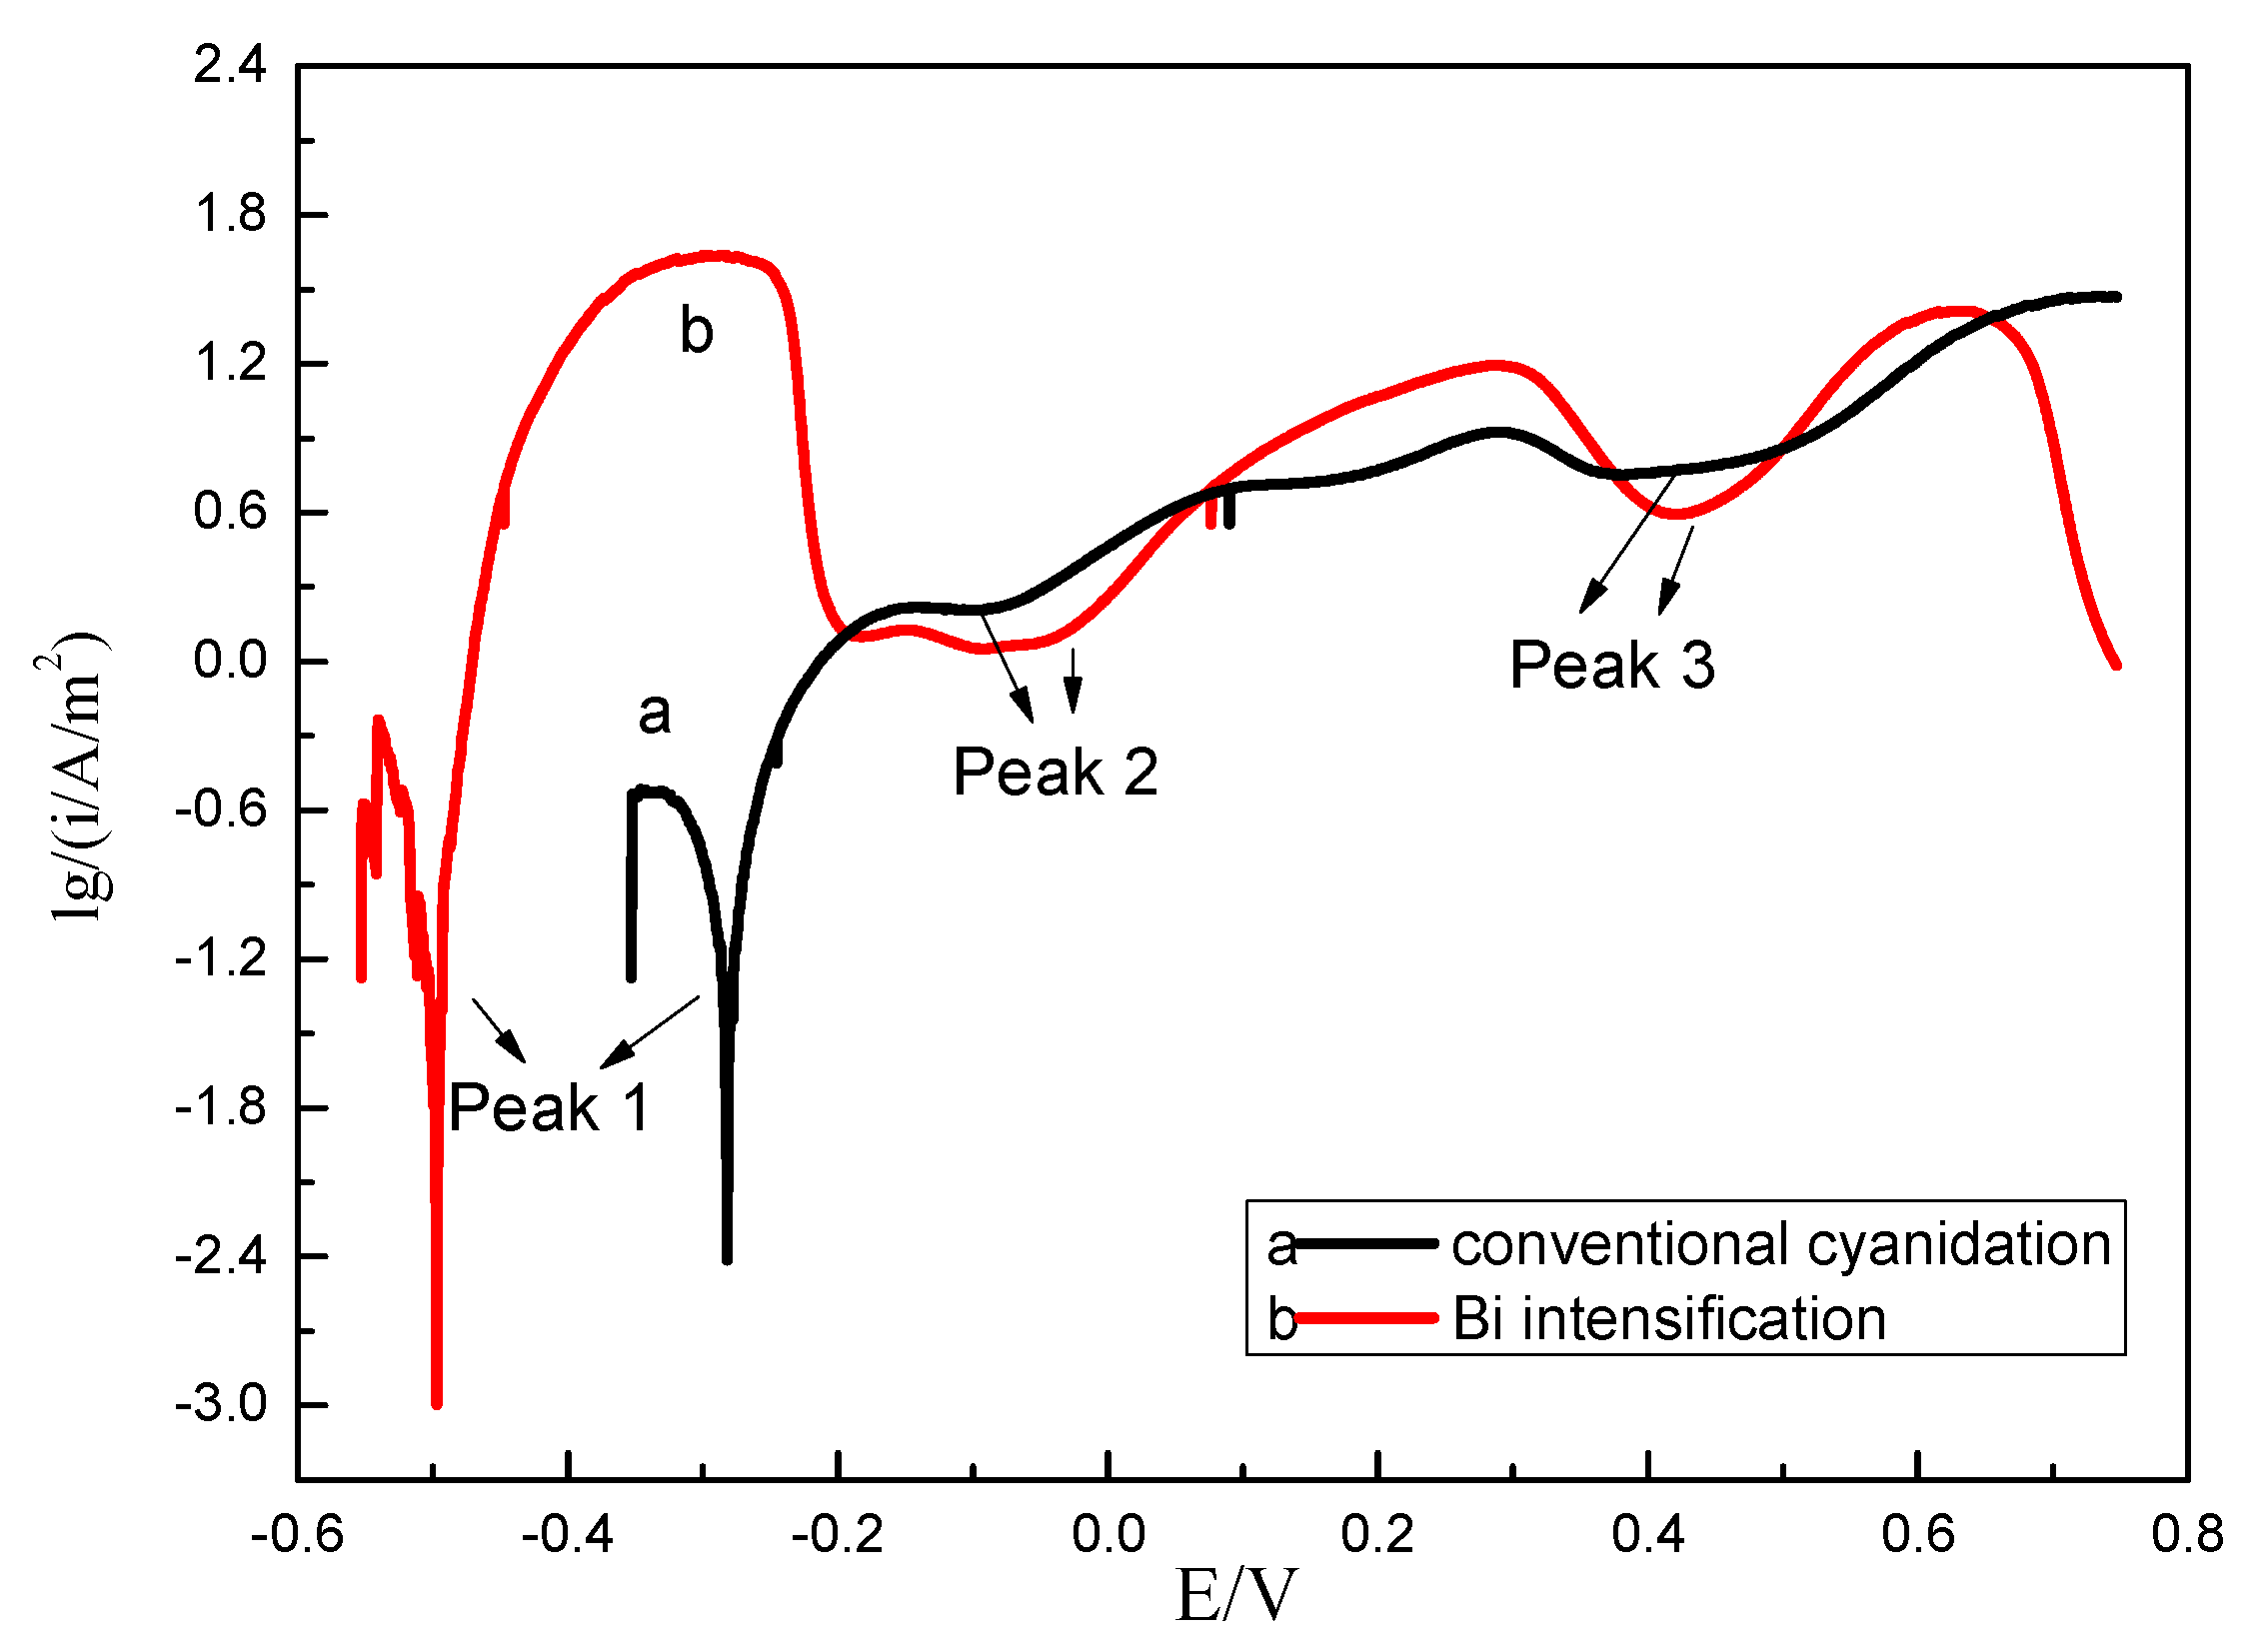
The Tafel curves of gold in conventional and Bi intensification cyanidation were compared. It can be seen from Figure 4 and Table 1 that both of gold under conventional and Bi intensification cyanidation undergo three significantly corrosion dissolution, which was consistent with the cyclic voltammetry curves. As shown in Figure 4a,b have similar peaks of current density, indicating that the same gold dissolution reaction occurred. The corrosion potential and corresponding corrosion current were shown in Table 1. Compared with the conventional cyanidation, the self-corrosion potential at the first peak was shifted by 0.2 V, indicating that the gold anodic corrosion was more likely to occurred. For Tafel curve of Bi intensification cyanidation (Figure 4b), the three corrosion peaks have significantly improve contrast with that of conventional cyanidation. The potential of peak 1 was −0.5 V under Bi intensification, which was lower than that in conventional cyanidation. Moreover, the current density under Bi intensification was 2.5 times that of the conventional cyanidation. It indicated that the bismuth ions can not only improve anodic current density, but also dissolve gold at a lower potential, resulting increased the current corrosion and intensified anodic dissolution of gold. It may be that the bismuth ions destroy the smoothness and compactness of the passivation film, activate the gold electrode, and accelerate the gold corrosion process.

3.3. Microstructure Analysis

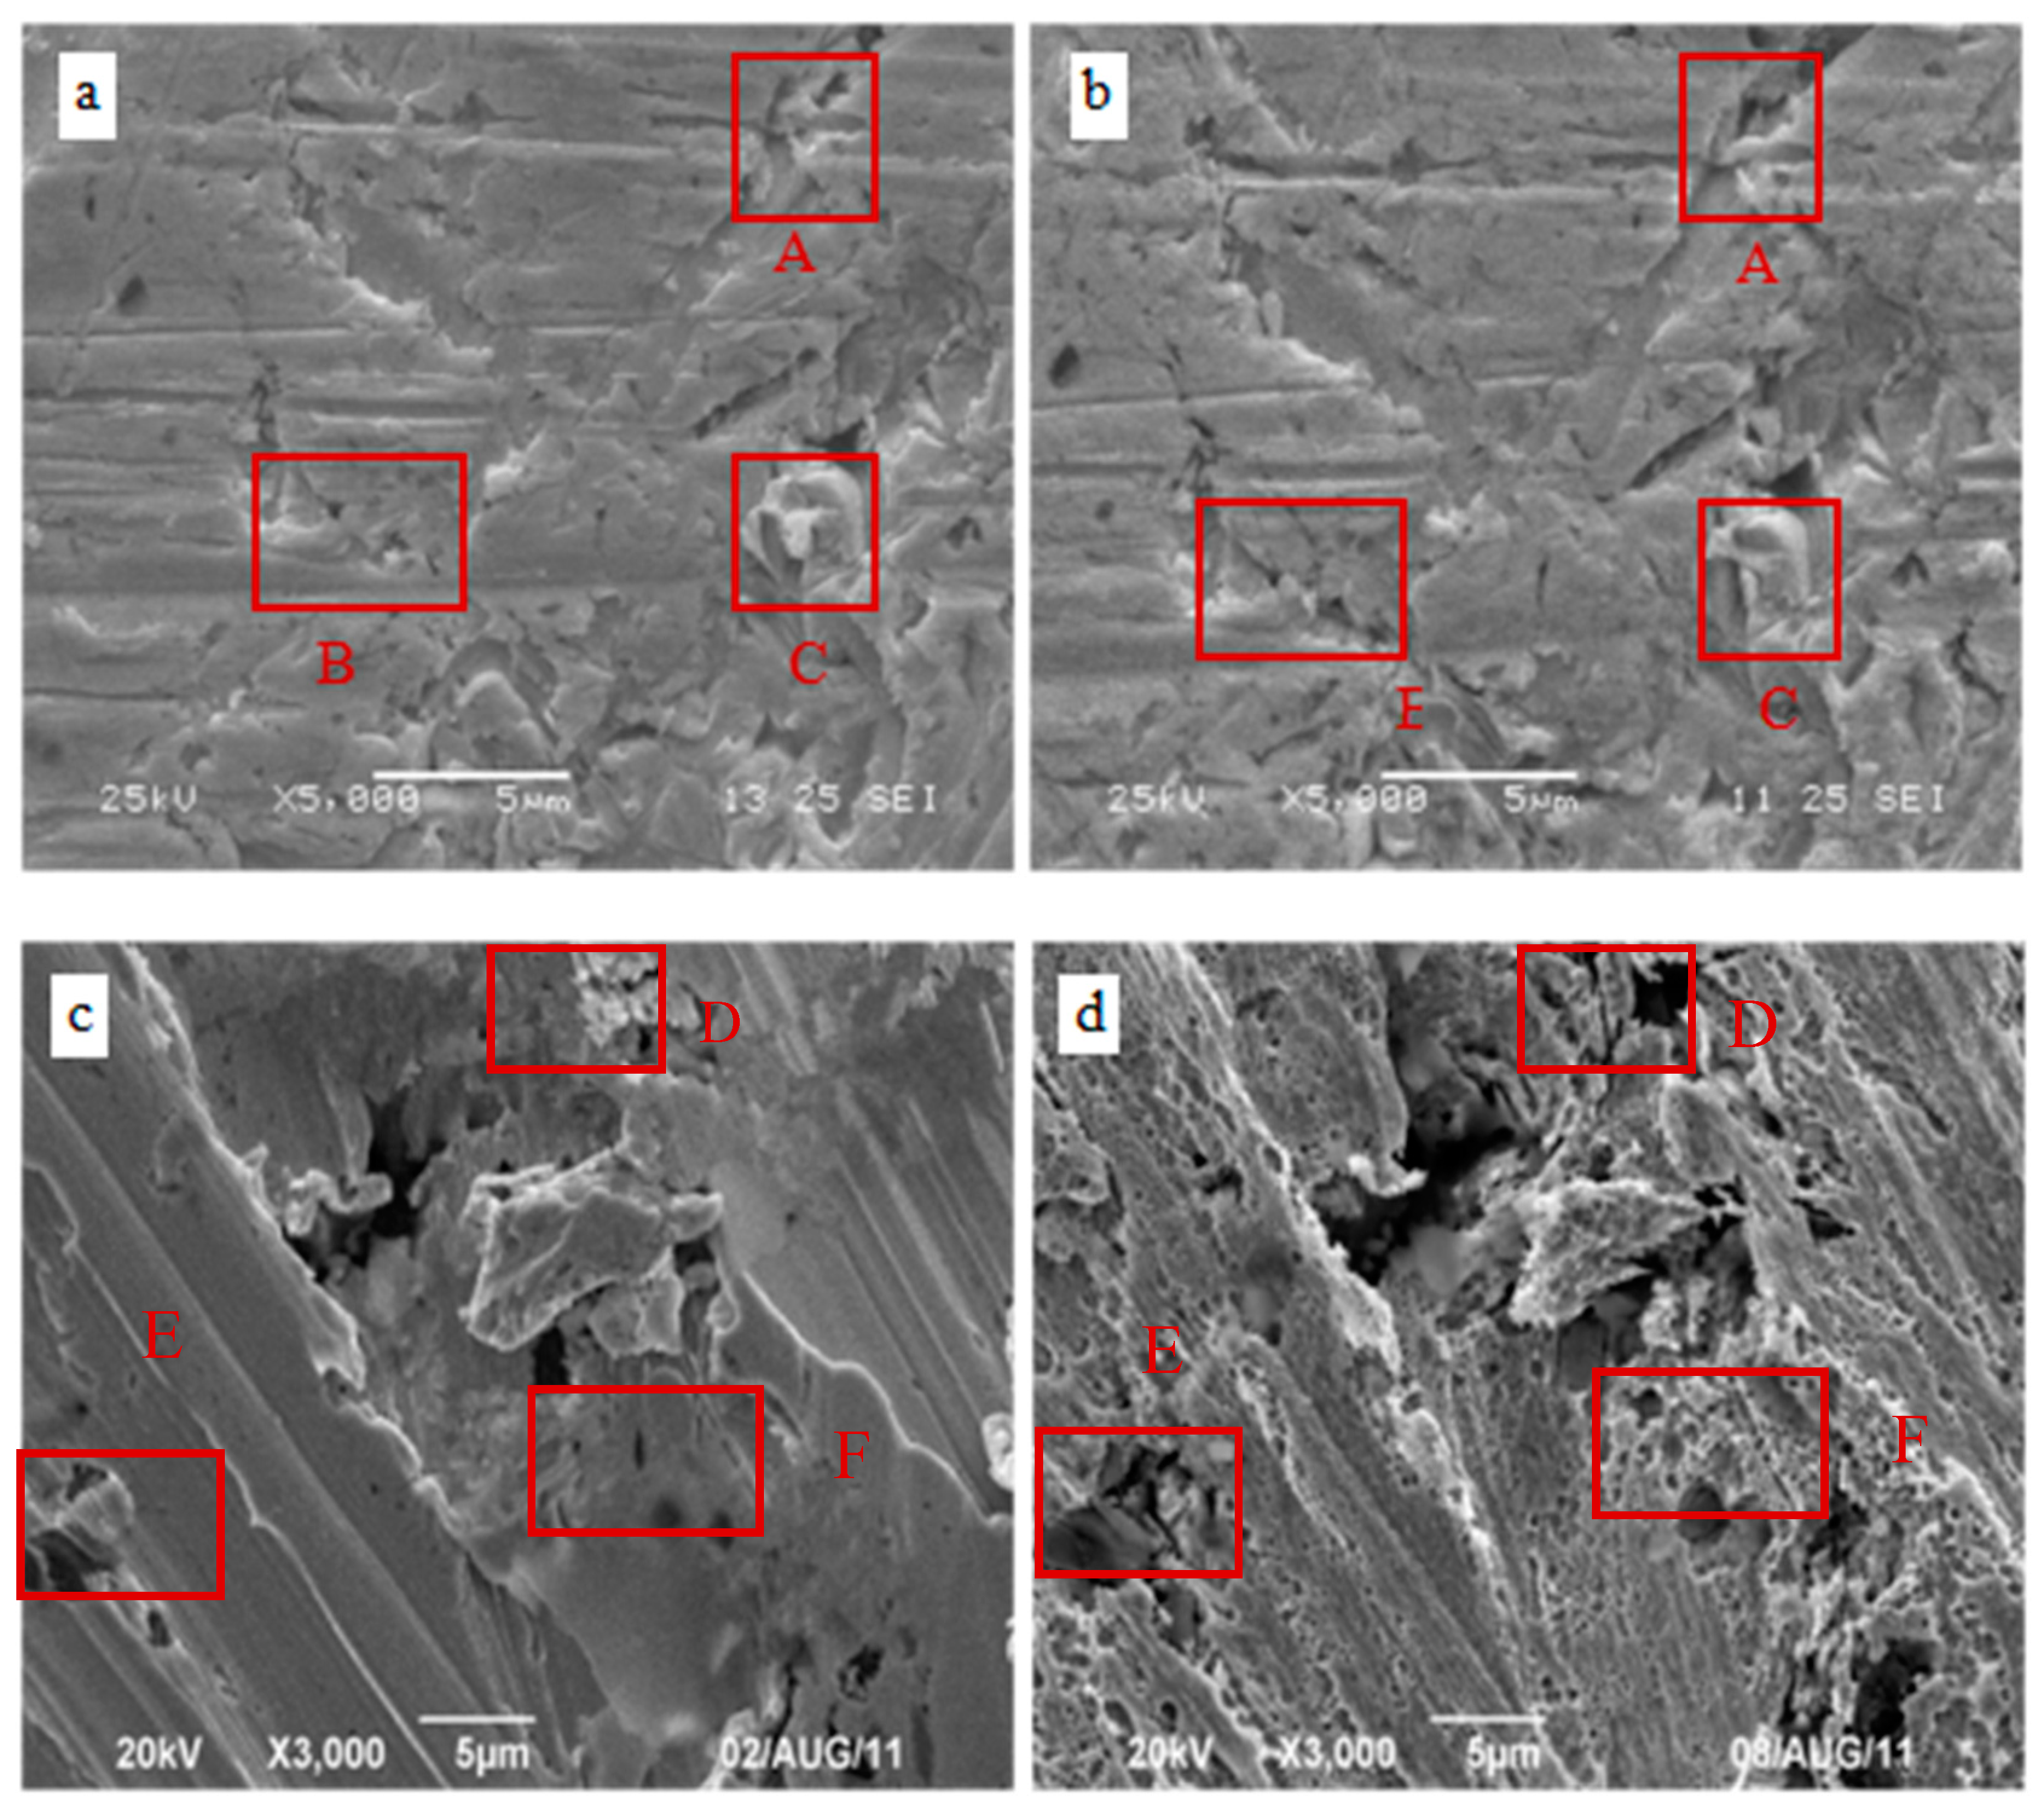
The original gold plates were analyzed by SEM, and the gold plates after 12 h cyanide dissolution (conventional and Bi intensification) were also detected. As indicated in Figure 5a,b, the microstructures of two gold plates were almost the same, indicating that the surface structure of gold plate has little change during conventional cyanide dissolution. Meanwhile, it can be seen that the surface roughness of gold increased slightly, and there was edge erosion and ravine expansion. However, as shown in Figure 5c,d, the surface structure of gold plate has significant change after Bi intensification. For the original gold plate, there were some shallow ravines on the gold surface, but its structure seems quite homogeneous and exhibits an integral whole. After Bi intensification dissolution, a large number of loose honeycombs, ravines and pits appeared, making the gold have a rough and loose surface. This loose honeycomb, ravine, pit, and hole improve the contact area between gold and cyanide, further promoting the dissolution of gold. The incomplete and rough surface structure of gold is conductive to gold dissolution, because the gold dissolution mainly occurs at the break point of boundary, such as edges, corners, pits, and cracks [23,24]. In the process of Bi intensification dissolution, the gold plates were seriously corroded, indicating that the gold dissolution rate was higher than that of conventional dissolution. Therefore, bismuth ions play an important role in gold dissolution. Bi intensification cyanidation corrodes gold surface, destroys its structure, and ultimately accelerates gold dissolution.

3.4. Composition Analysis of Surface Products

3.4.1. Surface Product Information Analysis by XPS

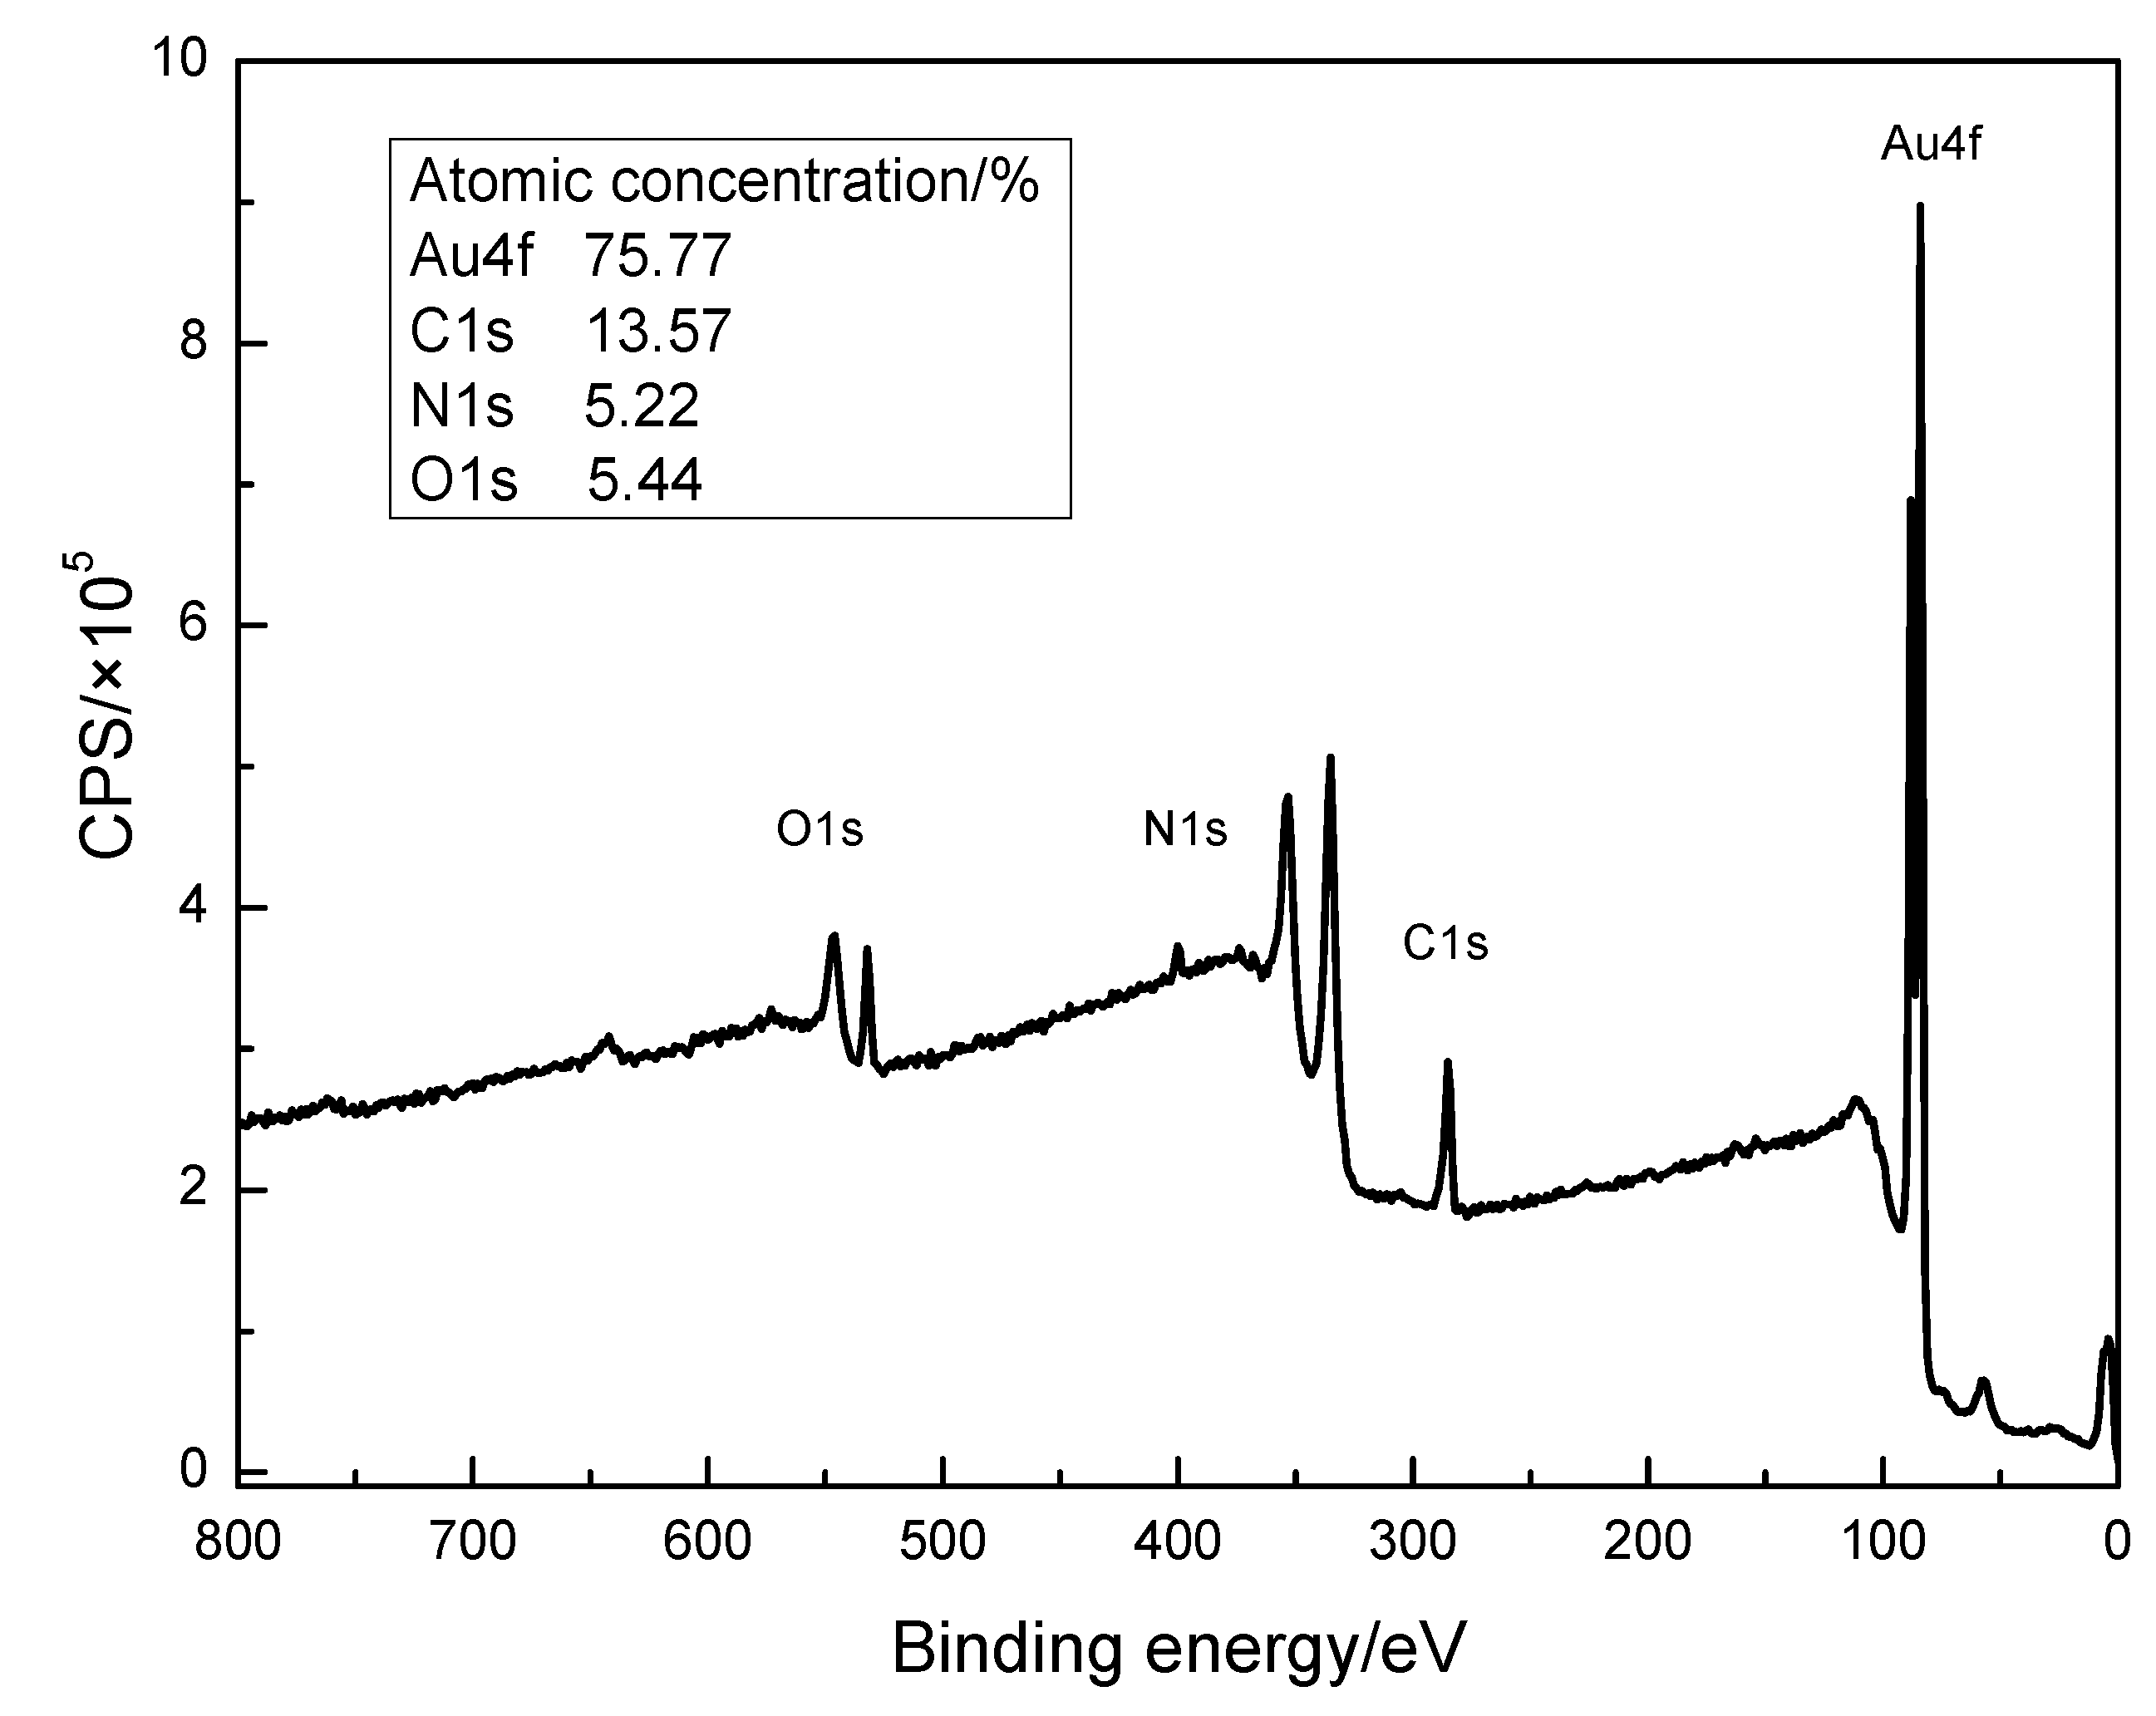
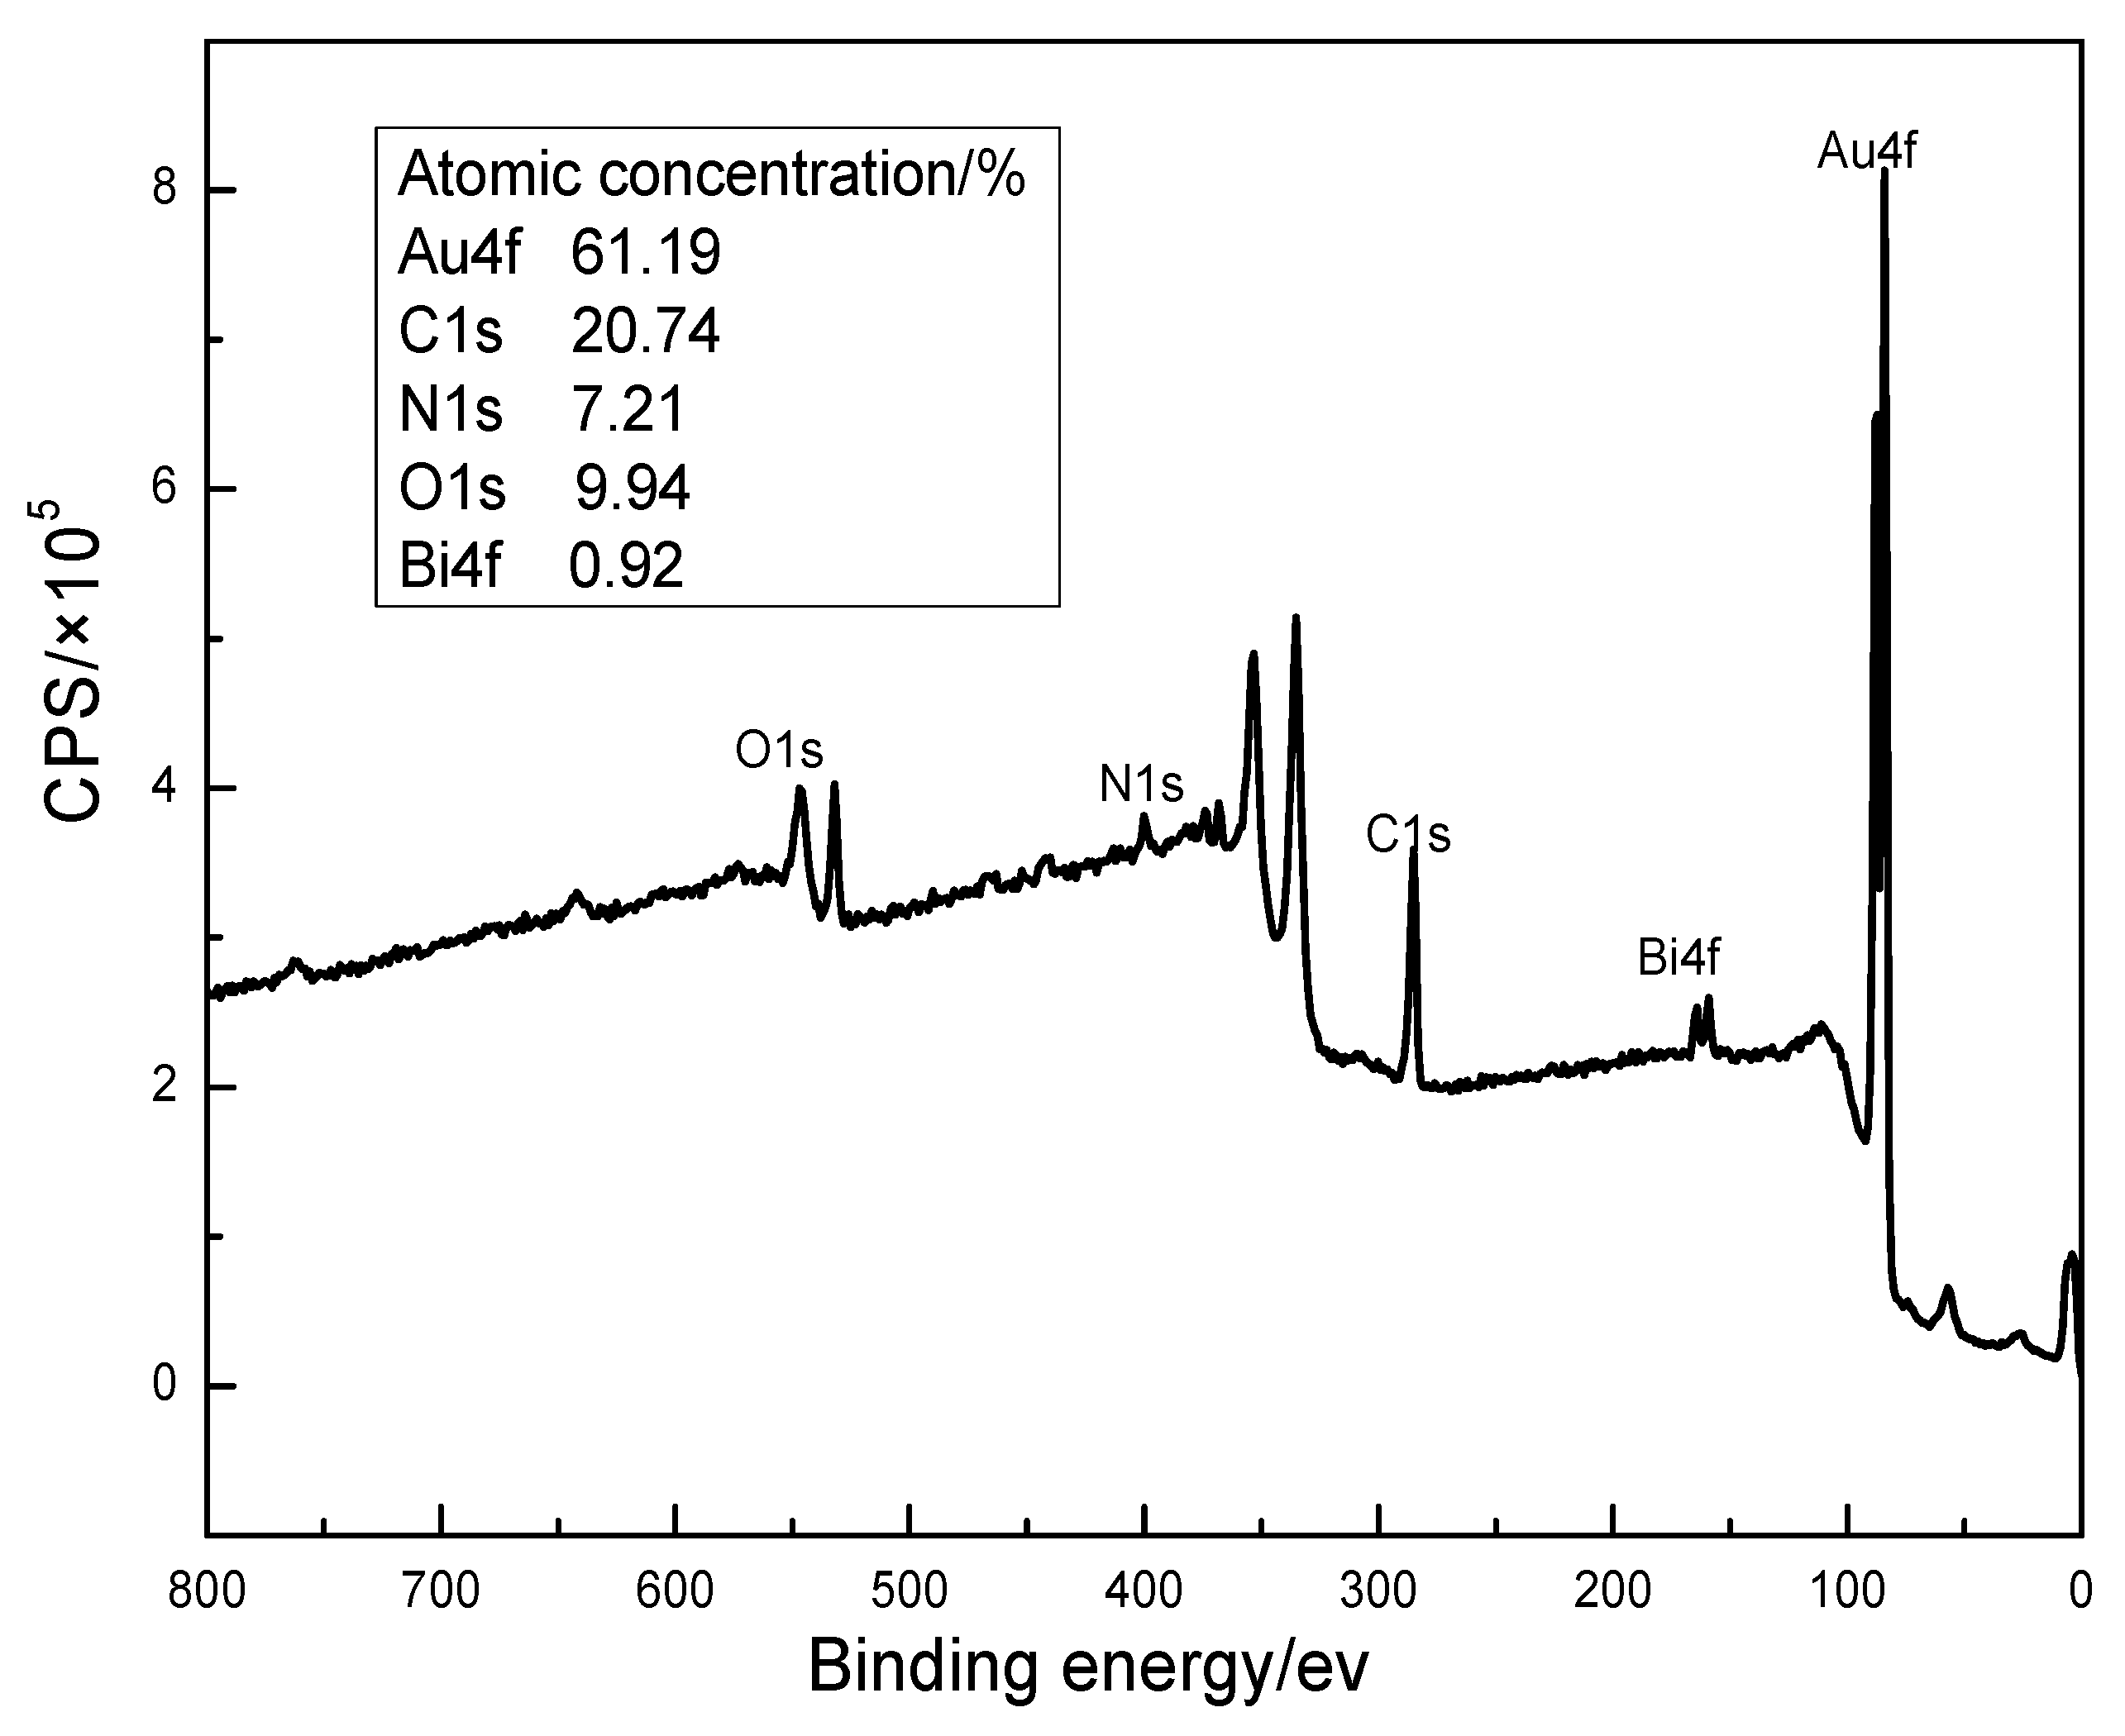
The gold plates after cyanide dissolution (conventional and Bi intensification) were analyzed by XPS to obtained molecular level product information on the gold surface, and the results of XPS spectra (Au4f, C1s, N1s, O1s, and Bi4f) were shown in Figure 6 and Figure 7. Both XPS spectra were basically the same, except that there was a weak Bi4f peak in Bi intensification, which was caused by the addition of bismuth ions. The similar spectrum means that the surfaces of two gold plates were made up of similar chemical elements. Meanwhile, the relative concentration of elements on the gold surface was shown in Table 2. The content of Au was higher than other elements, indicating that gold was the main element on the surface of gold. The existence of C, N, and O indicates that cyanide forms some products deposited on the gold surface. Compared with the XPS analysis of gold plates under conventional cyanidation, the proportion of Au on gold surface under bismuth intensification was decreased significantly, while the proportion of C, N, and O was increased. The results showed that the rapid dissolution of gold resulted in a relatively small amount of gold on the surface, which was consistent with the results of surface microscopic detection. The deposition of bismuth on the gold surface was as high as 0.92%, indicating that the intensifying effect was related to the bismuth ions. Jeffrey and Ritchie [25] had found that the under-potential deposition of metal on the gold surface can enhanced the oxygen reduction by a bimetallic corrosion mechanism. It is speculated that the bimetallic corrosion mechanism of trace bismuth on the surface of gold accelerates the reduction of oxygen and thus enhances the cyanide dissolution of gold.
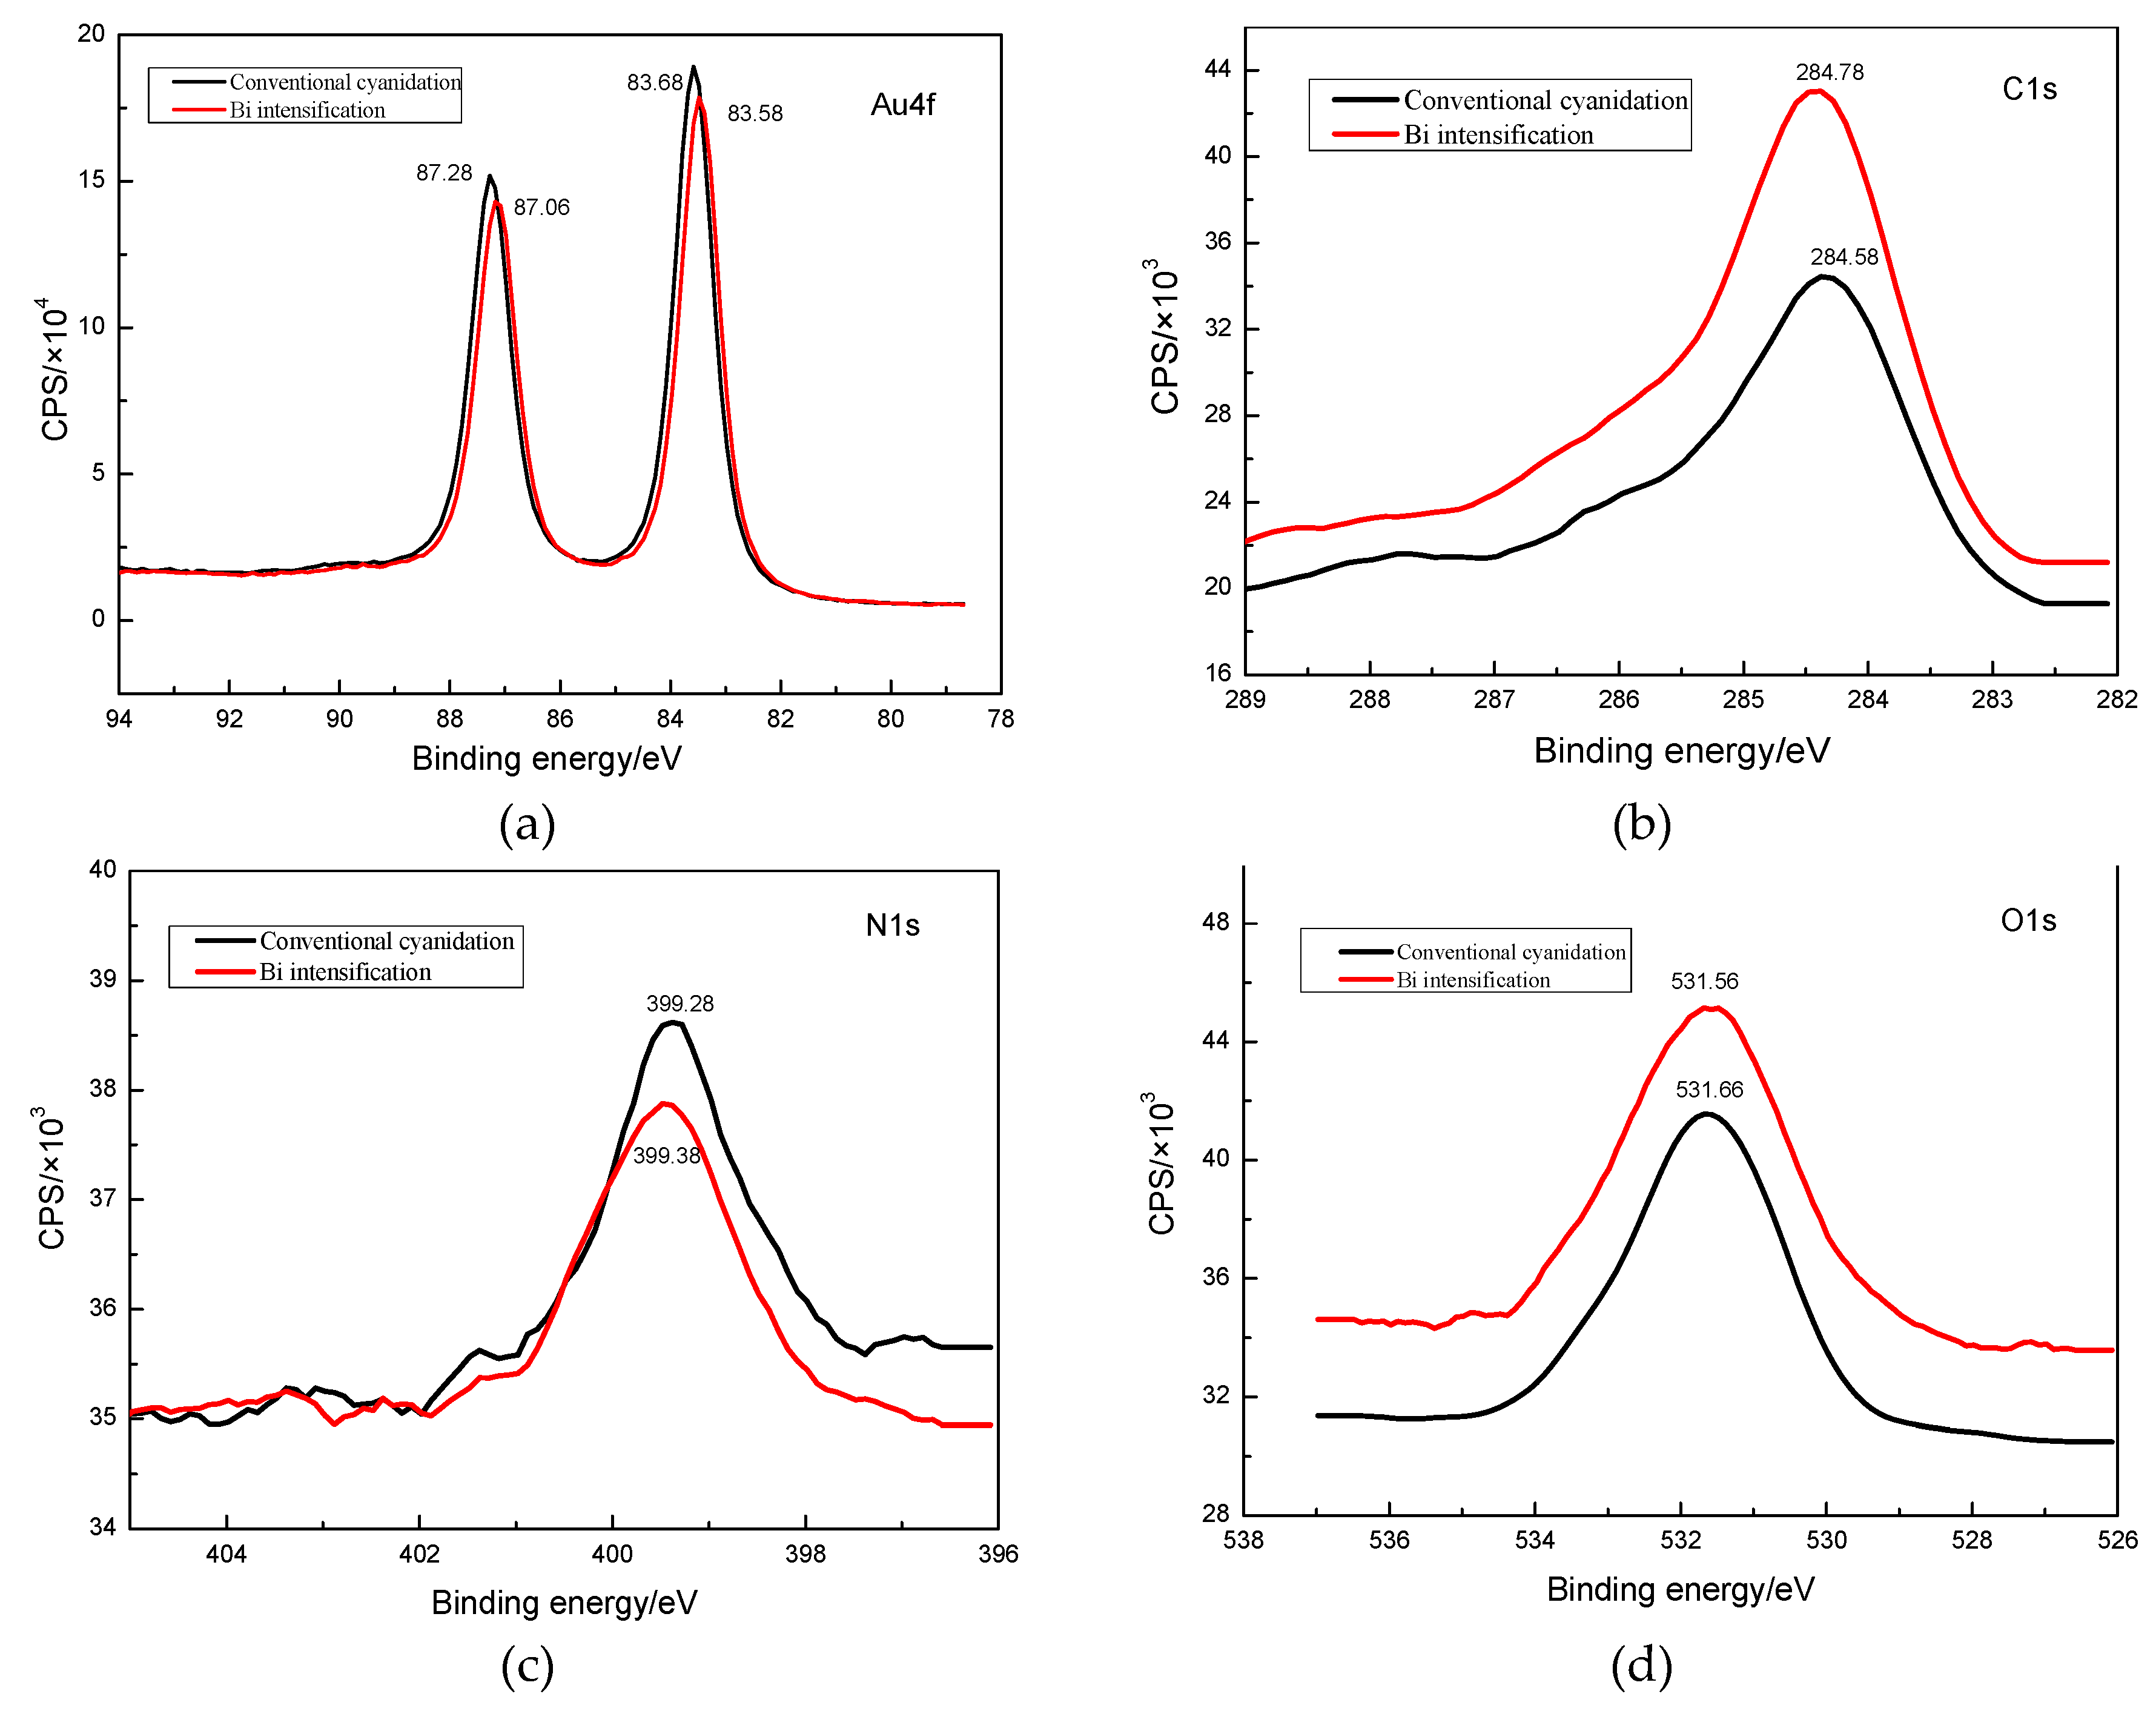
In order to reveal the difference of surface products between two gold plates, the spectra of Au4f, C1s, N1s, and O1s were analyzed, respectively. The results were shown in Figure 8. Both Au4f spectra show two peaks, while the C1s, N1s, and O1s spectra display only one peak. For the two Au spectra, the lower binding energy at 83.68 eV and 83.58 eV originate from elemental Au, which was basically consistented with of the Au4f peak of the XPS manual [25]. While the peaks with higher binding energy at 87.28 and 87.06 eV may be attributed to Au- in the form of AuCNads [26]. As can be seen from the C1s spectrum, the C1s binding energy at 284.88 eV and 284.68 eV may be attributed to graphite carbon [27]. Meanwhile, the N1s binding energy of conventional and Bi intensification cyanidation was 399.28 eV and 399.38 eV, respectively, which may have been originated from the bond of C≡N. It can be considered that the peaks were obtained from CN in the form of AuCNads [28]. As shown in the O1s spectra, the binding energy of conventional and Bi intensification cyanidation were 531.66 eV and 531.56 eV, respectively, probably due to OH in the forms of Au(OH)x and Au(OHCN) [29]. During the dissolution of gold, the CN and OH combined with gold to form insoluble products on the gold surface. Combined with the Table 2, in the presence of bismuth ions, the proportion of the insoluble compounds were decreased significantly, indicating that the bismuth ions can reduce the formation of insoluble and accelerates the dissolution of gold.

3.4.2. Surface Product Information Analysis by FT-IR

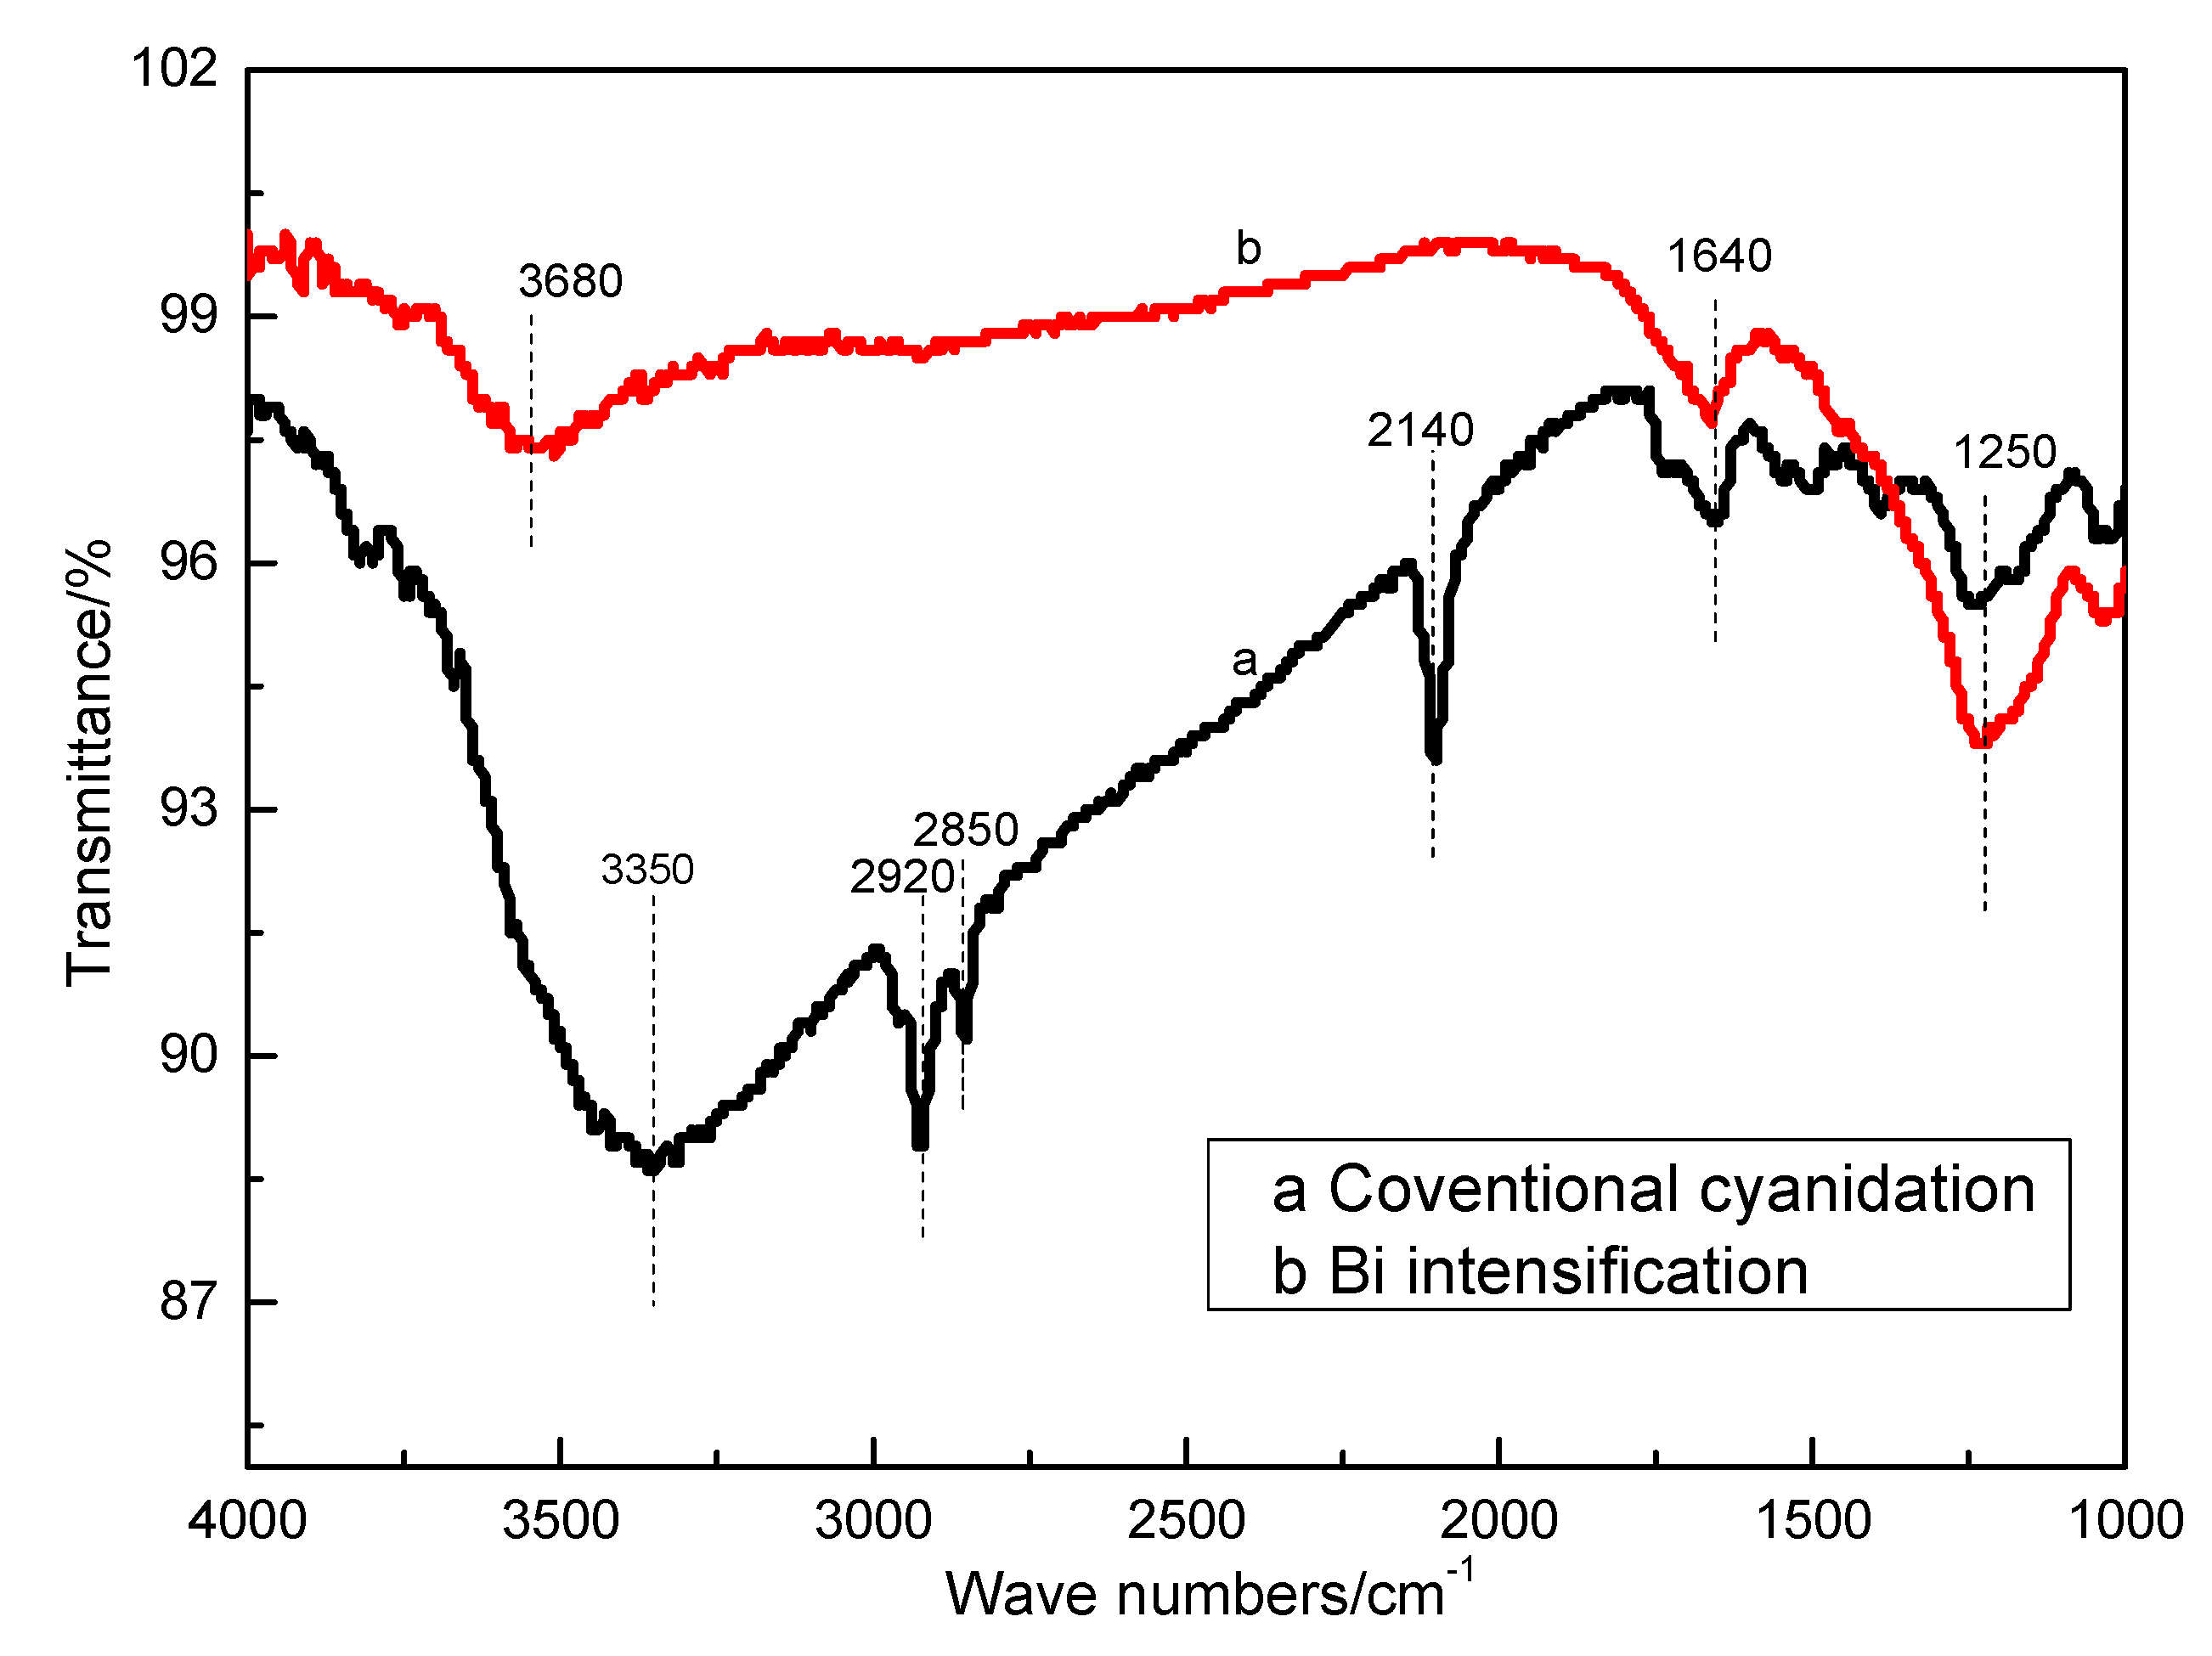
After XPS analysis, the same gold plates under conventional and Bi intensification cyanidation were analyzed by FI-IR. The results were shown in Figure 9 and Table 3. The peaks at 1250 cm−1 and 1640 cm−1 both existed in the two spectra were alcohols and nitro compounds, respectively [30]. It may be the residue of nitric acid and ethanol during the cleaning process of the gold plate. The peaks at 2850 cm−1 and 2920 cm−1 only exhibited in the conventional cyanidation spectrum were hydrocarbon compounds [31]. The hydrocarbon compounds were the mixed impurities introduced during the cyanide dissolution. The peaks at 3350 cm−1 and 3680 cm−1 were alkaline compounds, causing by sodium hydroxide [32]. Compared to the two spectra, the sharp C≡N stretching vibration band appears at 2140 cm−1 in the infrared spectrum of conventional cyanidation [33], indicating that the considerable amounts of cyanide compounds deposit on the gold surface. The cyanide compounds may be the insoluble AuCNads. There is no peak (C≡N) on the spectrum of Bi intensification, indicating that there is no large amount of cyanide on the surface of gold. It means bismuth ions can promote the conversion of AuCNads to Au(CN ) 2 , prevent the deposition of insoluble, and reduces the formation of passivation film.

3.4.3. Surface Product Information Analysis by Raman

Meanwhile, the surface products of the gold plate after conventional cyanidation and Bi intensification cyanidation were observed by Raman spectra. The results were shown in Figure 10. Compared to two Raman spectra in Figure 10a,b, they were basically the same, except for some peak intensity. A characteristic peak at 1586.50 cm−1 was observed both in the two Raman spectra. This was caused by the vibration of water molecules. Another weak reverse characteristic peak at 2157.98 cm−1 was also detected in the Raman spectra and it corresponds to the sharp C≡N stretching vibration peak at 2140 cm−1 in the infrared spectrum. This means that the Raman and infrared spectra are complementary. It can be proved that the insoluble AuCNads was formed on the gold surface during cyanidation. A relatively obvious peak appeared at 1586.5 cm−1 in Bi intensification, which may be caused by the adsorption of bismuth on the surface of the gold matrix. However, the C≡N reverse peak of Bi intensification cyanidation did not change significantly, speculating that there were less insoluble AuCNads on the gold surface. The results showed that insoluble AuCNads were formed during the dissolution of gold cyanide. Bismuth ions promoted the conversion of insoluble AuCNads to soluble Au(CN ) 2 , preventing the deposition of AuCNads on the gold surface.
The above studies show that the gold dissolution was carried out in two steps. In the first step, Au reacted with the complex agent CN to form an insoluble AuCNads, Equation (1). The results of XPS and FT-IR spectra show that the insoluble products were mainly composed of AuCN, Au(OHCN), and Au(OH)x. In the second step, the main insoluble AuCNads were further reacted with the complex agent CN to generate the soluble Au(CN ) 2 . In the process of gold cyanide dissolution, the insoluble compounds AuCNads were generated constantly and deposited on the gold surface. The formed passivation film covers the gold surface and hinders the reaction of gold with cyanide. However, the bismuth ions were dispersed and deposited on the gold surface, caused numerous breakpoints, damaged the continuity and integrity of the passivation film, and becoming the boundary lines and points needed for the dissolution reaction of the insoluble AuCNads. Bismuth ions promoted the conversion of AuCNads to Au(CN ) 2 and obstructed the formation of insoluble compounds, which prevented the deposition of passivation film on the gold surface. It keeps cyanide have good contact with gold and finally accelerates the gold cyanide dissolution.
Au + CN = AuCN ads + e
AuCN ads + CN = Au ( CN ) 2

4. Conclusions

(1) The quality loss per unit area of gold plate under Bi intensification cyanidation was far greater than that of conventional cyanidation. By comparing the cyclic voltammetry curves and Tafel plots, the bismuth ions can not only improve anodic current density, but also dissolve gold at a lower potential, which increases the current corrosion and intensify the anodic dissolution of gold.
(2) Bismuth ions have an obvious effect on the surface structure of gold plate during cyanide dissolution. Bismuth ions caused many loose honeycombs, ravines, pits, and big holes on the gold surface, corroded the gold surface, destroyed its structure, increasing the contact area between gold and cyanide, and ultimately accelerating the gold dissolution.
(3) The XPS shows that the deposition of bismuth on the gold surface was as high as 0.92% under Bi intensification cyanidation, indicating that the intensifying effect was related to the bismuth ions. Bismuth ions were dispersed and deposited on the gold surface to form the boundary lines and points required for the dissolution reaction of insoluble AuCNads.
(4) The FT-IR and Raman show that there was intense information of C≡N in the spectrum of conventional cyanidation, while no or weak information of C≡N in the spectrum of Bi intensification. It means bismuth ions can promote the conversion of insoluble AuCNads into soluble Au(CN ) 2 and prevent the deposition of insolubles, which reduced the formation of passivation film.
(5) The mechanism of anodic strengthening was shown that the insoluble compounds AuCNads were generated constantly deposited on the gold surface, forming a passivation film that hindered the reaction of gold and cyanide. Bismuth ions promoted the conversion of AuCNads to Au(CN ) 2 and obstructed the formation of insoluble compounds, which prevented their deposition on the gold surface and promoted good contact between the gold and cyanide.

Author Contributions

Data curation, Y.Y., M.L., Q.Z. and Q.L.; Funding acquisition, Y.Y. and T.J.; Investigation, M.L., Q.Z. and B.X.; Methodology, Y.Y.; Project administration, Q.Z.; Resources, Q.L.; Writing—Original draft, Q.Z. and Q.L.; Writing—Review & editing, T.J.

Funding

This research was funded by the National Natural Science Foundation of China, grant number 51574284.

Conflicts of Interest

The authors declare no conflict of interest.

References

  1. Hu, C.R.; Yang, F. Review for improvement about the dressing, metallurgy of gold ores. Gold 2000, 21, 29–37. [Google Scholar]
  2. Bas, A.D.; Ghali, E.; Choi, Y. A review on electrochemical dissolution and passivation of gold during cyanidation in presence of sulphides and oxides. Hydrometallurgy 2017, 172, 30–44. [Google Scholar] [CrossRef]
  3. Acar, S. Process development metallurgical studies for gold cyanidation process. Miner. Metall. Proc. 2016, 33, 161–171. [Google Scholar] [CrossRef]
  4. Cathro, K.J.; Koch, D. The anodic dissolution of gold in cyanide solutions. J. Electrochem. Soc. 1964, 111, 1416–1420. [Google Scholar] [CrossRef]
  5. Jiang, T. Chemistry of Extractive Metallurgy of Gold; Xu, W., Ed.; Hunan Science and Technology Press: Changsha, China, 1998; pp. 92–103. ISBN 7-5357-1759-4. [Google Scholar]
  6. Korolev, L.; Altinkaya, P.; Halli, P.; Hannula, P.M.; Yliniemi, K.; Lundstrom, M. Electrochemical recovery of minor concentrations of gold from cyanide-free cupric chloride leaching solutions. J. Clean. Prod. 2018, 186, 840–850. [Google Scholar] [CrossRef] [Green Version]
  7. Nunan, T.O.; Peixoto, G.C.; Ernesto, H. Improvements in gold ore cyanidation by pre-oxidation with hydrogen peroxide. Miner. Eng. 2017, 108, 67–70. [Google Scholar] [CrossRef]
  8. Xu, H.F.; Sun, J.F.; Liao, H.; Li, H.L.; Zi, J.X. The leaching of peroxides in cyanide leaching process. Hydrometallurgy 2003, 22, 133–135. [Google Scholar]
  9. Senanayake, G. A review of effects of silver, lead, sulfide and carbonaceous matter on gold cyanidation and mechanistic interpretation. Hydrometallurgy 2008, 90, 46–73. [Google Scholar] [CrossRef]
  10. Breuer, P.L.; Jeffrey, M.I. Mechanisms of sulfide ion oxidation during cyanidation. Part I: The effect of lead (II) ions. Miner. Eng. 2008, 21, 579–586. [Google Scholar] [CrossRef]
  11. Chimenos, J.M.; Guzman, M.; Hewitt, D.M.; Karagueorguieva, A.; Espiell, F. Kinetics of the reaction of gold cyanidation in the presence of a thallium(I) salt. Hydrometallurgy 1997, 44, 269–286. [Google Scholar] [CrossRef]
  12. Jeffrey, M.I.; Ritchie, I.M. The leaching of gold in cyanide solutions in the presence of impurities II. The effect of silver. J. Electrochem. Soc. 2000, 147, 3272–3276. [Google Scholar] [CrossRef]
  13. Yang, Y.B.; Li, Q.; Li, G.H.; Guo, Y.F.; Huang, Z.C.; Jiang, T. An electrochemical investigation on intensification of gold cyanidation by heavy metal ions. In EPD Congress 2005; Schlesinger, M.E., Ed.; TMS (The Minerals, Metals & Materials Society): Pittsburgh, PA, USA, 2005; pp. 977–984. [Google Scholar]
  14. Lorenzen, L.; Deventer, J.S.J. Electrochemical interactions between gold and its associated minerals during cyanidation. Hydrometallurgy 1992, 30, 177–193. [Google Scholar] [CrossRef]
  15. Yang, Y.B.; Li, Q.; Jiang, T.; Guo, Y.F.; Li, G.H.; Xu, B. Co-intensification of gold leaching with heavy metals and hydrogen peroxide. Trans. Nonferr. Met. Soc. 2010, 20, 903–909. [Google Scholar] [CrossRef]
  16. Jeffery, M.I.; Linda, L.; Breuer, P.L.; Chu, C.K. A kinetic and electrochemical study of the ammonia cyanide process for leaching gold in solutions containing copper. Miner. Eng. 2002, 15, 1173–1180. [Google Scholar] [CrossRef]
  17. Kudryk, V.; Kellogg, H.H. Mechanism and rate controlling factors in the dissolution of gold in cyanide solution. J. Metals 1954, 6, 541–548. [Google Scholar] [CrossRef]
  18. Pan, T.P.; Wan, C.C. Anodic behavior of gold in cyanide solution. J. Appl. Electrochem. 1979, 9, 653–655. [Google Scholar] [CrossRef]
  19. Li, N.H.; Sun, S.G.; Chen, S.P. Studies on the role of oxidation states of the platinum surface in electrocatalytic oxidation of small primary alcohols. J. Electroanal. Chem. 1997, 430, 57–67. [Google Scholar] [CrossRef]
  20. Pan, L.; Zhou, Z.; Chen, D.; Sun, S. Electrochemical and in situ FTIR studies of adsorption and oxidation of dimethyl ether on Platinum electrode. Acta Phys. Chim. Sin. 2008, 24, 1739–1744. [Google Scholar] [CrossRef]
  21. Nicol, M.; Fleming, C.; Paul, R. The chemistry of the extraction of gold. In The Extractive Metallurgy of Gold, 2nd ed.; Stanley, G.G., Ed.; South African Institute of Mining and Metallurgy: Johannesburg, South Africa, 1987; pp. 831–905. [Google Scholar]
  22. Nicol, M.J. Anodic behavior of gold part II-oxidation in alkaline solutions. Gold Bull. 1980, 13, 105–111. [Google Scholar] [CrossRef]
  23. Lee, S.J.; Kwon, H.S.; Kim, J.S. Analysis of microstructure and corrosion behavior of laser surface alloyed zircaloy-4 with niobium. Met. Mater. Int. 2000, 6, 145–149. [Google Scholar] [CrossRef]
  24. Lu, H.; Gao, K.W.; Chu, W.Y. Determination of tensile stress corrosion induced by dezincification layer during corrosion for brass. Corros. Sci. 1998, 40, 1663–1670. [Google Scholar] [CrossRef]
  25. Jeffrey, M.I.; Ritchie, I.M. The leaching of gold in cyanide solutions in the presence of impurities I. The effect of lead. J. Electrochem. Soc. 2000, 147, 3257–3262. [Google Scholar] [CrossRef]
  26. Moulder, J.F.; Chastain, J.; King, R.C.J. Handbook of X-ray photoelectron spectroscopy: A reference book of standard spectra for identification and interpretation of XPS data. Chem. Phys. Lett. 1995, 220, 7–10. [Google Scholar]
  27. Bas, A.D.; Safizadeh, F.; Zhang, W.; Ghali, E.; Choi, Y. Active and passive behaviors of gold in cyanide solutions. Trans. Nonferr. Met. Soc. 2015, 25, 3442–3453. [Google Scholar] [CrossRef]
  28. Goff, A.L.; Artero, V.; Metay, R.; Moggia, F.; Jousselme, B. Immobilization of Fe hydrogenase mimics onto carbon and gold electrodes by controlled aryldiazonium salt reduction: An electrochemical, XPS and ATR-IR study. Int. J. Hydrog. Energy 2010, 35, 10790–10796. [Google Scholar] [CrossRef]
  29. Cao, L.L.; Shi, F.X.; Song, W.J.; Zhu, Y.F. Study of the electromigration behavior of Au-Ag thin films deposited on SiO2 substrate using AES, XPS and AFM techniques. Surf. Interface Anal. 2001, 28, 258–263. [Google Scholar] [CrossRef]
  30. Barroso, B.A.; Alexandre, F.M.; Fernández, G.C.; Gomez, S.V. FT-IR analysis of pyrone and chromene structures in activated carbon. Energy Fuel 2014, 28, 4096–4103. [Google Scholar] [CrossRef]
  31. Geng, W.; Nakajima, T.; Takanashi, H.; Ohki, A. Analysis of carboxyl group in coal and coal aromaticity by Fourier transform infrared (FT-IR) spectrometry. Fuel 2009, 88, 139–144. [Google Scholar] [CrossRef]
  32. Zhong, Q.; Yang, Y.B.; Jiang, T.; Li, Q.; Xu, B. Xylene activation of coal tar pitch binding characteristics for production of metallurgical quality briquettes from coke breeze. Fuel Process. Technol. 2016, 148, 12–18. [Google Scholar] [CrossRef]
  33. Patrick, H.; Jonas, O.; Willian, A. Ligand field strengths of carbon monoxide and cyanide in octahedral coordination. J. Coord. Chem. 2005, 58, 41–45. [Google Scholar] [Green Version]
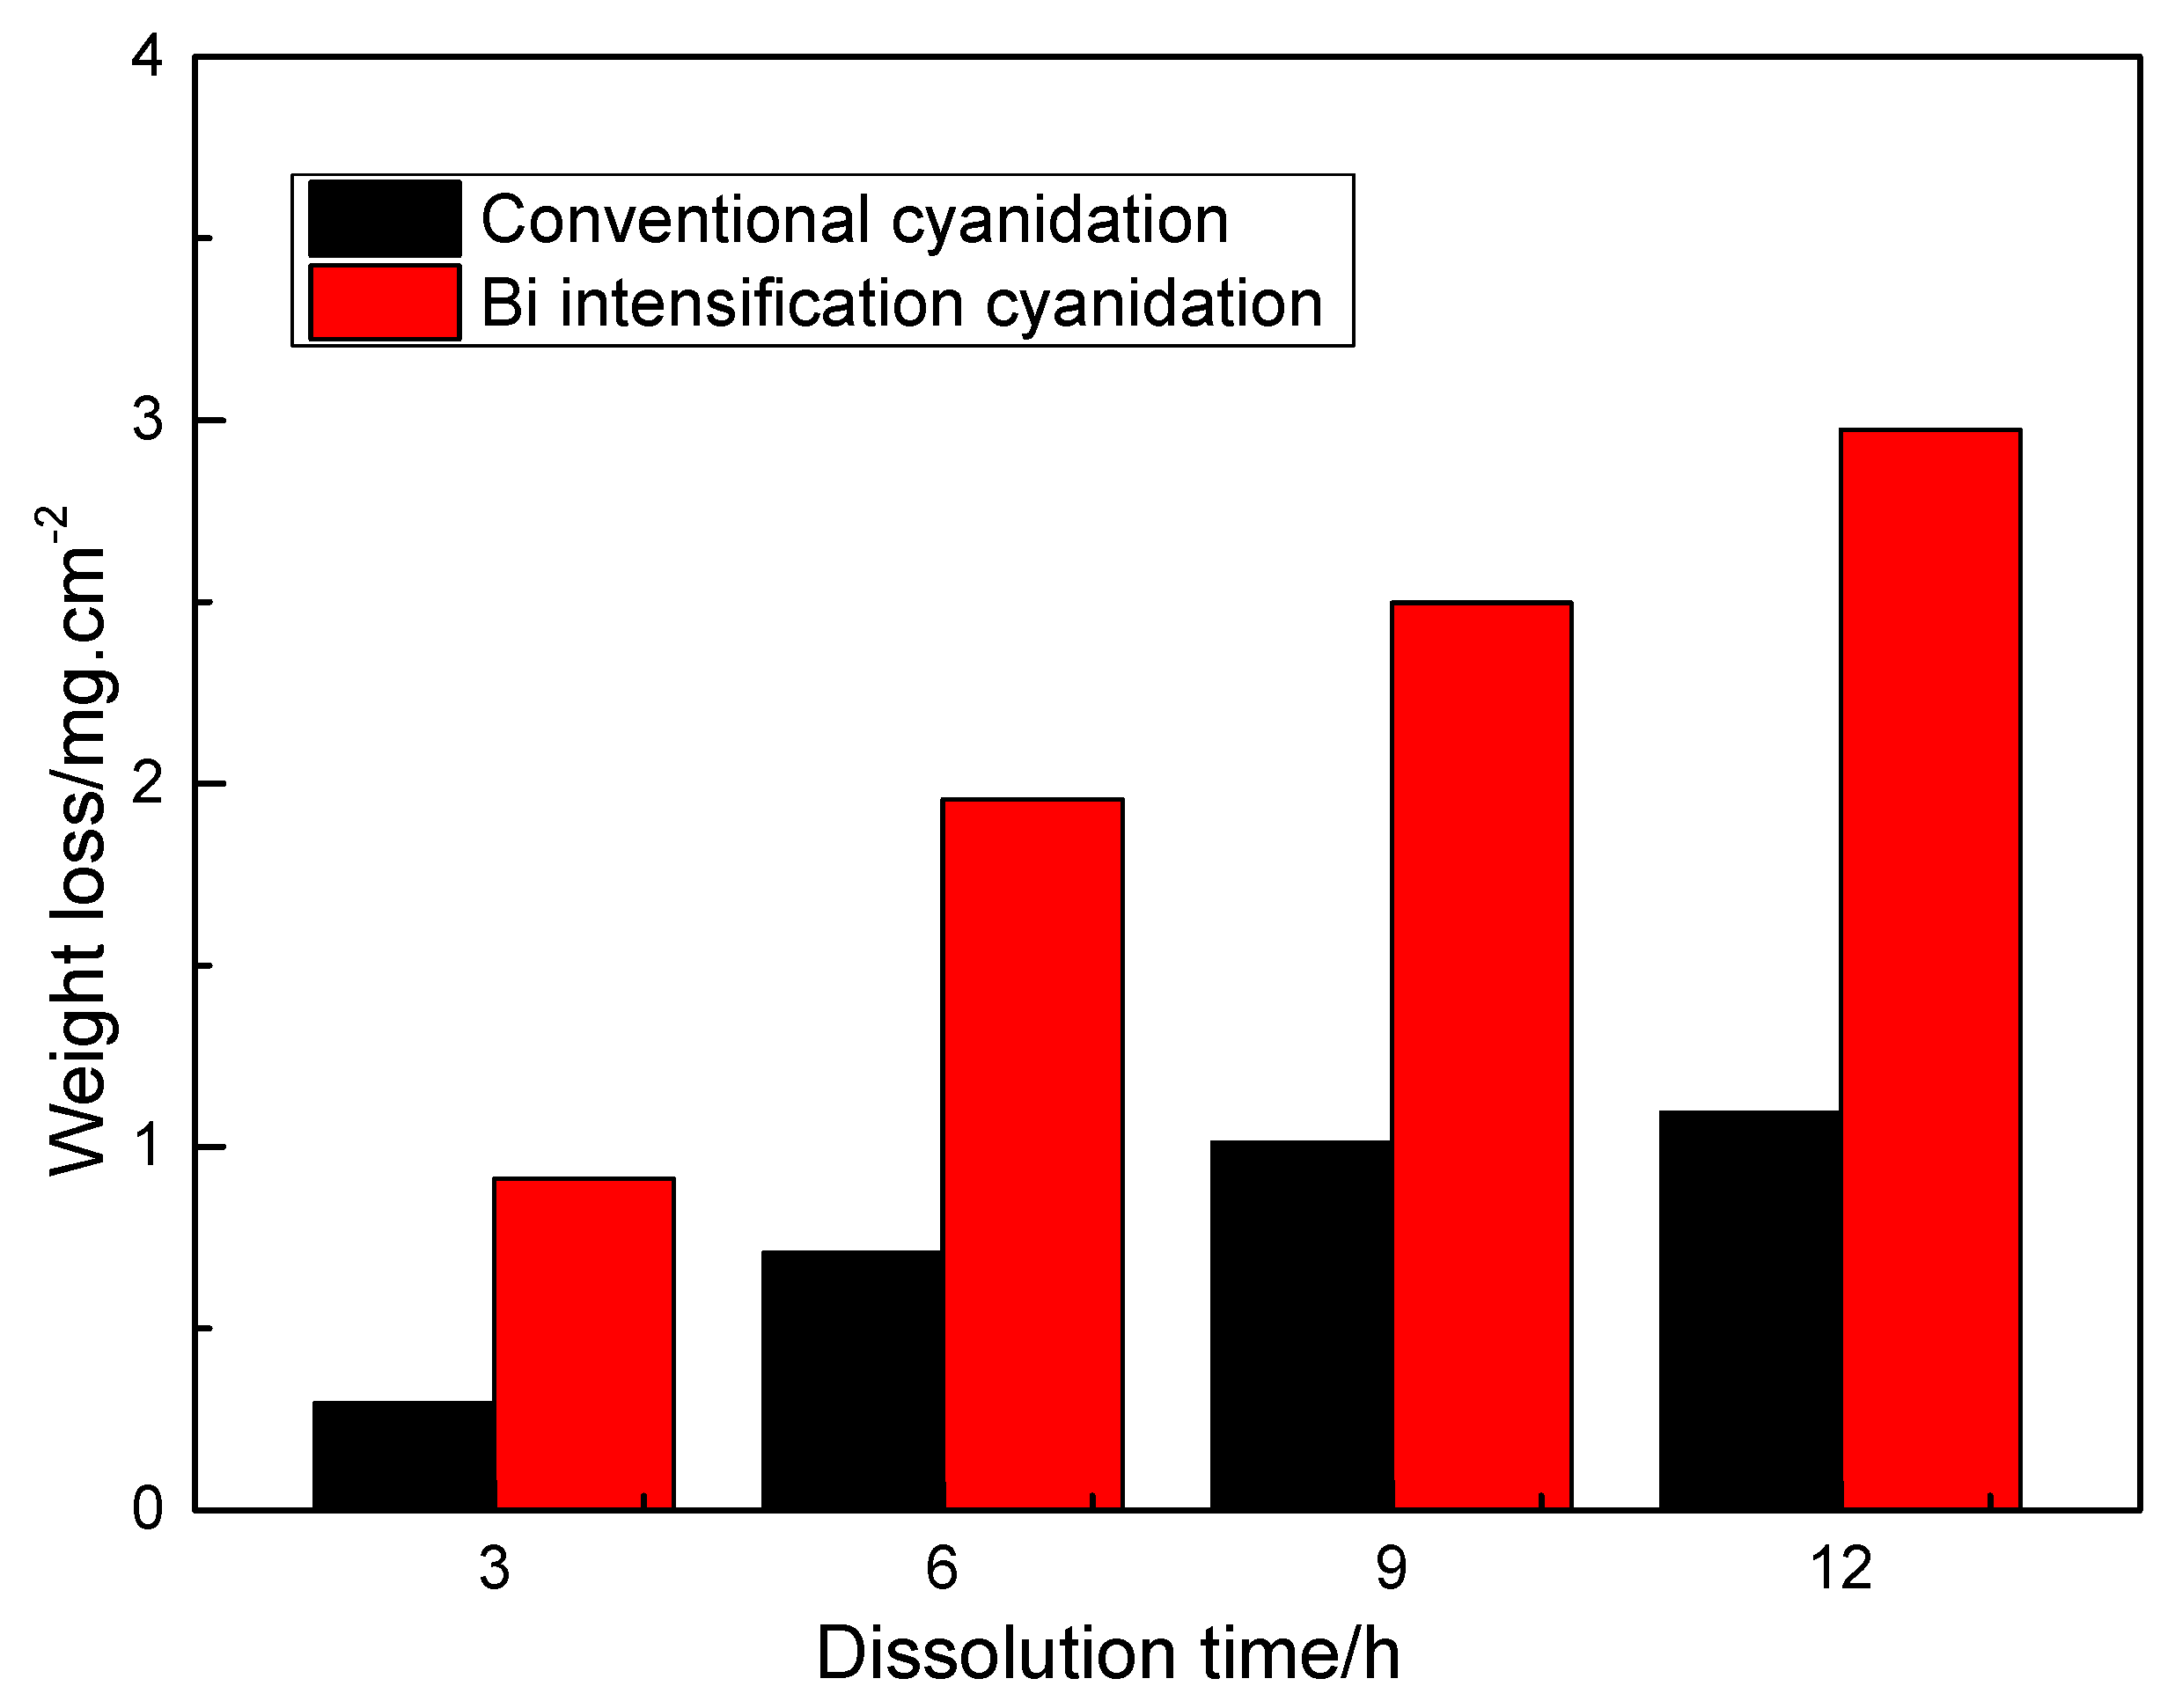
Figure 1. Time course of gold dissolution for conventional and Bi intensification cyanidation.
Metals 09 00362 g001
Figure 2. Cyclic Voltammetry plot of gold electrode in conventional cyanide system.
Metals 09 00362 g002
Figure 3. Cyclic Voltammetry plot of gold electrode in Bi intensification cyanide system.
Metals 09 00362 g003
Figure 4. Tafel curves of gold electrode under conventional and Bi intensification cyanidation.
Metals 09 00362 g004
Figure 5. SEM images of the gold surface before and after gold dissolution (a and c: original gold plate, b: conventional cyanidation, and d: Bi intensification cyanidation).
Metals 09 00362 g005
Figure 6. XPS full spectrum of gold surface products in conventional cyanide system.
Metals 09 00362 g006
Figure 7. XPS full spectrum of gold surface products in Bi intensification cyanide system.
Metals 09 00362 g007
Figure 8. (a) Au4f, (b) C1s, (c) N1s, and (d) O1s XPS spectra of gold under conventional and Bi intensification cyanidation.
Metals 09 00362 g008
Figure 9. Infrared spectra of gold plate under conventional and Bi intensification cyanidation.
Metals 09 00362 g009
Figure 10. Raman spectra of gold plate under conventional and Bi intensification cyanidation.
Metals 09 00362 g010
Table 1. Tafel results of gold electrode in cyanide solution.
Cyanide MethodCorrosion 1Corrosion 2Corrosion 3
E/Vi/(mA/m2)E/Vi/(A/m2)E/Vi/(A/m2)
Convention−0.283.87−0.101.620.385.75
Bi Intensification−0.509.41−0.111.130.433.98
Table 2. Relative concentration of elements on cyanided gold surface products.
Cyanide MethodAuCNOBi
Conventional/%75.7713.575.225.440
Bi Intensification/%61.1920.747.219.940.92
Table 3. FT-IR spectra of the gold plates under different conditions.
Position (cm−1)AssignmentGroup
1250O-HAlcohol compound
1640NO2Nitro compound
2140C≡NCyanide compound
2850, 2920C-HHydrocarbon compound
3350, 3680O-HAlkaline compound