Article

Structural Stress Method to Evaluate Fatigue Properties of Similar and Dissimilar Self-Piercing Riveted Joints

1
CanmetMATERIALS, 183 Longwood Road South, Hamilton, ON L8P 0A5, Canada
2
Ford Research and Innovation Center, Ford Motor Company, Dearborn, MI 48124, USA
*
Author to whom correspondence should be addressed.
Metals 2019, 9(3), 359; https://doi.org/10.3390/met9030359
Submission received: 31 January 2019 / Revised: 13 March 2019 / Accepted: 14 March 2019 / Published: 20 March 2019

Abstract

:
In this paper, we discuss the application of a simple Battelle structural stress model to evaluate the fatigue life of a self-piercing riveted (SPR) carbon-fiber-reinforced polymer (CFRP) composite to aluminum AA6111. The analytical model accounts for the forces and moments acting on the rivets to determine the structural stresses which were then plotted against the laboratory-generated fatigue life data. The master S-N curve determined in this study thus accounts for various factors such as the stacking configuration, rivet head height, and fatigue load ratios. The analytical model used in this study was able to collapse a large number of fatigue life data into one master S-N curve irrespective of stack-ups, rivet head height, and load ratios. Thus, the master S-N curve derived from the model can be used to predict the fatigue life of the SPR joints.

1. Introduction

Self-piercing rivet (SPR) has emerged as an economical and effective technique to join dissimilar and similar materials alike [1,2,3]. This could potentially play a crucial role in introducing light aluminum alloys and fiber-reinforced polymers as an attractive alternative to lightweight steels due to their potential to achieve a high strength- and stiffness-to-density ratio [4]. In particular, carbon-fiber-reinforced polymer (CFRP) composites are advantageous due to their high strength and stiffness. The introduction of CFRP in an automotive body structure can also result in weight savings of up to 10% greater than the use of aluminum and other lightweight metals and up to 50% savings when compared to steel [4,5]. Numerous studies have explored the feasibility of using SPR to join CFRP to aluminum alloys [6,7,8,9,10,11,12,13]. These studies have investigated the quality of the joint affected by die geometry [10], in-plane distance between the rivets [13], and oil pressure in a hydraulic system [11,12]. In addition to studying the joint quality solely based on the quasi-static testing, evaluating the fatigue life of weld and mechanical joints is a crucial exercise for the automotive industry in the early stages of vehicle development. However, while numerous studies have been performed on the fatigue characterization of SPR joints between similar materials (e.g., aluminum to aluminum), the fatigue characterization studies of CFRP to aluminum SPR joints are very limited [6,14,15,16].
In addition to laboratory-generated coupon-level fatigue data, durability analysts and design engineers use a number of different parameters to estimate the fatigue performance of the joint [17]. Previously, researchers have proposed several damage parameters to successfully evaluate the fatigue life of resistance spot welds (RSW). Lin et al. [18] developed a closed-form structural stress and stress intensity factors solution for spot welds. In addition, there are several mesh-insensitive approaches which employs the use of determining the forces and moments acting on the weld using a less complex finite element model of the weld [19,20,21,22,23]. These forces and moments obtained from the finite element analysis are then used as inputs to a fatigue damage parameter to estimate the fatigue life of the weld. The calculated structural stresses at the individual weld are then plotted against the fatigue life data obtained from the laboratory test to develop a master S-N curve. The main advantage of using such structural stress concepts are the reduced computational times, improved life prediction, and use of less detailed finite element model [17]. However, most of the structural stress concepts were primarily developed for spot welds and not particularly for SPR joints. Cox et al. [24] was one of the early researchers to develop the Battelle structure stress model based on the structural stress concept to evaluate the fatigue life in SPR joints. The procedure employed was primarily based on the methods used by Hong [25] for spot welds. Since the fatigue failure mode in SPR joints are predominantly due to sheet failure [6,15,26,27,28,29,30], which is similar to failure modes observed in spot welds, it is reasonable to apply the above methods for SPR joints. In our previous studies on dissimilar SPR joints [15,16], we have presented a single master S-N curve for lap-shear and cross-tension SPR joints using Rupp’s structural stress method. The master S-N curves presented were only for the SPR joints that were fatigue-tested at load ratio R = 0.1 and was not verified for other load ratios. Hence, in this study, we have employed the Battelle structural stress method to evaluate the fatigue life and develop a master S-N curve for the SPR joints between dissimilar and similar material stacks in lap-shear configurations which were tested at load ratios R = 0.1 and R = 0.5.

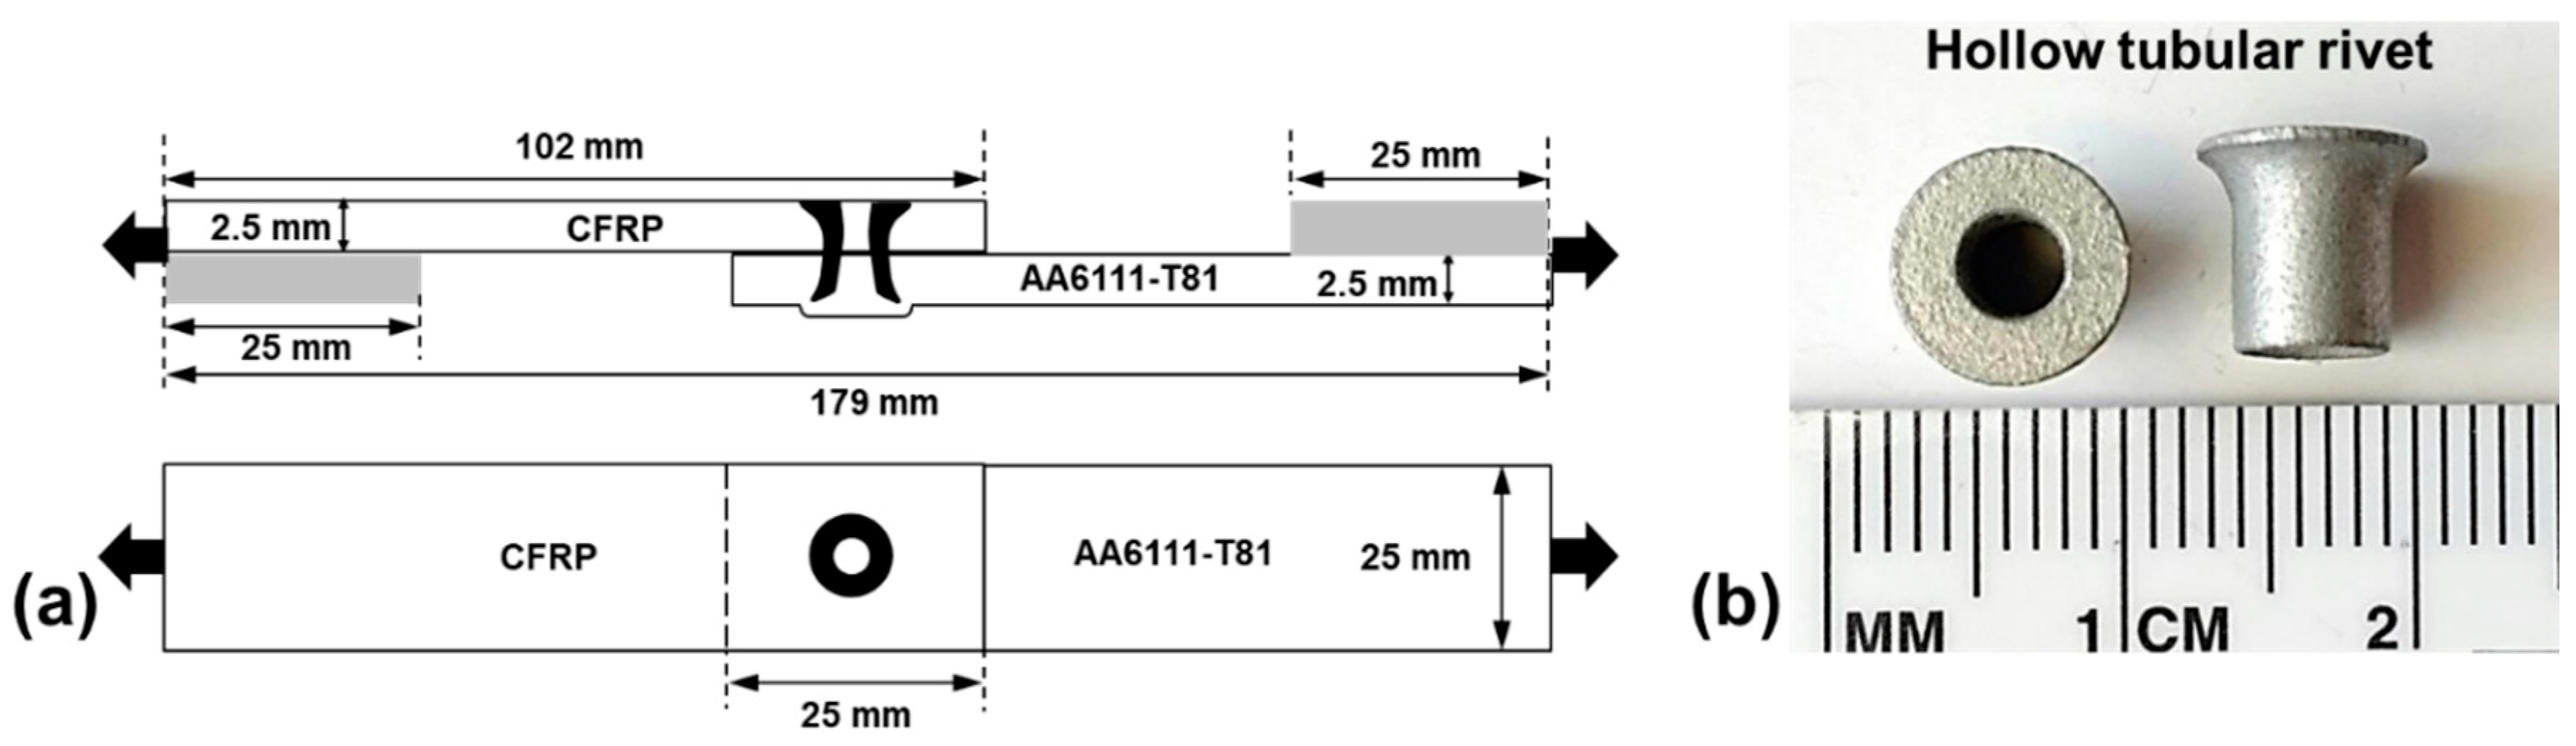
2. Materials and Methods

Mixed material lap-shear SPR joints were fabricated from one 2.5 mm thick continuous braided fiber CFRP laminate (top sheet) and one 2.5 mm thick aluminum AA6111 coupon (bottom sheet). Additional lap-shear SPR joints were created from two similar sheets of 2.5 mm thick AA6111 coupons. Schematics illustrating the geometric configuration of the representative lap-shear SPR joint is presented in Figure 1a.
CFRP coupons with dimensions of 25 mm × 100 mm were cut from compression-molded plaques with dimensions of approximately 300 mm × 300 mm using a wet diamond saw. The CFRP plaques comprised a three-layer braided fabric (0°/±60°), and coupons were cut such that the axial fiber orientation was always transverse to the longest coupon dimension. The Young’s modulus of the CFRP laminate is approximately 60 and 30 GPa in the longitudinal and transverse directions, respectively. Aluminum coupons with dimensions of 25 mm × 100 mm were sheared from large blanks with the rolling direction parallel to the longest coupon dimension. All joints were created with the AA6111 in the T4 (un-aged) condition. A hollow tubular-style rivet as shown in Figure 1b was installed at the locations specified on the respective samples using a servo-driven Henrob SPR gun (Henrob Corporation, New Hudson, MI, USA). The rivet insertion depth was controlled via adjustment of the punch velocity. The velocity was tuned in 5 mm/s increments to deliver the desired rivet head height (or flushness). Lap-shear riveted joints were produced with a flush rivet head height (FHH; no head protrusion) and a proud rivet head height (PHH) 0.30 mm above the surface in the mixed material and similar material stacks. Figure 2 shows the cross-section of representative lap-shear SPR joints in mixed material and similar material stacks produced under different rivet head heights. Figure 2a is CFRP to AA6111 (PHH), Figure 2b CFRP to AA6111 (FHH), Figure 2c AA6111 to AA6111 (PHH), and Figure 2d is AA6111 to AA6111 (FHH). The rivet head height of individual SPR joints were measured after insertion using a handheld digital indicator with a collar fixture, and the average values are presented in Table 1. After rivet installation, the joined samples were subjected to a heat treatment at 180 °C for 30 min to simulate an automotive paint shop process.
The quasi-static lap-shear failure load of the SPR joints was performed on an Instron electromechanical test frame at a cross-head speed of 2 mm/min. Load-controlled fatigue tests were performed on servo-hydraulic test frame at a frequency of 20 Hz for all lap-shear CFRP-to-aluminum SPR joints and 40 Hz for aluminum-to-aluminum lap-shear SPR joints. The fatigue tests were performed at load ratios R = 0.1 and R = 0.5, and a minimum of three specimens were tested at each selected load levels. Tests were discontinued at five million cycles, except for aluminum-to-aluminum lap-shear SPR joints, which were tested up to ten million cycles. Doublers with a thickness of 2.5 mm were used during the fatigue test to maintain the alignment of the specimen.

3. Results and Discussion

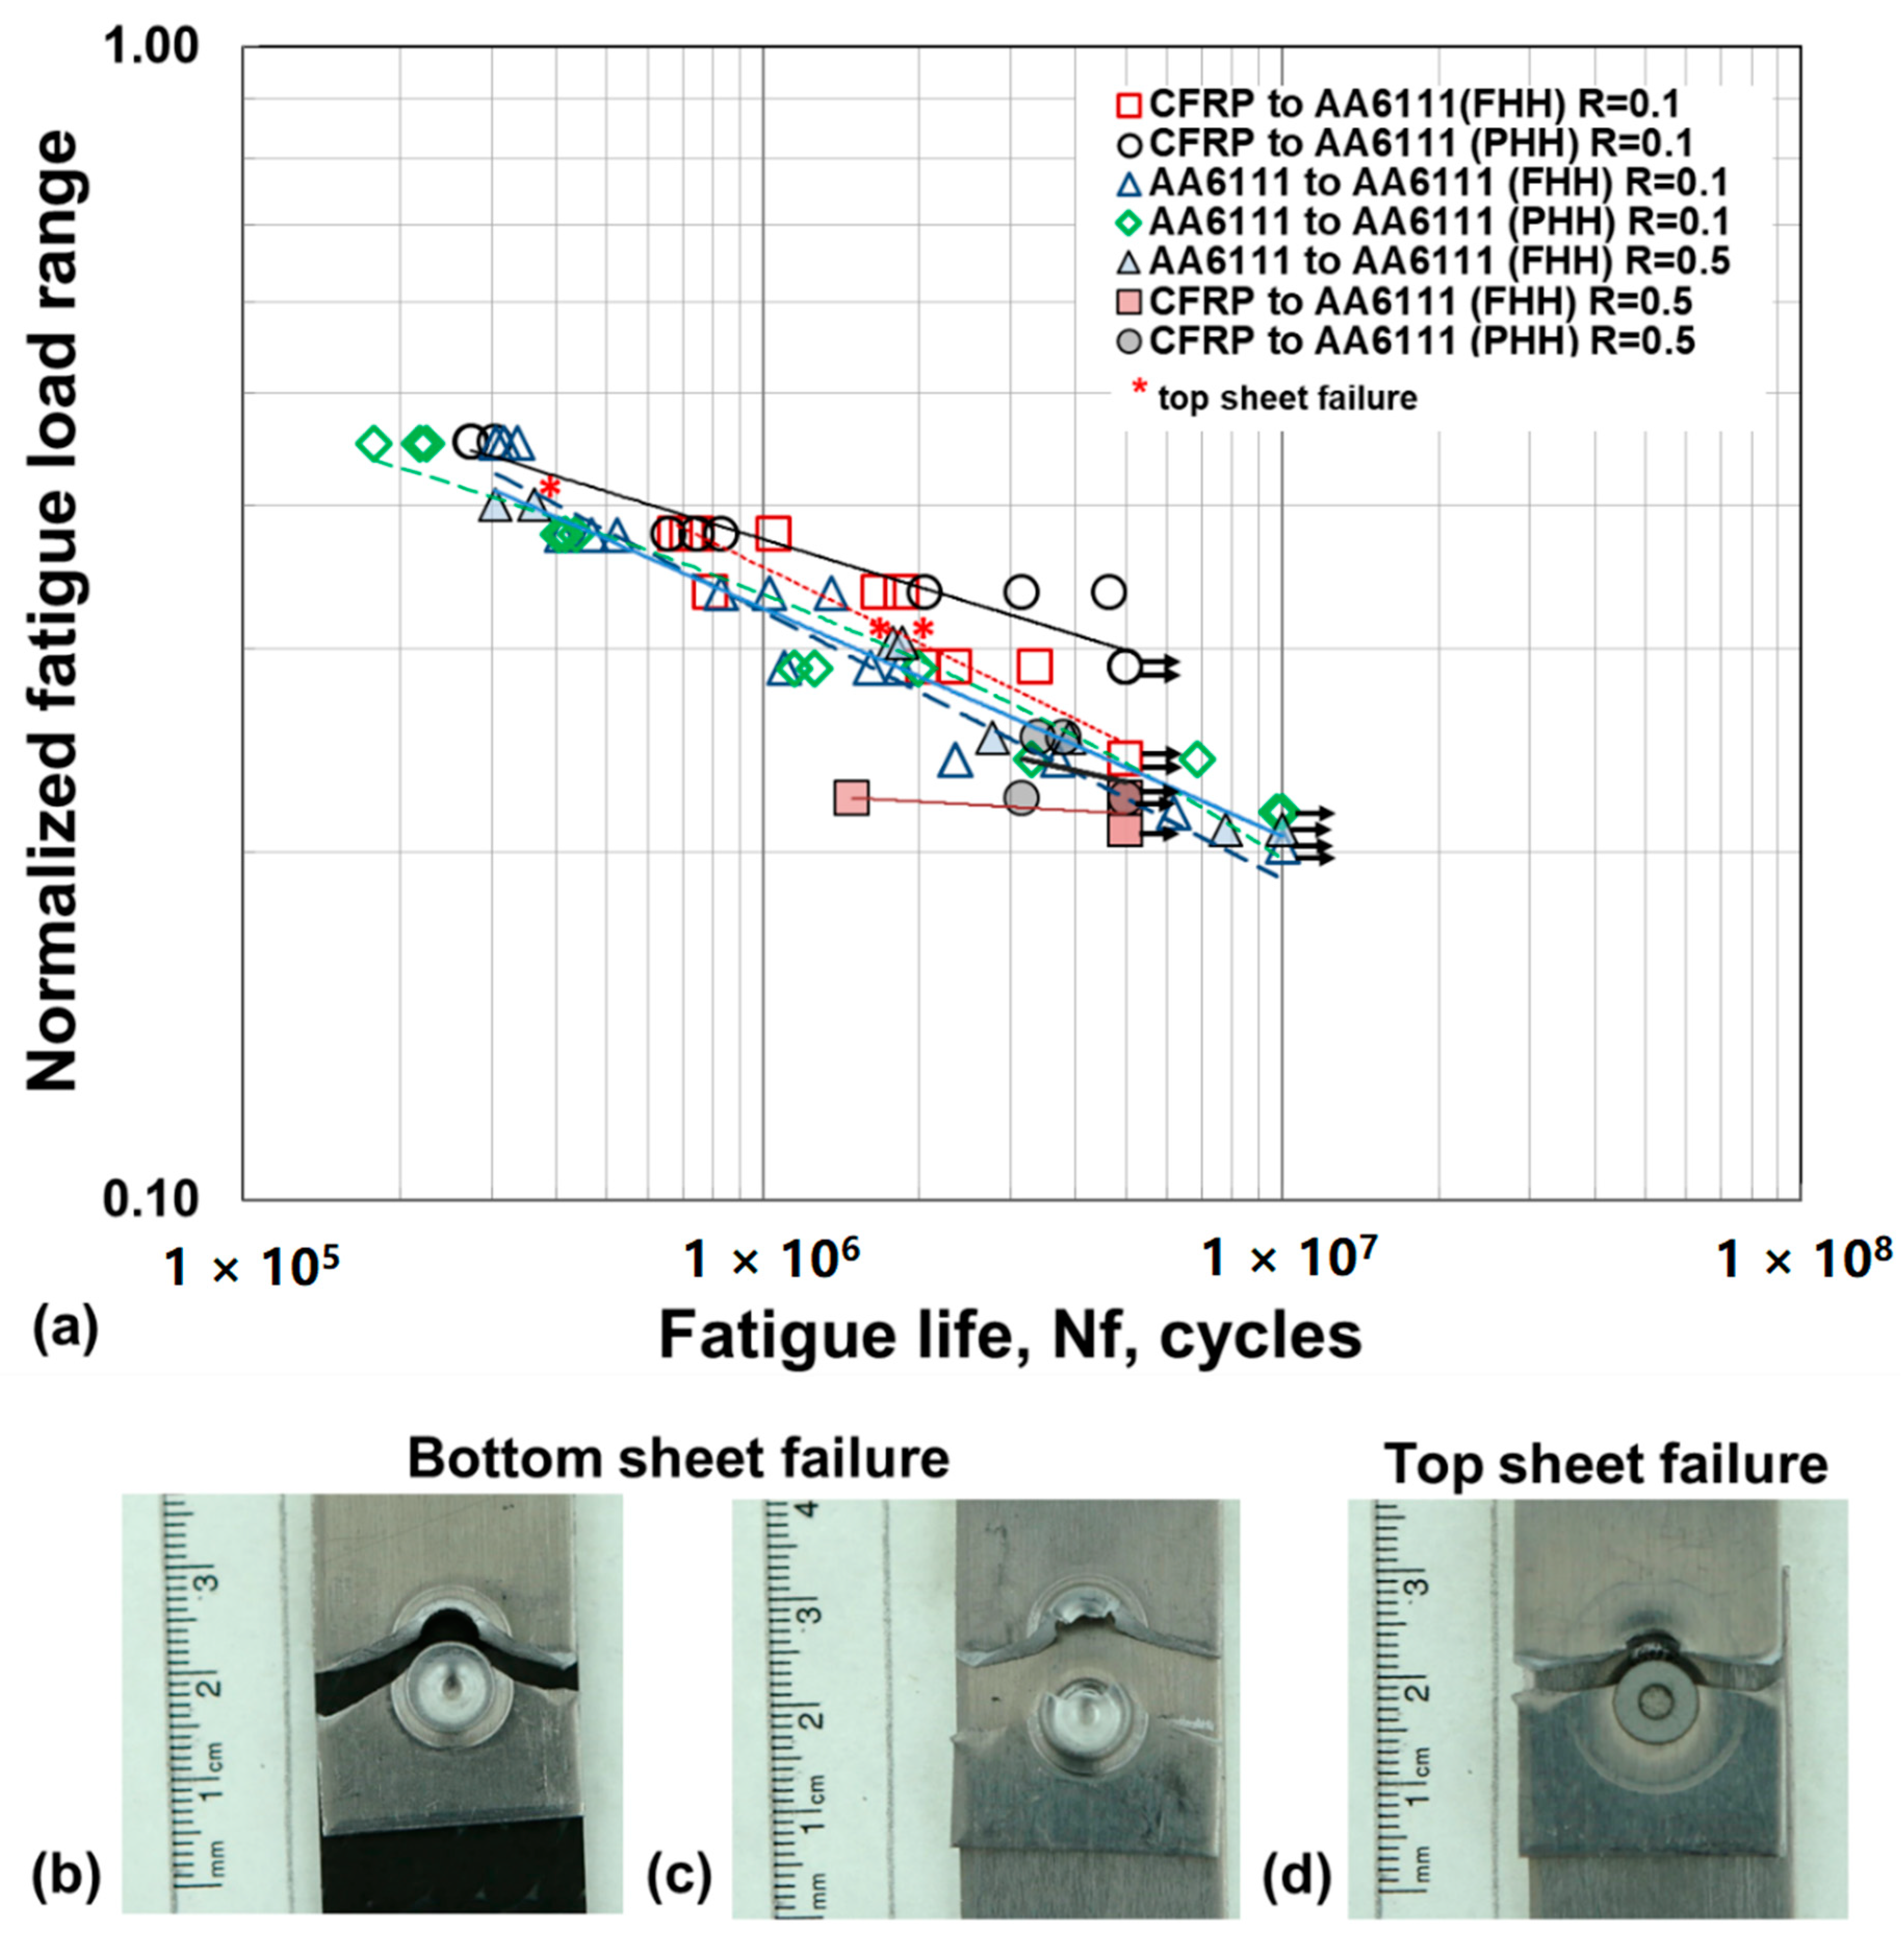
3.1. Quasi-Static and Fatigue Test

Since detailed quasi-static tensile test results and analysis of the lap-shear SPR joints have already been presented in our previous work [16], it will not be discussed here. Overall, the aluminum-to-aluminum SPR joints produced with FHH exhibited the highest overall lap-shear failure load, and the CFRP-to-aluminum produced with FHH exhibited the lowest overall lap-shear failure load. The fatigue test results of similar and dissimilar lap-shear specimens tested at R = 0.1 and R = 0.5 are normalized to the highest average lap-shear failure load (aluminum-to-aluminum FHH) observed in this study and are plotted in Figure 3a. In lap-shear joints tested at load ratio R = 0.1 and at a maximum normalized fatigue load range below 0.40, joints produced in CFRP-to-aluminum with a PHH exhibited longer fatigue life compared to those produced with FHH. Irrespective of rivet heights, CFRP-to-aluminum SPR joints have better fatigue lives than joints produced in similar sheets of aluminum. However, when the maximum normalized fatigue load range exceeds 0.40, the fatigue lives of all specimens appear to converge. Between the aluminum-to-aluminum SPR joints produced with FHH and PHH, there was no major difference in fatigue life. In the lap-shear SPR joints that were tested at load ratio R = 0.5, there was no major difference in fatigue life compared to similar and dissimilar stacking.
Irrespective of the rivet head height and load ratios, the CFRP-to-aluminum SPR joints failed due to crack growth in the bottom aluminum sheet around the rivet shank as shown in Figure 3b. While the majority of the aluminum-to-aluminum SPR joints failed due crack growth in the bottom aluminum sheet (similar to CFRP-to-aluminum) as observed in Figure 3c, failure due to crack growth in the top aluminum sheet around the rivet head was also observed in a few SPR joints (Figure 3d). The lap-shear SPR joints that failed in the top aluminum sheet is indicated with a * in Figure 3a. Since a detailed failure analysis of the fractured specimens has already been presented before [16], it will not be discussed here for the purpose of brevity.

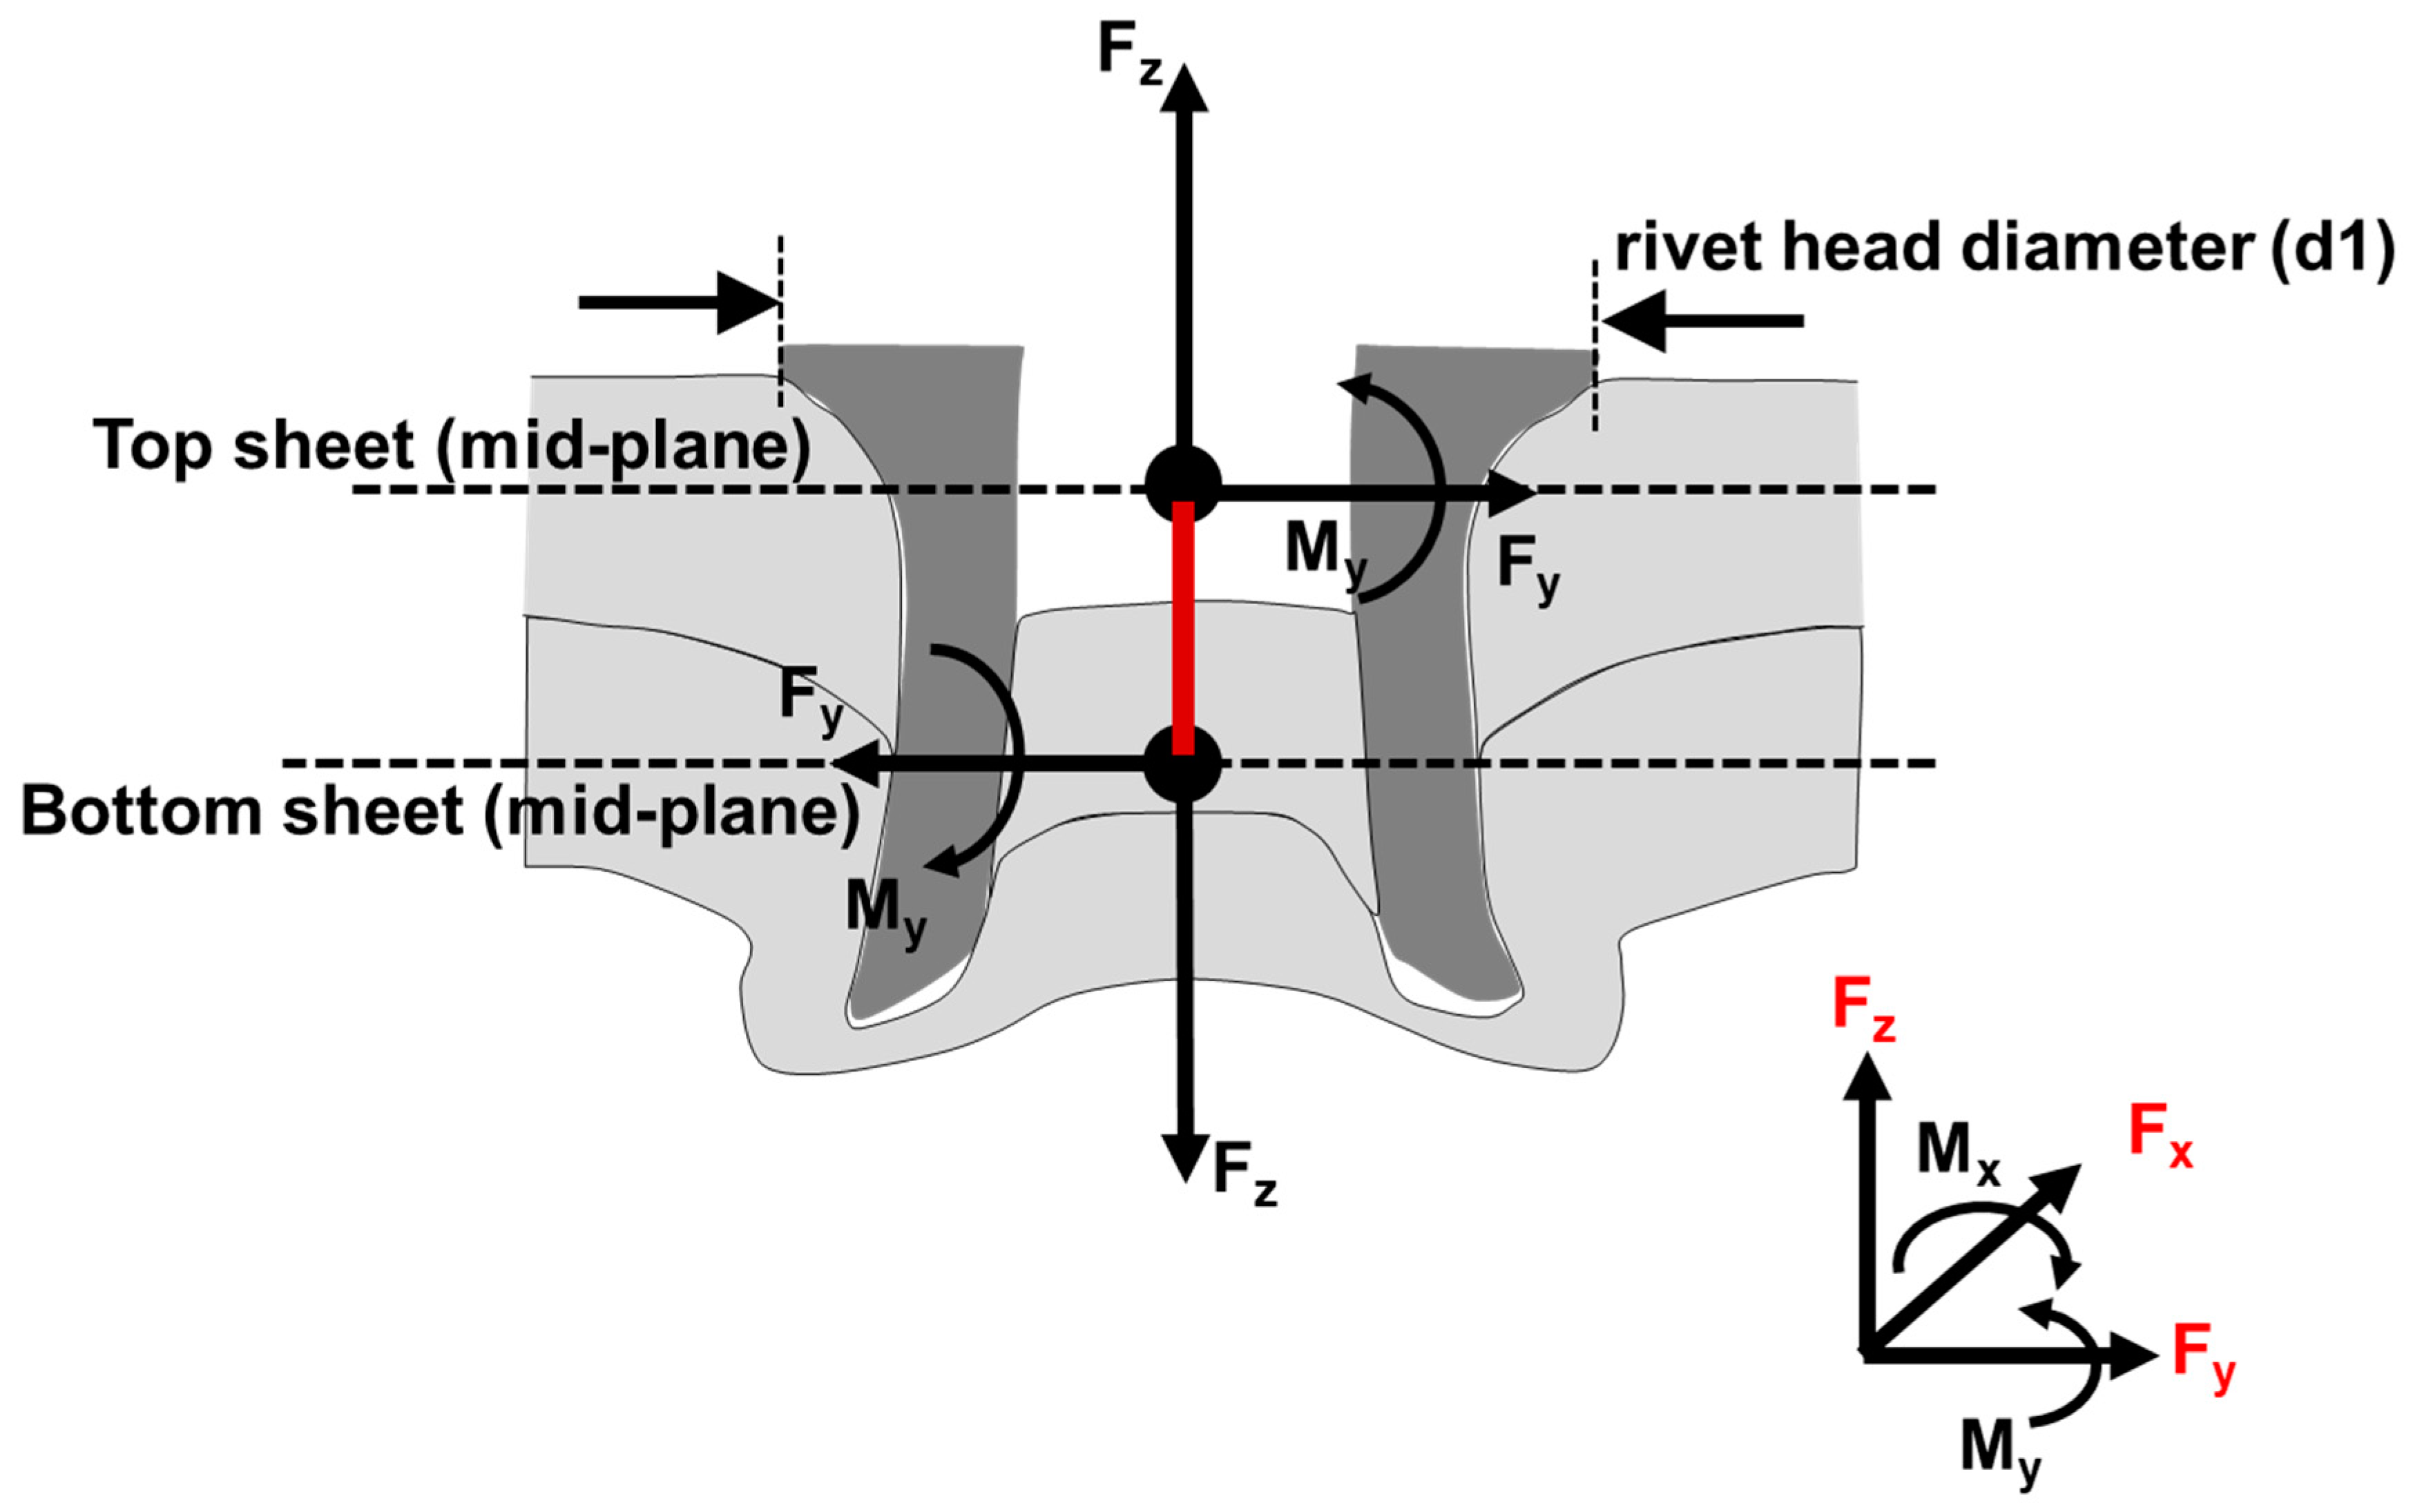
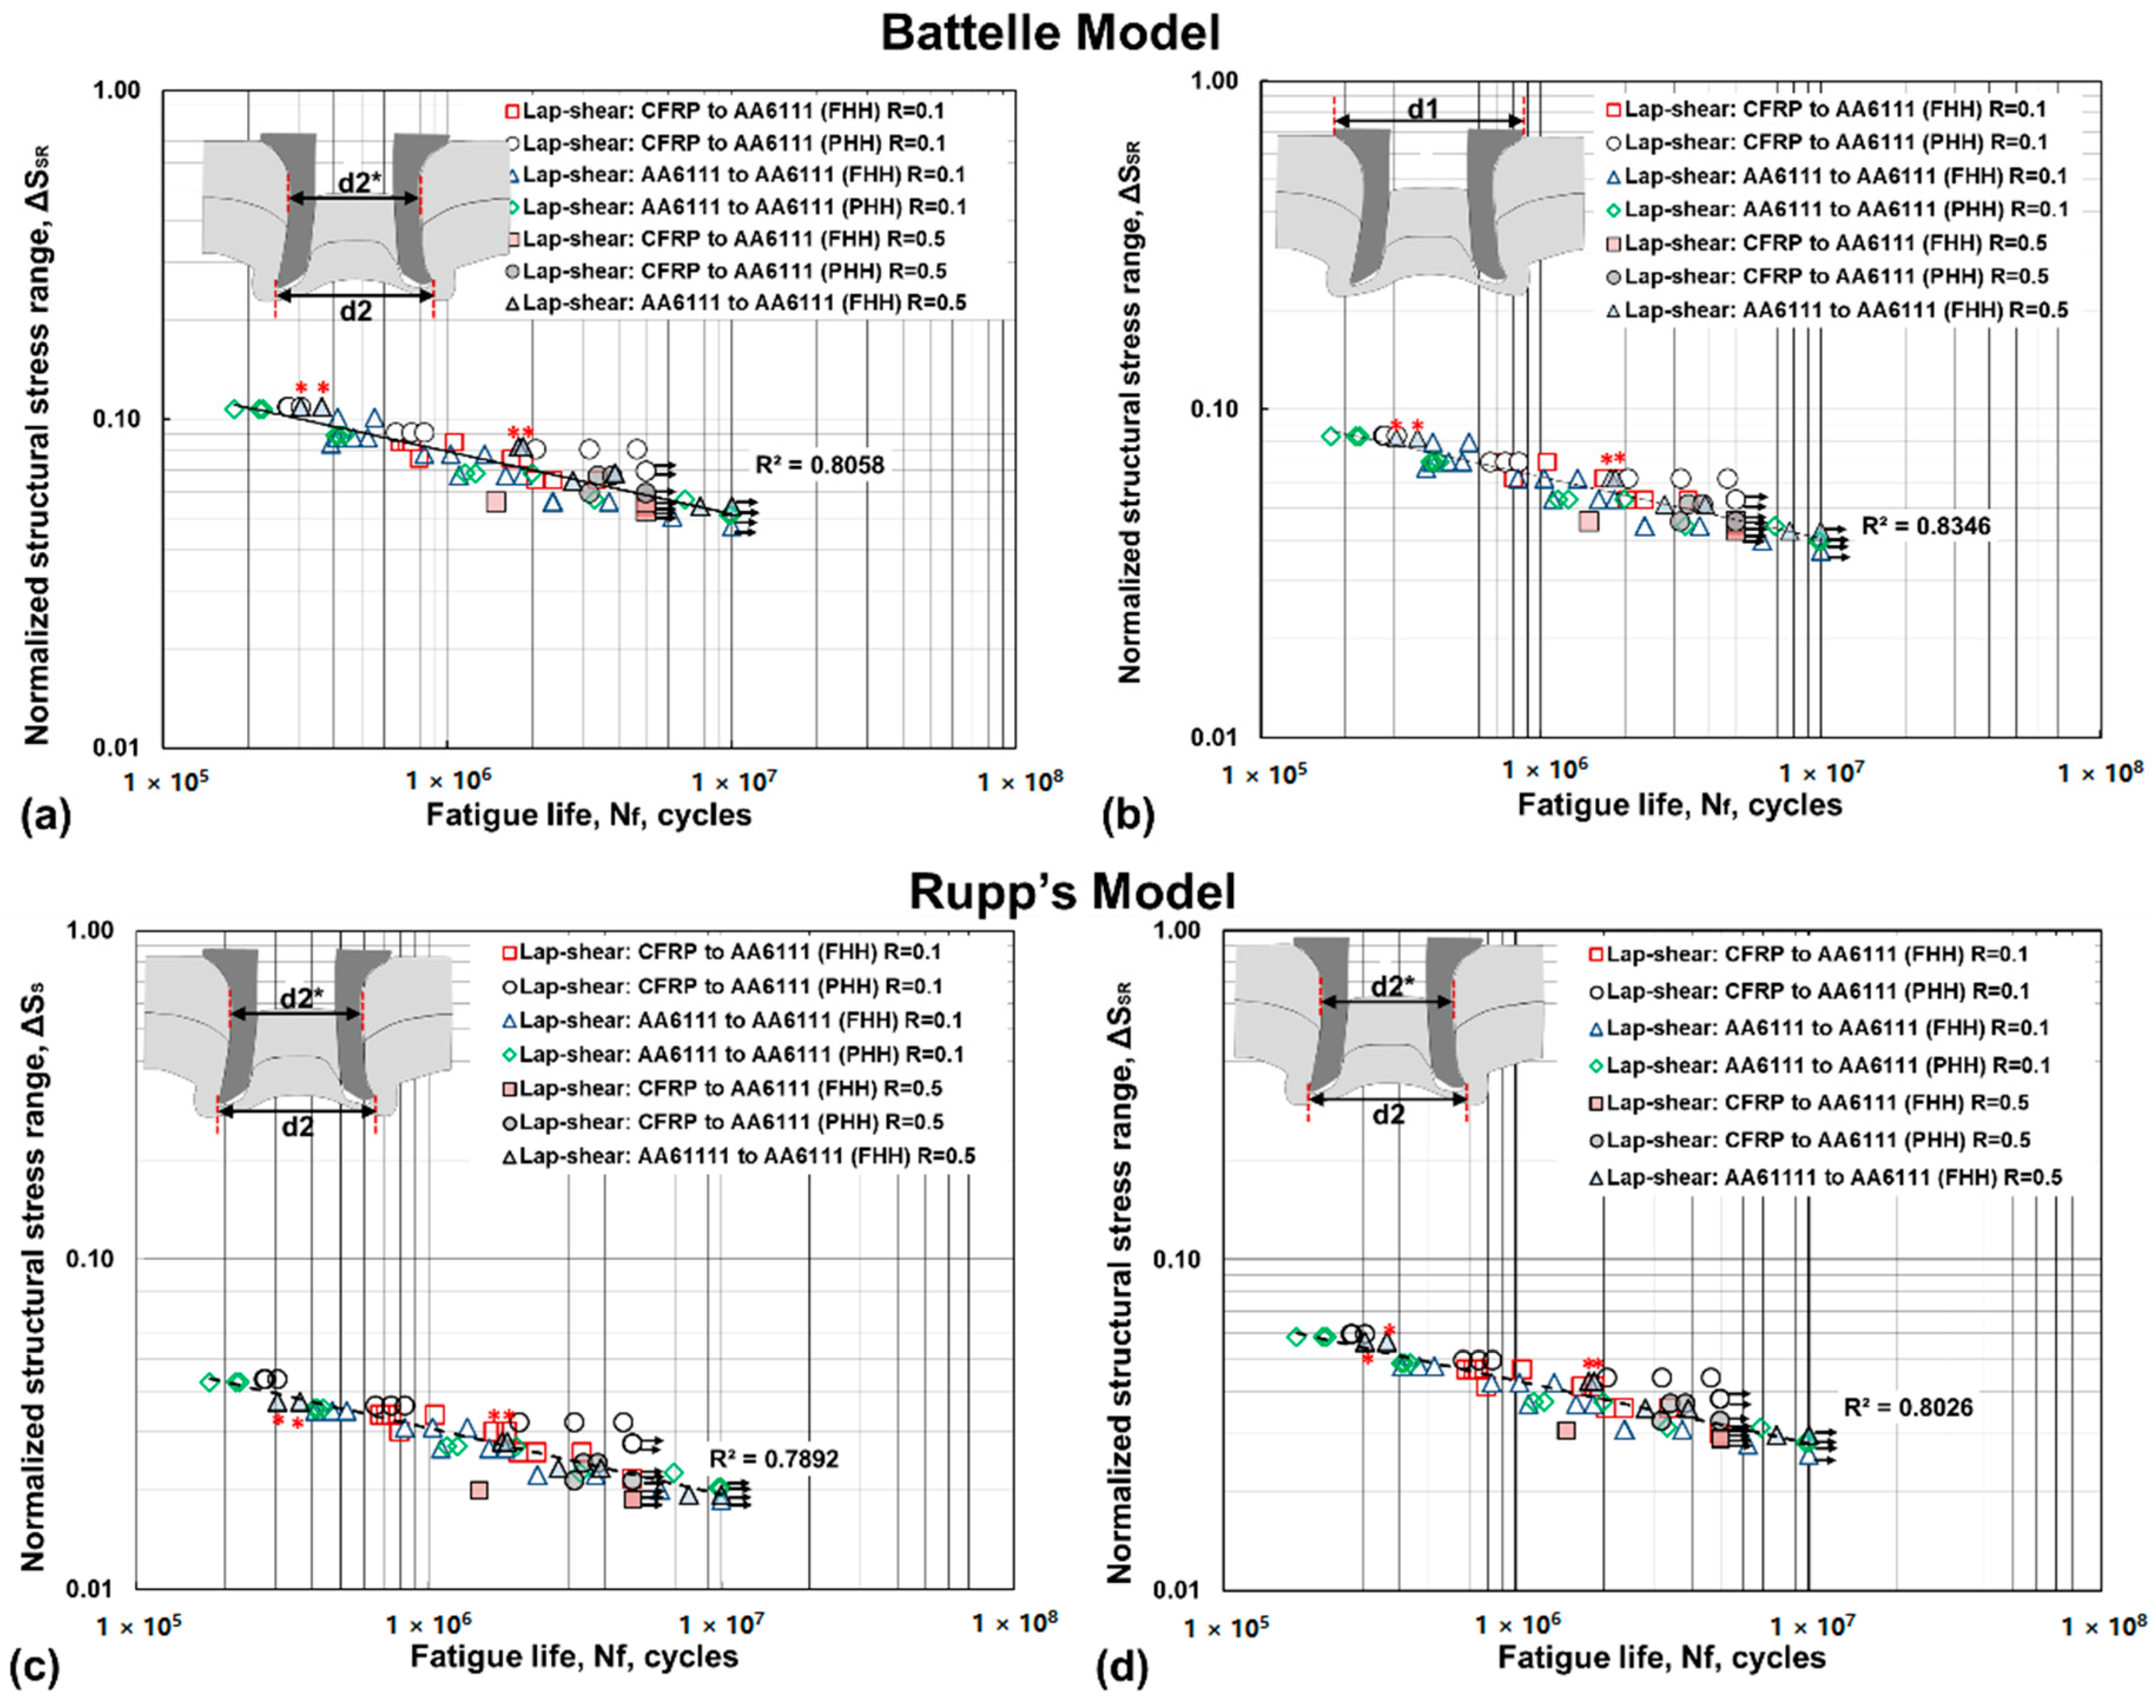
3.2. Battelle Structural Stress Method

Cox and Hong simplified the Battelle structural stress method for spot welds and applied it for the SPR joints [24]. In this approach, the rivet is represented by a beam element which is assumed to have a circular cross section and a diameter equal to head diameter of the SPR. This beam element connects the sheets modeled as a coarse mesh of shell elements. The membrane and bending stress are calculated for the normal, transverse shear and in-plane shear components in the surrounding plate. Figure 4 shows the simplified rivet geometry used to calculate the structural stress using a rigid core model for plate structural stresses. By combining the maximum bearing stress in sheet with the maximum bending stress at the edge of the rivet, the maximum normal stress is determined as presented in Equation (1).
𝜎m,max = 2F/πdt
where F = √(F2x + F2y), d is the rivet head diameter, and t is the thickness of the single sheet. The maximum bending stress contribution to the normal stress due to applied bending moment is determined using Equation (2):
𝜎b,max = 6M/πdt2
where M = √(M2x + M2y). Similarly, the maximum bending stress contribution due to a force perpendicular to the plate is calculated using Equation (3):
𝜎b F,max = 1.744(Fz/t2)
The structural stress is calculated by combining Equations (1)–(3):
σs = σm + σb = 2F/πdt + 6M/πdt2 + 1.744(Fz/t2)
To consider the effect of load ratio, R, the equivalent effective structural stress range is then calculated using Equation (5).
Δ S S R =   Δ σ s R ( t *   2 m 2 m ) ( I ( r ) 1 m )
where R = (1 − R*)1/m, R* = load ratio, t* = t/tref, and t = 2.5 mm (thickness of bottom aluminum sheet), tref = 1 mm, m = 5.6 an arbitrary number, and I(r)1/m is a fitted dimensionless function of bending ratio r = ( Δ σ b ,   m a x Δ σ m ,   m a x + Δ σ b ,   m a x ) [31].
As there were no interfacial failures of the SPR joints, the transverse shear structural stress and in-plane shear structural stress are neglected in this study.
As discussed previously, the lap-shear riveted joints in the current study were produced with different material stacking configurations and rivet head heights. Since the laboratory test indicates the fatigue performance of lap-shear SPR joints, especially in CFRP-to-aluminum, are influenced by the rivet head height, it is essential to incorporate the same in the structural stress model. The Battelle structural stress model uses the rivet head diameter (d1) as one of the critical geometrical inputs to calculate the structural stresses. In actual application, the rivet head diameter may not be the crucial damage control parameter as observed in this present study; rather, the diameter of the rivet at its toe after flaring controls the fatigue life [16]. The diameter of the flared rivet or rivet toe diameter is directly influenced by the rivet head height or the amount of rivet head piercing. Therefore, the modified Battelle model in this study incorporates the diameter of the rivet toe from where the fatigue cracks initiated as the crucial geometric input or damage parameter for calculation. That is the diameter of the rivet toe after flaring (d2) for lap-shear SPR joints that fractured in the bottom aluminum sheet and rivet diameter (d2*) for those lap-shear SPR joints that fractured in the top sheet. Figure 5a is the structural stress plot generated using the rivet diameter at the crack initiation site (d2 and d2*), and Figure 5b is the structural stress plot generated using the rivet head diameter (d1) as suggested in the original Battelle model. Between the two plots, the single master S-N curve generated using the rivet head diameter (d1) generated a slightly improved curve compared to the S-N curve generated using the rivet diameter (d2 and d2*) at the fatigue crack initiation site. For comparison with other well-established structural stress models, master S-N curves were also generated using Rupp’s structural stress method. For brevity, the equations and methods to develop master S-N curve using Rupp’s model will not discussed here and can referred in our previous published article [20]. The master S-N curve obtained using the original Rupp’s structural stress method is presented in Figure 5c using the diameters d2 and d2*. It is important to note that the original Rupp’s method does not consider the load ratio into effect unlike the original Battelle method. Therefore, the Rupp’s method was modified and Equation (5) was incorporated to include the load ratio into consideration, and the master S-N curve thus developed is presented in Figure 5d.
The master S-N curves developed using Battelle method does well by not differentiating the specimens which fractured in the top aluminum sheet and bottom aluminum sheet and collapses the spectrum of fatigue data into one single master curve irrespective of the rivet diameter that is considered. This may be due to the small difference in diameter between d2 and d2* (< 0.5 mm). The master S-N curve developed using the rivet head diameter (d1) is slightly better compared to the master S-N curve developed using the flared rivet diameter (d2 and d2*). The difference is not substantial and is due to the fact that the diameter of the flared rivet is only 6% larger at the lowest flared diameter measured and 12 % larger at the highest flared diameter measured. Additionally, the Battelle method also does not differentiate the material stack up and successfully collapses all the fatigue data into one single master S-N curve. This is because, irrespective of the material stack configuration and load ratio, the majority of the lap-shear riveted joints fractured in the bottom aluminum sheet close to the flared rivet toe. The difference in d2 between the lowest flared rivet diameter to largest flared rivet diameter is only 0.4 mm.
Compared to the master S-N curve developed using Rupp’s method (Figure 5c) without considering the load ratio, the Battelle method provides slightly better correlation considering the load ratio. On further modifying the Rupp’s method to include the load ratio, the master S-N curve (Figure 5d) obtained is comparable to the master curve obtained using the Battelle method. Overall, in the Battelle method, the structural stresses are higher when the flared rivet diameter is considered compared to the rivet head diameter as observed in Figure 5a,b. Although given that the rivet head diameter is more convenient, considering the flared rivet head diameter or the diameter of the rivet at the point of fatigue crack initiation may provide better stress levels in the lap-shear SPR joints. Similarly, the structural stresses in Rupp’s method is higher when the load ratio effect is considered, as observed in Figure 5c,d, and indicates a better state of stress levels in the riveted joints. Finally, the simplified Battelle and Rupp’s structural stress methods both provide a simplified approach to predicting the fatigue life of the lap-shear SPR joints in variable material stack configurations produced with different rivet head heights and tested at different load ratios.

4. Conclusions

A simplified structural stress method developed previously for RSW joints were used in this study to develop a master S-N curve to predict fatigue life in SPR joints tested at various load ratios. The following conclusions are drawn:
  • The simplified Battelle structural stress method and Rupp’s structural stress methods are both useful tools for predicting the fatigue life in lap-shear SPR joints.
  • Both methods are able to collapse a large set of laboratory-generated fatigue data into one single S-N curve without much difference between them.
  • The original Battelle structural stress method incorporates the load ratio effect in the model while the original Rupp’s method needs a modification in order to include the load ratio effect. The modified Rupp’s method provides a slightly better correlation compared to the original Rupp’s method and is comparable to the master S-N curve obtained using the Battelle method.
  • Between the original and modified Battelle method, not much of a difference in correlation was observed. This is predominantly due to very small variations between the rivet head diameter (d1) and flared rivet diameter (d2, d2*).

Author Contributions

Methodology, J.K., H.M.R., G.H., K.A.; investigation, H.M.R., J.K., G.H., K.A.; resources, J.K., K.A.; writing—original draft preparation, H.M.R.; writing—review and editing, J.K., G.H., K.A.; supervision, J.K., K.A.; project administration, J.K., K.A.; funding acquisition, J.K., K.A.

Funding

This research was funded by Ford Motor Company, Dearborn, MI, USA.

Acknowledgments

The authors would like to thank Mark Deleon and John Morris for fabricating the joints considered in this study. The authors would also acknowledge the assistance provided at CanmetMATERIALS by Jie Liang in fatigue testing.

Conflicts of Interest

The authors declare no conflict of interest.

References

  1. Cai, W.; Wang, P.C.; Yang, W. Assembly dimensional prediction for self-piercing riveted aluminum panels. Int. J. Mach. Tools Manuf. 2005, 45, 695–704. [Google Scholar] [CrossRef]
  2. Mortimer, J. Jaguar uses X350 car to pioneer use of self-piercing rivets. Ind. Robot Int. J. 2001, 28, 192–198. [Google Scholar] [CrossRef]
  3. Barnes, T.A.; Pashby, I.R. Joining techniques for aluminum spaceframes used in automobiles. Part II—Adhesive bonding and mechanical fasteners. J. Mater. Process. Technol. 2000, 99, 72–79. [Google Scholar] [CrossRef]
  4. Eusebi, E. Composite intensive vehicles: Past present and future. In Proceedings of the PNGV Symposium on Structural Materials Challenges, Washington, DC, USA, 22–23 February 1995; U.S. Department of Commerce: Washington, DC, USA, 1995. [Google Scholar]
  5. Gjostein, N.A. Technology needs beyond PNGV. In Proceedings of the Basic Needs for Vehicles of the Future, New Orleans, LA, USA, 5 January 1995. [Google Scholar]
  6. Kang, J.; Rao, H.; Zhang, R.; Avery, K.; Su, X. Tensile and fatigue behaviour of self-piercing rivets of CFRP to aluminium for automotive application. IOP Conf. Ser. Mater. Sci. Eng. 2016, 137, 12–25. [Google Scholar] [CrossRef]
  7. Di Franco, G.; Fratini, L.; Pasta, A. Analysis of the mechanical performance of hybrid (SPR/bonded) single-lap joints between CFRP panels and aluminum blanks. Int. J. Adhes. Adhes. 2013, 41, 24–32. [Google Scholar] [CrossRef]
  8. Kroll, L.; Mueller, S.; Mauermann, R.; Gruetzner, R.; Technology, F.; Structures, L.; Gmbh, E. Strength of self-piercing riveted joints for cfrp/aluminium sheets. In Proceedings of the 18th International Conference on Composite Materials, ICCM 2011, Jeju, Korea, 21–26 August 2011. [Google Scholar]
  9. Zhang, J.; Yang, S. Self-piercing riveting of aluminum alloy and thermoplastic composites. J. Compos. Mater. 2014, 49. [Google Scholar] [CrossRef]
  10. Pickin, C.G.; Young, K.; Tuersley, I. Joining of lightweight sandwich sheets to aluminium using self-pierce riveting. Mater. Des. 2007, 28, 2361–2365. [Google Scholar] [CrossRef]
  11. Fiore, V.; Di Bella, G.; Galtieri, G.; Alagna, F.; Borsellino, C.; Valenza, A. Mechanical behaviour of spr/co-cured composite to aluminium joints. In Proceedings of the ECCM15-15th European Conference of Composite Materials, Venice, Italy, 24–28 June 2012; pp. 24–28. [Google Scholar]
  12. Fratini, L.; Ruisi, V.F. Self-piercing riveting for aluminium alloys-composites hybrid joints. Int. J. Adv. Manuf. Technol. 2009, 43, 61–66. [Google Scholar] [CrossRef]
  13. Di Franco, G.; Fratini, L.; Pasta, A. Influence of the distance between rivets in self-piercing riveting bonded joints made of carbon fiber panels and AA2024 blanks. Mater. Des. 2012, 35, 342–349. [Google Scholar] [CrossRef]
  14. Di Franco, G.; Fratini, L.; Pasta, A.; Ruisi, V.F. On the self-piercing riveting of aluminium blanks and carbon fibre composite panels. Int. J. Mater. Form. 2013, 6, 137–144. [Google Scholar] [CrossRef]
  15. Rao, H.M.H.M.; Kang, J.; Huff, G.; Avery, K.; Su, X. Impact of rivet head height on the tensile and fatigue properties of lap shear self-pierced riveted CFRP to aluminum. SAE Int. J. Mater. Manuf. 2017, 10. [Google Scholar] [CrossRef]
  16. Rao, H.M.; Kang, J.; Huff, G.; Avery, K. Impact of specimen configuration on fatigue properties of self-piercing riveted aluminum to carbon fiber reinforced polymer composite. Int. J. Fatigue 2018, 113, 11–22. [Google Scholar] [CrossRef]
  17. Bonnen, J.J.; Agrawal, H.; Amaya, M.A.; Iyengar, R.M.; Kang, H.T.; Khosrovaneh, A.K.; Shih, H.-C.; Walp, M.; Yan, B. Fatigue of advanced high strength steel spot-welds. SAE 2006 Trans. J. Mater. Manuf. 2006, 115. [Google Scholar] [CrossRef]
  18. Lin, P.; Pan, J. Closed-form structural stress and stress intensity factor solutions for spot welds in commonly used specimens. Eng. Fract. Mech. 2008, 75, 5187–5206. [Google Scholar] [CrossRef]
  19. Swellam, M.H.; Lawrence, F.V. A fatigue design parameter for spot welds. Ph.D. Thesis, University of Illinois at Urbaba-Champaign, Champaign, IL, USA, 1991. [Google Scholar]
  20. Rupp, A.; Storzel, K.; Grubisic, V. Computer aided dimensioning of spot-welded automitive structures. In Proceedings of the SAE International Congress and Exposition, Detroit, MI, USA, 27 February–2 March 1995. [Google Scholar]
  21. Sheppard, S.D.; Strange, M. Fatigue life estimation in resistance spot welds: Initiation and early growth phase. Fatigue Fract. Eng. Mater. Struct. 1992, 15, 531–549. [Google Scholar] [CrossRef]
  22. Dong, P. A structural stress definition and numerical implementation for fatigue analysis of welded joints. Int. J. Fatigue 2001, 23, 865–876. [Google Scholar] [CrossRef]
  23. Kang, H.T. Fatigue damage parameter of spot welded joints under proportional loading. Int. J. Automot. Technol. 2005, 6, 285–291. [Google Scholar]
  24. Cox, A.; Hong, J. Fatigue Evaluation Procedure Development for Self-Piercing Riveted Joints Using the Battelle Structural Stress Method. SAE Tech. Pap. 2016. [Google Scholar] [CrossRef]
  25. Hong, J.K. The development of a simplified spot weld model for battelle structural stress calculation. SAE Int. J. Mater. Manuf. 2011, 4, 602–612. [Google Scholar] [CrossRef]
  26. Moraes, J.F.C.; Rao, H.M.; Jordon, J.B.; Barkey, M.E. High cycle fatigue mechanisms of aluminum self-piercing riveted joints. Fatigue Fract. Eng. Mater. Struct. 2018, 41, 57–70. [Google Scholar] [CrossRef]
  27. Han, L.; Chrysanthou, A.; Young, K.W.; O’Sullivan, J.M. Characterization of fretting fatigue in self-piercing riveted aluminium alloy sheets. Fatigue Fract. Eng. Mater. Struct. 2006, 29, 646–654. [Google Scholar] [CrossRef]
  28. Iyer, K.; Hu, S.J.; Brittman, F.L.; Wang, P.C.; Hayden, D.B.; Marin, S.P. Fatigue of single- And double-rivet self-piercing riveted lap joints. Fatigue Fract. Eng. Mater. Struct. 2005, 28, 997–1007. [Google Scholar] [CrossRef]
  29. Sun, X.; Stephens, E.V.; Khaleel, M.A. Fatigue behaviors of self-piercing rivets joining similar and dissimilar sheet metals. Int. J. Fatigue 2007, 29, 370–386. [Google Scholar] [CrossRef]
  30. Huang, L.; Shi, Y.; Guo, H.; Su, X. Fatigue behavior and life prediction of self-piercing riveted joint. Int. J. Fatigue 2016, 88, 96–110. [Google Scholar] [CrossRef]
  31. Hong, J.K.; Forte, T.P. Fatig procedures for bi-axial loaded plate joints using the battelle structural stress method. Procedia Eng. 2015, 133, 410–419. [Google Scholar] [CrossRef]
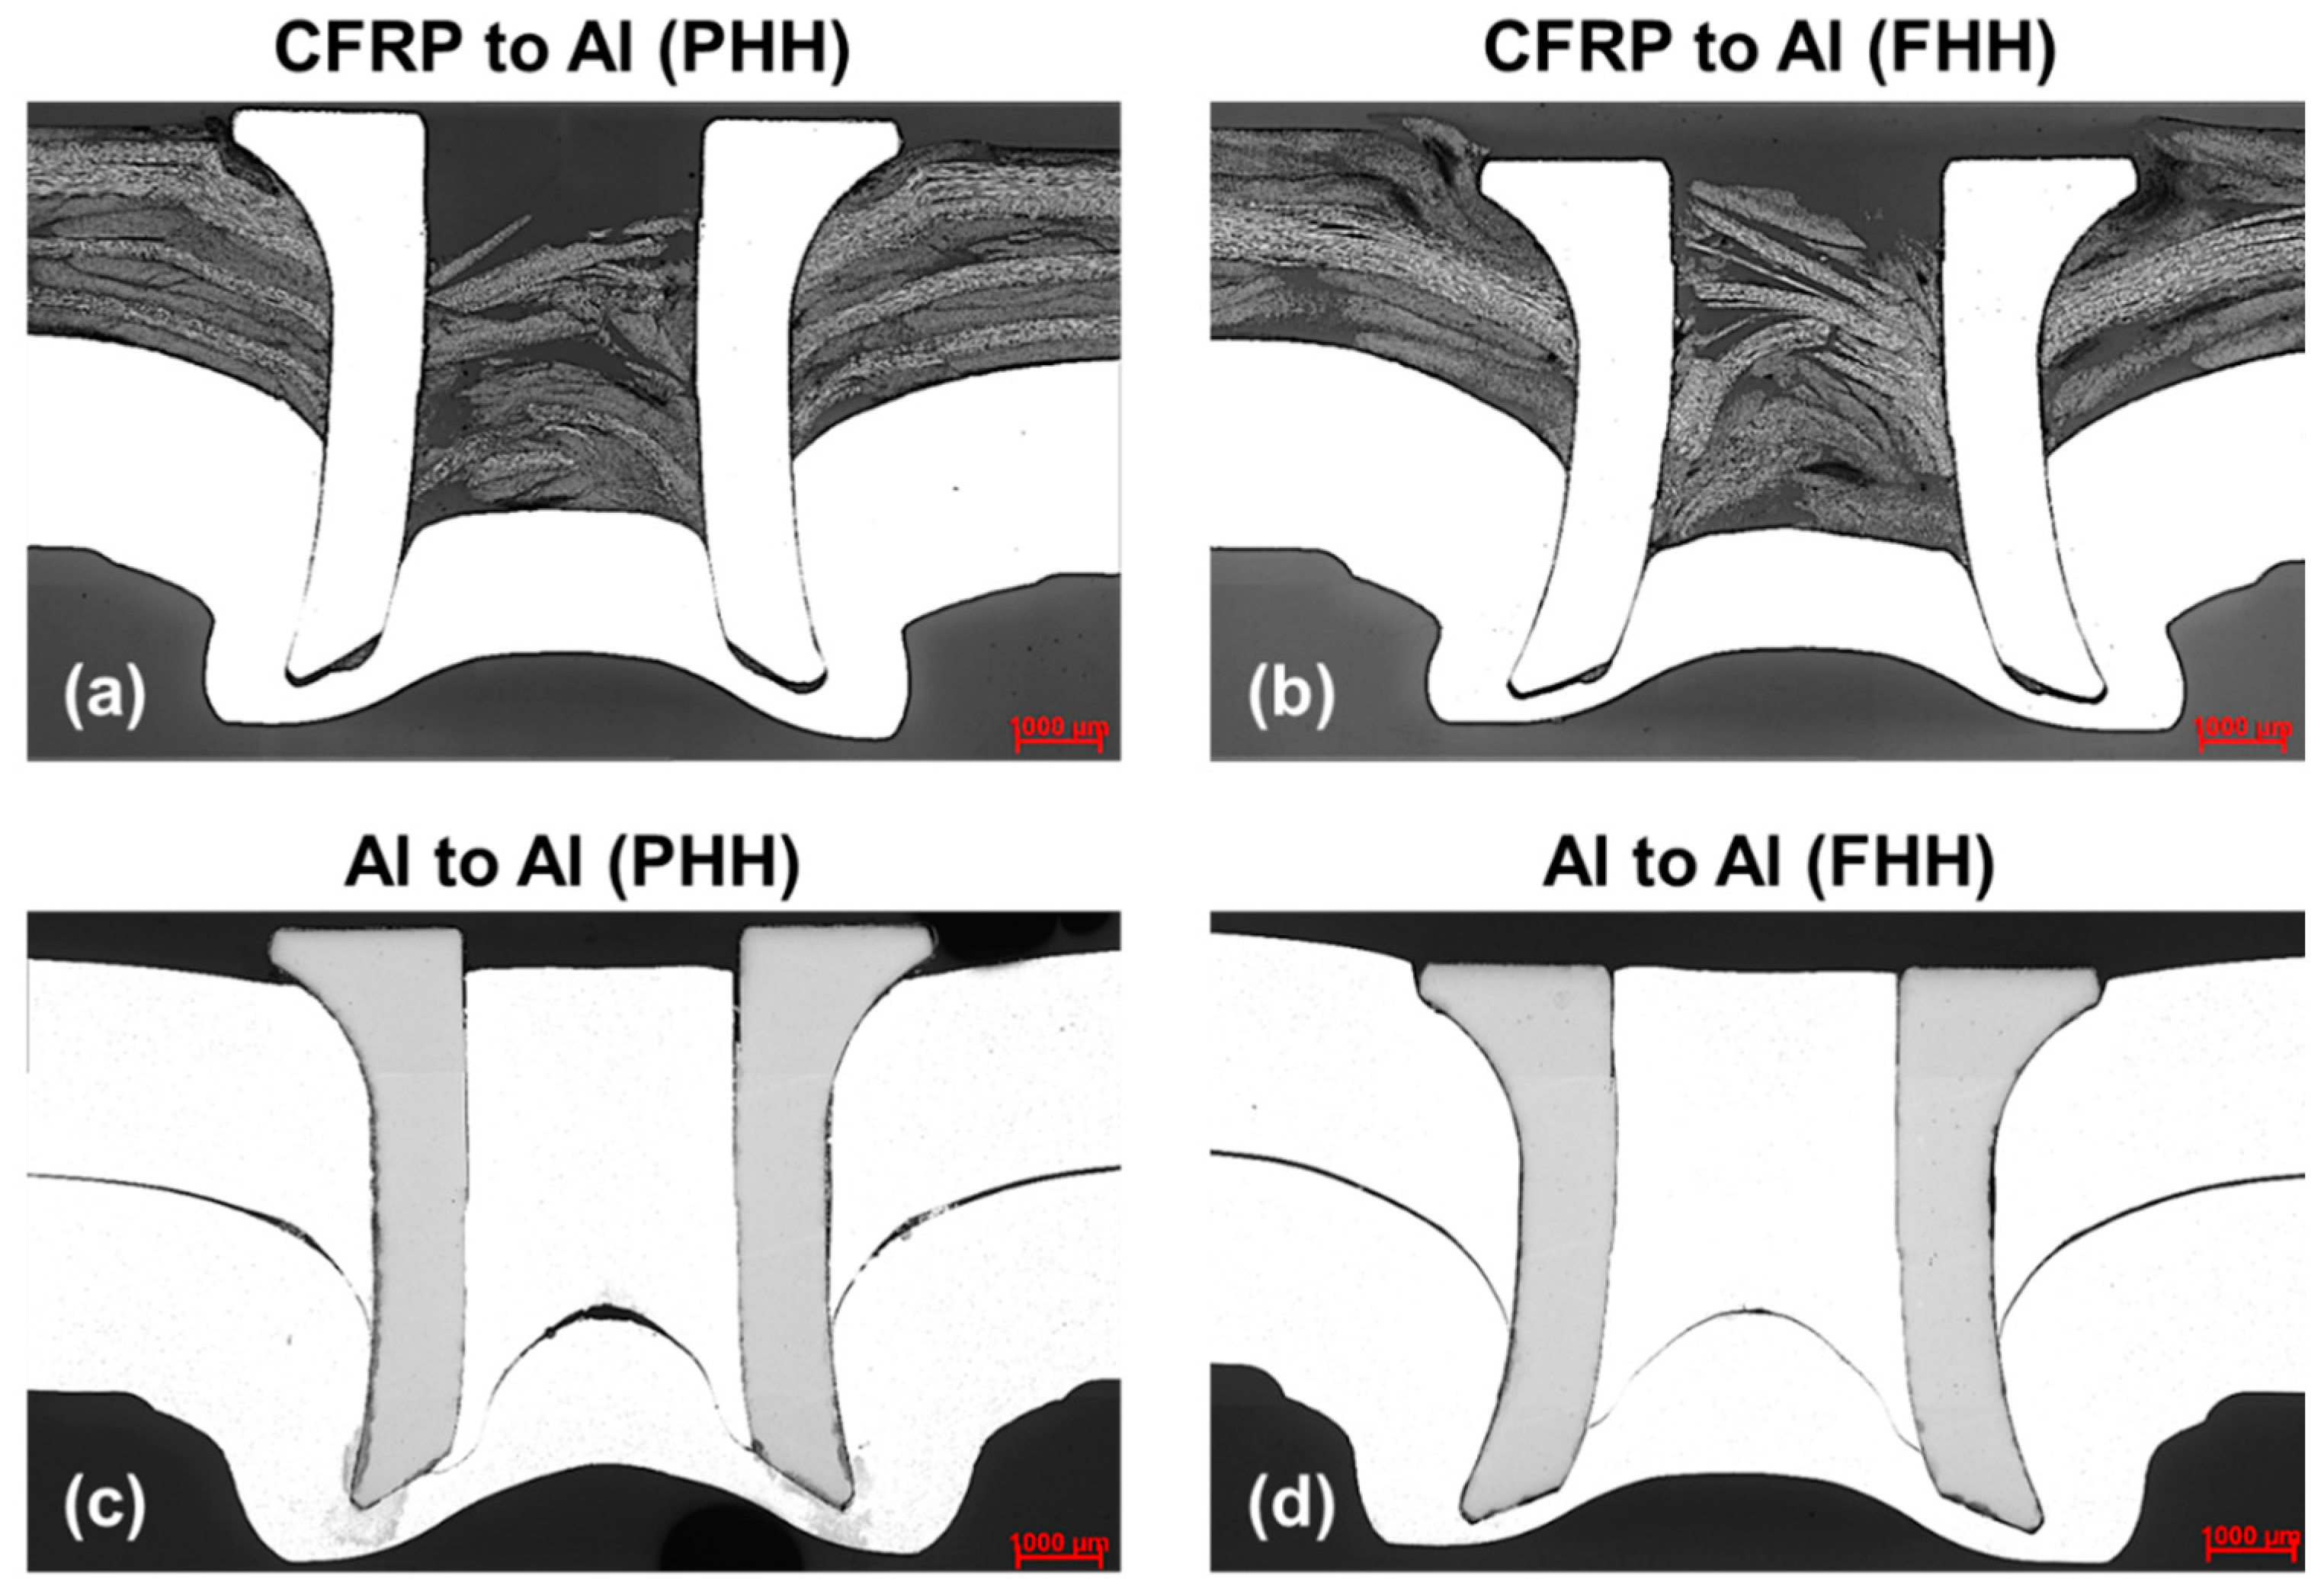
Figure 1. (a) Schematics illustrating the geometric values of lap-shear self-piercing rivet (SPR) joints, and (b) representative of a hollow rivet employed in this study.
Metals 09 00359 g001
Figure 2. Representative cross-sections of the untested SPR joints: (a) carbon-fiber-reinforced polymer (CFRP)-to-Al with proud rivet head height, (b) CFRP-to-aluminum with flush rivet head height, (c) aluminum-to-aluminum with proud rivet head height, and (d) aluminum-to-aluminum with flush rivet head height.
Metals 09 00359 g002
Figure 3. Fatigue load-life curves comparing the fatigue life of CFRP-to-aluminum and aluminum-to-aluminum lap-shear joints (R = 0.1, R = 0.5). Applied fatigue load is normalized to average lap-shear failure load of lap-shear aluminum-to-aluminum SPR joint. Fatigue failure modes observed in (b) bottom aluminum sheet fracture in CFRP-to-aluminum SPR joints, (c) bottom sheet fracture in aluminum-to-aluminum SPR joints, and (d) top sheet fracture in aluminum-to-aluminum SPR joints (the lap-shear SPR joints that fracture in top sheet is indicated in (a) with *).
Metals 09 00359 g003
Figure 4. Representative of the SPR joint used in this study superimposed with various forces and moments. The forces and moments shown in insert on right corner are used in the Battelle structural stress method to calculate the components of the structural stress at the edge of the rivet.
Metals 09 00359 g004
Figure 5. Master S-N curve obtained using the simplified Battelle structural stress concept (a) using flared rivet diameter d2 and d2* and (b) using the rivet head diameter d1; (c) master S-N curve obtained with Rupp’s model using flared rivet diameter d2 and d2* and not considering the load ratio and (d) master S-N curve obtained with Rupp’s model using flared rivet diameter d2 and d2* and considering the load ratio.
Metals 09 00359 g005
Table 1. Stack configuration and geometric values of rivet head height and average diameter of rivet at specific regions.
Stack ConfigurationAverage Rivet Head Height (mm)Average Rivet Toe Diameter at Flaring, d2, (mm)
CFRP-to-Al (PHH)0.29 (+0.06/−0.07)6.1
CFRP-to-Al (FHH)0.00 (+0.10/−0.06)6.5
Al-to-Al (FHH)−0.01 (+0.07/−0.04)6.4
Al-to-Al (PHH)0.28 (+0.05/−0.06)6.2

