Correlation between Microstructural Evolution and Mechanical Properties of 2000 MPa Cold-Drawn Pearlitic Steel Wires during Galvanizing Simulated Annealing

Abstract
:1. Introduction
2. Materials and Methods
2.1. Test Materials
2.2. Annealing Treatment
2.3. Mechanical Performance Test
2.4. Microstructure Observation
3. Results and Discussion
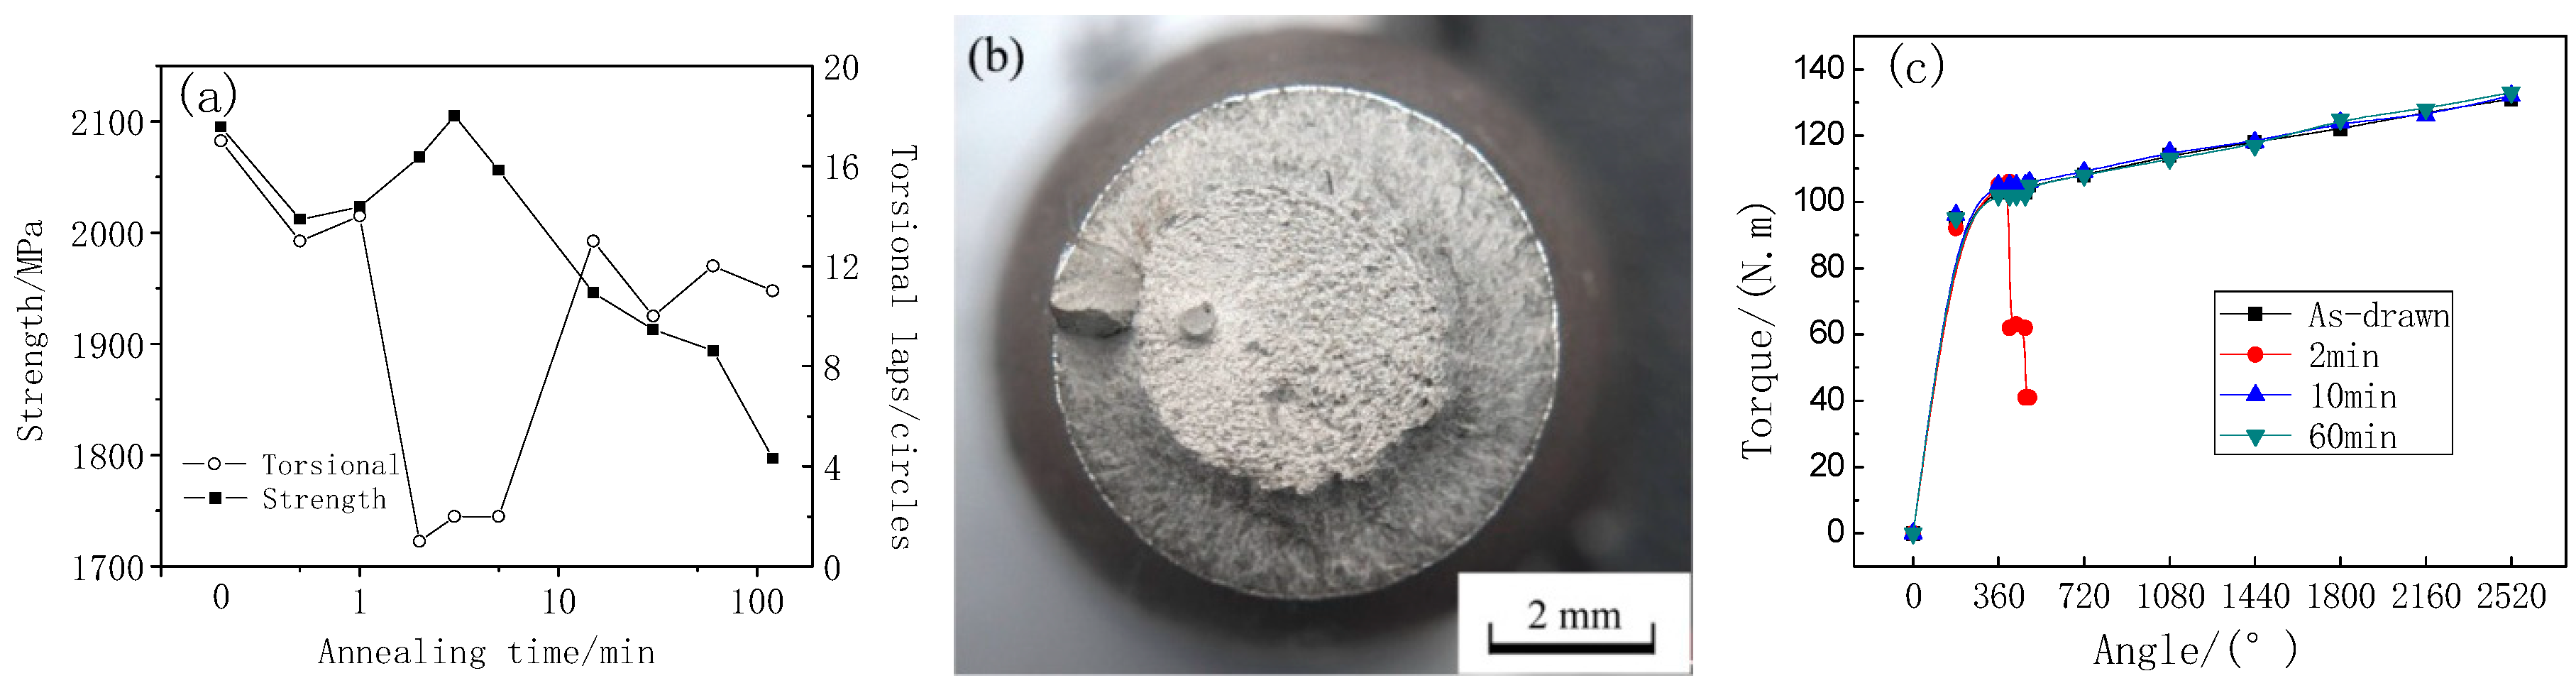
3.1. Tensile Strength and Torsion Laps
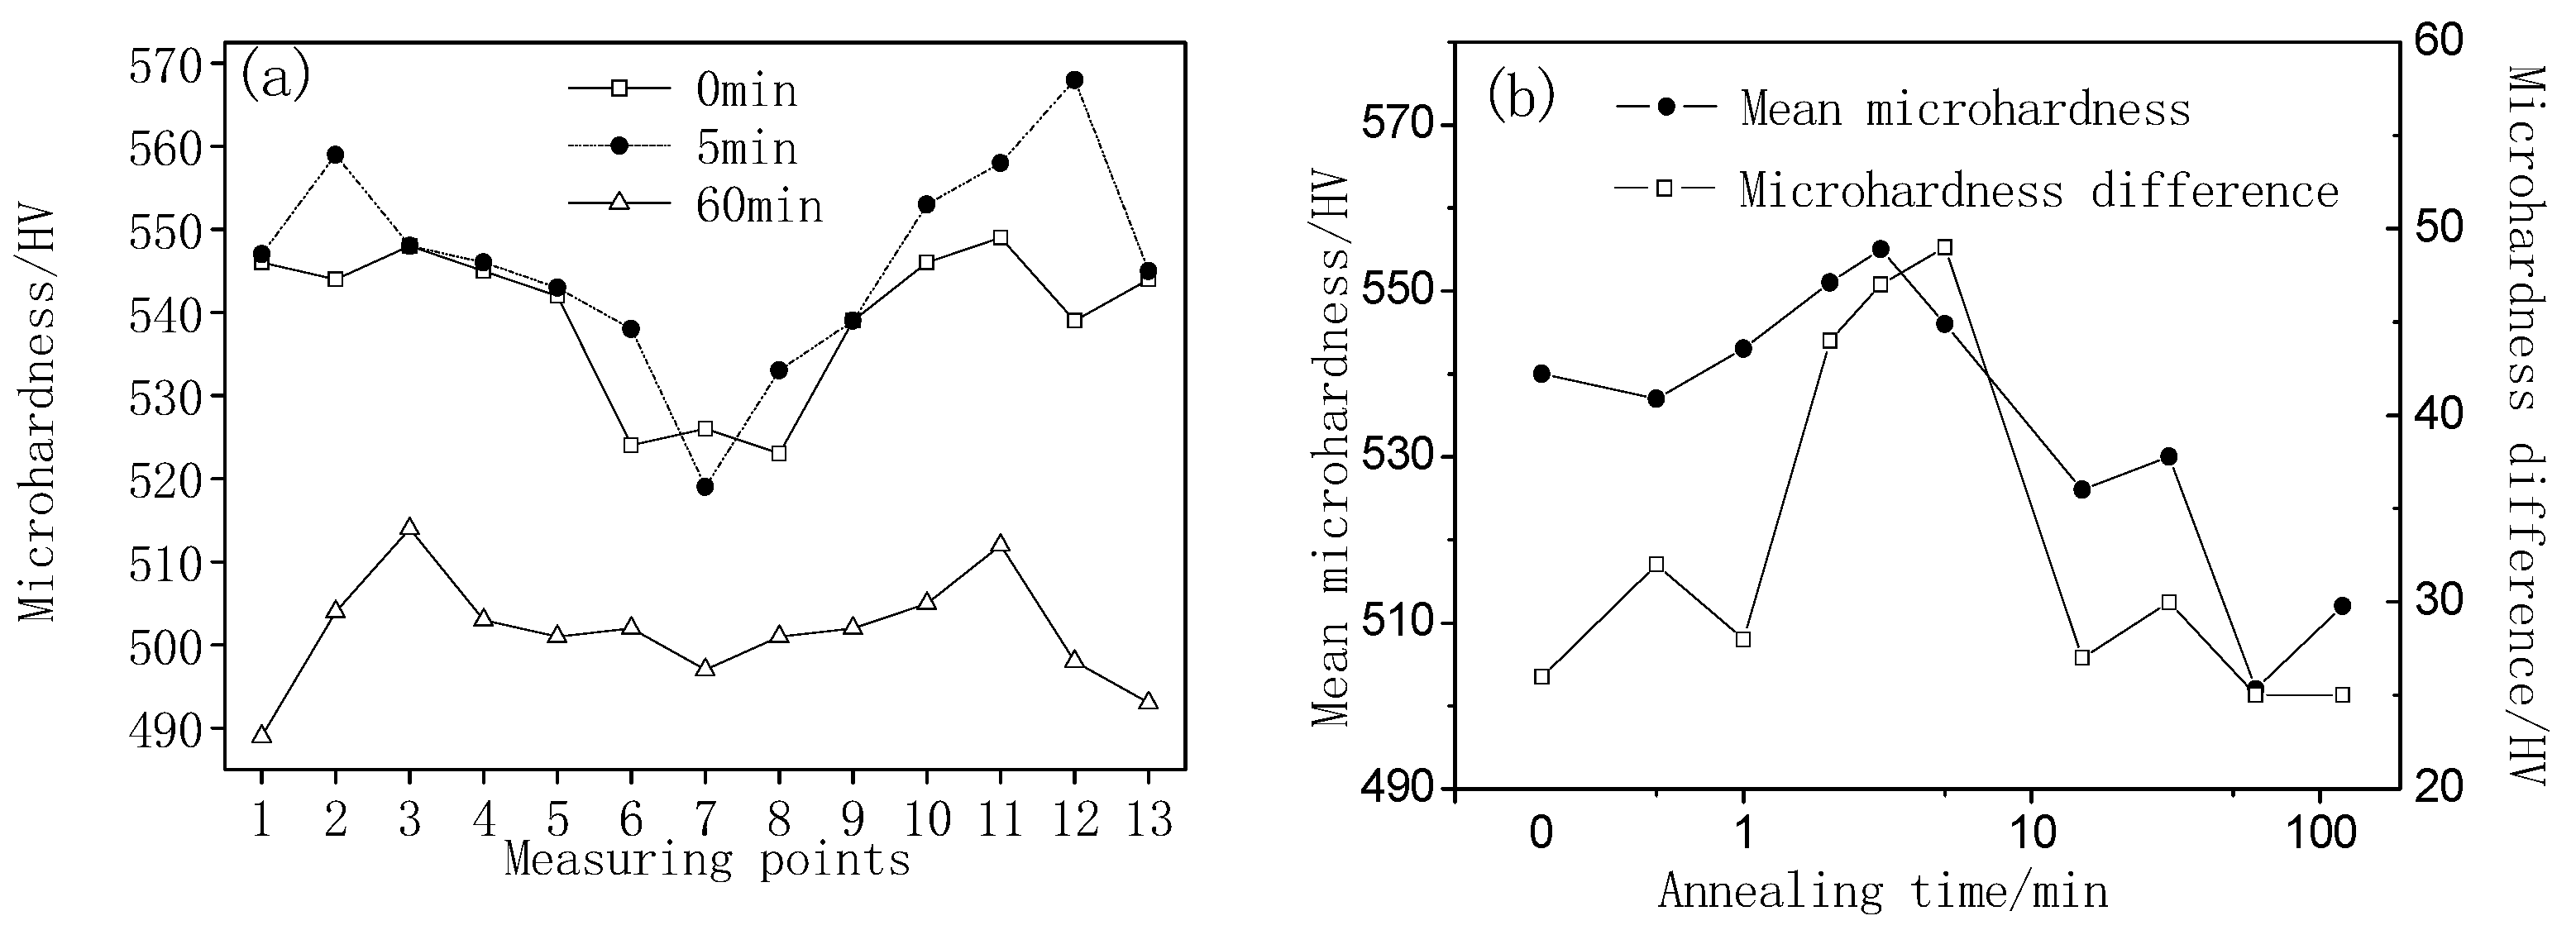
3.2. Microhardness
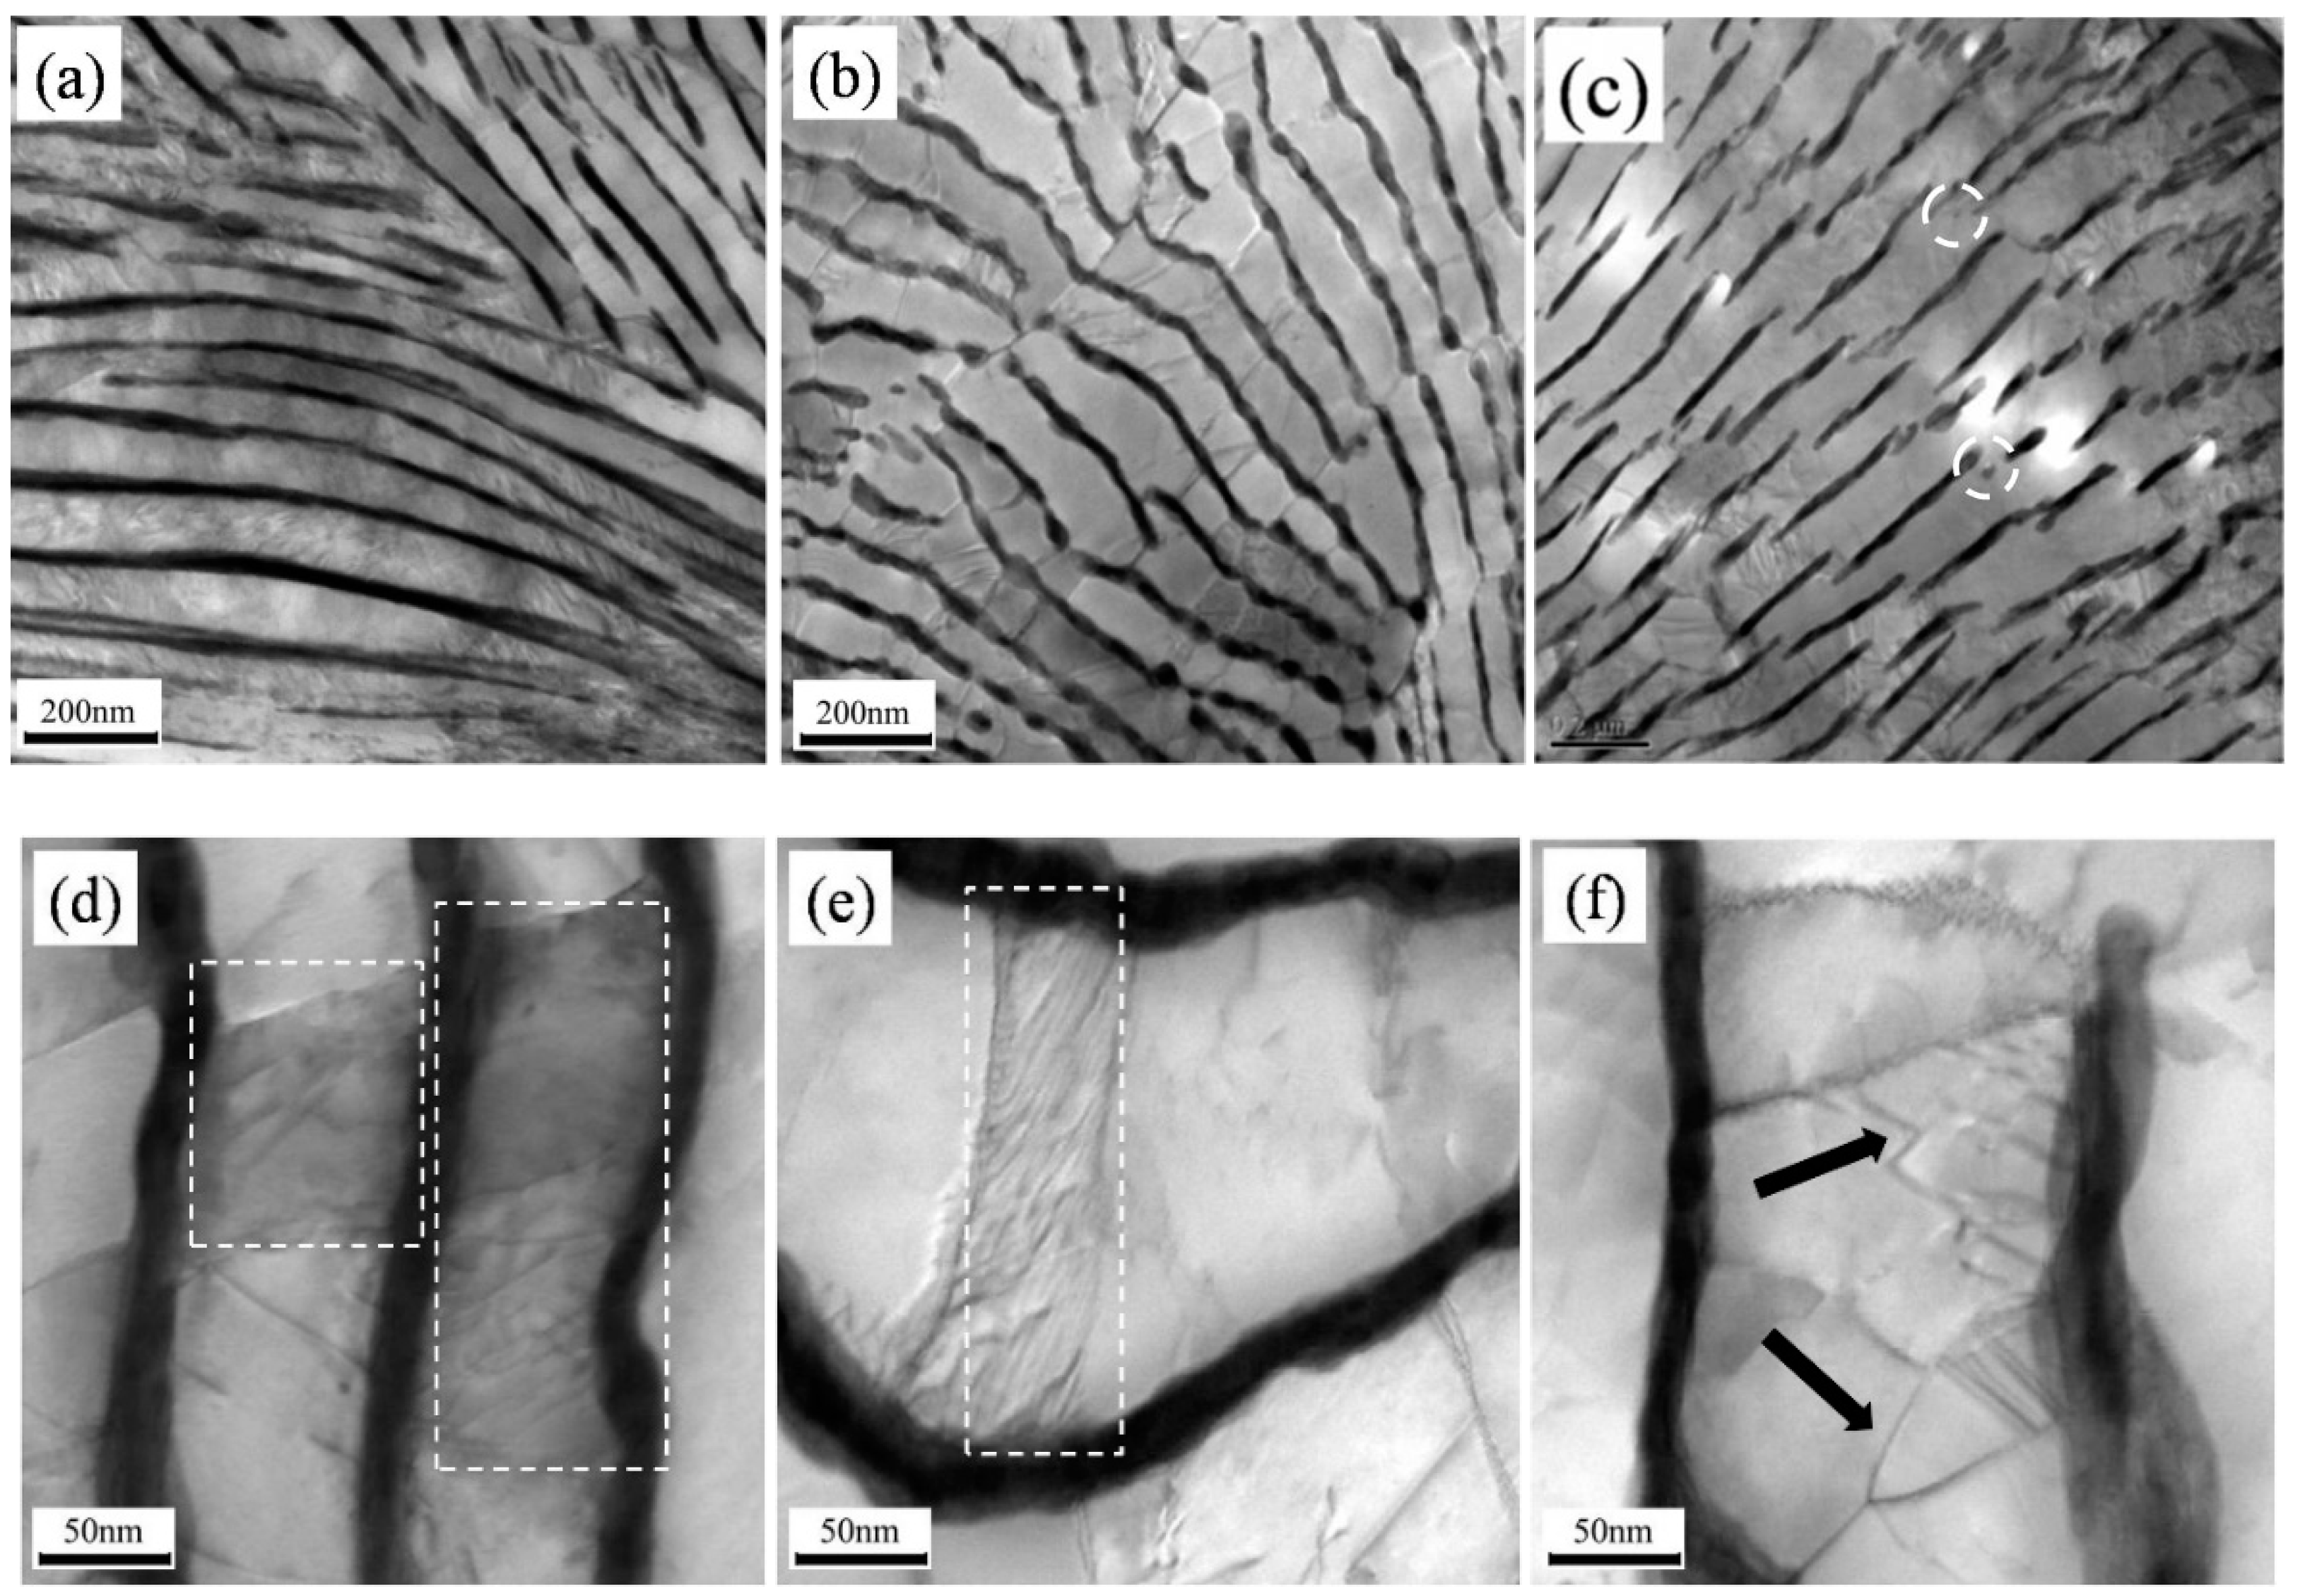
3.3. Microstructure
4. Conclusions
- The strength and the microhardness of the wires continued to decrease with the prolonged holding time during annealing at 450 °C. Torsion laps of the wires first decreased and then increased, thus the holding time range of 2–5 min with a high microhardness difference coincided with the range of low-torsion laps. It is not feasible to achieve the matching of strength and torsion laps by prolonging the holding time for 2000 MPa cold-drawn pearlitic steel wires analyzed in this paper.
- The microstructural evolution of the steel wires during annealing was accompanied by the following processes: the merging of high-density dislocations, the partial degradation of lamellar pearlites due to the diffusion of dissolved carbon atoms in ferrites, the spheroidization of lamellar cementites, and the re-precipitation of fine cementite particles.
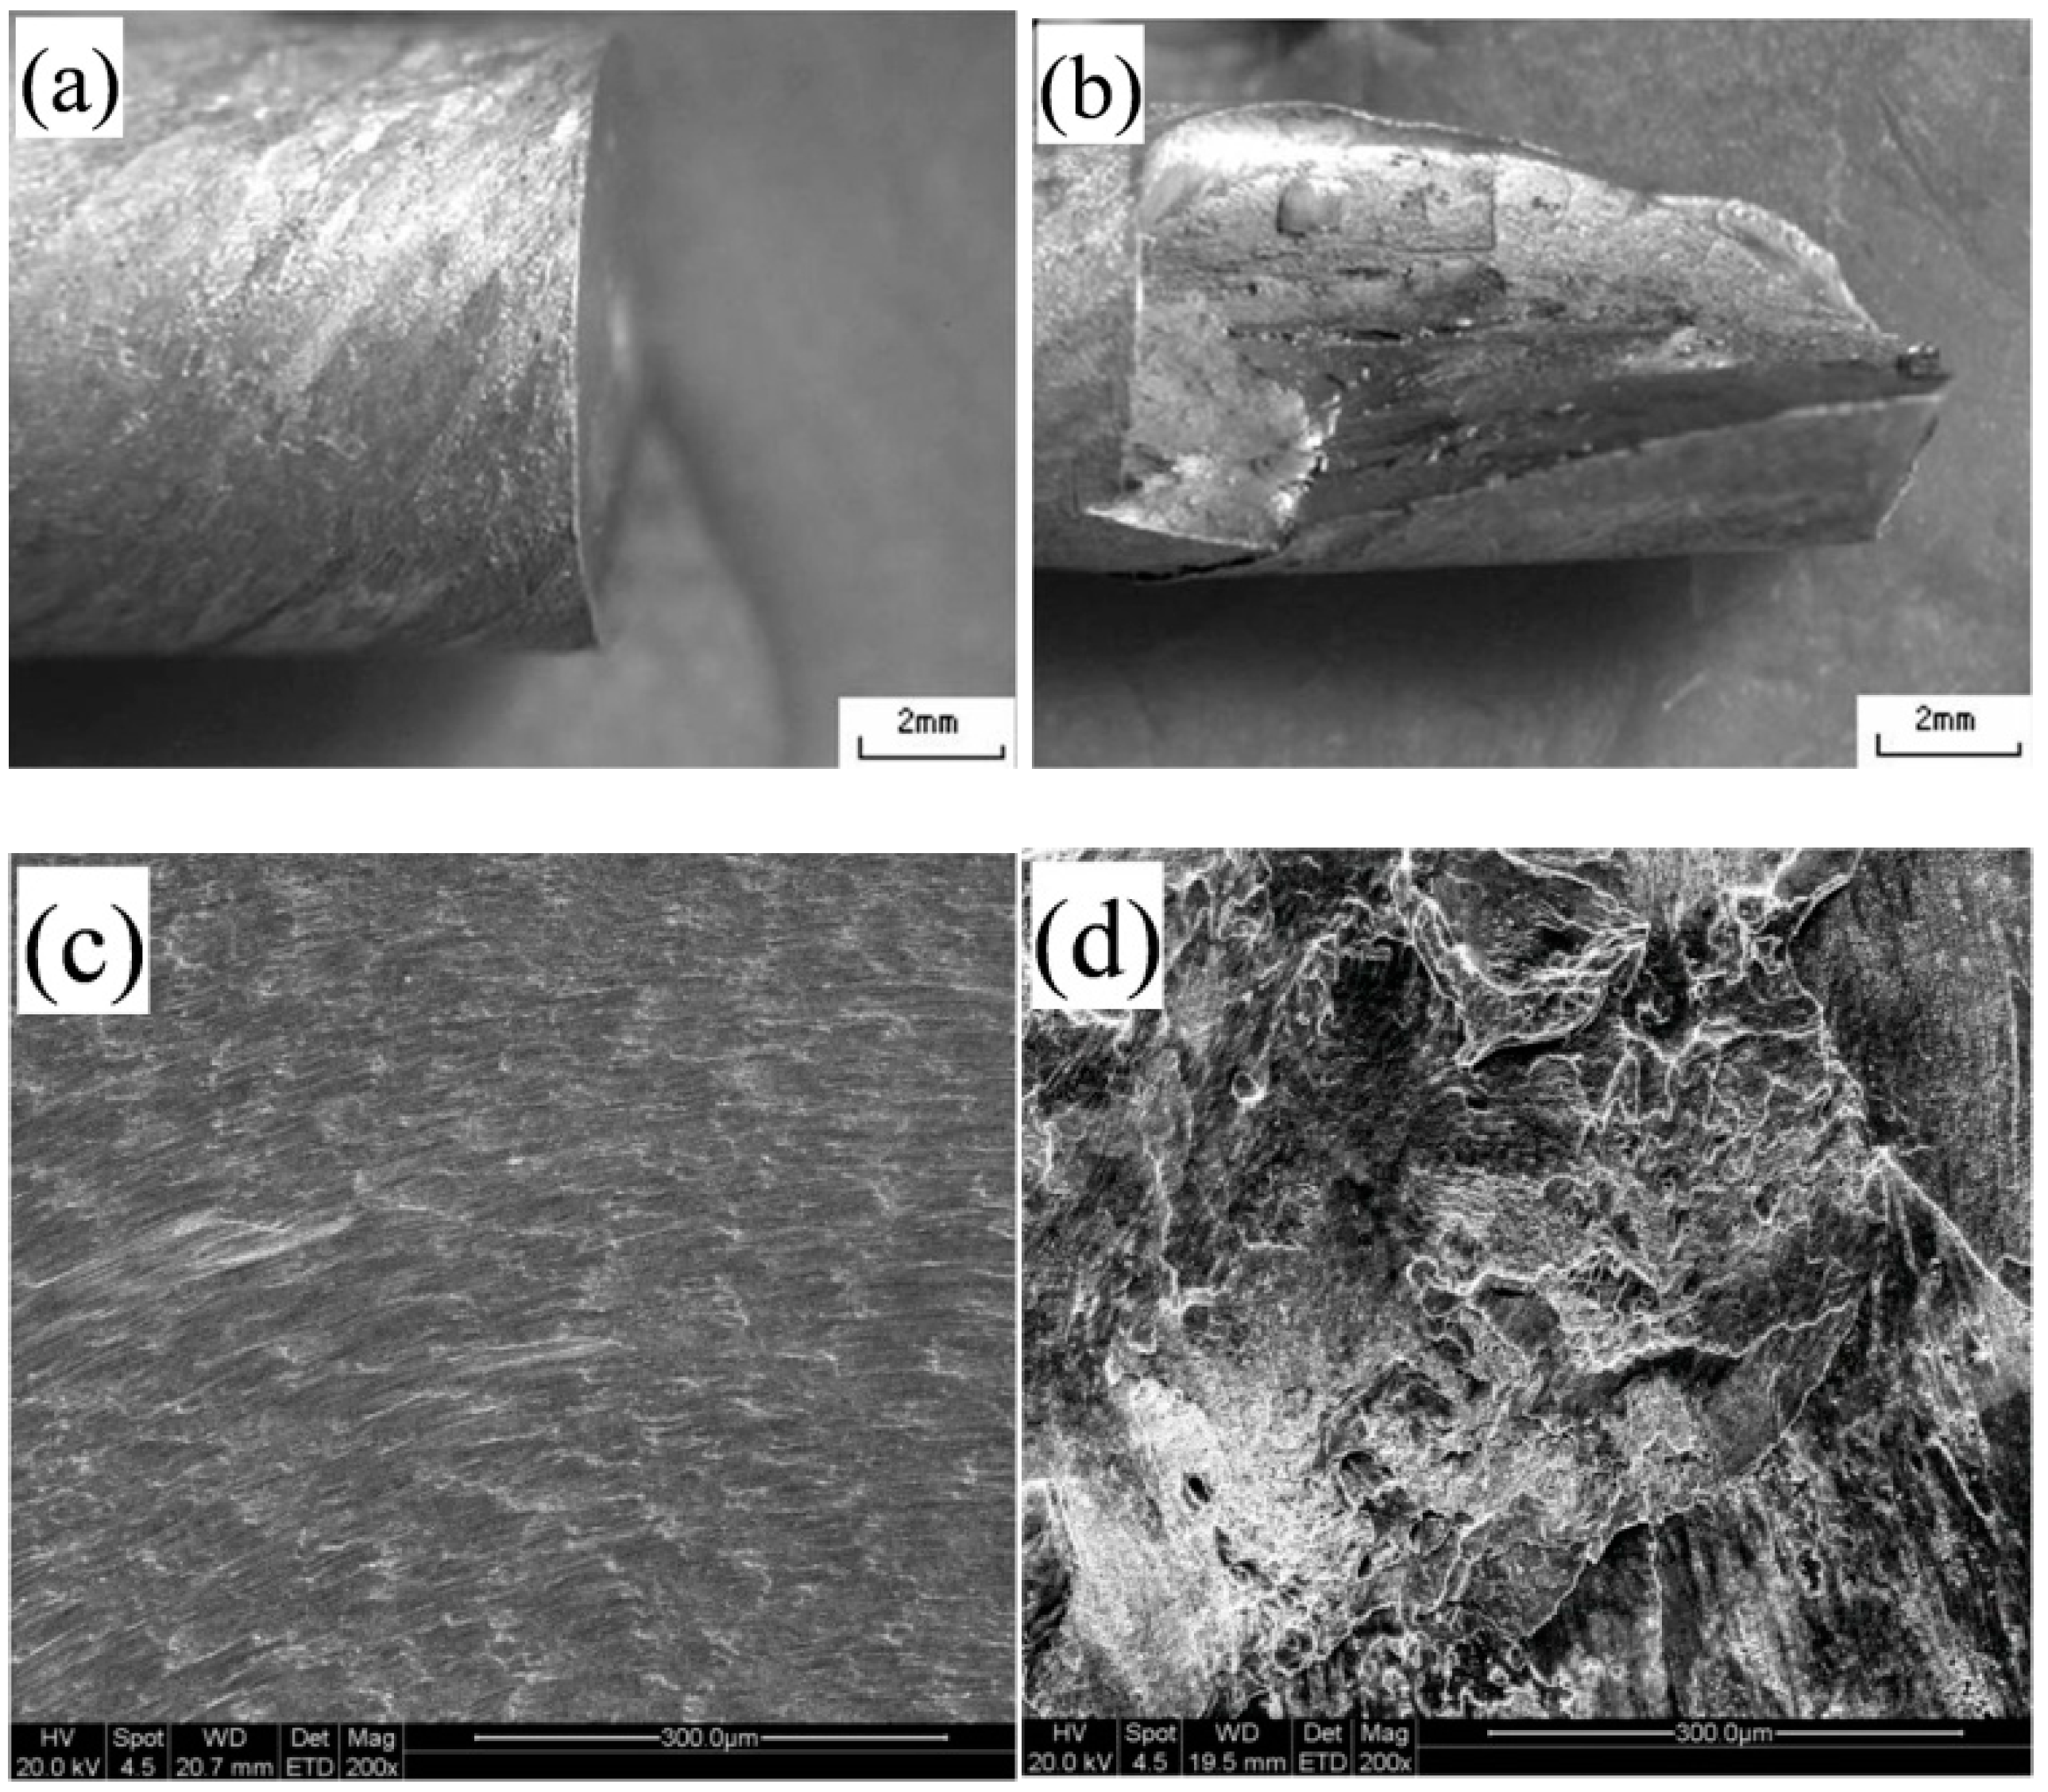
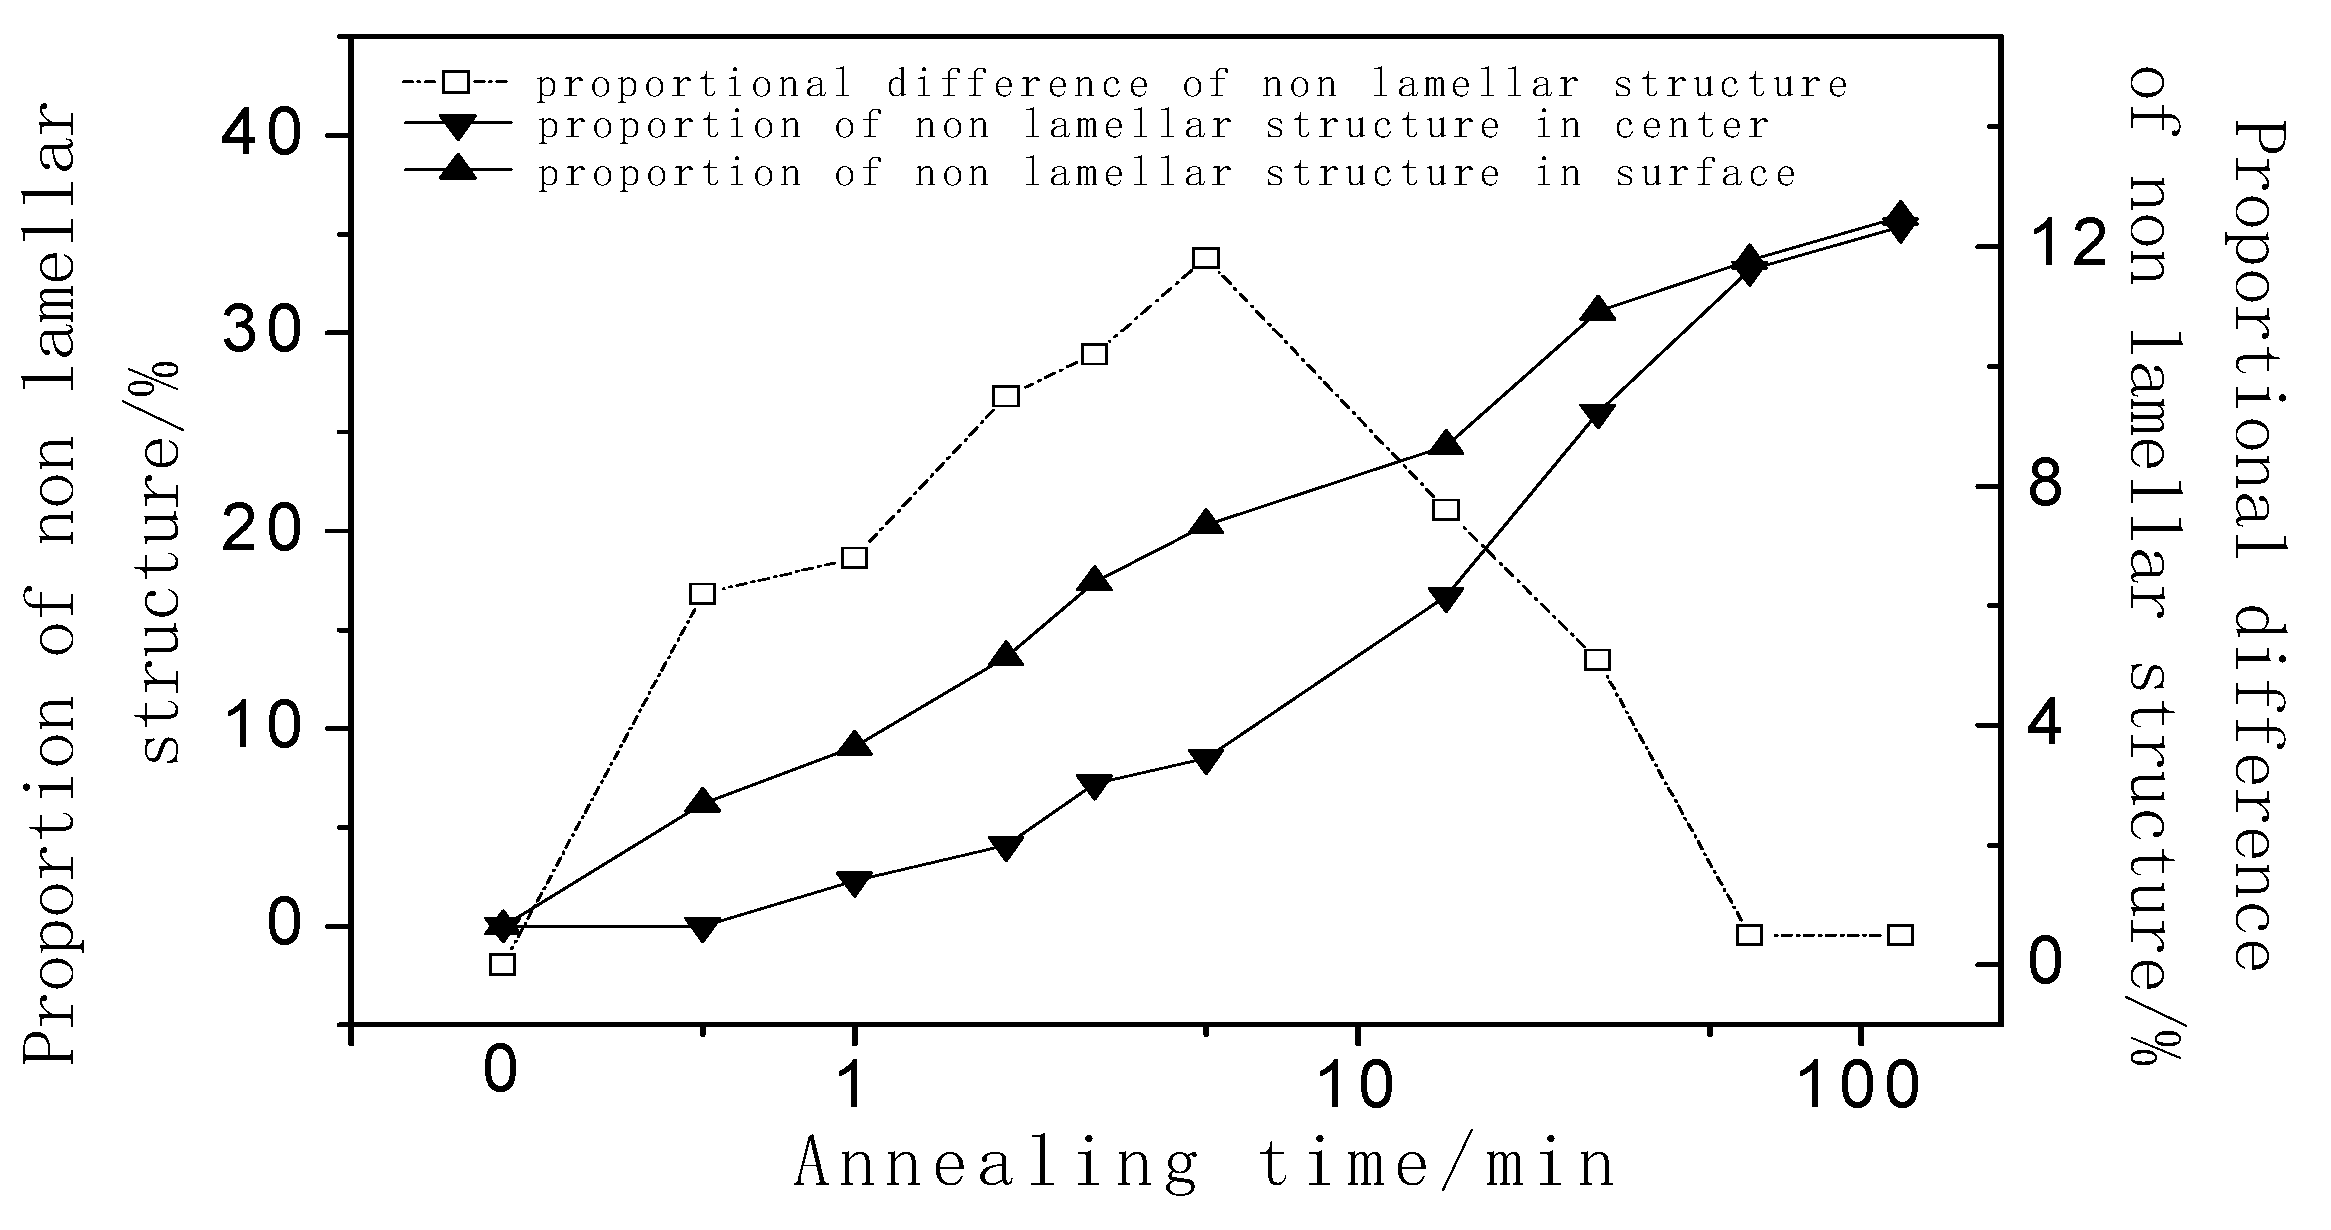
- The inconsistent microstructure degradation degree of the lamellar pearlitic structure (caused by inhomogeneous deformation and heating) between the surface and the center of the wires was the main reason for the deterioration in torsional performance. When the proportion of non-lamellar structure between the surface and the center exceeded 8%, the microhardness difference was greater than 40 HV and the torsion lap was less than three circles.
Funding
Acknowledgments
Conflicts of Interest
References
- Borchers, C.; Kirchheim, R. Cold-drawn Pearlitic Steel Wires. Prog. Mater. Sci. 2016, 82, 405–444. [Google Scholar] [CrossRef]
- Goto, S.; Kirchheim, R.; Al-Kassab, T.; Borchers, C. Application of Cold-drawn Lamellar Microstructure for Developing Ultra-high Strength Wires. Trans. Nonferrous Met. Soc. China 2007, 17, 1129–1138. [Google Scholar] [CrossRef]
- Zhang, X.; Godfrey, A.; Hansen, N.; Huang, X.X. Hierarchical Structures in Cold-drawn Pearlitic Steel Wire. Acta Mater. 2013, 61, 4898–4909. [Google Scholar] [CrossRef]
- Park, D.B.; Lee, J.W.; Lee, Y.S.; Park, K.T.; Nam, W.J. Effect of the Annealing Temperature and Time on the Microstructural Evolution and Corresponding the Mechanical Properties of Cold-drawn Steel Wires. Met. Mater. Int. 2008, 14, 59–64. [Google Scholar]
- Fang, F.; Hu, J.; Chen, S.H.; Xie, Z.H.; Jiang, J.Q. Revealing Microstructural and Mechanical Characteristics of Cold-drawn Pearlitic Steel Wires undergoing Simulated Galvanization Treatment. Mater. Sci. Eng. A 2012, 547, 51–54. [Google Scholar] [CrossRef]
- Zhou, L.C.; Fang, F.; Zhou, F.; Tu, Y.Y.; Xie, Z.H.; Jiang, J.Q. Cementite Nano-crystallization in Cold-drawn Pearlitic Wires Instigated by Low Temperature Annealing. Scr. Mater. 2016, 120, 5–8. [Google Scholar] [CrossRef]
- Lee, J.W.; Lee, J.C.; Lee, Y.S.; Park, K.T.; Nam, W.J. Effects of Post-deformation Annealing Conditions on the Behavior of Lamellar Cementite and the Occurrence of Delamination in Cold-drawn Steel Wires. J. Mater. Process. Technol. 2009, 209, 5300–5304. [Google Scholar] [CrossRef]
- Lamontagnea, A.; Massardiera, V.; Klebera, X.; Sauvage, X.; Mari, D. Comparative Study and Quantification of Cementite Decomposition in Heavily Drawn Pearlitic Steel Wires. Mater. Sci. Eng. A 2015, 644, 105–113. [Google Scholar] [CrossRef]
- Languillaum, J.; Kapelaki, G.; Baudelet, B. Cementite Dissolution in Heavily Cold-drawn Pearlite Steel Wires. Acta Mater. 1997, 45, 1201–1212. [Google Scholar] [CrossRef]
- Gridnev, V.N.; Gavrilyuk, V.G.; Dekhtyar, I.Y.; Meshkov, Y.Y.; Nizin, P.S.; Prokopenko, V.G. Investigation of Carbide Phase in Strained Steel by the Method of Nuclear Gamma Resonance. Phys. Status Solidi A 1972, 14, 689–694. [Google Scholar] [CrossRef]
- Watte, P.; Humbeeck, J.V.; Aernoudt, E.; Lefever, I. Strain Ageing in Heavily Drawn Eutectoid Steel Wires. Scr. Mater. 1996, 34, 85–95. [Google Scholar] [CrossRef]
- Brandaleze, E. Structural Evolution of Pearlite in Steels with Different Carbon Content under Drastic Deformation during Cold Drawing. Procedia Mater. Sci. 2015, 8, 1023–1030. [Google Scholar] [CrossRef] [Green Version]
- Zhou, L.C.; Fang, F.; Wang, L.; Chen, H.Q.; Xie, Z.H.; Jiang, J.Q. Torsion Delamination and Recrystallized Cementite of Heavy Drawing Pearlitic Wires After Low Temperature Annealing. Mater. Sci. Eng. A 2018, 713, 52–60. [Google Scholar] [CrossRef]
- Tanaka, M.; Saito, H.; Yasumaru, M.; Higashida, K. Nature of Delamination Cracks in Pearlitic Steels. Scr. Mater. 2016, 112, 32–36. [Google Scholar] [CrossRef]
- Tarui, T.; Maruyama, N. Effect of Cementite Decomposition on Delamination in High Carbon Steel Wires. J. Iron Steel Inst. Jpn. 2004, 90, 1031–1037. [Google Scholar] [CrossRef]
- Jaya, B.N.; Goto, S.; Richter, G.; Kirchlechner, C.; Dehm, G. Fracture Behavior of Nanostructured Heavily Cold-drawn Pearlitic Steel Wires before and after Annealing. Mater. Sci. Eng. A 2017, 707, 164–171. [Google Scholar] [CrossRef]
- Lee, S.K.; Ko, D.C.; Kim, B.M. Pass Schedule of Wire Drawing Process to Prevent Delamination for High Strength Steel Cord Wire. Mater. Des. 2009, 30, 2919–2927. [Google Scholar] [CrossRef]
- Zelin, M. Microstructure evolution in pearlitic steels during wire drawing. Acta Mater. 2002, 50, 4431–4447. [Google Scholar] [CrossRef]
- Bae, C.M.; Nam, W.J.; Lee, C.S. Effect of microstructural features on ductility in hypo-eutectoid steels. Scr. Mater. 1999, 41, 605–610. [Google Scholar] [CrossRef]
- Hong, M.H.; Reynolds, W.T.; Tarui, T.; Hono, K. Atom probe and transmission electron microscopy investigations of heavily drawn pearlitic steel wire. Metall. Mater. Trans. A 1999, 30, 717–727. [Google Scholar] [CrossRef]
- Kumagai, M.; Sato, S.; Suzuki, S.; Imafuku, M.; Tashiro, H.; Ohya, S.I. Residual Stress Analysis of Cold-drawn Pearlite Steel Wire UsingWhite Synchrotron Radiation. ISIJ Int. 2015, 55, 1489–1495. [Google Scholar] [CrossRef]
- Toribio, J.; Lorenzo, M.; Vergara, D.; Aguado, L. Residual stress redistribution induced by fatigue in cold-drawn prestressing steel wires. Constr. Build. Mater. 2016, 114, 317–322. [Google Scholar] [CrossRef]


| C | Si | Mn | P | S | Cu | Cr |
|---|---|---|---|---|---|---|
| 0.97 | 1.05 | 0.65 | 0.008 | 0.006 | 0.20 | 0.30 |
© 2019 by the author. Licensee MDPI, Basel, Switzerland. This article is an open access article distributed under the terms and conditions of the Creative Commons Attribution (CC BY) license (http://creativecommons.org/licenses/by/4.0/).
Share and Cite
Lu, X. Correlation between Microstructural Evolution and Mechanical Properties of 2000 MPa Cold-Drawn Pearlitic Steel Wires during Galvanizing Simulated Annealing. Metals 2019, 9, 326. https://doi.org/10.3390/met9030326
Lu X. Correlation between Microstructural Evolution and Mechanical Properties of 2000 MPa Cold-Drawn Pearlitic Steel Wires during Galvanizing Simulated Annealing. Metals. 2019; 9(3):326. https://doi.org/10.3390/met9030326
Chicago/Turabian StyleLu, Xiuyu. 2019. "Correlation between Microstructural Evolution and Mechanical Properties of 2000 MPa Cold-Drawn Pearlitic Steel Wires during Galvanizing Simulated Annealing" Metals 9, no. 3: 326. https://doi.org/10.3390/met9030326
APA StyleLu, X. (2019). Correlation between Microstructural Evolution and Mechanical Properties of 2000 MPa Cold-Drawn Pearlitic Steel Wires during Galvanizing Simulated Annealing. Metals, 9(3), 326. https://doi.org/10.3390/met9030326