Article

Influence of Boron Addition on the Microstructure and the Corrosion Resistance of CoCrMo Alloy

by
Marco A.L. Hernandez-Rodriguez
1,
Dionisio A. Laverde-Cataño
2,
Diego Lozano
3,
Gabriela Martinez-Cazares
3 and
Yaneth Bedolla-Gil
3,*
1
Facultad de Ingeniería Mecánica y Eléctrica de la Universidad Autónoma de Nuevo León, Av. Universidad S/N Ciudad Universitaria, San Nicolás de los Garza CP 66455, Mexico
2
Facultad de Ingenierías Fisicoquímicas, Universidad Industrial de Santander (UIS), Carrera 27 Calle 9, Bucaramanga, Colombia
3
Departamento de Ingeniería, Universidad de Monterrey, Av.Morones Prieto 4500, San Pedro Garza García CP 66238, Mexico
*
Author to whom correspondence should be addressed.
Metals 2019, 9(3), 307; https://doi.org/10.3390/met9030307
Submission received: 15 February 2019 / Revised: 4 March 2019 / Accepted: 6 March 2019 / Published: 8 March 2019
(This article belongs to the Special Issue The Electrochemical and Corrosion Behaviour of Structural Materials)

Abstract

:
Cobalt-based alloys are extensively used in orthopedic applications for joint replacements due to their wear and corrosion resistance. Corrosion, however, is often associated with fatigue failure in these orthopedic devices. In this study, the effect of boron addition on the corrosion behavior of CoCrMo alloys was studied using linear polarization resistance, potentiodynamic polarization curves, electrochemical impedance spectroscopy, and cyclic voltammetry. The samples were analyzed under as-cast and heat treatment conditions after 21 days of immersion in phosphate-buffered saline (PBS) solution at 37 °C. The boron addition increased the particle content, while the heat treatment promoted enlargement and even distribution of the precipitates throughout the structure. The corrosion resistance was improved by both boron and heat treatments. The best performance was observed for a heat-treated alloy having a very small amount of boron, which had an increased resistance to corrosive attack. Such behavior was attributed to the homogenized microstructure achieved by boron and heat treatment that helped to form a stable passive layer of chromium oxide which endured the 21 days of immersion.

1. Introduction

Corrosion resistance is one of the most significant properties determining the biocompatibility of materials, and body fluids contain amino acids and proteins that influence the corrosion response of biomaterials. The concentrations of chloride ions in the serum and the interstitial fluid are 113 and 117 mEq L−1, respectively, while the oxygen dissolved in blood is one-fourth that in air; that is a corrosive environment for metallic materials [1]. Moreover, the pH in body fluids is between 7 and 7.35. However, when a material is implanted in the hard tissue, the pH decreases to 5.2 and takes about two weeks to recover to 7.4 [2]. In this early stage, the compatibility is governed by the reactions between the surface of the metallic implant and the living tissues [3]. In metallic biomaterials, the surface oxide layer is an ion release inhibitor; hence, after disruption, the number of released ions depends on its regeneration time. Co alloys exhibit high corrosion resistance and excellent wear resistance [4], and its clinical use for long periods of time has good biocompatibility in bulk form [5]. The alloy ASTM F799, i.e., the wrought version of ASTM F75, is currently the most used alloy for permanent implants at load-bearing sites, such as artificial joints [5]. The surface oxide layer of a mechanically polished CoCrMo alloy has a thickness of 2.5 nm and consists of cobalt, chromium, and molybdenum oxides. Although this layer is macroscopically stable, its composition changes because the passive surface coexists and interacts with the electrolytes, undergoing a continuous process of partial dissolution and reprecipitation [3]. Concerns about these alloys remain due to toxicity caused by metallic ions or particle release and failure fatigue assisted by fretting or corrosion, among others [5]. Failures of CoCrMo-alloy-based orthopedic devices due to the fatigue process assisted by corrosion have been reported [6], and issues related to metal ion release in body tissues have been described in references [7,8]. In this regard, previous studies have found that specific microstructural changes produced by heat treatment directly influence the mechanical behavior of materials under static and cyclic loads [6]. In addition, Dobbs and Robertson [9] stated that fatigue performance can be improved by controlling the chemical composition and the heat treatment.
For cast cobalt-based alloys the effect of boron on the microstructure refinement of columnar grains due to boron additions has been described, although it did not promote columnar to equiaxed transition [10]. In a heat-resistant Co-based alloy with 0.09–1.48 wt % boron, an important reduction in the incubation time of carbides, refinement of primary phases for small B amounts, and metallic borides for large B contents were reported [11]. Further studies on the effect of boron on these alloys have found formation of borides around the grain boundaries that improved the bond strength among the grains [12,13]. Creep resistance was increased by 0.05 atom % of boron [12]. However, B content higher that 0.04 atom % produced precipitate-depleted zones around grain boundaries that reduced yield strength at room temperature [12,13]. Solution heat treatment has been reported to eliminate these detrimental zones [13]. The mechanical properties were improved by nickel additions and traces of aluminium, titanium, and boron in a CoCrMo alloy [14]. This alloy also exhibited improved fatigue resistance due to the presence of Ni and the elimination of microstructural casting defects caused by trace elements [15].
Boron has also been used in CoCrMo alloys for coatings in boronizing processes at high temperatures (~1000 °C) in which metallic borides are formed at the surface. Mechanical properties and fracture toughness of these coatings have been studied with microindentation techniques [16,17]. It has been reported that boronizing improved the wear resistance of CoCrMo alloys due to the high surface hardness achieved during the process [18,19]. In spite of this, a reduction was found in the corrosion resistance of a borided cobalt alloy immersed in Hank’s solution for 10 days due to clusters of B2S3 and CrPO4 which formed on the surface of the material [20].
In the present study, the chemical composition of a CoCrMo biocompatible alloy was modified via boron addition and the resulting electrochemical properties were studied to evaluate the effect on the corrosion resistance; the samples were analyzed under both as-cast and heat treatment conditions.

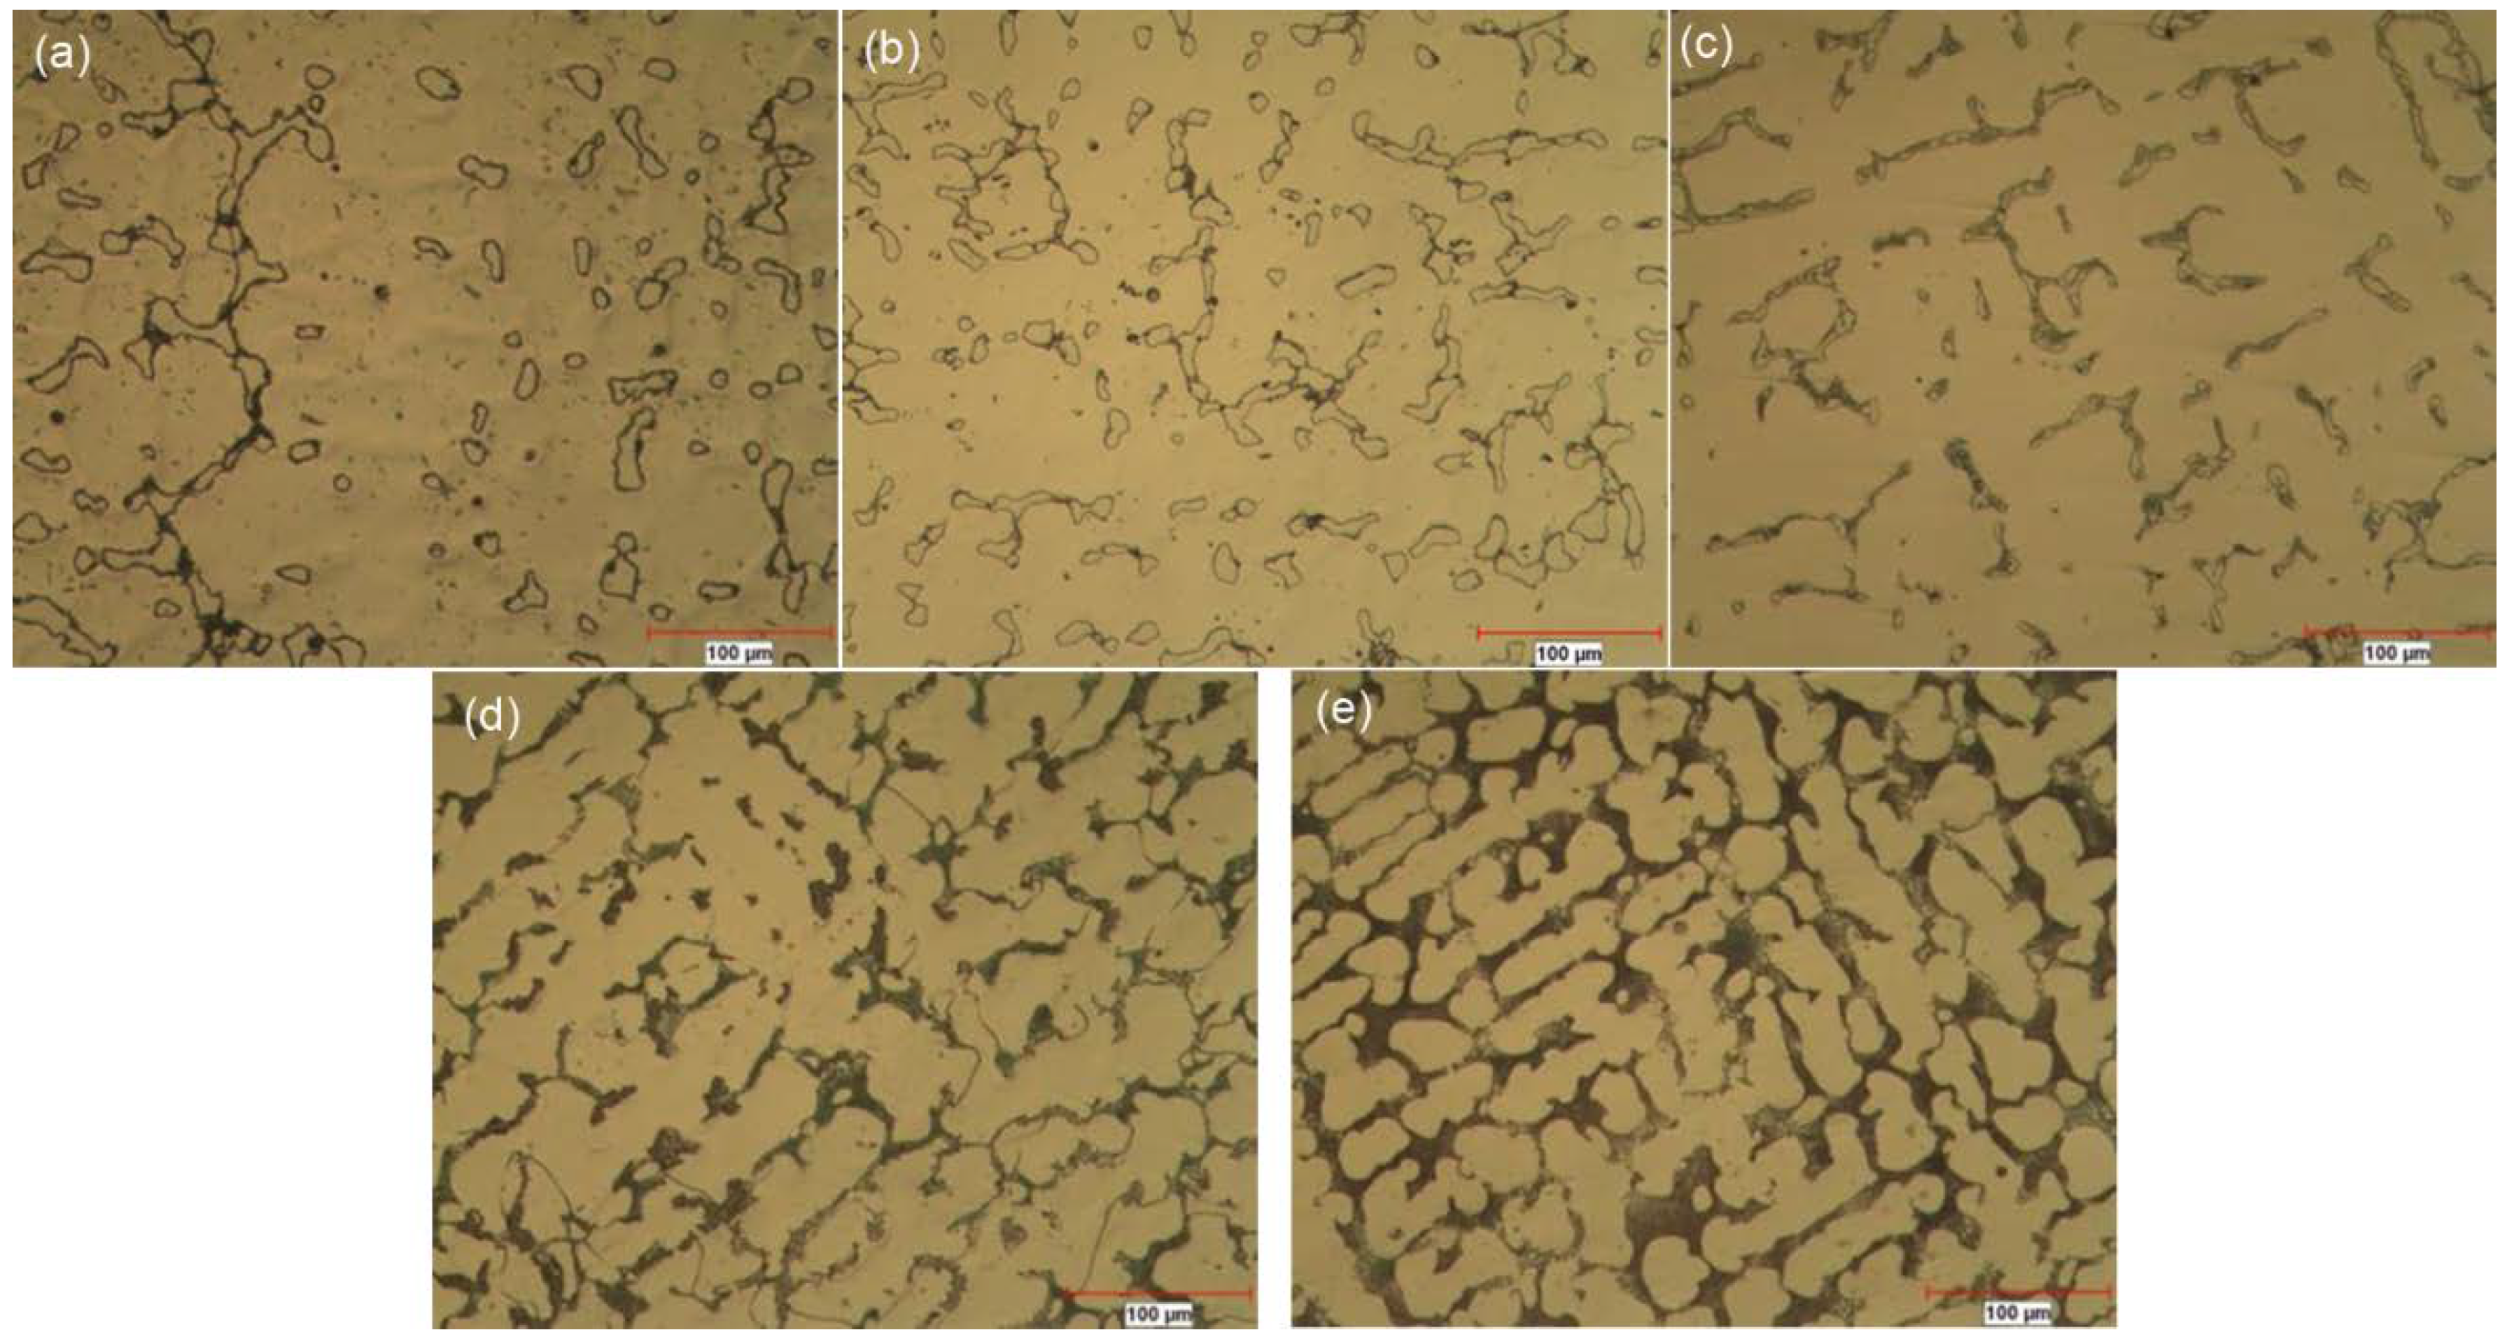
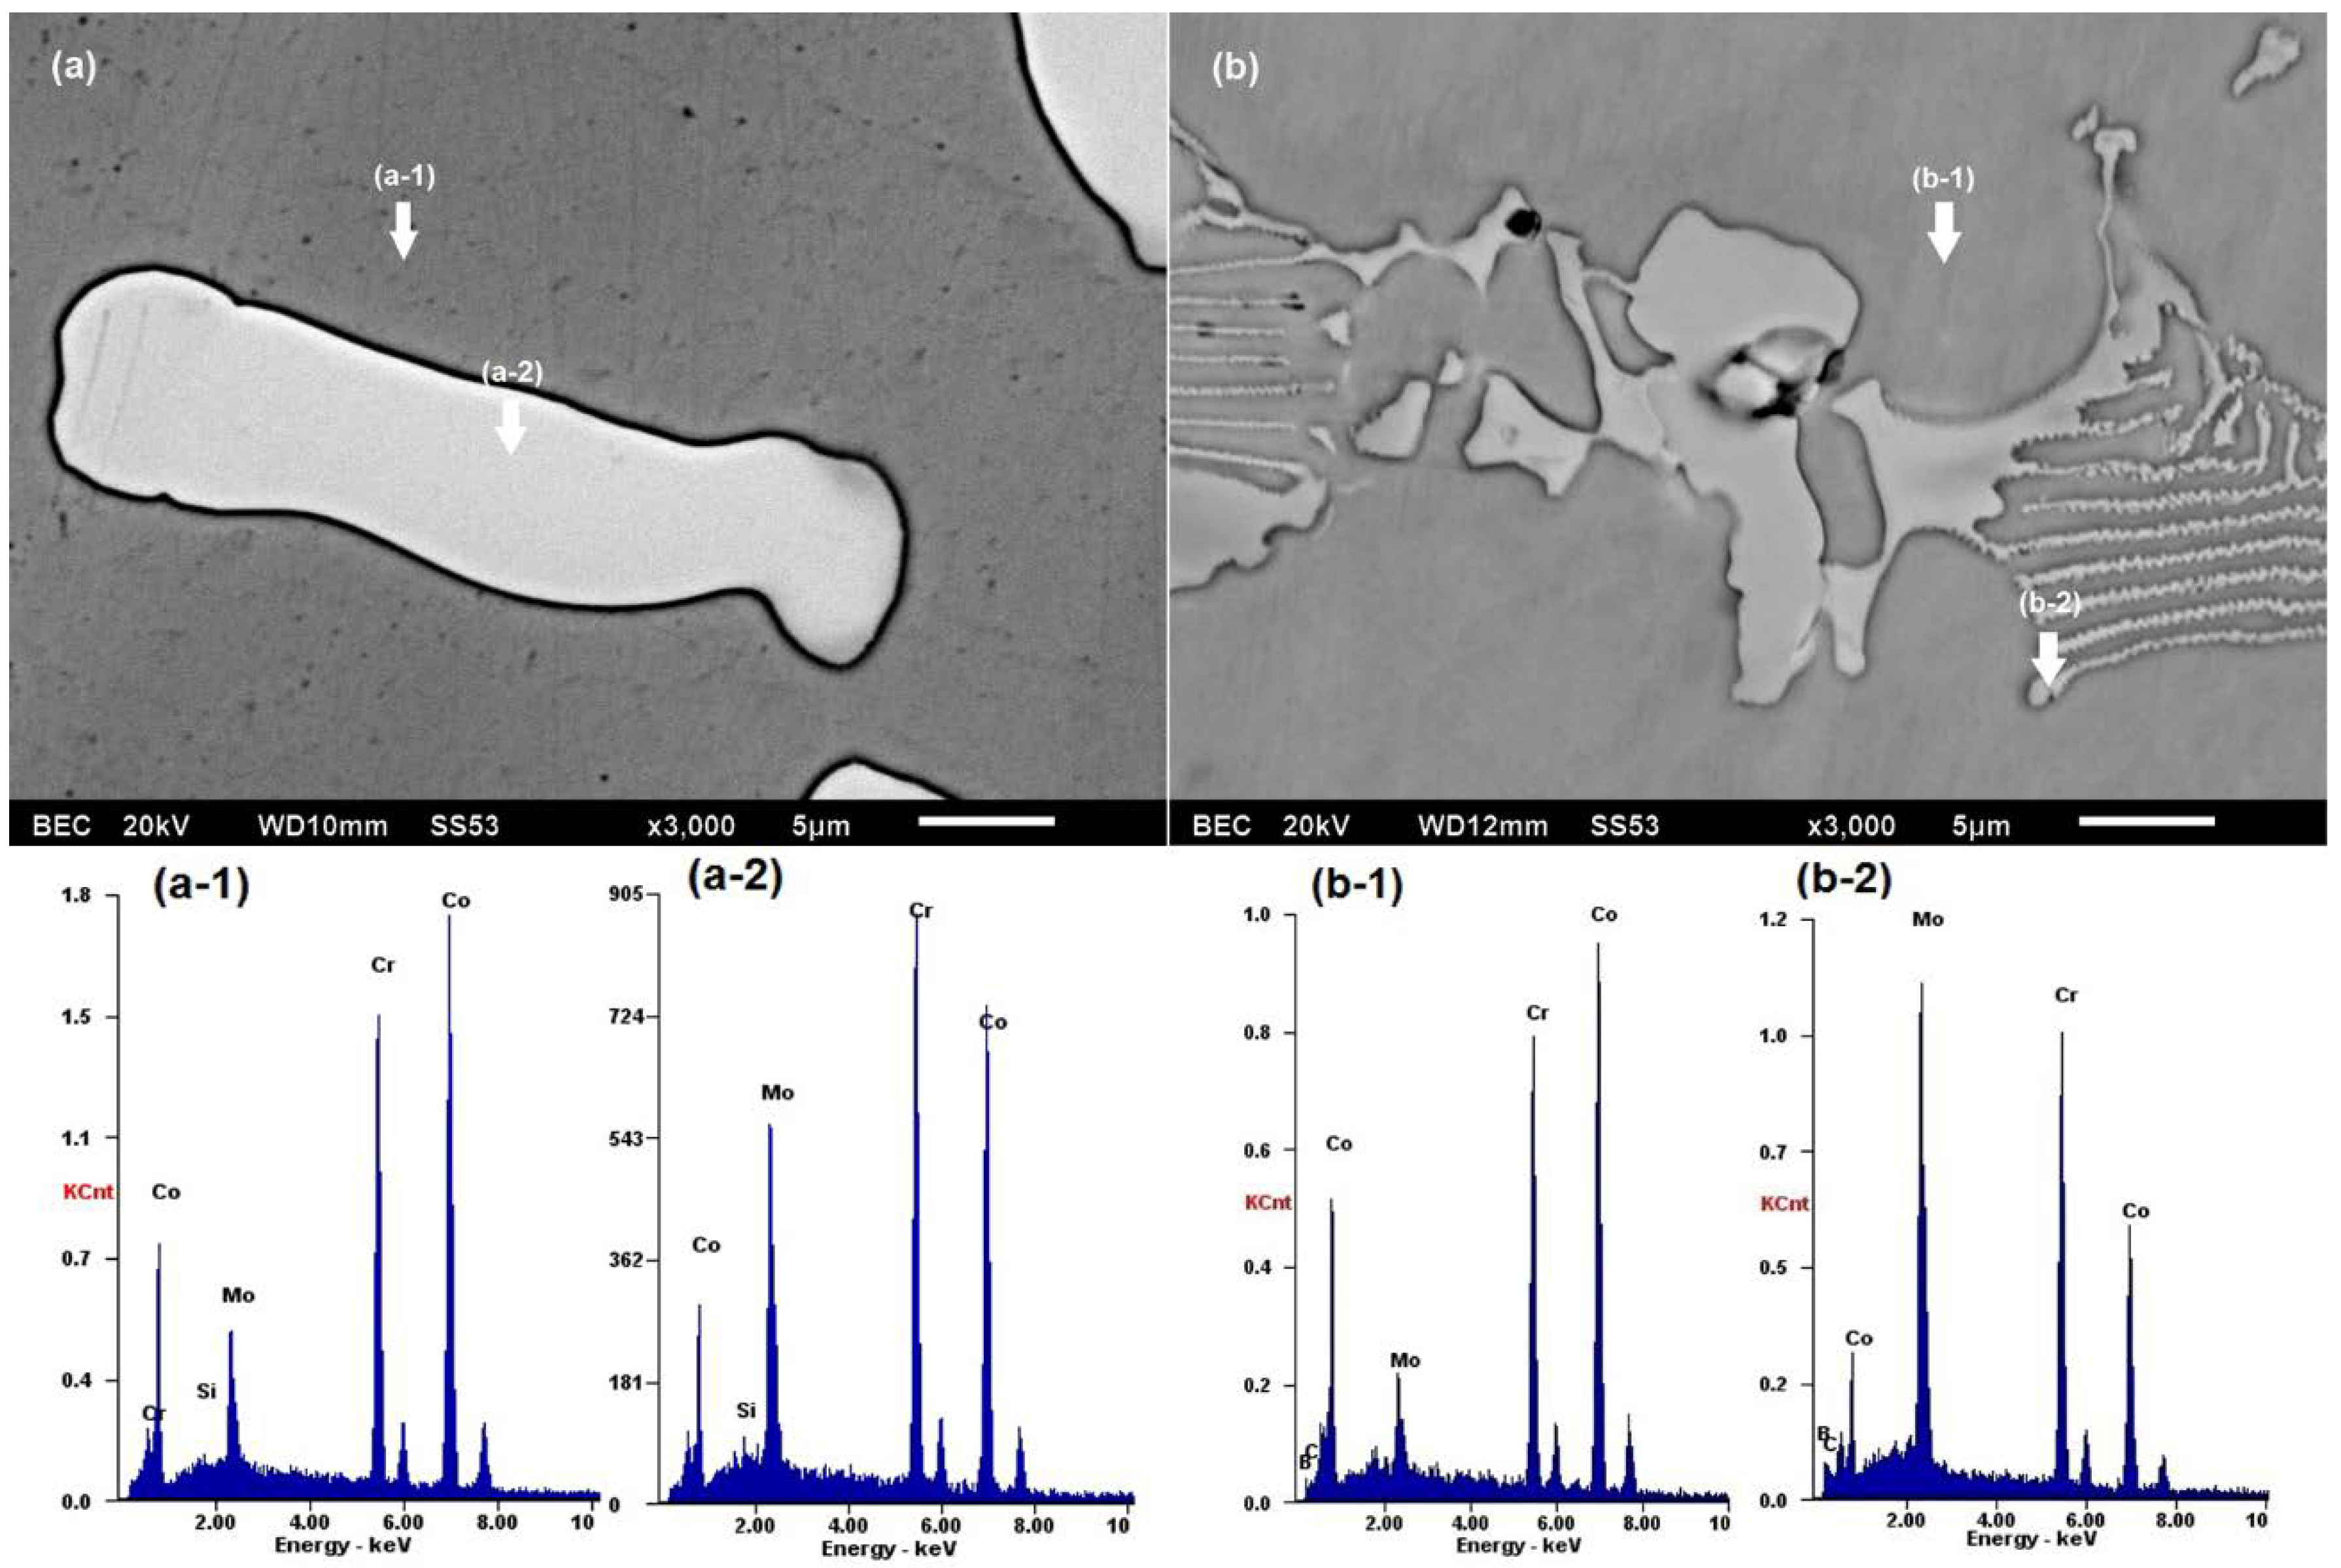
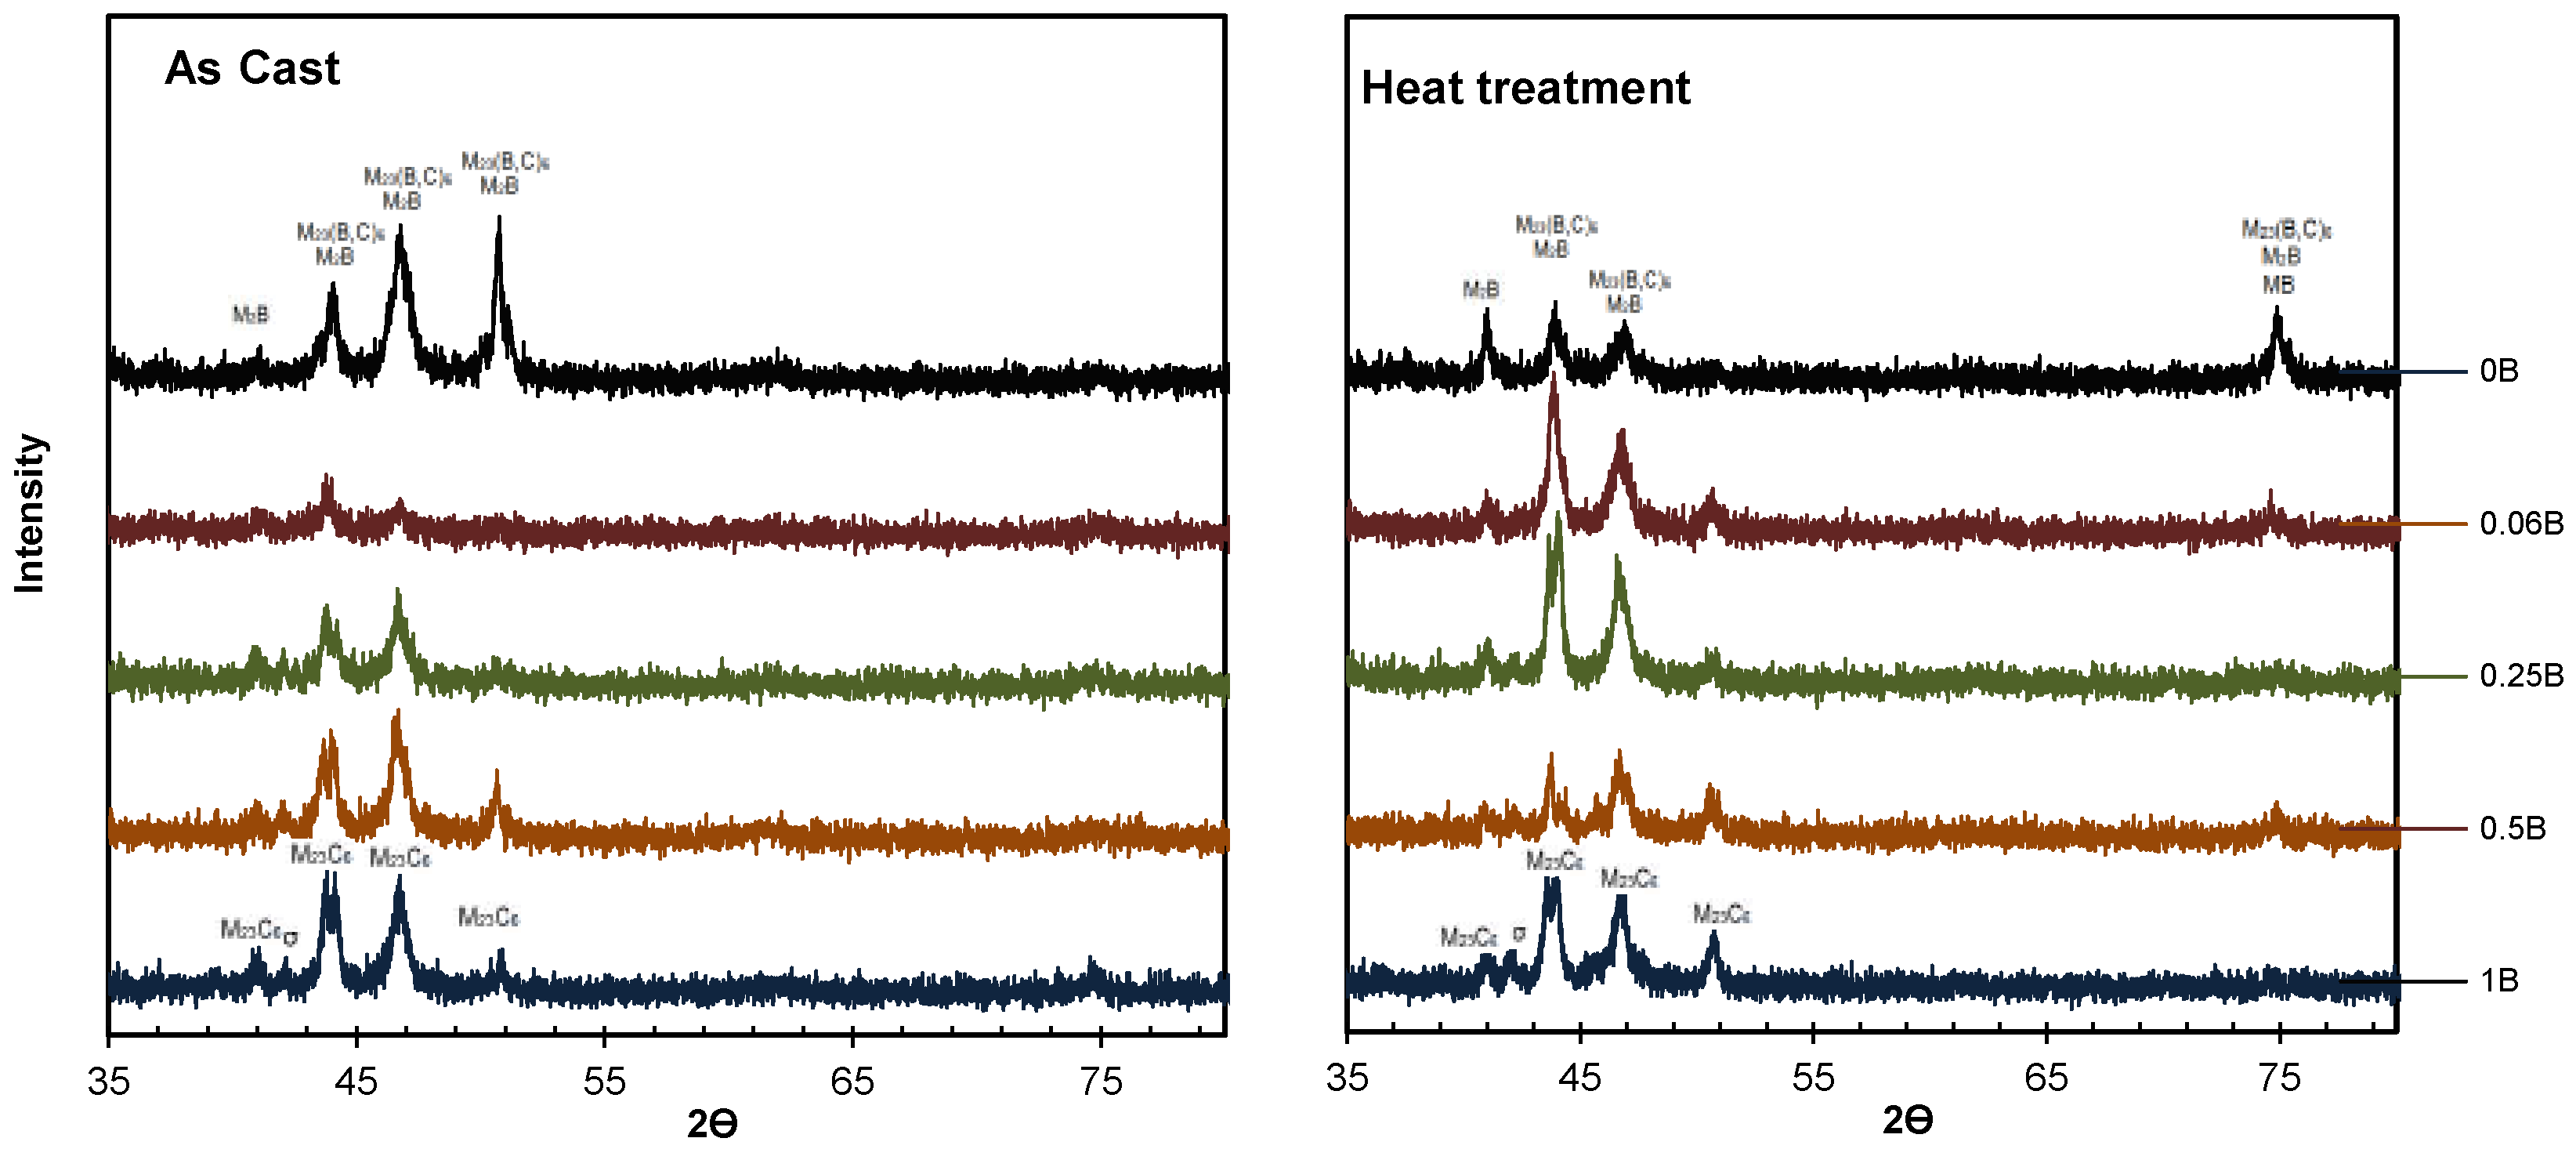
2. Material and Methods

The evaluated cobalt-based alloys similar to ASTM F75 were obtained by investment casting, which is a common method employed for manufacturing orthopedic implants. Elements Co, Cr, Mo, and C of commercial purity were melted in an induction furnace (USA) with a high-alumina crucible under argon atmosphere. Boron was added in the amounts of 0.06, 0.25, 0.5, and 1 wt %. The melting temperature ranged between 1350 and 1480 °C, and it was decreased as the boron content increased. Then, the alloys were poured into ceramic molds which were preheated to 900 °C. The ceramic molds contained a set of twelve specimens of semi-finished shape meant for a further study related to the fatigue resistance of these alloys. The samples for the present study were disks of 35 mm diameter and a 10 mm thickness cut from the mold’s sprue. The chemical analyses of the resulting materials are shown in Table 1.
The samples were analyzed in the as-cast (AC) condition and after a heat treatment (HT) carried out for 1 h at 1200 °C followed by water quenching. In Table 1, the identification codes for the samples according to wt % B and the alloy condition are presented. The surfaces to be evaluated were polished to a mirror finish by standard metallographic procedures. The microstructure of the alloy was characterized by means of optical microscopy in a Nikon Epiphot, scanning electron microscopy (SEM) in a JEOL JSM-6510LV (Tokyo, Japan), and X-ray diffraction (XRD) in a Bruker D8 (Billerica, MA, USA) Advance with Cu Kα as radiation source (λ = 1.54 Å) produced at 40 kV and 30 mA.
The corrosion resistance was evaluated using linear polarization resistance (LPR), electrochemical impedance spectroscopy (EIS), potentiodynamic polarization (PP) curves, and cyclic voltammetry (CV). The experiments were conducted on a GAMRY 750 potentiostat (Warminster, PA, USA). The reference and counter electrodes were Ag/AgCl and graphite, respectively. Prior to the measurements, the samples were ultrasonically cleaned in an alcohol bath and subsequently immersed in a corrosive solution for 21 days. The solution was maintained at 37 ± 1 °C by placing the reaction kettles in a hot water bath. The corrosive solution was phosphate-buffered saline (PBS) and contained NaCl (8 g), KCl (0.2 g), and KH2PO4 (0.91 g) in distilled water (1 L). The PBS solution was changed every 7 days. All experiments were carried out under aerated conditions.
The open circuit potential (OCP) was measured for 15 min before the corrosion tests. LPR was carried out in a potential range from −20 to 20 mV from OCP at 0.5 mV s−1. The i c o r r values were calculated using the Stern–Geary equation by identifying the values of the LPR curves through least squares adjustment in the i = 0 (A) area and about ±10 (mV). The anodic and cathodic gradients ( b a and b c ) were obtained by the extrapolation of the straight areas in the Tafel curve:
( i c o r r = b a b c 2.3   R P ( b a + b c ) )
The EIS was performed using a sinusoidal potential with a 10 mV amplitude and 30000–0.01 Hz frequencies at 0.5 mV s−1. The CV was carried out with a scan rate of 50 mV during four cycles with Es = 1 V and Ef = −1 V. The PP curves were obtained using Es = −0.25 V and Ef = 1.5 V at 5 mV s−1. Each sample underwent LPR and EIS after 0, 7, 15, and 21 days of immersion in the electrolyte and PP after 0 and 21 days. An additional sample was tested by means of CV after 0 and 21 days.

3. Results and Discussion

The microstructural evolution of the alloys under AC and HT conditions is shown in Figure 1 and Figure 2, respectively; changes can be observed according to the different boron contents. In the cases without boron, the alloys exhibit the typical structure made up of a Co matrix, large grains, and blocky and lamellar carbides, which were dissolved after HT as expected [21,22]. With an increase in the boron content, an increase of the second phase presence was also observed; this is more evident at 0.5B and 1B, where the precipitation of borides occurred. The HT resulted in an even distribution of carbides and boron carbides throughout the structure. Figure 3 shows SEM images of microstructures of the base alloy (0 wt % B) and the alloy with the highest boron content (1 wt %) and EDS on the matrix and on a carbide and a boron carbide.
The XRD patterns of alloys in as-cast and heat-treated conditions are shown in Figure 4. We observed the diffraction of carbides, boron carbides, and metallic borides. It is worth mentioning that the sigma phase decreased as boron content increased: its diffraction peak cannot be observed for 0.5 and 1 wt % boron in both as-cast and heat-treated conditions.
Figure 5 shows the OCP plots. The higher potentials were achieved by the AC alloys at Day 0 of immersion and, as the time passed, the potential decreased considerably. On the other hand, the HT samples were more stable and from 0 to 0.25B exhibited more noble potentials; it is outstanding that the 0.06B-HT alloy displayed the best thermodynamic stability with time.

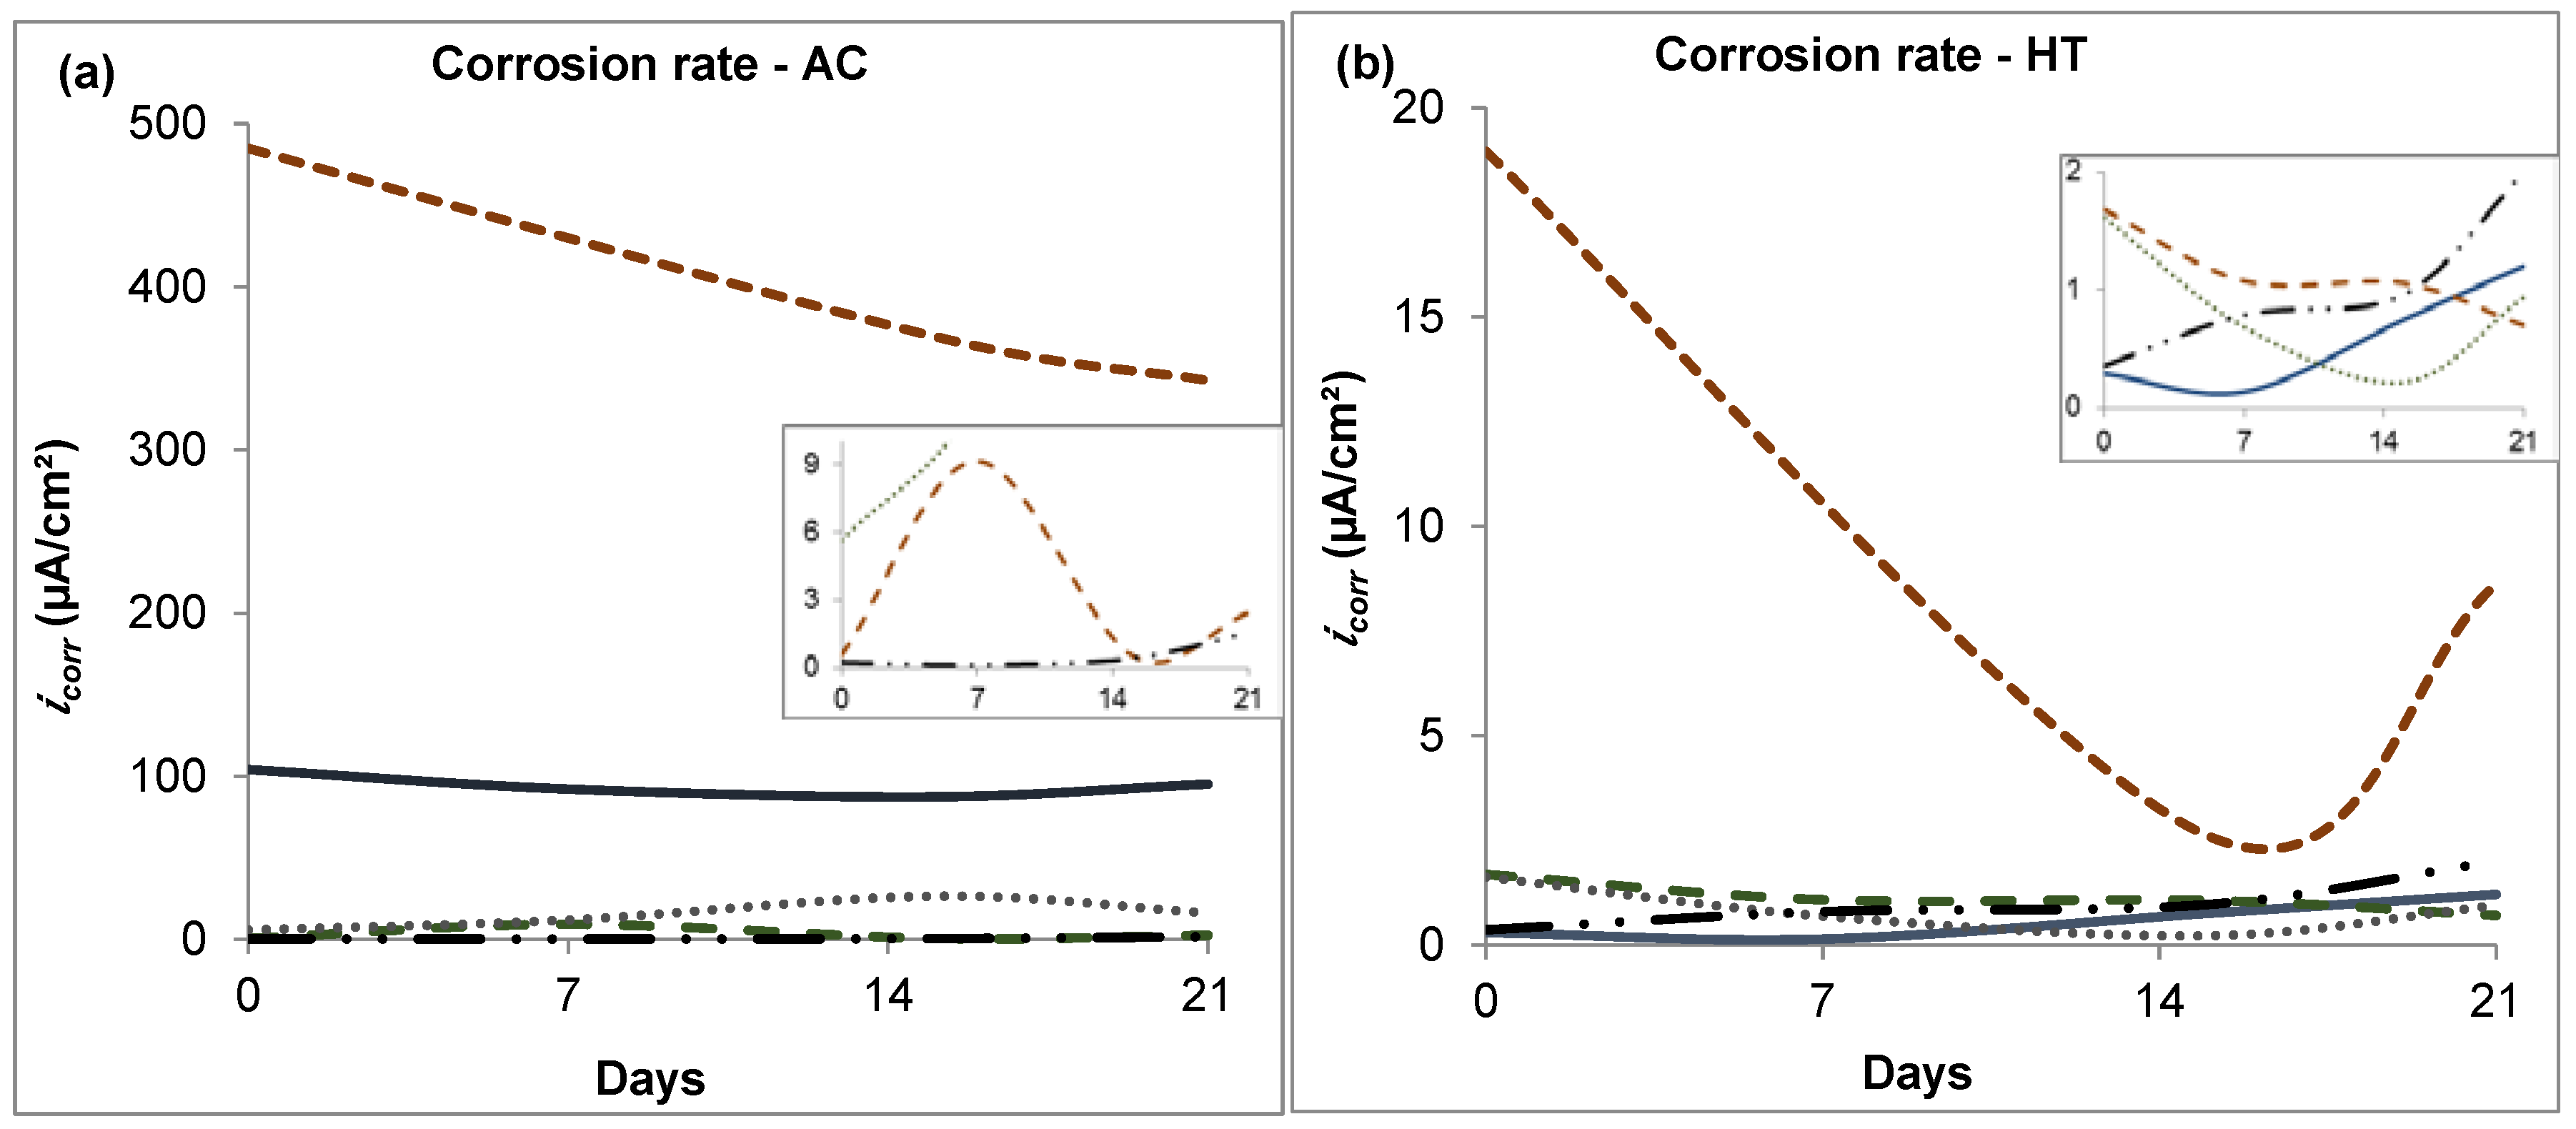
3.1. Linear Polarization Resistance

According to the results presented in Figure 6, the corrosion resistance increased as the boron content was raised, and it was further improved after HT. The low corrosion rates exhibited by the boron alloys are remarkable, especially for those with the highest boron content (1%B), considering the large amount of precipitates. The only exception was the 0.5B-AC sample, which exhibited the highest corrosion rate; despite the great improvement after the HT, it still had the highest icorr among the heat-treated alloys. This could be due to the carbon content in the 0.5B samples since in most alloys it ranged over 0.08–0.12 wt %, while for 0.5B-AC and 0.5B-HT it was 0.22 and 0.26 wt %, respectively. It has been reported that a lower carbon percentage in the chemical composition leads to a better corrosion resistance [23,24]. On the other hand, the 0.06B-HT alloy exhibited the lowest icorr in terms of time; this was the only sample showing a downward trend during the subsequent days and a lower corrosion rate with time. The corrosion rates of the base alloy and alloys with boron contents higher than 0.06% had a slight tendency to increase after 15 days of immersion.
The improved corrosion resistance of the studied alloys could be attributed to the effects of (i) boron, which stabilized the carbon by forming boron carbides, and (ii) heat treatment, which prevented the sensitization by homogenizing the microstructure, as reported for CoCrMo alloys [25,26,27]. In the alloy with 0.06 wt % B and heat treatment we observed the best combination of these two effects; higher boron contents exhibited the same behavior as the base alloy as they showed increased corrosion rates with time. Valero et al. [24] also observed an improvement in the corrosion resistance of CoCrMo alloys as a result of lower carbon content and thermal treatments.

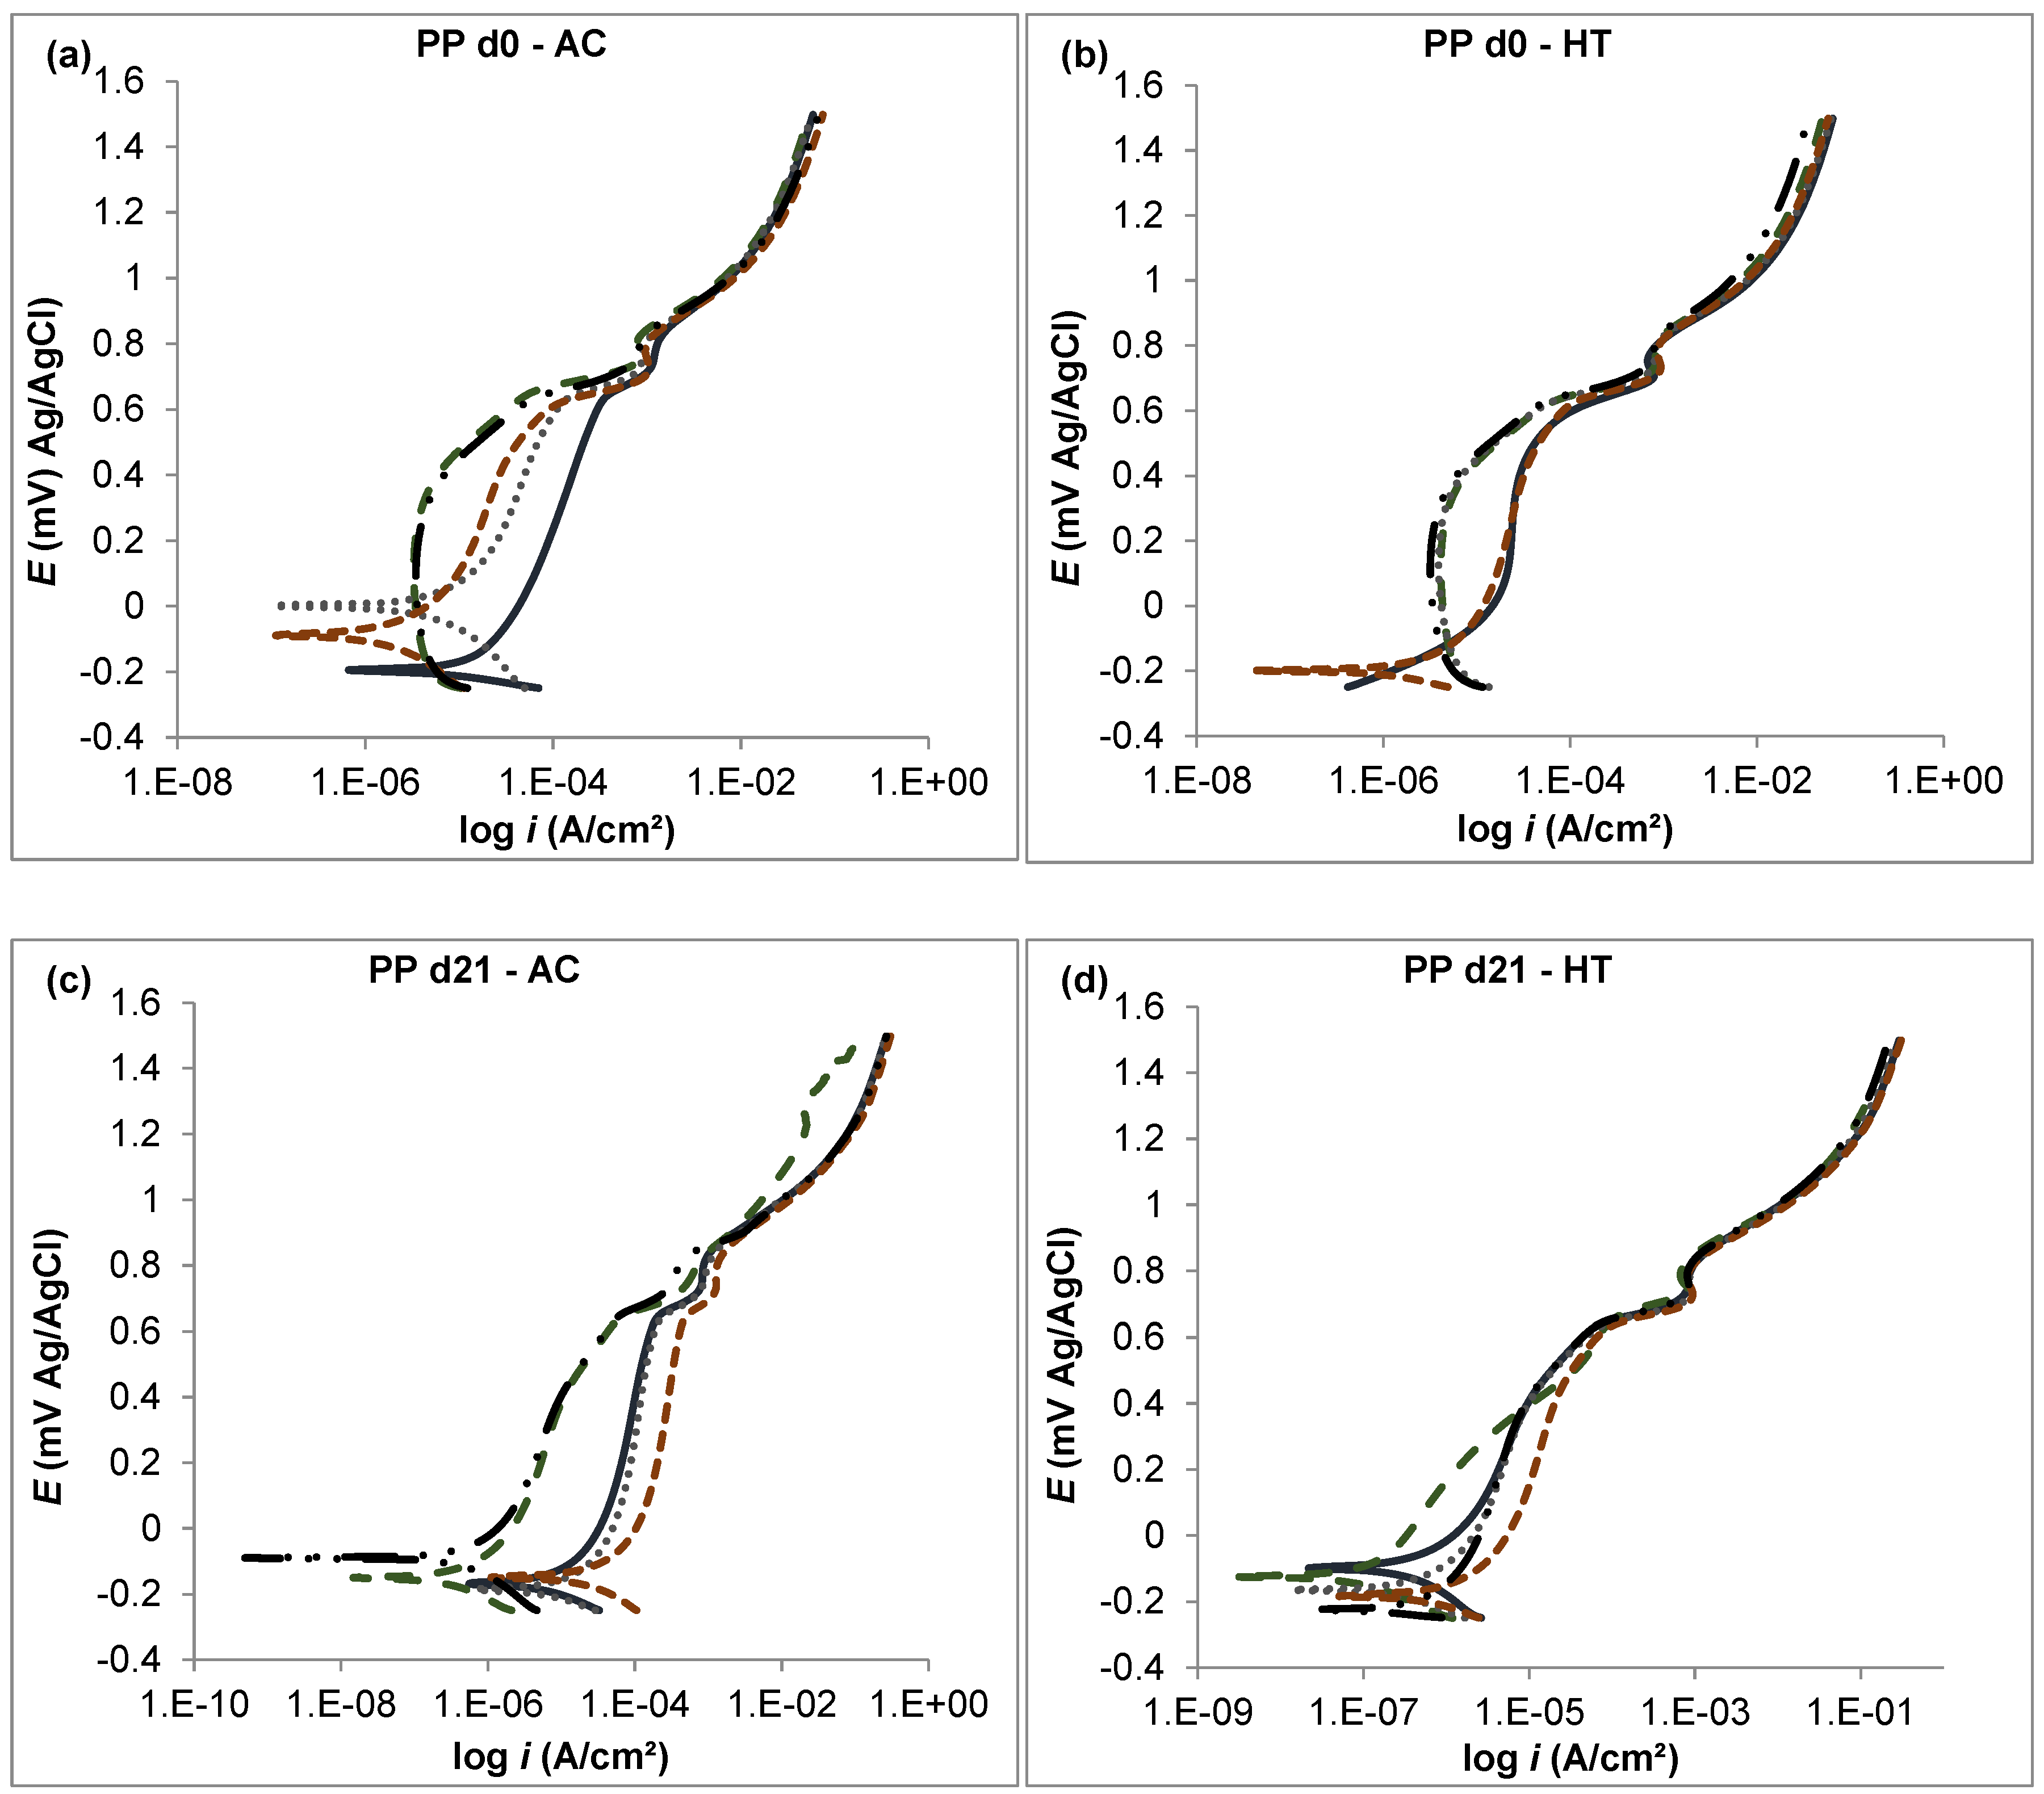
3.2. Potentiodynamic Polarization Curves

The PP curves for Days 0 and 21 of immersion are shown in Figure 7. In both cases, the anodic branch shows a passive zone between −0.2 V and 0.6 V, which indicates the formation of a Cr2O3 film with a lower contribution of cobalt oxides and molybdenum [25,26]. Afterwards, a transpassive peak can be observed at 0.73 V, which could correspond to the thickening of the oxide film with a change in the composition and an increased dissolution rate [28].

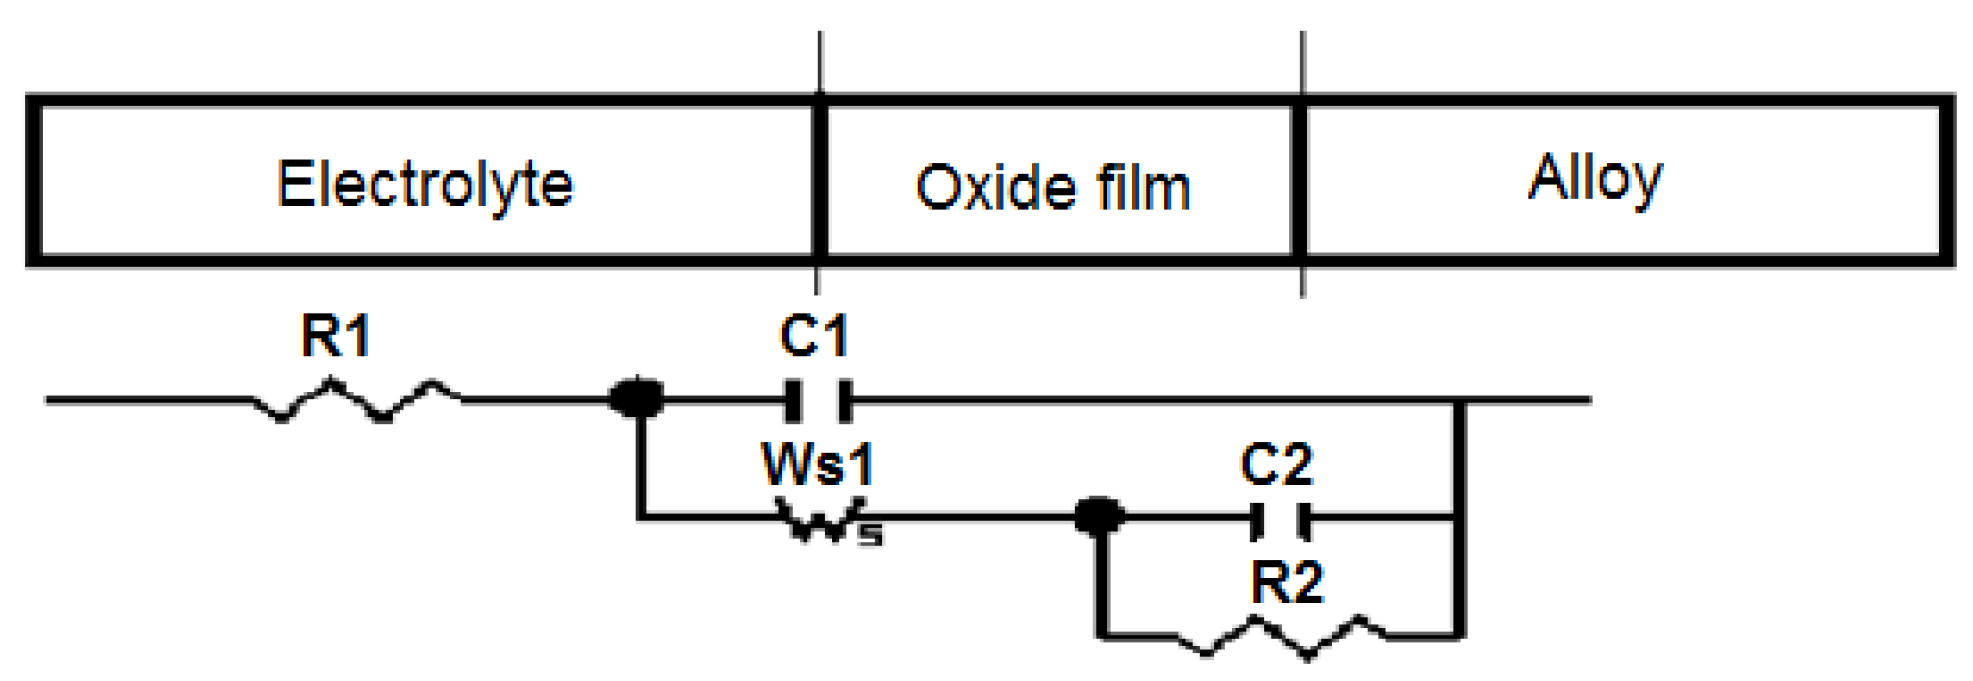
3.3. Electrochemical Impedance Spectroscopy

The EIS results corroborate the formation of a passive layer suggested by the potentiodynamic results. The Nyquist diagram in Figure 8 shows that the 0.06B-HT sample had higher resistance to polarization in terms of time and lower i c o r r .
The equivalent circuit of the 0.06B-HT alloy is shown in Figure 9. It is made up of the resistance to solution (RS); the capacitive element (C1) of the double electrochemical layer related to the interactions occurring in the electrolyte–oxide layer interface; the Warburg impedance (WS), included when diffusive phenomena take place; and the subsystem (C2) and (R2), which represents the oxide layer–alloy interface. The analogue representation of the equivalent circuit points out the formation of the Cr2O3 passive layer and contemporarily indicates that the electrochemical phenomena are controlled by charge transfer via activation and diffusion due to the presence of the Warburg impedance element.

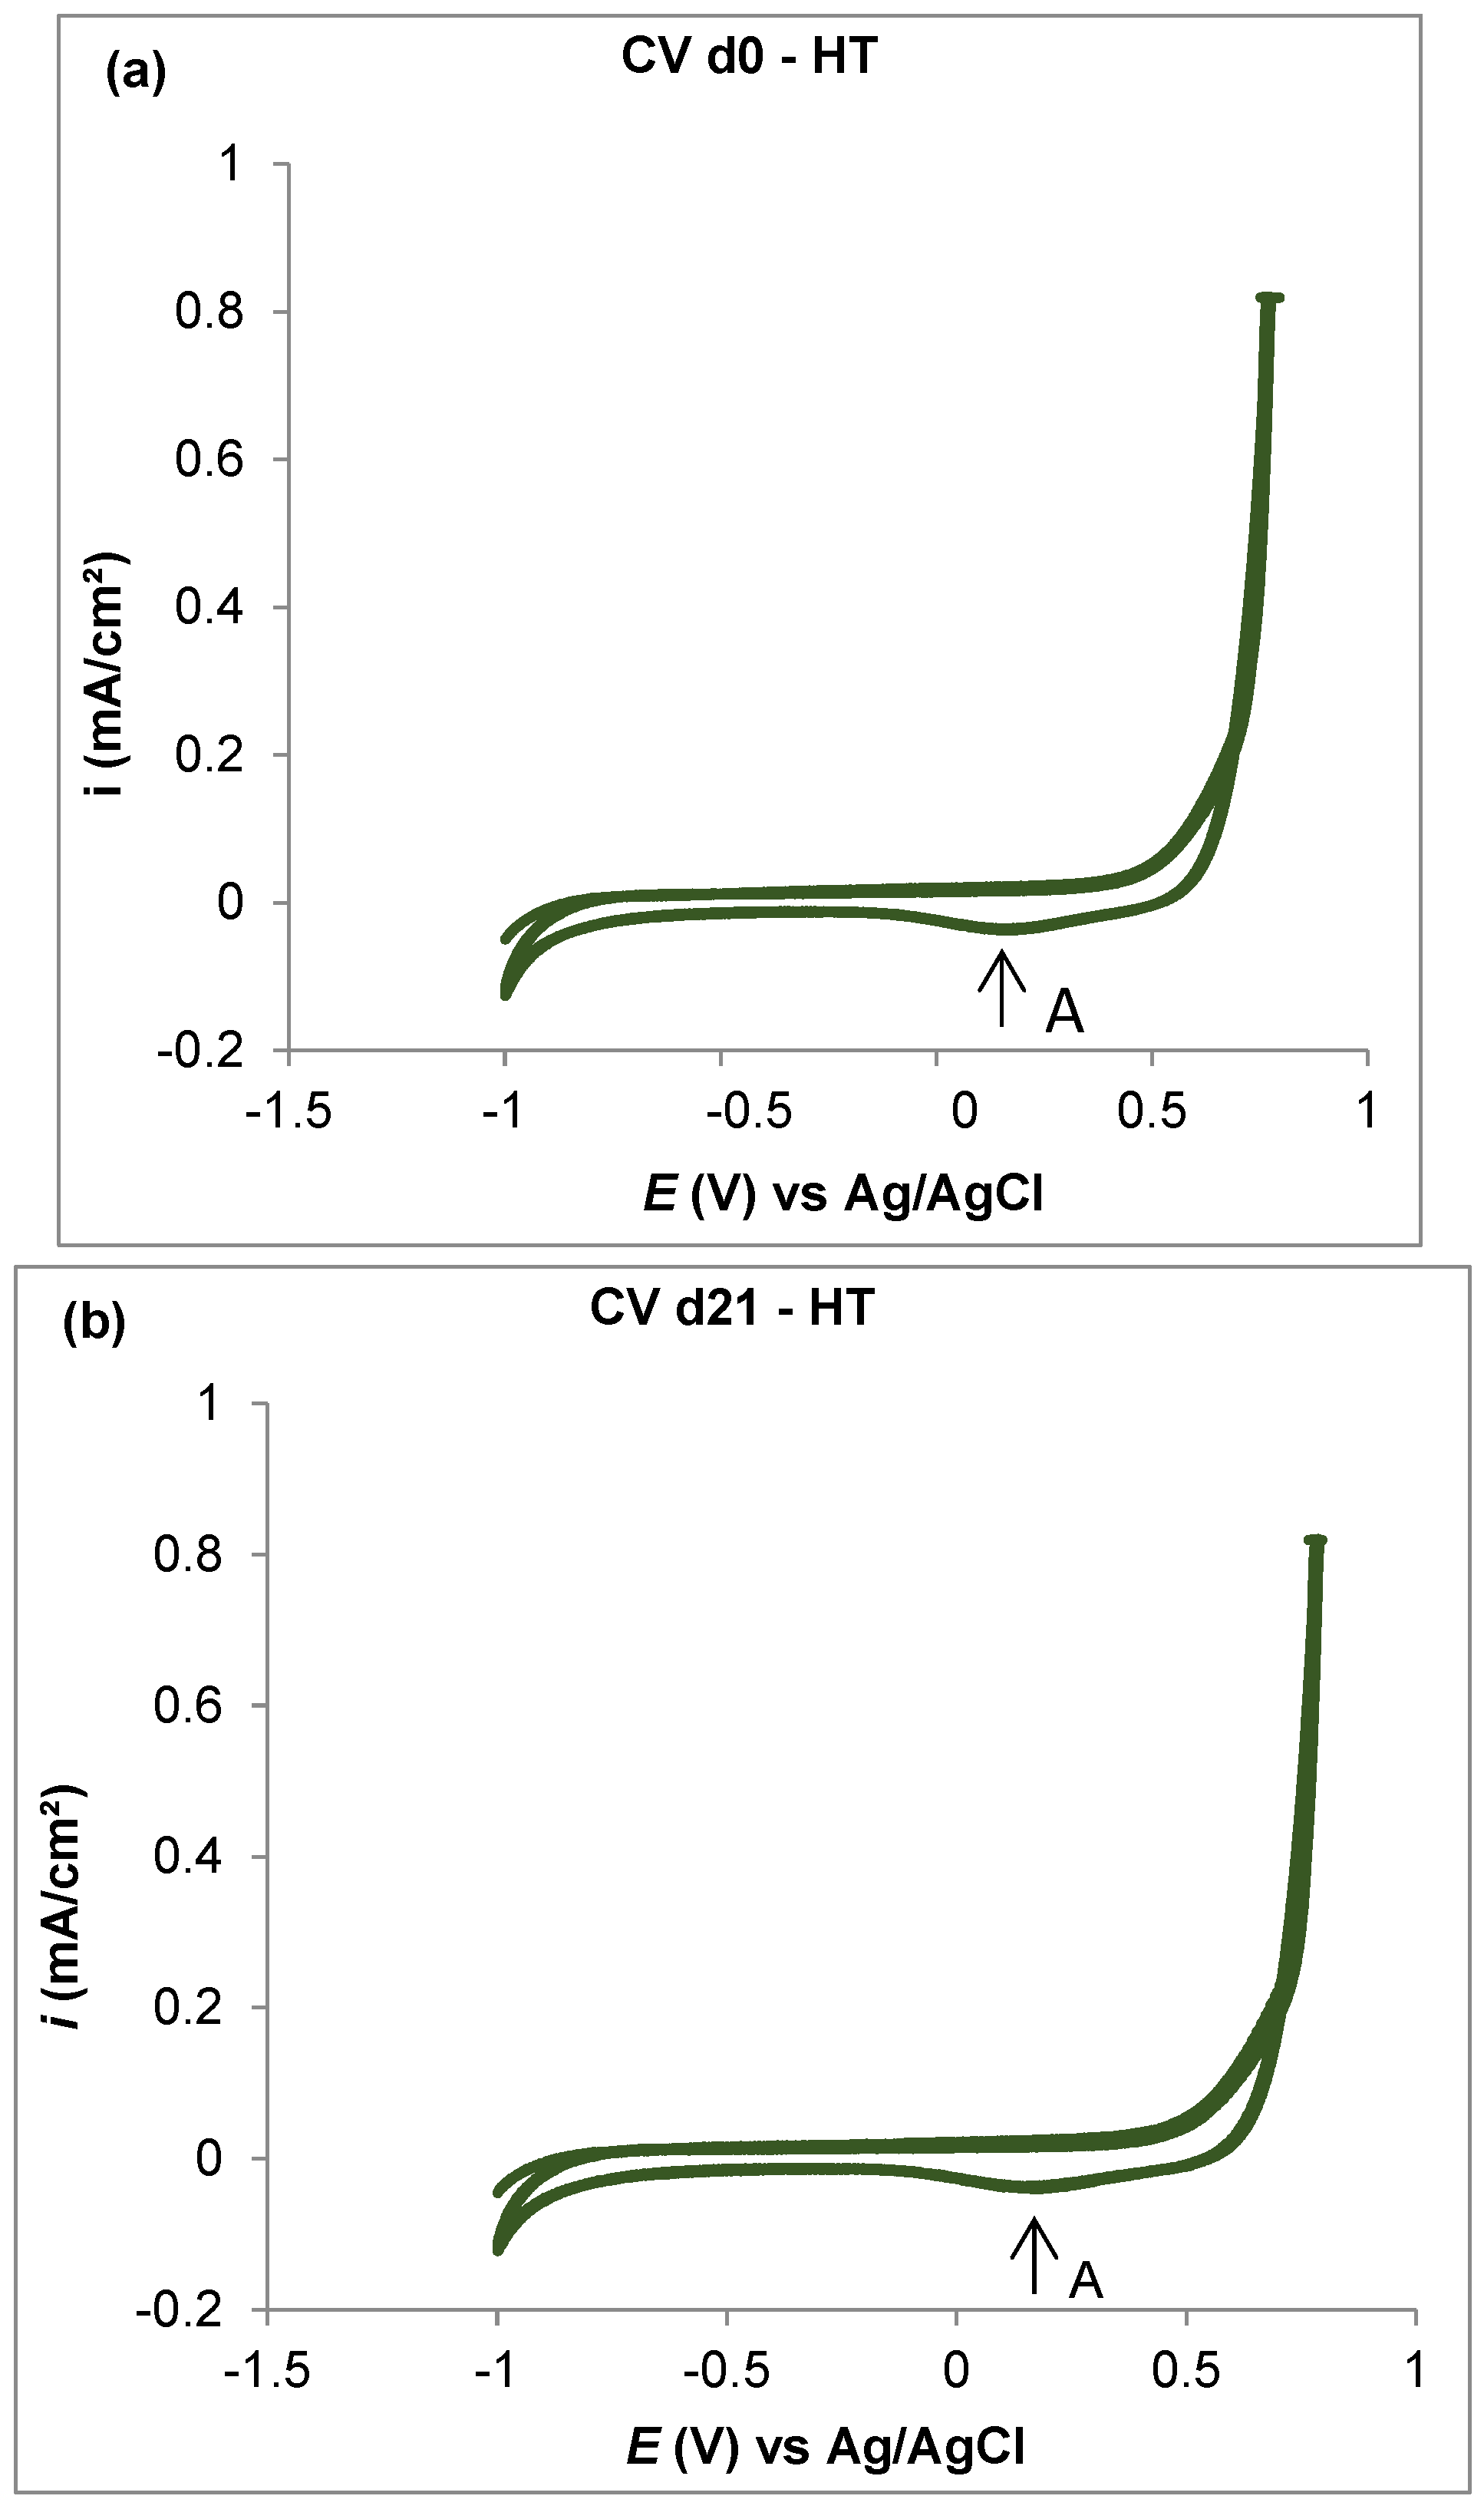
3.4. Cyclic Voltammetry

Considering the good behavior exhibited by the 0.06B-HT alloy against corrosion, the anodic and cathodic peaks were examined in a voltammetrogram. The chromium easily passivated the alloy due to the spontaneous formation of Cr2O3 and the passive area was extended from −0.9 to 0.6 V (Figure 10). For potentials >0.6 V, the alloy underwent transpassivation and oxidation from Cr (III) to Cr (VI). As previously reported, some of the Cr (VI) was incorporated into the passive layer and underwent a reduction process in the solid state at 0.2 V (peak A) [27].

4. Conclusions

  • The corrosion resistance in the analyzed CoCrMo alloys was improved by both boron addition and heat treatment.
  • The alloys with precipitated boron carbides showed good corrosion resistance.
  • The base alloy and most of the boron alloys exhibited a slight tendency to increased corrosion rates after several immersion days.
  • The highest corrosion rate was observed in alloys with the highest carbon content.
  • The heat-treated alloy with 0.06% boron added exhibited the best corrosion resistance during the immersion time (21 days) with respect to the other tested alloys. This was attributed to the combined effects of boron, which stabilized the carbon, and HT, which homogenized the microstructure.

Author Contributions

Research design D.A.L.-C. and M.A.L.H.-R.; testing D.A.L.-C.; data analysis M.A.L.H.-R., Y.B.-G. and G.M.-C.; literature research D.L. and G.M.-C.; manuscript writing Y.B.-G. and D.L.

Conflicts of Interest

The authors declare no conflict of interest.

References

  1. Hanawa, T. Metal ion release from metal implants. Mater. Sci. Eng. C 2004, 24, 745–752. [Google Scholar] [CrossRef]
  2. Hanawa, T. Evaluation techniques of metallic biomaterials in vitro. Sci. Technol. Adv. Mater. 2002, 3, 289–295. [Google Scholar] [CrossRef] [Green Version]
  3. Niinomi, M.; Hanawa, T.; Narushima, T. Japanese research and development on metallic biomedical, dental, and healthcare materials. JOM 2005, 57, 18–24. [Google Scholar] [CrossRef]
  4. Niinomi, M.; Nakai, M.; Hieda, J. Development of new metallic alloys for biomedical applications. Acta Biomater. 2012, 8, 3888–3903. [Google Scholar] [CrossRef] [PubMed]
  5. Chen, Q.; Thouas, G.A. Metallic implant biomaterials. Mater. Sci. Eng. R Rep. 2015, 87, 1–57. [Google Scholar] [CrossRef]
  6. Antunes Altobelli, R.; de Oliveira Lopes, M.C. Corrosion fatigue of biomedical metallic alloys: Mechanisms and mitigation. Acta Biomater. 2012, 8, 937–962. [Google Scholar] [CrossRef] [PubMed]
  7. Okazaki, Y.; Gotoh, E. Comparison of metal release from various metallic biomaterials in vitro. Biomaterials 2005, 26, 11–21. [Google Scholar] [CrossRef]
  8. Lin, H.-Y.; Bumgardner, J.D. Changes in the surface oxide composition of Co-Cr-Mo implant alloy by macrophage cells and their released reactive chemical species. Biomaterials 2004, 25, 1233–1238. [Google Scholar] [CrossRef]
  9. Dobbs, H.S.; Robertson, J.L.M. Heat treatment of cast Co-Cr-Mo for orthopaedic implant use. J. Mater. Sci. 1983, 18, 391–401. [Google Scholar] [CrossRef]
  10. Diabb, J.; Juárez-Hernandez, A.; Colas, R.; Castillo, A.G.; García-Sanchez, E.; Hernandez-Rodriguez, M.A.L. Boron influence on wear resistance in nickel-based alloys. Wear 2009, 267, 550–555. [Google Scholar] [CrossRef]
  11. Bermingham, M.; Bermingham, M.J.; Mcdonald, S.D.; Stjohn, D.H.; Dargusch, M.S. The effect of boron on the refinement of microstructure in cast cobalt alloys. J. Mater. Res. 2011, 26, 951–956. [Google Scholar] [CrossRef]
  12. Opiekun, Z. Kinetics of secondary carbide precipitation in boron-modified cobalt alloys of MAR-M509 type. J. Mater. Sci. 1991, 26, 3386–3391. [Google Scholar] [CrossRef]
  13. Bocchini, P.J.; Sudbrack, C.K.; Noebe, R.D.; Dunand, D.C.; Seidman, D.N. Microstructural and creep properties of boron- and zirconium-containing cobalt-based superalloys. Mater. Sci. Eng. A 2017, 682, 260–269. [Google Scholar] [CrossRef]
  14. Kolb, M.; Freund, L.P.; Fischer, F.; Povstugar, I.; Makineni, S.K.; Gault, B.; Raabe, D.; Müller, J.; Spiecker, E.; Neumeier, S.; et al. On the grain boundary strengthening effect of boron in γ/γ′ Cobalt-base superalloys. Acta Mater. 2018, 145, 247–254. [Google Scholar] [CrossRef]
  15. Zhuang, L.Z.; Langer, E.W. Effects of alloy additions on the microstructures and tensile properties of cast Co-Cr-Mo alloy used for surgical implants. J. Mater. Sci. 1989, 24, 4324–4330. [Google Scholar] [CrossRef]
  16. Zhuang, L.Z.; Langer, E.W. Effects of alloy additions on the fatigue properties of cast Co-Cr-Mo alloy used for surgical implants. J. Mater. Sci. 1990, 25, 683–689. [Google Scholar] [CrossRef]
  17. Campos-Silva, I.; Bravo-Bárcenas, D.; Cimenoglu, H.; Figueroa-López, U.; Flores-Jiménez, M.; Meydanoglu, O. The boriding process in CoCrMo alloy: Fracture toughness in cobalt boride coatings. Surf. Coat. Technol. 2014, 260, 362–368. [Google Scholar] [CrossRef]
  18. Campos-Silva, I.; Bravo-Bárcenas, D.; Meneses-Amador, A.; Ortiz-Dominguez, M.; Cimenoglu, H.; Figueroa-López, U.; Andraca-Adame, J. Growth kinetics and mechanical properties of boride layers formed at the surface of the ASTM F-75 biomedical alloy. Surf. Coat. Technol. 2013, 237, 402–414. [Google Scholar] [CrossRef]
  19. Rodríguez-Castro, G.A.; Reséndiz-Calderon, C.D.; Jiménez-Tinoco, L.F.; Meneses-Amador, A.; Gallardo-Hernández, E.A.; Campos-Silva, I.E. Micro-abrasive wear resistance of CoB/Co2B coatings formed in CoCrMo alloy. Surf. Coat. Technol. 2015, 284, 258–263. [Google Scholar] [CrossRef]
  20. Mu, D.; Shen, B.; Zhao, X. Effects of boronizing on mechanical and dry-sliding wear properties of CoCrMo alloy. Mater. Des. 2010, 31, 3933–3936. [Google Scholar] [CrossRef]
  21. Bedolla-Gil, Y.; Hernandez-Rodriguez, M.A.L. Tribological Behavior of a Heat-Treated Cobalt-Based Alloy. J. Mater. Eng. Perform. 2013, 22, 541–547. [Google Scholar] [CrossRef]
  22. Clemow, A.J.T.; Daniell, B.L. Solution treatment behavior of Co-Cr-Mo alloy. J. Biomed. Mater. Res. 1979, 13, 265–279. [Google Scholar] [CrossRef] [PubMed]
  23. Montero-Ocampo, C.; Salinas Rodriguez, A. Effect of carbon content on the resistance to localized corrosion of as-cast cobalt-based alloys in an aqueous chloride solution. J. Biomed. Mater. Res. 1995, 29, 441–453. [Google Scholar] [CrossRef] [PubMed]
  24. Valero-Vidal, C.; Casabán-Julián, L.; Herraiz-Cardona, I.; Igual-Muñoz, A. Influence of carbides and microstructure of CoCrMo alloys on their metallic dissolution resistance. Mater. Sci. Eng. C 2013, 33, 4667–4676. [Google Scholar] [CrossRef] [PubMed]
  25. Metikoš-Huković, M.; Pilić, Z.; Babić, R.; Omanović, D. Influence of alloying elements on the corrosion stability of CoCrMo implant alloy in Hank’s solution. Acta Biomater. 2006, 2, 693–700. [Google Scholar] [CrossRef] [PubMed]
  26. Hanawa, T.; Hiromoto, S.; Asami, K. Characterization of the surface oxide film of a Co–Cr–Mo alloy after being located in quasi-biological environments using XPS. Appl. Surf. Sci. 2001, 183, 68–75. [Google Scholar] [CrossRef]
  27. Kocijan, A.; Milošev, I.; Merl, D.K.; Pihlar, B. Electrochemical Study of Co-Based Alloys in Simulated Physiological Solution. J. Appl. Electrochem. 2004, 34, 517–524. [Google Scholar] [CrossRef]
  28. Hodgson, A.W.E.; Kurz, S.; Virtanen, S.; Fervel, V.; Olsson, C.-O.A.; Mischler, S. Passive and transpassive behaviour of CoCrMo in simulated biological solutions. Electrochim. Acta 2004, 49, 2167–2178. [Google Scholar] [CrossRef]
Figure 1. Microstructures of the as cast alloys with (a) 0B, (b) 0.06B, (c) 0.25B, (d) 0.5B, and (e) 1B. The images were taken at 200×.
Metals 09 00307 g001
Figure 2. Microstructures of the heat treated alloys with (a) 0B, (b) 0.06B, (c) 0.25B, (d) 0.5B, and (e) 1B. The images were taken at 200×.
Metals 09 00307 g002
Figure 3. Scanning electron microscopy (SEM) images of the microstructures of alloys with (a) 0B and (b) 1B and EDS on the matrix and precipitates.
Metals 09 00307 g003
Figure 4. X-ray diffraction patterns of the studied alloys.
Metals 09 00307 g004
Figure 5. Open circuit potential (OCP) results. (a) As-cast and (b) heat-treated alloys at Day 0 of immersion, and (c) as-cast and (d) heat-treated alloys at Day 21 of immersion; (—) 0B, (─ ─) 0.06B, (∙∙∙∙) 0.25B, (- - - -) 0.5B, and (─ ∙ ∙) 1B.
Metals 09 00307 g005
Figure 6. Evolution of the corrosion rates ( i c o r r ) with the immersion time under (a) as-cast and (b) heat treatment conditions; (—) 0B, (─ ─) 0.06B, (∙∙∙∙) 0.25B, (- - - -) 0.5B, and (─ ∙ ∙) 1B.
Metals 09 00307 g006
Figure 7. Potentiodynamic polarization curves. (a) As-cast and (b) heat-treated alloys at Day 0 of immersion, and (c) as-cast and (d) heat-treated alloys at Day 21 of immersion; (—) 0B, (─ ─) 0.06B, (∙∙∙∙) 0.25B, (- - - -) 0.5B, and (─ ∙ ∙) 1B.
Metals 09 00307 g007
Figure 8. Nyquist diagrams. (a) As-cast and (b) heat-treated alloys at Day 0 of immersion, and (c) as-cast and (d) heat-treated alloys at Day 21 of immersion; (—) 0B, (─ ─) 0.06B, (∙∙∙∙) 0.25B, (- - - -) 0.5B, and (─ ∙ ∙) 1B.
Metals 09 00307 g008
Figure 9. Equivalent circuit for the heat-treated alloy with 0.06% boron.
Metals 09 00307 g009
Figure 10. Voltammetrogram for the heat-treated alloy with 0.06% boron at Days (a) 0 and (b) 21 of immersion.
Metals 09 00307 g010
Table 1. Chemical composition ranges of the tested alloys, wt %.
AlloyCrMoCSiFeBCo
0B-AC279.60.0840.270.600.00Bal.
0B-HT308.30.0600.170.580.00Bal.
0.06B-AC279.40.0980.740.730.06Bal.
0.06B-HT2710.40.0800.530.560.06Bal.
0.25B-AC2810.00.1250.570.360.25Bal.
0.25B-HT2810.20.0650.190.790.25Bal.
0.5B-AC2810.80.2230.730.610.50Bal.
0.5B-HT288.90.2600.580.560.50Bal.
1B-AC279.00.0780.210.451.00Bal.
1B-HT279.70.0870.500.621.00Bal.

