Abstract
The flyer velocity is one of the critical parameters for welding to occur in laser impact welding (LIW) and plays a significant role on the welding mechanism study of LIW. It determines the collision pressure between the flyer and the target, and the standoff working distance. In this study, the flyer velocity was measured with Photon Doppler Velocimetry under various experimental conditions. The laser energy efficiency was compared with measured flyer velocity for various laser energy and flyer thickness. In order to reveal the standoff working window, the peak flyer velocity and flyer velocity characteristic before and after the peak velocity and the flyer velocity was measured over long distance. In addition, the rebound behavior of the flyer was captured to confirm the non-metallurgical bonding in the center of the weld nugget in LIW. Furthermore, the flyer size and confinement layer effect on the flyer velocity were investigated.
1. Introduction
Laser impact welding (LIW) is a relatively novel welding technique. It is one of the solutions for dissimilar materials welding due to its solid state welding nature. Different from explosive welding and magnetic pulse welding, LIW focuses on solving problems in areas like electronics and medical devices. The first U.S. patent of LIW was filed in 2009 by Daehn and Lippold from The Ohio State University [1]. Wang et al. proposed the possible industrial application setup in 2015 for the first time [2]. In recent years, LIW has been studied in joining materials, like aluminum [3,4,5], titanium [3], steel [6], and copper [4,7]. The feasibility and ability of LIW in welding dissimilar materials has been demonstrated.
In the LIW process, a laser goes through the transparent confinement layer and ablates the ablative layer into high temperature and high pressure plasma. The expanding plasma pushes the flyer to move at a high velocity until it collides on the target, where the metallurgical bonding occurs at the collision interface with a proper impact angle. The flyer velocity is one of the critical parameters in LIW [8]. The Hugoniot theory states that the impact velocity (final flyer velocity) determines the impact pressure between the flyer and the target [9,10,11,12]. For LIW, metallurgical bonding occurs when the nascent surfaces are brought within atomic distance. Thus, the collision pressure is required to be sufficient to remove the surface contaminants, oxides, asperities. At the same time, the nascent surface should be pushed within atomic distance by the impact pressure. However, too much pressure will result in melting at the interface [13] and spallation on materials [14]. There are difficulties in measuring the pressure from the experiments directly for impact welding due to the fact that the measurement is destructive. Polyvinylidene Flouride (PVDF) gage was applied in the pressure measurement in impact welding, which is a film type polymer sensor. The measurement is sensitive to the size and location of the gage [15]. The flyer velocity is usually measured directly [16,17], which is a non-destructive method.
In LIW, the current general welding configuration for LIW is spot welding [1]. The central part of the weld nugget does not get bonded between the flyer and the target. The bonding occurs along the edges of the weld nugget [7].The flyer velocity/movement for LIW should be studied to solve this common issue in LIW. Besides that, the experimental setup can be optimized for better laser energy efficiency, which is calculated with the flyer velocity, as shown in Equation (1) (t is the thickness of the flyer, D is the diameter of the laser spot size, v is the flyer velocity, E is the laser energy, ρ is the density of the flyer).
In the study of the laser-driven flyer, the flyer velocity was investigated by Brown et al. [10]. They studied the variation of flyer velocity with a different confinement layer, ablative layer and adhesive. Their study was within a time of 200 ns. In the study of Zhao et al. [18], the effect of laser energy on the flyer velocity was studied, which was also investigated by Shaw-Stewart et al. [19]. The flyer velocity as a function of time was displayed in the study by Paisley et al. [11]. The measured flyer velocity was lower than 500 m/s and the energy efficiency was not calculated for laser energy up to 52 J. In the study of LIW, Wang et al. showed the flyer velocity as a function of time with various laser energy and flyer thickness [2,3]. The laser energy efficiency has not been studied with various laser energy and flyer thickness.
This study investigated the characteristics of the flyer velocity under various conditions with Photon Doppler Velocimetry (PDV), which is much more practical and easier for surface velocity measurement than any other competing techniques [20]. The laser energy efficiency was investigated for various laser energy and flyer thickness by measuring the flyer velocity under those conditions. The study of flyer velocity over long travel distance would propose the proper standoff distance and reveal the plasma working distance. The investigation of flyer rebound behavior should reveal the flyer behavior before, at and after collision with the target. Other than that, the parameters effect on the flyer velocity would provide instructions for the optimization of the current experimental setup.
2. Experimental Setup
The schematic experimental setup is shown in Figure 1. The laser beam passes through the confinement layer and connection layer (double-sticky tape in this study), and vaporizes the ablative layer into hot plasma. The expanding of the plasma separates the confinement layer and flyer. Due to the conservation of momentum, the flyer moves much faster than the more massive confinement layer in the laser incident direction, which is also the flyer thickness direction. PDV measures the flyer velocity during its flying process. The polycarbonate (1 mm thick) between the PDV probe and flyer prevents the direct contact between the flyer and the PDV probe to protect the probe from damage. The pre-set spacer provides the acceleration distance (travel distance) for the flyer velocity to get to a certain value. The distance between the flyer and the polycarbonate (1 mm thick) is called standoff distance/preset distance. The ablative layer was painted on the flyer surface.
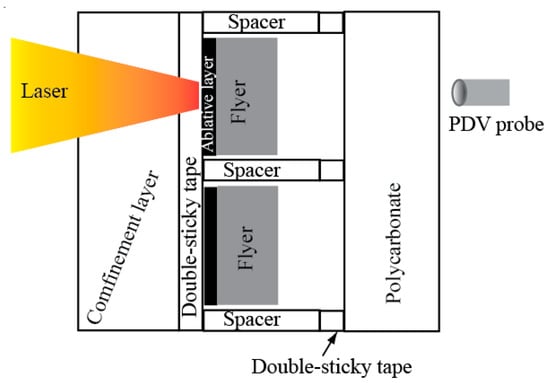
Figure 1.
Schematic experimental setup of the flyer velocity measurement for laser impact welding (LIW).
In this study, the laser system was a commercially available Nd:YAG laser (Continuum, San Jose, FL, USA), which was a Continuum PowerliteTM Precision II Scientific System with a maximum laser energy of 3.1 J and a pulse width of 8 ns. More information about the laser system is provided in [2]. The flyer material was Al1100. Other experimental parameters are listed in Table 1. In this study, the confinement layers included 0.5 mm polycarbonate, 1 mm polycarbonate, 3 mm glass and 5 mm glass. The ablative layer was a commercial black spray paint (RUST-OLEUMTM, Enamel). 1 mm thick polycarbonate was used as the target. Laser beam energies of 3.1 J, 1.9 J and 0.8 J were used. The diameter of the laser beam spot was adjusted by changing the distance between the experimental setup and focus lens, as shown in Figure 2. The power and energy density are shown in Table 2 for laser energies of 3.1 J, 1.9 J and 0.8 J, respectively. Parameters used in this study were defined as follows: E: Laser energy; D: Diameter of laser spot; t: Flyer thickness; v: Flyer velocity; L: Travel distance.

Table 1.
Experimental parameters.
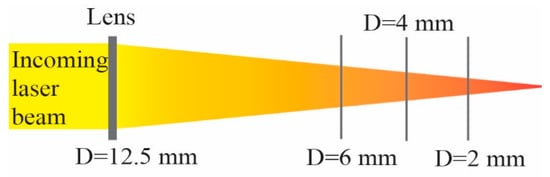
Figure 2.
Laser spot size variation by changing the distance between the focus lens and the sample.
Table 2.
Laser beam power density and energy density at various laser spot sizes.
3. Photon Doppler Velocimetry
Photon Doppler Velocimetry (PDV) is an advanced technique, which is used to measure the flyer velocity [20]. In this study, the PDV system used an erbium fiber laser with a wavelength of 1550 nm. It was designed such that the original laser beam was divided into two equal beams. One beam was directly sent back to the detector while the other beam was delivered to point to the surface of a moving target. This beam was reflected by the moving target surface and was also sent to the detector. By mixing the original and reflected beams, a beat frequency was generated by the detector. The signal with beat frequency was displayed with an oscilloscope (digitizer). The velocity of the moving target v was equal to the beat frequency fb times a half of the laser wavelength λ, as shown in Equation (2). Detailed information about the PDV system used in this study was discussed in [21]. In this study, during the experiment, the PDV system was triggered by the Q-switch of the laser system to start recording.
4. Results and Discussion
4.1. Laser Energy Efficiency at Various Laser Energy and Flyer Thickness
The flyer velocity for various laser energy and flyer thickness was measured. Some of the results have been reported in [2,3]. In LIW, the flyer velocity reached above 1000 m/s within 0.2 μs (E = 3.1 J, t = 25 μm, D = 2 mm). The laser energy efficiency is one of the main factors for the industrial application of LIW. In this study, the laser energy efficiency was calculated for various laser energies (3.1 J, 1.9 J and 0.8 J) and flyer thicknesses (25 µm, 75 µm, 100 µm, 125 µm, and 150 µm) at a flyer travel distance of 100 µm and 2 mm laser spot size. Table 3 lists the flyer velocities used for the laser energy efficiency calculation at the flyer travel distance of 100 µm and 2 mm laser spot size. The flyer velocity increased with laser energy and decreased with flyer thickness. The laser energy efficiency was calculated with Equation (1), as shown in Figure 3. The laser energy efficiency decreased with laser energy for all thickness flyers. This indicated that there was more laser energy wasted by increasing the laser energy when the laser energy density was above 2.55 × 10⁵ J/m2. The previous study also revealed that the flyer velocity increased dramatically when the laser energy density was below 2.55 × 10⁵ J/m2. Above 2.55 × 10⁵ J/m2, the flyer velocity formed a plateau [3]. Therefore, the absorption limit of the current ablative layer should be close to 2.55 × 10⁵ J/m2. This resulted in the laser energy efficiency decreasing by increasing the laser energy. Laser energy efficiency was not affected by flyer thickness.
Table 3.
Flyer velocities (m/s) with various laser energy and flyer thickness (D = 2 mm, L = 100 µm).
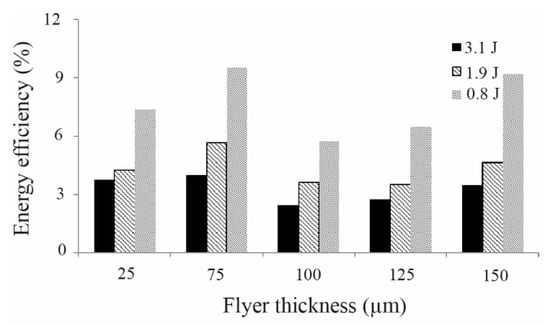
Figure 3.
Energy efficiency with various laser energy and flyer thickness (D = 2 mm, L = 100 µm).
4.2. Flyer Velocity Over a Long Travel Distance
The preset standoff distance provided the acceleration distance for the flyers. This study would reveal the proper standoff distance for LIW. In this experiment, the preset standoff distance was 32.5 mm. The experiment was carried out with 114 µm thick flyer at a laser energy of 3.1 J and laser spot size of 5.5 mm. Figure 4 shows the flyer velocity and travel distance as a function of time for the first 12 µs travel time. The flyer velocity had a dramatic increase at the beginning of the flying time and then gradually increased to the peak velocity at a travel distance of 4 mm. Therefore, a standoff distance up to 4 mm should work under these experimental conditions. After the peak velocity, due to aerodynamic resistance, the flyer velocity started to reduce. Before the flyer reached the peak velocity, the pressure from plasma was higher than aerodynamic resistance. Based on the theory of aerodynamics, the aerodynamic resistance increases with the objective speed [22]. During the acceleration process, the aerodynamic resistance kept increasing while the pressure from the plasma kept decreasing due to its expansion. When the pressure from the plasma was lower than aerodynamic resistance, the flyer velocity started to decrease. Thus, the aerodynamic resistance started to decrease. From the beginning to a travel distance of 257 μm, over 80% of the peak velocity was reached. Therefore, the standoff working window was wide. During long distance flying (over 4 mm), the shape of the flyer gradually changed from a disc to an irregular shape due to its interaction with air. With the peak velocity, the energy efficiency was 27%.
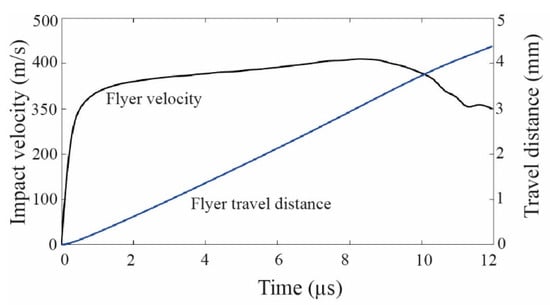
Figure 4.
Flyer velocity and travel distance as a function of time (E = 3.1 J, D = 5.5 mm, t = 114 μm).
4.3. Flyer Rebound Behavior
In LIW, the current weld configuration is spot weld. The size of the nugget is the laser spot size. The cross section of the nugget shows that the metallurgical bonding occurs along the edge of the nugget. There is no metallurgical bonding in the center of the nugget. At the non-welded region within the nugget, the flyer and the target is separated from each other. On the separated flyer and target, both metallurgical bonding trace (Gaussian laser) [7] and non-metallurgical bonding (top-hat laser) [5] were observed. The metallurgical bonding trace on the separated flyer and target indicated that the metallurgical bonding was teared after its formation. The non-metallurgical bonding was due to the fact that the welding parameters were not suitable for metallurgical bonding to occur. Wang et al. studied the flyer flying behavior through a high speed camera [2]. The high speed camera video showed that the center part of the flyer travelled at the highest speed. Therefore, the center part of the flyer contacted the target first. Both the high speed camera result and metallurgical bonding confirmed the contact between the central part of the flyer and target. The rebound of the flyer must have occurred after contact, which resulted in the separation of the flyer and target. This study was carried out in order to reveal the flyer behavior before, at and after collision with the target. In this experiment, the flyer thickness was 250 μm with a laser energy of 3.1 J and laser spot size of 2 mm.
Figure 5a is the output of Photon Doppler Velocimetry, from which Figure 5b was derived through Fourier-transformation. Figure 5b shows a sudden change in the beat frequency around 1.3 s. This change should be caused by the sudden movement of the flyer, which directly affected the beat frequency. At this point, the flyer travel distance reached the standoff distance, which was 350 μm. Therefore, the continuum movement of the flyer should be after collision with the target and in the opposite direction. For the following movement, the velocity started to decrease due to the drag force from the movement of other part of the flyer in the opposite direction until it stopped. By calculation, Figure 5c,d showed the flyer velocity and travel distance before and after collision with the target. The rebound velocity reached 80% of the flyer impact velocity. The rebound travel distance was about 150 μm, which was the separation distance between the flyer and the target. This observation is valuable for future accurate measurement of flyer rebound behavior and its elimination. The rebound behavior was due to the shock wave generated within the flyer and target after their collision. Actions should be taken to absorb or reduce the reflected shock wave from the collision interface. Increasing the metallurgical bonding strength between the flyer and target may be a good way to prevent the tearing. In explosive welding, the rebound phenomenon has not been reported widely while good metallurgical bonding has been reported along the collision interface [13,23,24]. There are also shock waves on the collision interface in explosive welding. The metallurgical bonding was not teared by the reflected shock waves, which indicated that the welding strength was high enough to prevent the tearing.
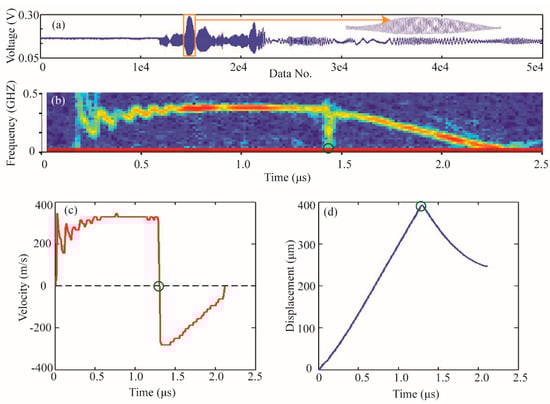
Figure 5.
(a) Data from the detector of Photon Doppler Velocimetry, (b) beat frequency of the flyer, (c) flyer velocity, (d) flyer travel distance, (E = 3.1 J, D = 2 mm, t = 250 μm).
4.4. Parameter Effect on the Flyer Velocity
4.4.1. Flyer Size Effect
The flyer thickness effect on the flyer velocity has been studied by Wang et al. [3]. Their results showed that the flyer thickness had a significant effect on the flyer velocity. It decreased with flyer thickness increase. The width and length effect on the flyer velocity was investigated in this study. If the flyer size was larger than the laser spot size, when the laser incident part of the flyer started to move, the connection between the rest part of the flyer and the confinement layer applied a drag force to the flying part. This drag force was resistance to the flyer movement. In another way, the hot plasma should also be confined by the connection between the rest part of the flyer and the confinement layer. If the flyer had the same size with the laser spot, at the time the flyer started to move, the plasma escaped from the circumferential direction immediately. Thus, the pressure from the plasma should decrease. This study was conducted to study the flyer size effect on the flyer velocity due to the dual effect of the flyer size: Drag effect and confinement effect.
The experiment was conducted under the following conditions: 3.1 J laser energy, 4 mm laser spot size, 75 μm thick flyer, 5 mm thick glass (confinement layer). The dimension of the flyers were 12 mm × 12 mm, 7 mm × 7 mm and 4 mm × 4 mm. Due to fact that the laser spot size was 4 mm, for 4 mm × 4 mm flyer, there was no drag effect and confinement effect. After laser shot, the whole piece of flyer moved at the same time instantaneously. For flyers with a dimension of 12 mm × 12 mm and 7 mm × 7 mm, the dual effect from the flyer size started to play their roles. Figure 6 shows the measured flyer velocity for flyers. Experiments were repeated four times for each experimental condition. The results showed good repeatability in terms of acceleration and final velocity. The average final velocity and travel distance were displayed in Figure 7. The average velocities were 686 ± 35 m/s, 664 ± 16 m/s and 666 ± 20 m/s for 12 mm × 12 mm, 7 mm × 7 mm and 4 mm × 4 mm, respectively. The travel distances were 472 ± 32 μm, 458 ± 13 μm and 462 ± 14 μm for 12 mm × 12 mm, 7 mm × 7 mm and 4 mm × 4 mm, respectively. Therefore, there was no dramatic change of the flyer velocity when the flyer dimension increased from 4 mm × 4 mm to 12 mm × 12 mm. With the flyer size increase, both drag effect and confinement effect would increase. The 3% increase of the flyer velocity from 4 mm × 4 mm to 12 mm × 12 mm may indicated that the confinement effect started to dominate. Before the domination, there must be a flyer size with which the dual effect cancelled each other. However, if the flyer size was infinitely large, the movement of the central part of the flyer would result in plastic deformation (instead of peeling the rest of the flyer from the confinement layer) on the flyer in the region next to the moving part. This deformation would reduce the flyer velocity by consuming some flyer dynamic energy.
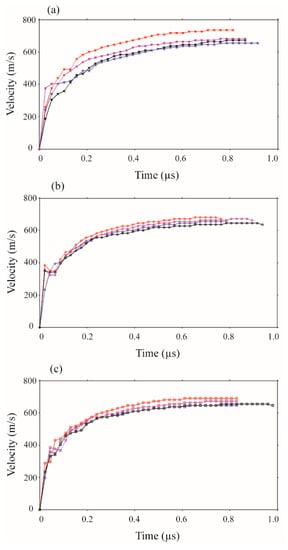
Figure 6.
Flyer Velocity for flyers with dimensions of (a) 12 mm × 12 mm, (b) 7 mm × 7 mm, (c) 4 mm × 4 mm (E = 3.1 J, D = 4 mm, t = 75 μm, L = 525 µm).
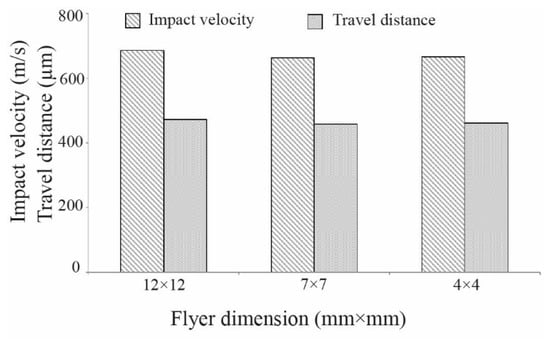
Figure 7.
Average flyer velocity and travel distance for flyers with dimensions of 12 mm × 12 mm, 7 mm × 7 mm and 4 mm × 4 mm (E = 3.1 J, D = 4 mm, t = 75 μm, L = 525 µm).
4.4.2. Confinement Layer Effect
Confinement layer effect on laser energy efficiency was studied by Wang et al. [2] in means of measuring the dimple height, which was the result of flyer deformation after laser shot. They studied 1mm thick glass, 0.5 mm thick polycarbonate and 0.07 mm thick tape. Their results showed that glass was the one that provided the highest energy efficiency. In this study, the confinement layer effect on flyer velocity was investigated. The studied confinement layers in this work included 0.5 mm thick polycarbonate (0.5mmP), 1 mm thick polycarbonate (1mmP), 1 mm thick glass (1mmG) and 5 mm thick glass (5mmG). The experiments were carried out with a 25 μm thick flyer at a laser energy of 3.1 J and laser spot size of 4 mm with a preset standoff distance of 325 μm. The flyer velocity as a function of time was shown in Figure 8a. The average flyer velocity was shown in Figure 8b. The flyer travel distance as a function of time was shown in Figure 8c. The flyer velocity increased with time until the preset standoff distance was reached. One of the two experiments (under the same experimental conditions) with polycarbonate as the confinement layer travelled a much longer time/distance than the other experiment. The average flyer velocities were 727 m/s, 710 m/s, 759 m/s and 759 m/s for confinement layers of 0.5mmP, 1mmP, 1mmG and 5mmG, respectively. The average travel distances were 441 μm, 415 μm, 362 μm and 354 μm for confinement layers of 0.5mmP, 1mmP, 1mmG and 5mmG, respectively. Therefore, the confinement layers had little effect on flyer velocity and a significant effect on travel distance.
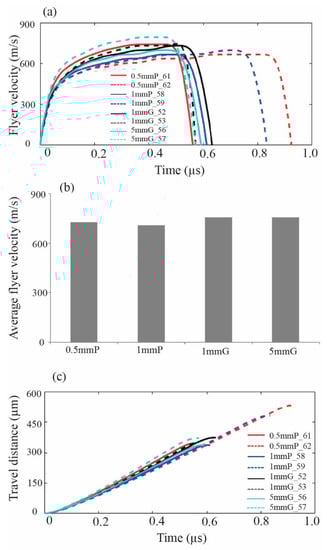
Figure 8.
(a) Flyer velocity as a function of time, (b) average flyer velocity with various confinement layers, (c) flyer travel distance as a function of time (E = 3.1 J, D = 4 mm, t = 25 μm, 0.5mmP_61: 0.5 mm thick polycarbonate as the confinement layer for experiment number 61, 1mmG_52: 1 mm thick glass as the confinement layer for experiment number 52).
As shown in Figure 8a, the acceleration process was very short. Within 0.2 μs, over 80% of the final velocity had been reached. Within 0.2 μs, the flyer travelled around 100 μm. Therefore, even though flyers with a confinement layer of 0.5mmP_62 and 1mmP_59 travelled much longer than 0.5mmP_61 and 1mmP_58, the final flyer velocities were not affected significantly. As shown in Figure 8c, the travel distance with polycarbonate had a large variation between experiments while travel distance with glass had much better repeatability. Therefore, stiffness of confinement layer played a significant role in controlling the repeatability of experiments. As Figure 1 shows, the confinement layer was shared by flyers. For a low stiffness material, laser shot may cause its deformation. This deformation would affect the preset standoff distance for the nearby flyers. Therefore, if the travel distance had a strict requirement, the following procedures should be followed. First of all, the confinement layer would be replaced by a more rigid plate, like glass. Super glue would be used to connect the standoff and target instead of sticky tape to prevent the nearby polycarbonate deformation effect on the preset standoff distance.
5. Conclusions
In this study, the flyer velocity was measured with Photon Doppler Velocimetry under various experimental conditions. The flyer characteristics were revealed through the measurement, which was analyzed and summarized below.
- The energy efficiency was calculated with the measured flyer velocity. Above a laser energy density of 2.55 × 10⁵ J/m2, the energy efficiency decreased with laser energy increase. Flyer thickness had no apparent effect on laser energy efficiency.
- In LIW, the flyer velocity had a dramatic increase at the beginning of the flying, then gradually increased to the peak velocity with a travel distance of 4 mm. From the beginning to a travel distance of 257 μm, over 80% of the peak velocity was reached. Therefore, the standoff working window is wide for LIW.
- The flyer behavior of before, at and after collision with the target was captured with PDV measurement. The results confirmed the rebound behavior of the flyer, which resulted in the tearing of the metallurgical bonding in the center of the weld nugget in LIW.
- When the flyer size was within three times larger than the laser spot size, flyer width and length had little effect on the flyer velocity due to the dual effect of the drag force and confinement. The confinement layer had little effect on the final flyer velocity. With rigid confinement layer, the experiment has better repeatability on the flyer travel distance.
Author Contributions
Conceptualization, H.W. and Y.W.; methodology, H.W.; formal analysis, H.W. and Y.W.; investigation, H.W.; writing—original draft preparation, H.W.; writing—review and editing, Y.W.
Funding
This work was sponsored by the Fundamental Research Funds for the Central Universities (Grant No. 06500107).
Acknowledgments
Thanks to Professor Glenn Daehn for providing laboratory access for the experimental work at The Ohio State University.
Conflicts of Interest
The authors declare no conflict of interest.
References
- Daehn, G.S.; Lippold, J.C. Low Temperature Spot Impact Welding Driven without Contact. U.S. Patent WO/2009/111774 A2, 9 November 2009. [Google Scholar]
- Wang, H.; Taber, G.; Liu, D.; Hansen, S.; Chowdhury, E.; Terry, S.; Lippold, J.C.; Daehn, G.S. Laser impact welding: Design of apparatus and parametric optimization. J. Manuf. Process. 2015, 19, 118–124. [Google Scholar] [CrossRef]
- Wang, H.; Vivek, A.; Wang, Y.; Taber, G.; Daehn, G.S. Laser impact welding application in joining aluminum to titanium. J. Laser Appl. 2016, 28, 032002. [Google Scholar] [CrossRef]
- Wang, X.; Gu, C.X.; Zheng, Y.Y.; Shen, Z.B.; Liu, H.X. Laser shock welding of aluminum/aluminum and aluminum/copper plates. Mater. Des. 2014, 56, 26–30. [Google Scholar] [CrossRef]
- Wang, H.; Wang, Y. Laser-driven flyer application in thin film dissimilar materials welding and spalling. Opt. Lasers Eng. 2017, 97, 1–8. [Google Scholar] [CrossRef]
- Zhang, Y.; Babu, S.S.; Prothe, C.; Blakely, M.; Kwasegroch, J.; Laha, M.; Daehn, G.S. Application of high velocity impact welding at varied different length scales. J. Mater. Process. Technol. 2011, 211, 944–952. [Google Scholar] [CrossRef]
- Liu, H.; Gao, S.; Yan, Z.; Li, L.; Li, C.; Sun, X.; Sha, C. Investigation on a novel laser impact spot welding. Metals 2016, 6, 179. [Google Scholar] [CrossRef]
- Wang, H. Laser Impact Welding and High Strain Rate Embossing; The Ohio State University: Columbus, OH, USA, 2013. [Google Scholar]
- Fujiwara, H.; Brown, K.E.; Dlott, D.D. A thin-film Hugoniot measurement using a laser-driven flyer plate. AIP Conf. Proc. 2012, 1426, 382–385. [Google Scholar]
- Brown, K.E.; Shaw, W.L.; Zheng, X.; Dlott, D.D. Simplified laser-driven flyer plates for shock compression science. Rev. Sci. Instrum. 2012, 83, 103901. [Google Scholar] [CrossRef] [PubMed]
- Paisley, D.L.; Luo, S.N.; Greenfield, S.R.; Koskelo, A.C. Laser-launched flyer plate and confined laser ablation for shock wave loading: Validation and applications. Rev. Sci. Instrum. 2008, 79, 023902. [Google Scholar] [CrossRef] [PubMed]
- Marsh, S.P. LASL Shock Hugoniot Data; University of California Press: Berkeley, CA, USA, 1980. [Google Scholar]
- Mousavi, S.; Al-Hassani, S.T.S.; Atkins, A.G. Bond strength of explosively welded specimens. Mater. Des. 2008, 29, 1334–1352. [Google Scholar] [CrossRef]
- Jarmakani, H.; Maddox, B.; Wei, C.T.; Kalantar, D.; Meyers, M.A. Laser shock-induced spalling and fragmentation in vanadium. Acta Mater. 2010, 58, 4604–4628. [Google Scholar] [CrossRef]
- Dung, C.V.; Sasaki, E. Numerical simulation of output response of PVDF sensor attached on a cantilever beam subjected to impact loading. Sensors 2016, 16, 601. [Google Scholar] [CrossRef] [PubMed]
- Stahl, D.B.; Gehr, R.J.; Harper, R.W.; Rupp, T.D.; Sheffield, S.A.; Robbins, D.L. Flyer velocity characteristics of the laser-driven MiniFlyer system. AIP Conf. Proc. 2000, 505, 1087–1090. [Google Scholar]
- Watson, S.; Field, J.E. Measurement of the ablated thickness of films in the launch of laser-driven flyer plates. J. Phys. D Appl. Phys. 2000, 33, 170–174. [Google Scholar] [CrossRef]
- Zhao, X.H.; Zhao, X.; Shan, G.C.; Gao, Y. Fiber-coupled laser-driven flyer plates system. Rev. Sci. Instrum. 2011, 82, 043904. [Google Scholar] [CrossRef] [PubMed]
- Shaw-Stewart, J.; Lippert, T.; Nagel, M.; Nuesch, F.; Wokaun, A. A simple model for flyer velocity from laser-induced forward transfer with a dynamic release layer. Appl. Surf. Sci. 2012, 258, 9309–9313. [Google Scholar] [CrossRef]
- Strand, O.T.; Goosman, D.R.; Martinez, C.; Whitworth, T.L.; Kuhlow, W.W. Compact system for high-speed velocimetry using heterodyne techniques. Rev. Sci. Instrum. 2006, 77, 083108. [Google Scholar] [CrossRef]
- Johnson, J.R.; Taber, G.; Vivek, A.; Zhang, Y.; Golowin, S.; Banik, K.; Fenton, G.K.; Daehn, G.S. Coupling experiment and simulation in electromagnetic forming using Photon Doppler Velocimetry. Steel Res. Int. 2009, 80, 359–365. [Google Scholar]
- Carafoli, E.; Street, R.E. High-Speed Aerodynamics. Phys. Today 1958, 11, 48–50. [Google Scholar] [CrossRef]
- Akbari-Mousavi, S.A.A.; Barrett, L.M.; Al-Hassani, S.T.S. Explosive welding of metal plates. J. Mater. Process. Technol. 2008, 202, 224–239. [Google Scholar] [CrossRef]
- Chizari, M.; Al-Hassani, S.T.S.; Barrett, L.M. Effect of flyer shape on the bonding criteria in impact welding of plates. J. Mater. Process. Technol. 2009, 209, 445–454. [Google Scholar] [CrossRef]


© 2019 by the authors. Licensee MDPI, Basel, Switzerland. This article is an open access article distributed under the terms and conditions of the Creative Commons Attribution (CC BY) license (http://creativecommons.org/licenses/by/4.0/).