Finite Element Analysis and Statistical Optimization of End-Burr in Turning AA2024

 , , , and
Abstract
1. Introduction
2. Finite Element Model for Cutting Simulation
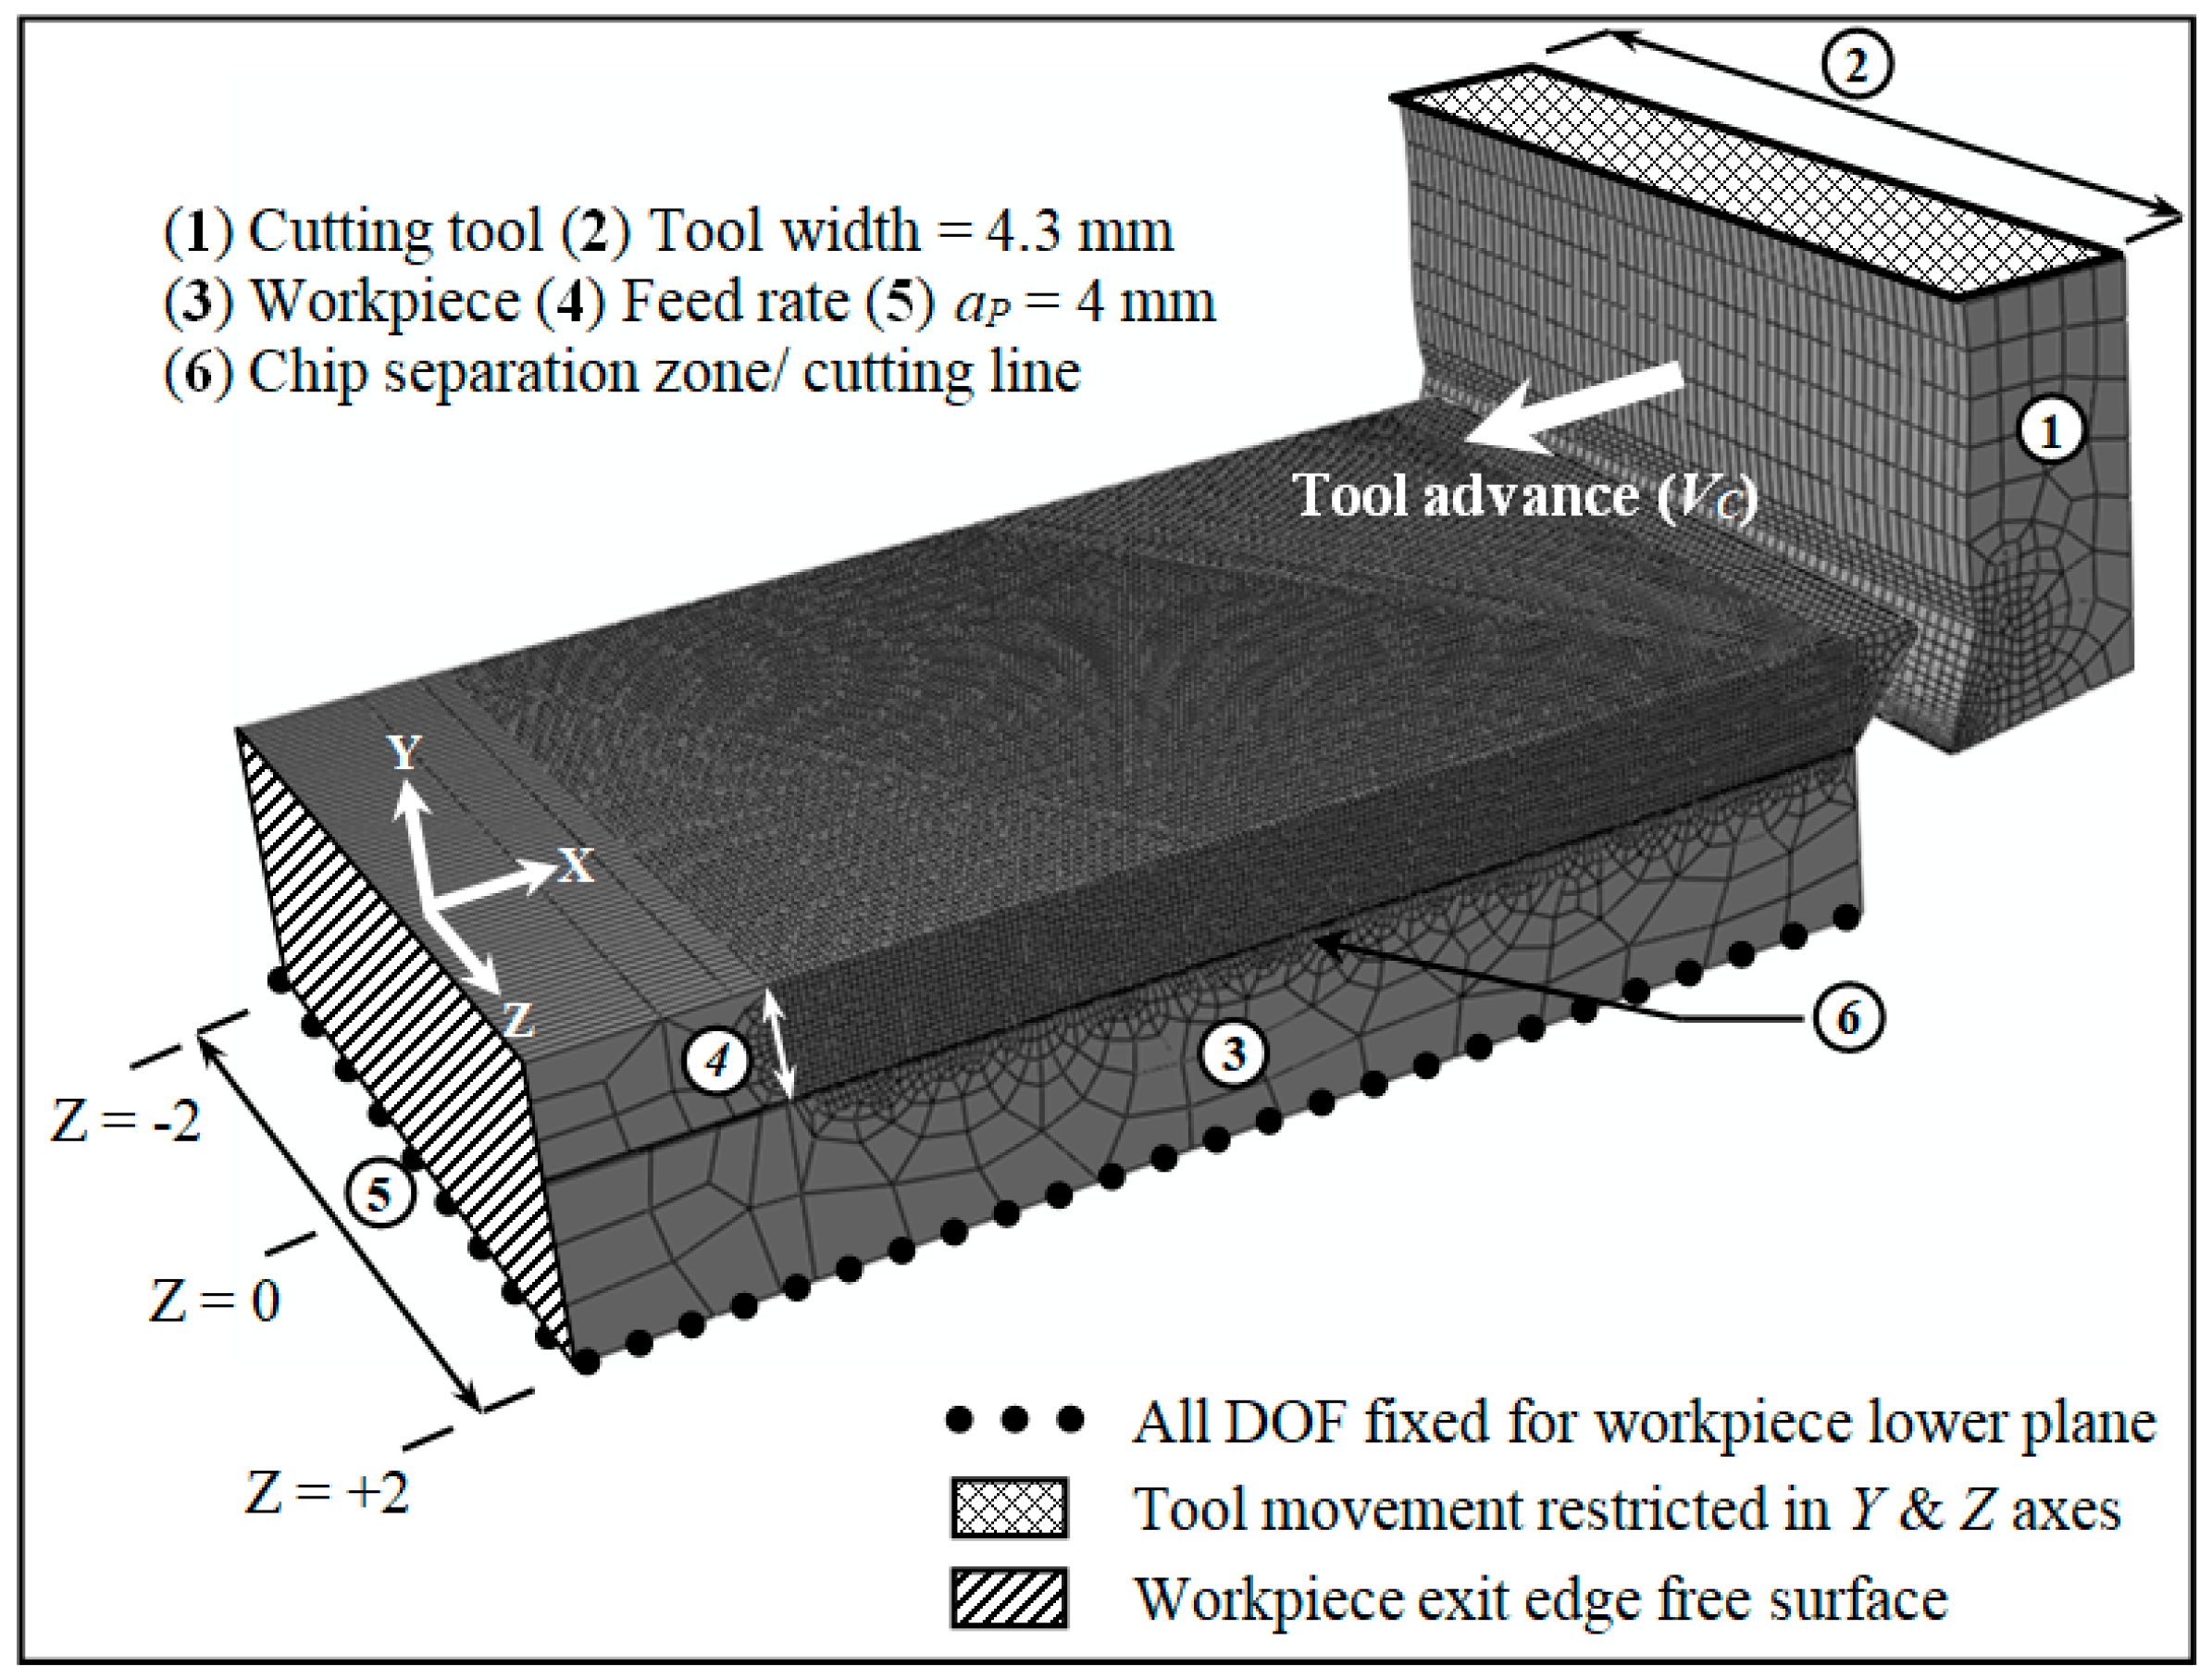
2.1. Geometrical Model and Boundary Conditions
2.2. Constitutive Model and Chip Separation
2.3. Finite Element Formulation
2.4. Thermal Aspects
2.5. Friction Law
3. FEA Results and Discussion
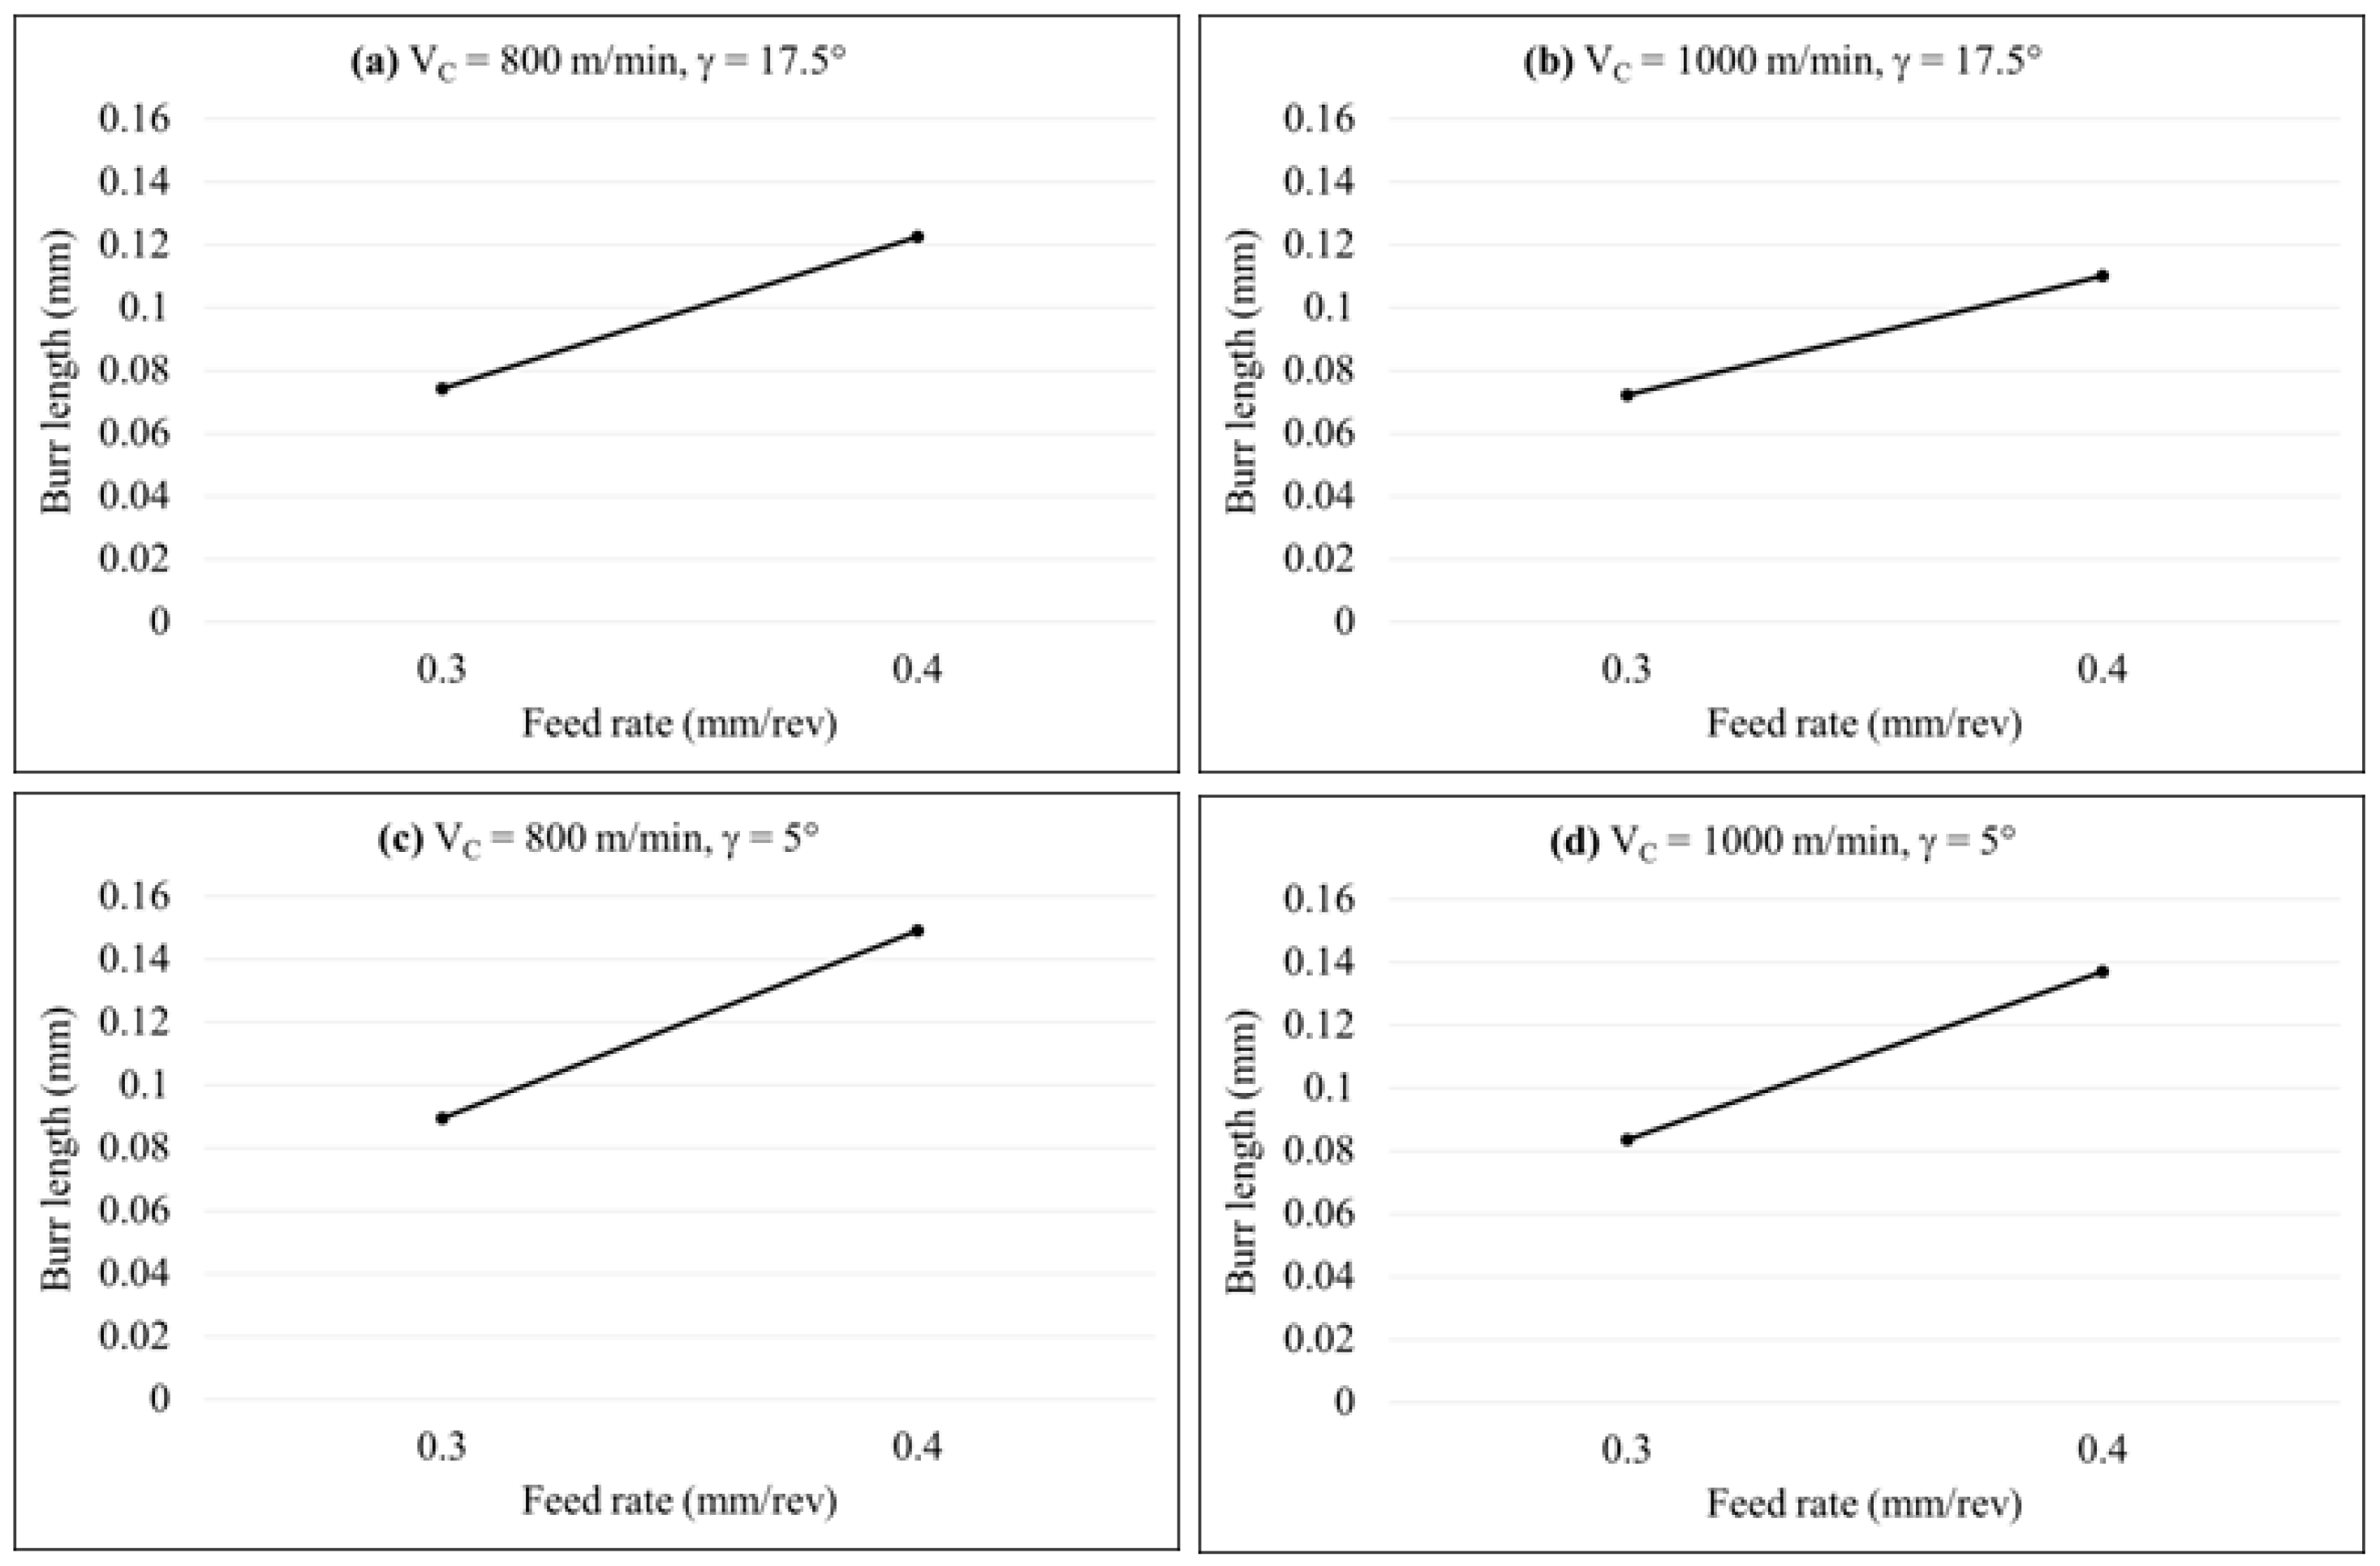
3.1. Effect of Feed on End-Burr Formation (at Section Z = 0)
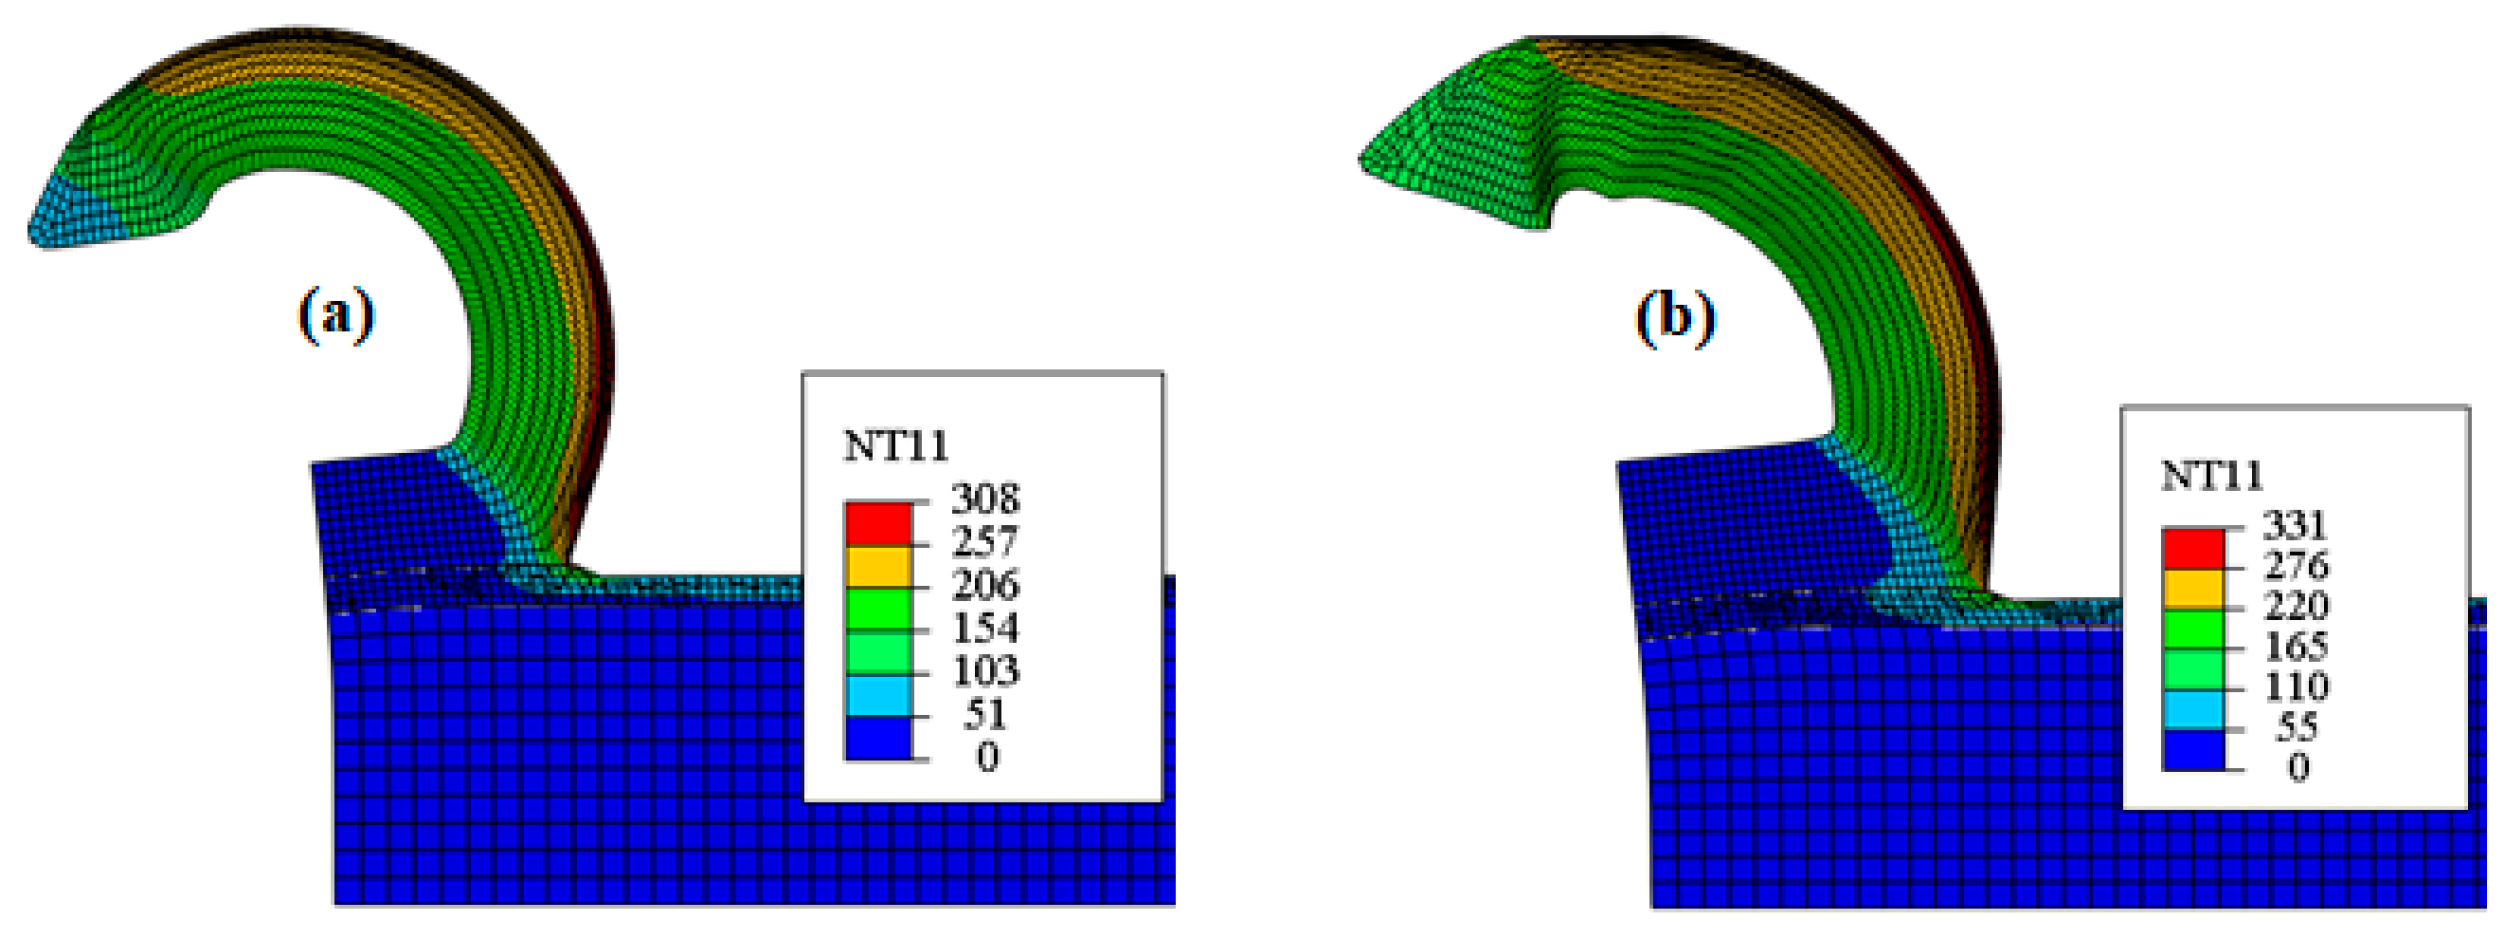
3.2. Effect of Rake Angle on End-Burr (at Section Z = 0)
3.3. Effect of Speed on End-Burr (at Section Z = 0)
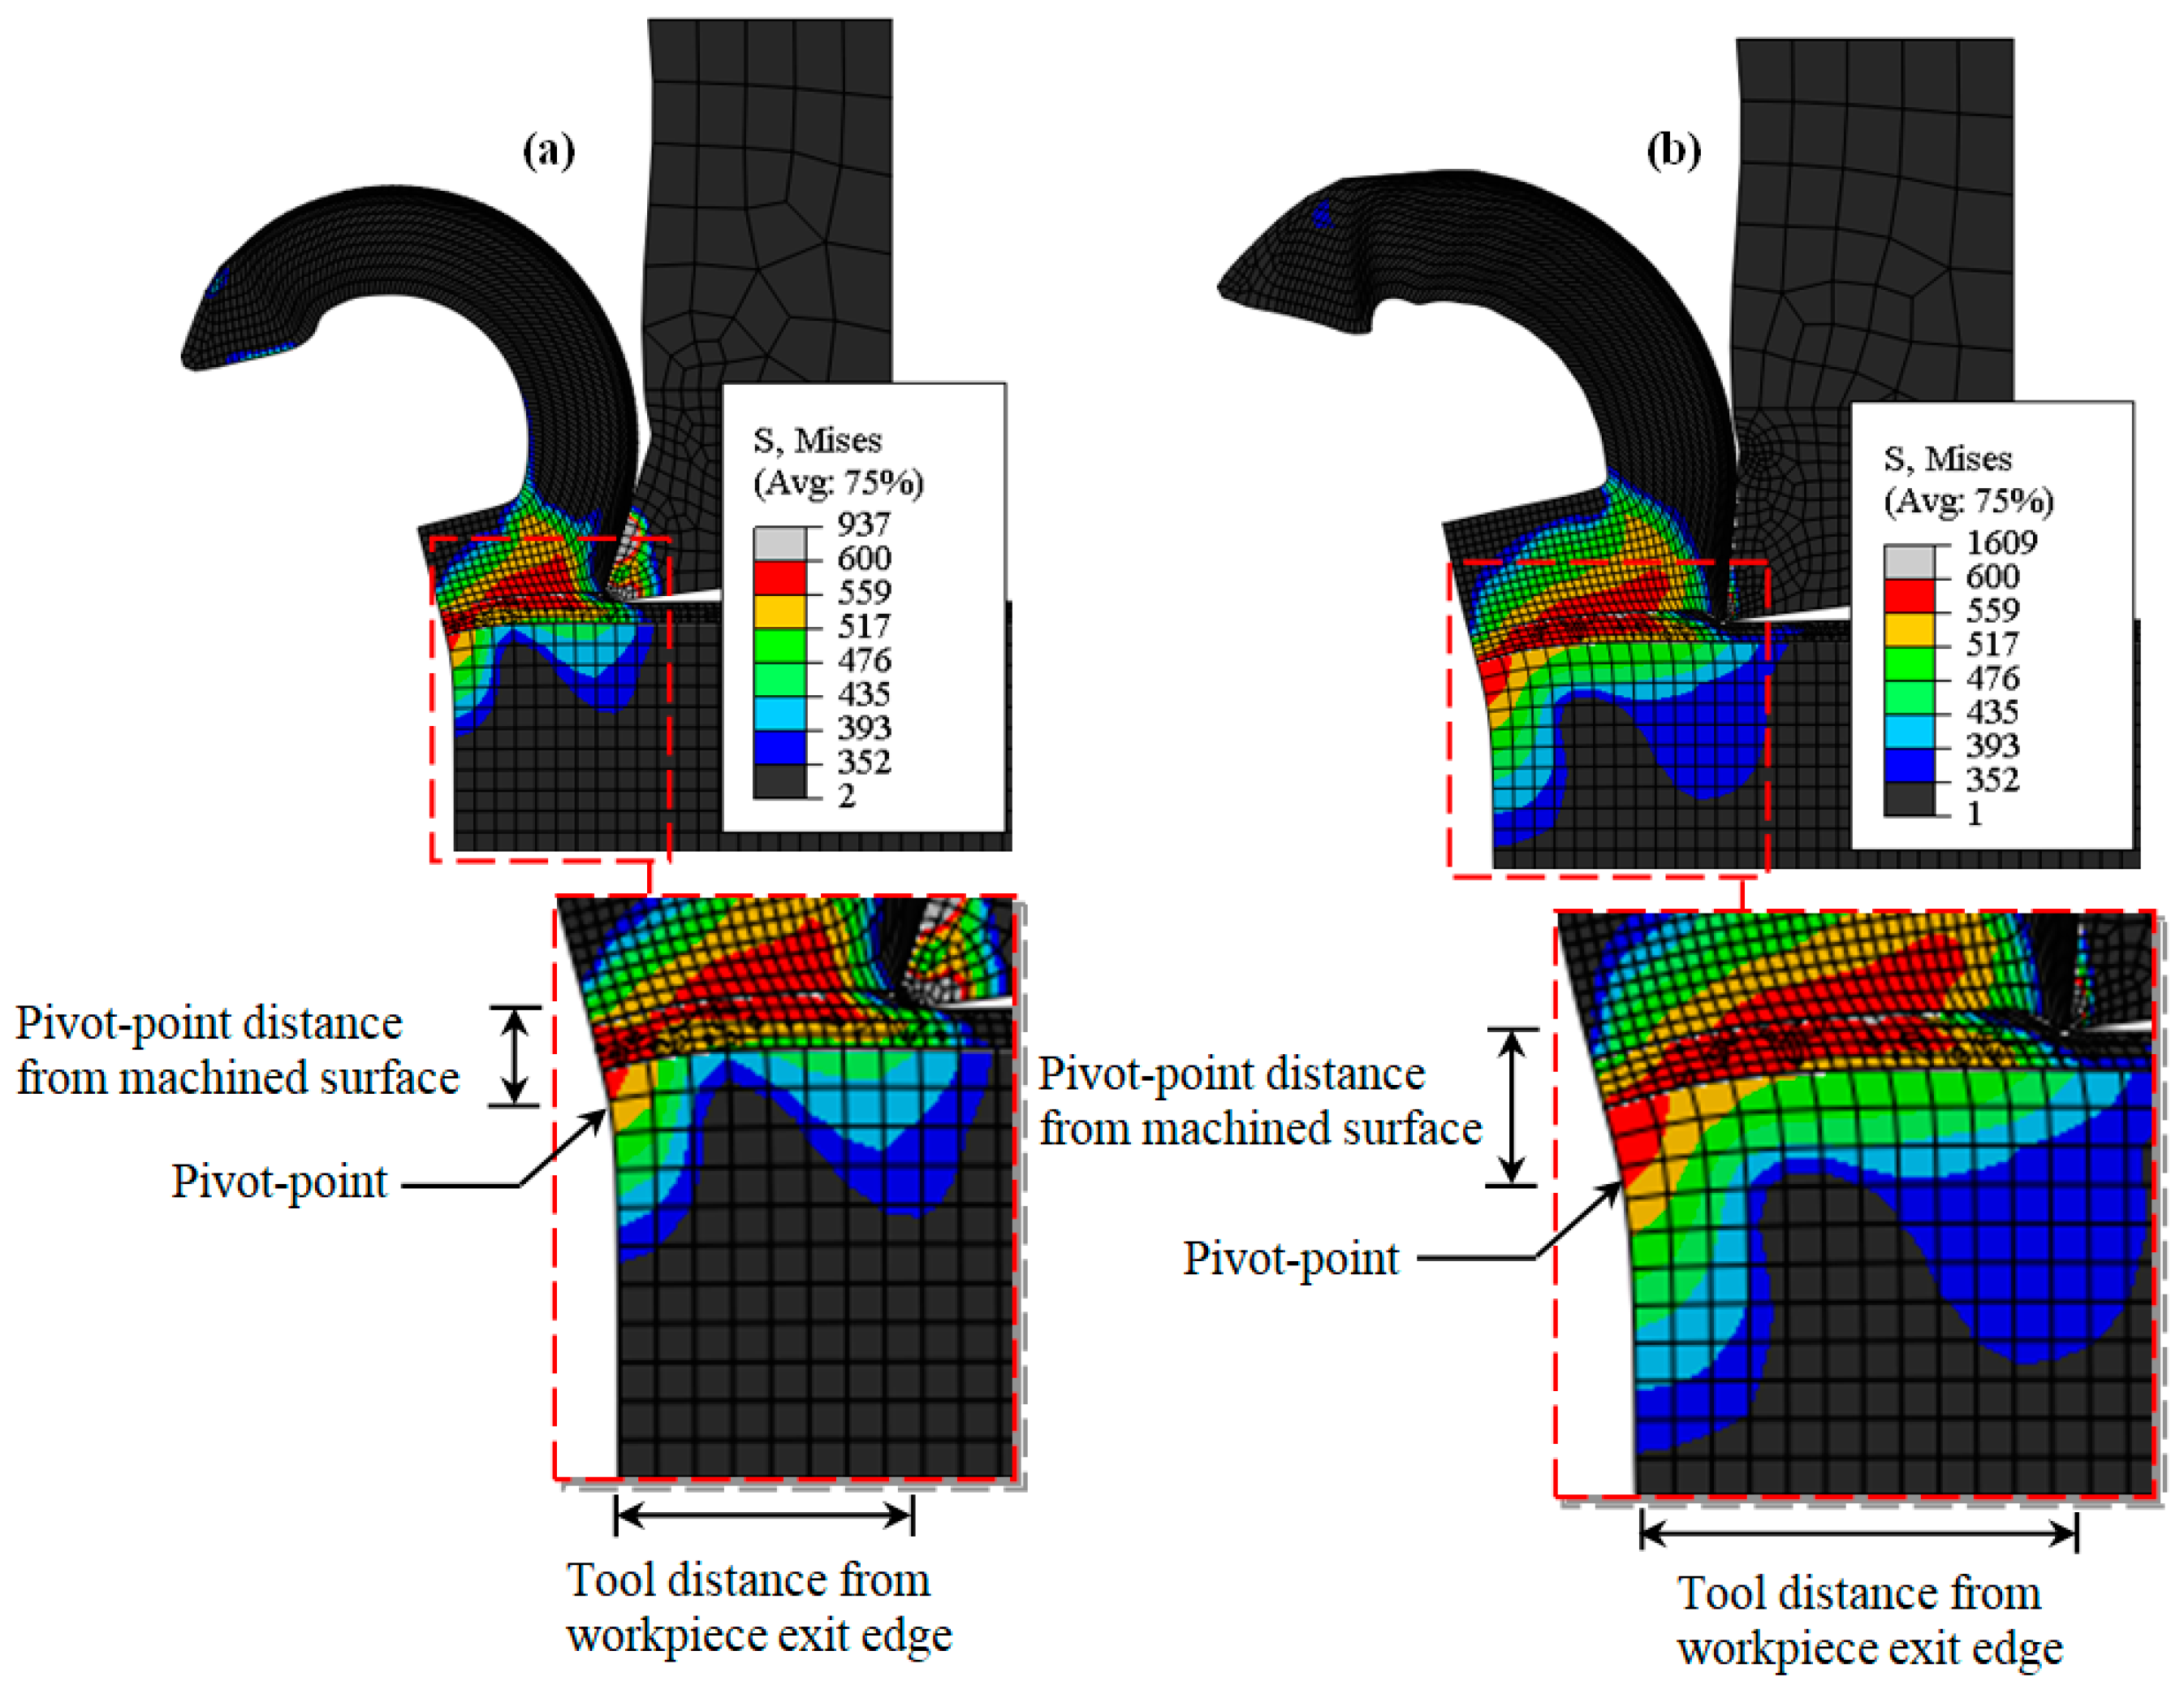
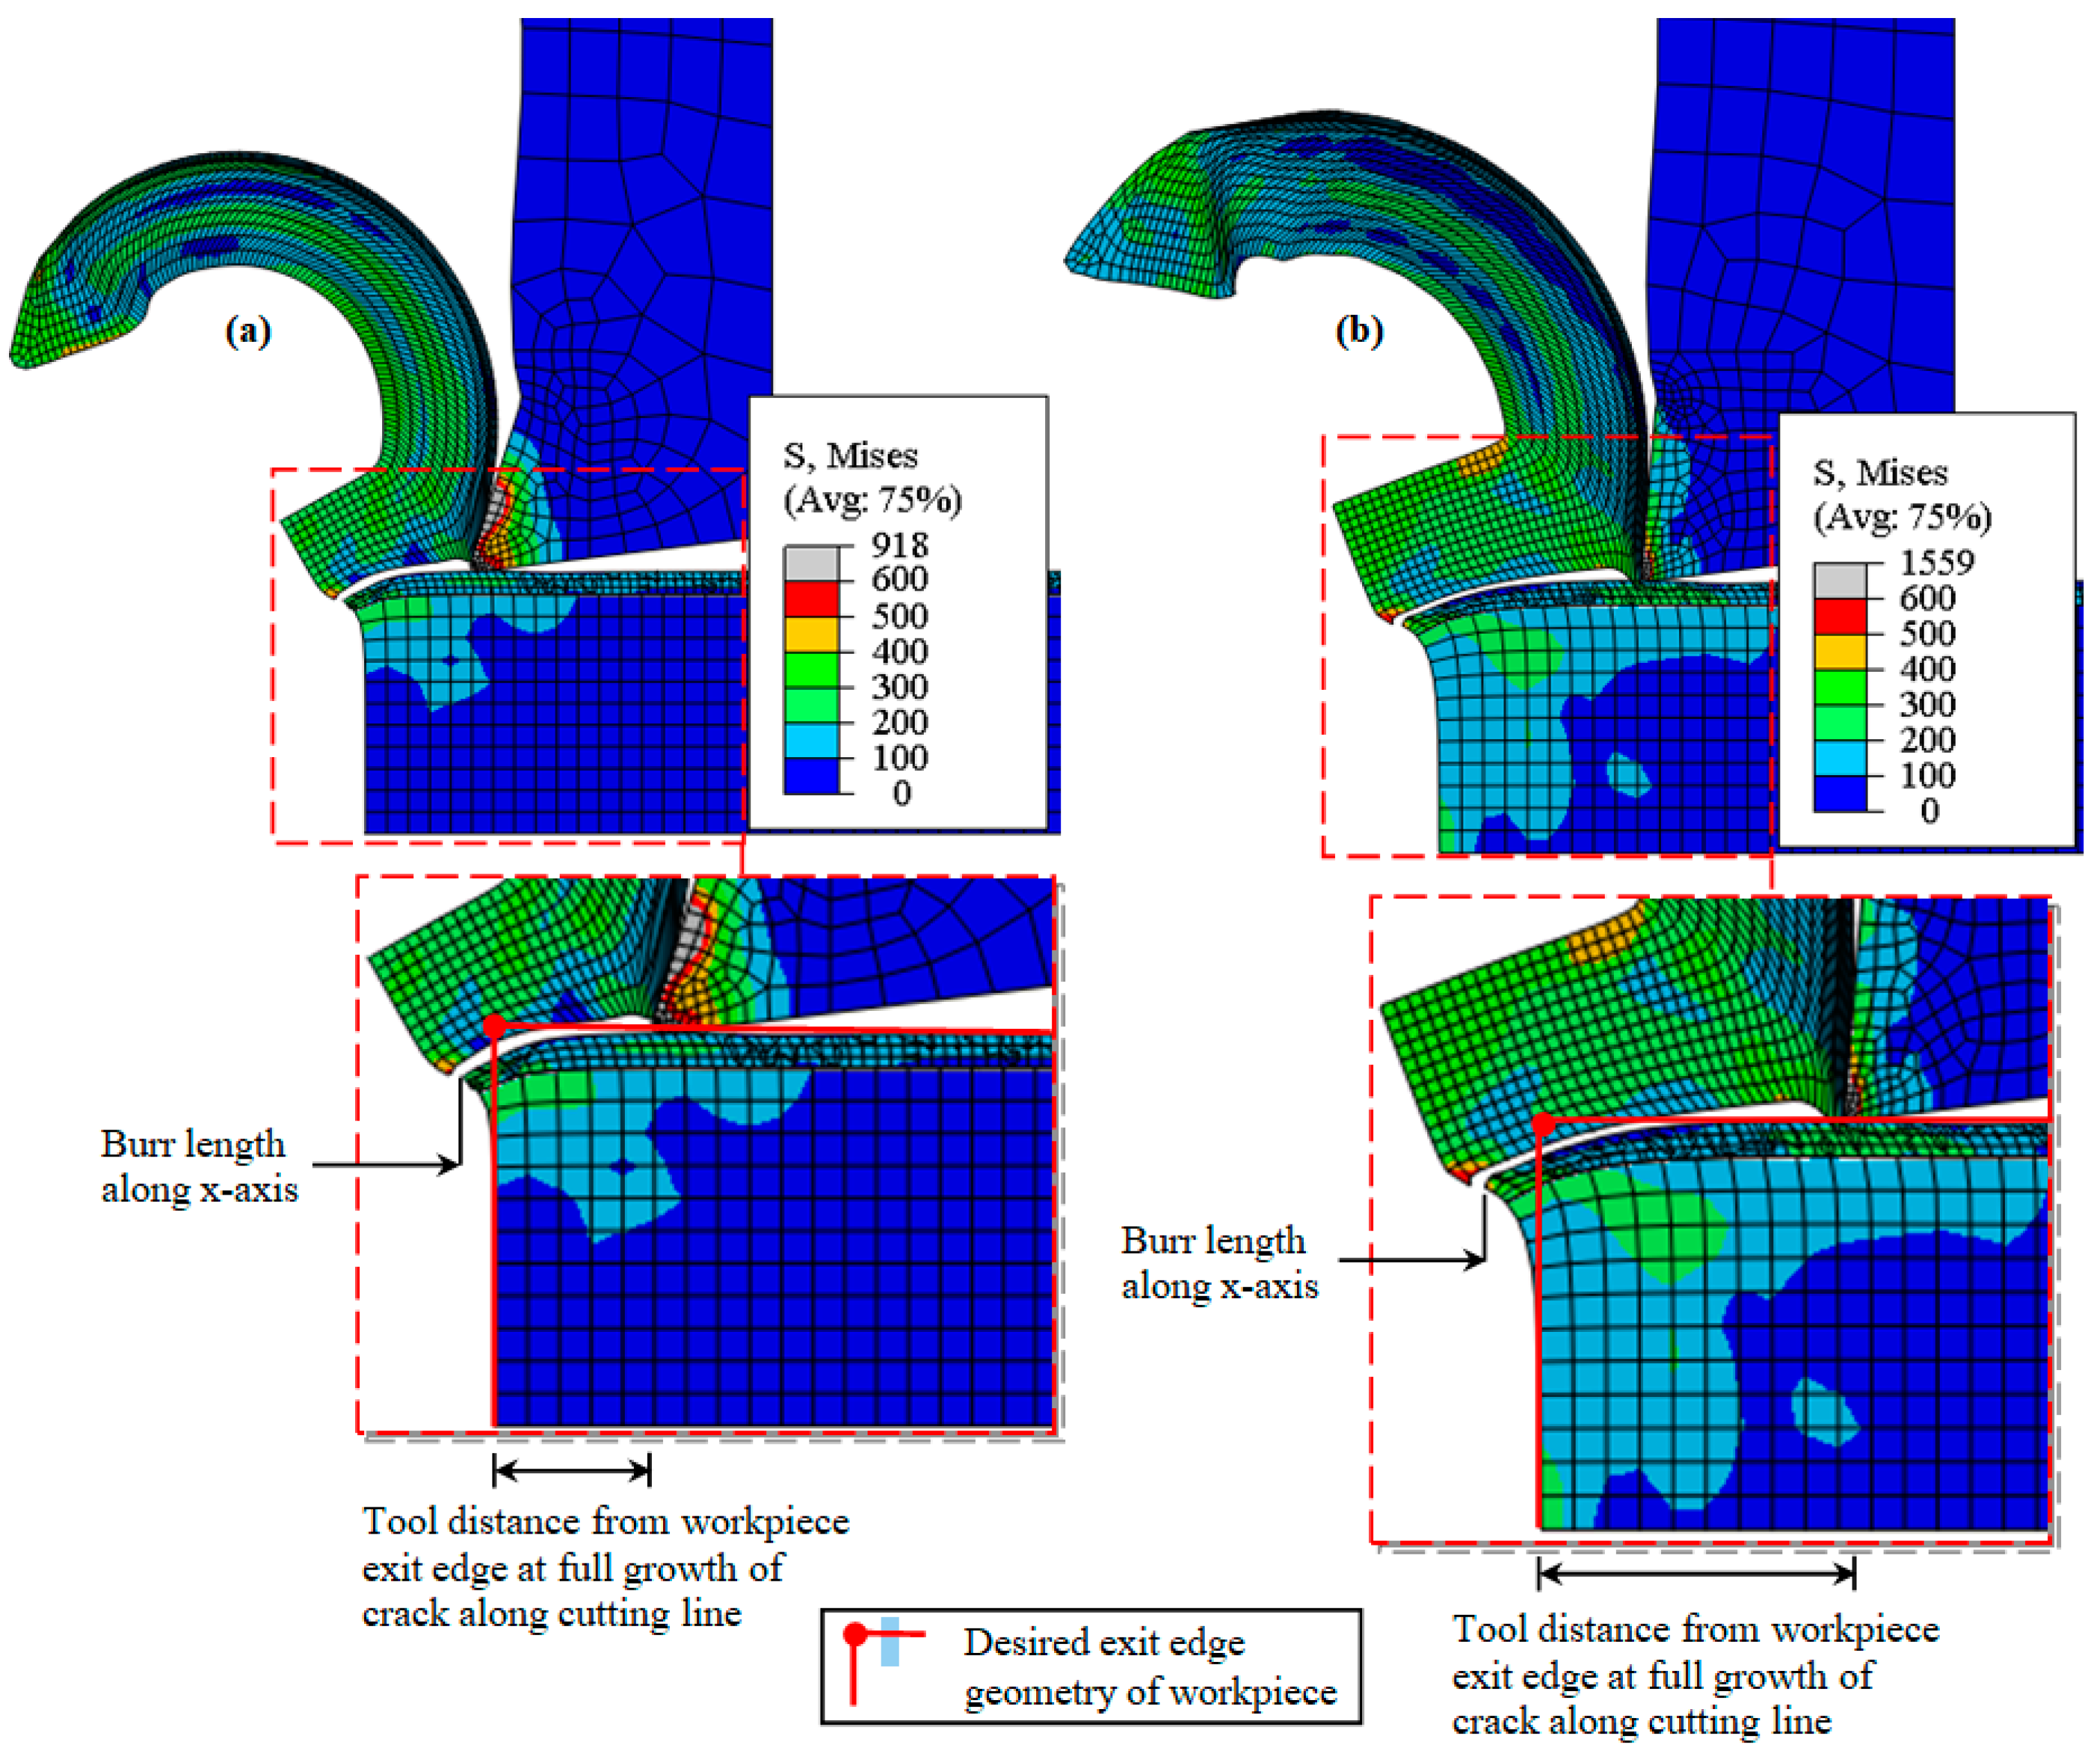
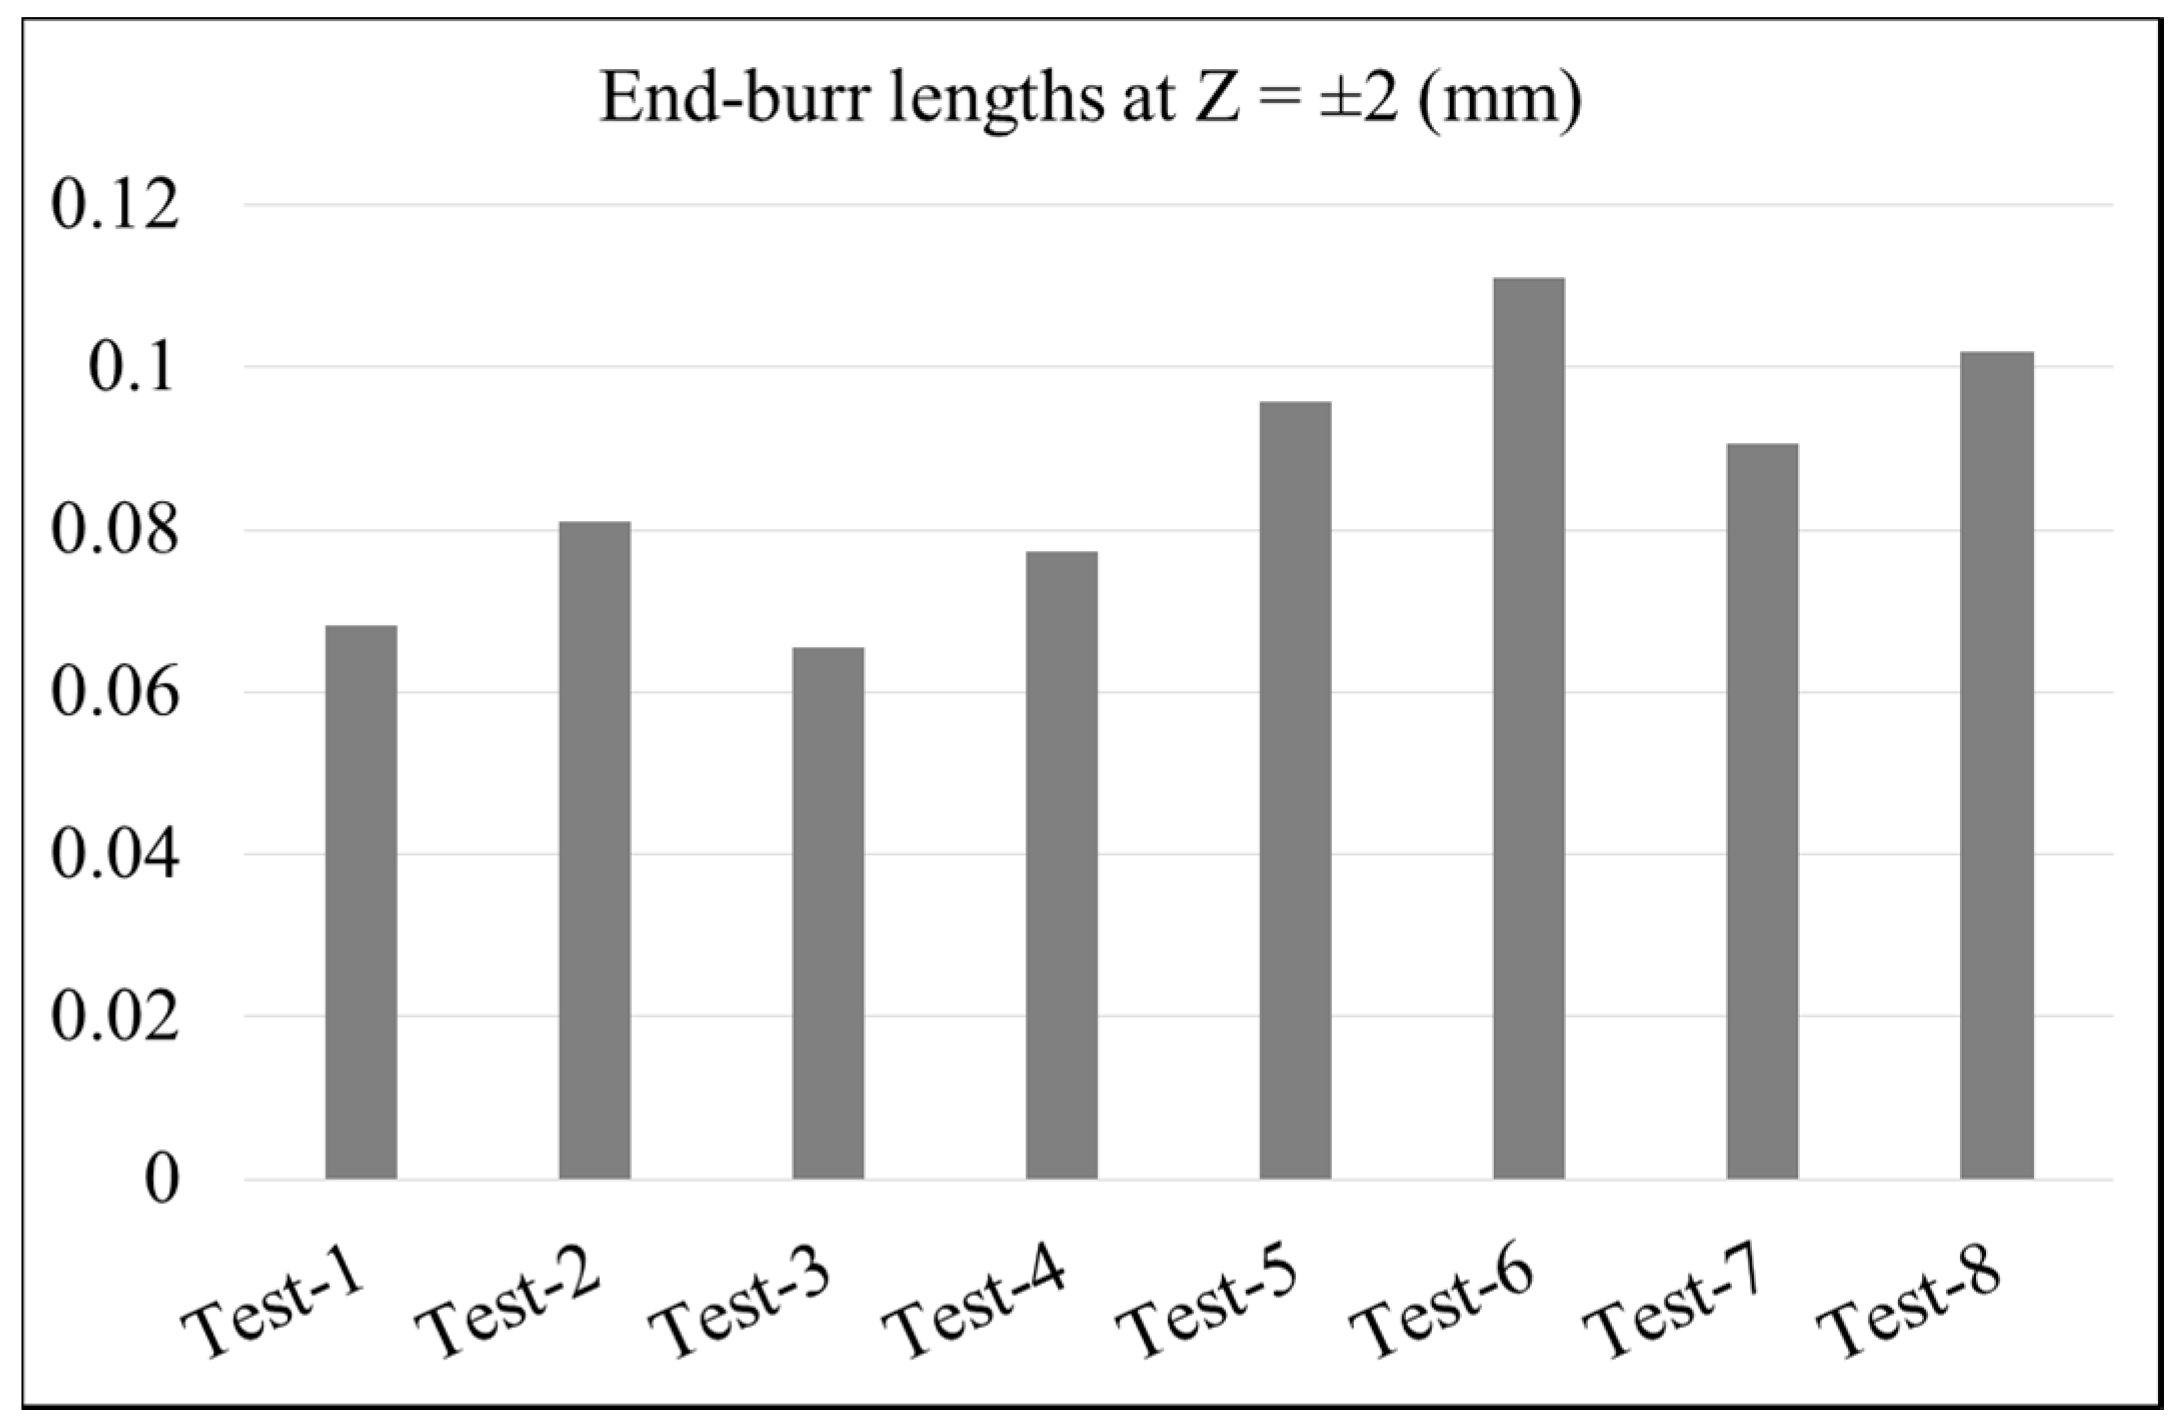
3.4. Burr Formation on Workpiece Edges (at Section Z = ±2)
4. Statistical Analysis and Optimization
- Which process parameters (VC, f and γ) have a major/minor effect in producing pronounced end-burr.
- What is the optimum combination of process parameters to minimize the burr lengths?
- Which of the previously discussed phenomena including temperature, cutting force evolution, pivot-point appearance time, pivot-point location, etc., have direct or more conspicuous relation with the burr formation process?
- Can a functional relationship between response (burr length) and process parameters be established?
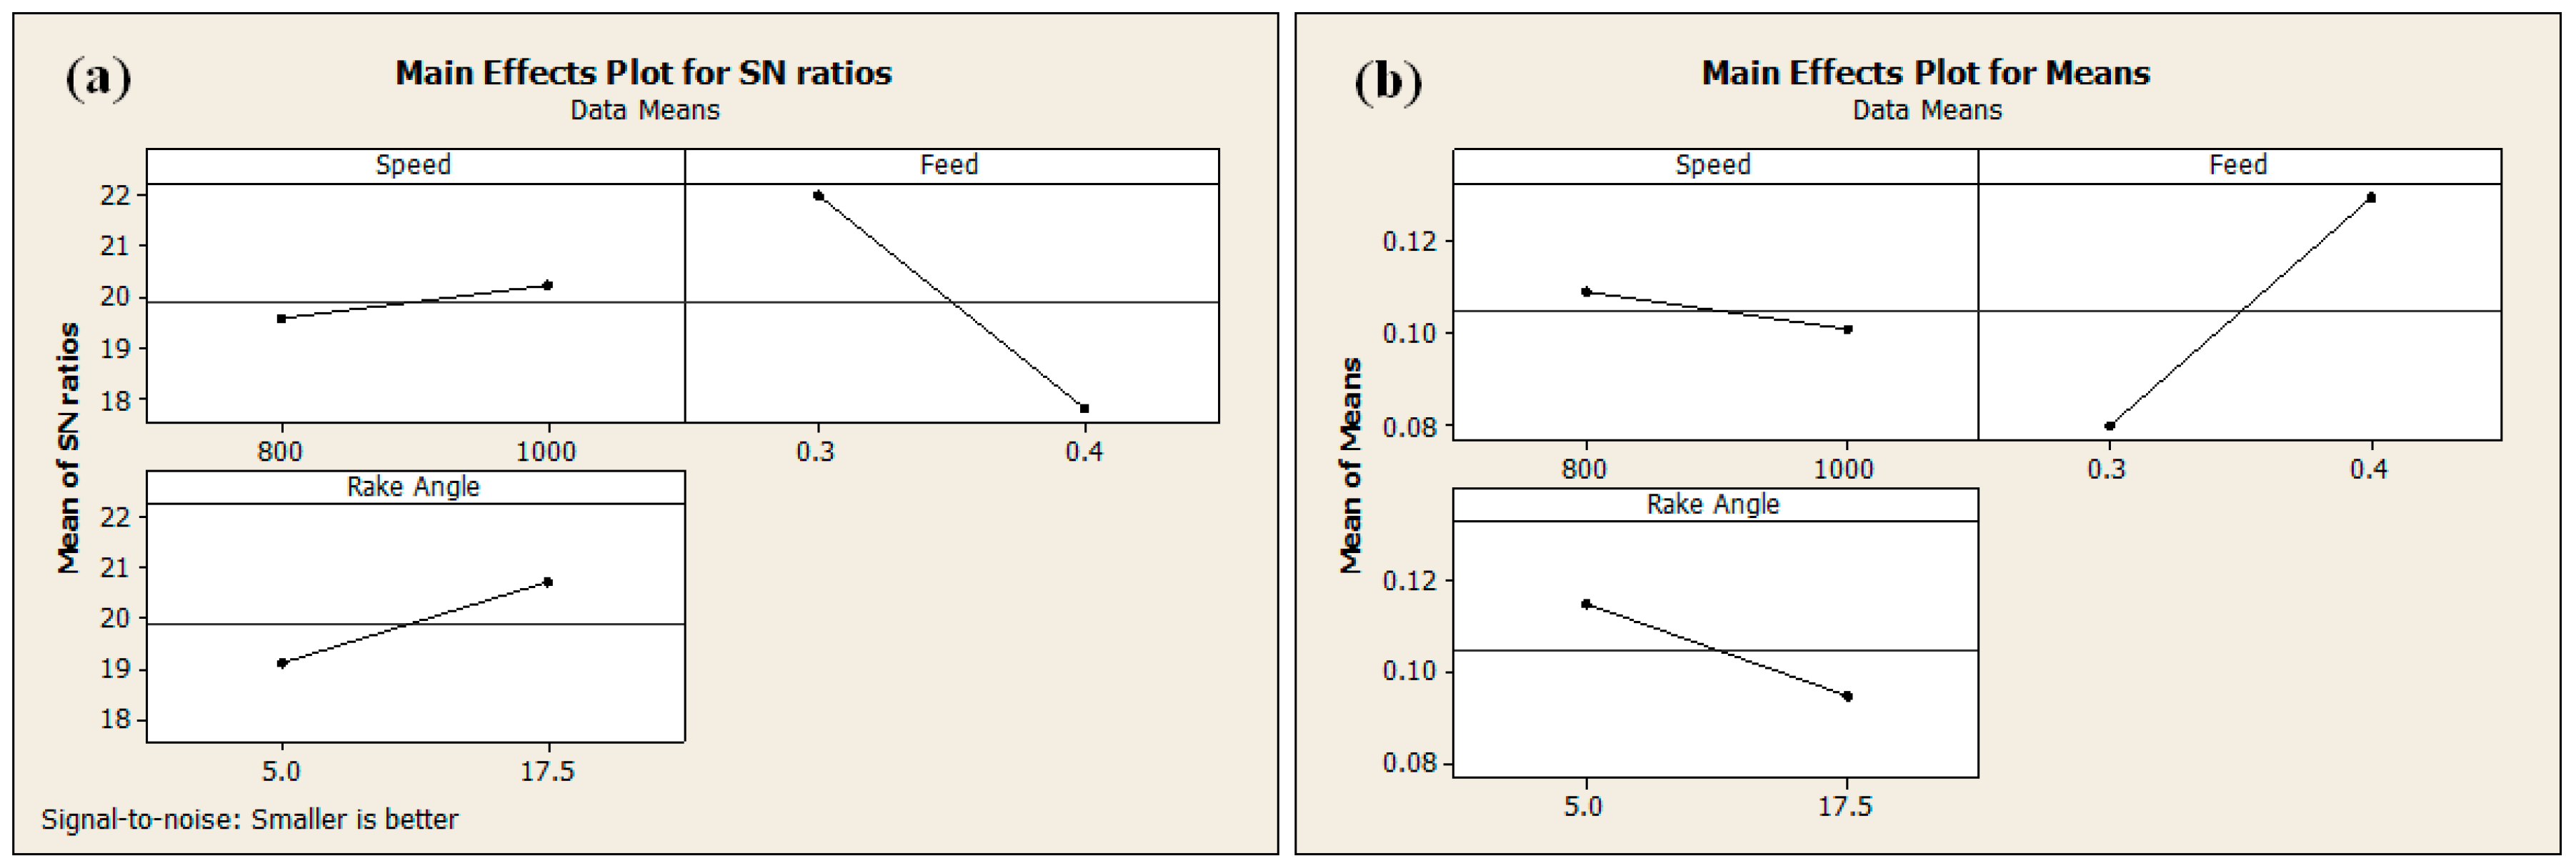
4.1. Burr Optimization Using Taguchi’s Methodology
4.2. RSM Based Statistical Analysis
5. Conclusions
- End-burr is the only type of burr produced on the exit edge in the middle sections of the workpiece. While additionally, poisson-burr is generated on the corner sections of the workpiece.
- As tool advances and approaches near workpiece end, negative shear zone appears at the workpiece exit edge and continuously propagates to meet the primary shear zone. The shear zone widened and material continuously flows towards the workpiece edges (due to tool advancement) to eventually produce end-burr.
- Numerical simulations and statistical analyses for various combinations of cutting speed, feed, and tool-rake angle are made. Optimum cutting parameters (within the tested range of parameters) to minimize burr are identified. It has been figured out that the lower feed, larger rake angle (more positive rake angle), and higher cutting speeds helps to decrease burr. Feed is found to be the most influential factor (contribution: 82%), while speed has the least effect (contribution: 2%) in producing burr. Whereas, rake angle has a 13% contribution in generating burr.
- As feed increases, the pivot-point (large deformation point in negative shear zone) appears earlier in the cutting process and far below the workpiece surface and longer burr lengths are produced.
- To predict burr lengths in machining of AA2024, a multiple regression model with acceptable accuracy (multiple correlation factor, R2 = 97.8%) has been proposed.
Author Contributions
Funding
Conflicts of Interest
Notations
| A | Initial yield stress (MPa) |
| aP | Cutting depth or axial depth of cut (mm) |
| B | Hardening modulus (MPa) |
| C | Strain rate dependency coefficient |
| Cp | Specific heat (J·kg−1·°C−1) |
| Difference between current and the exact solution | |
| D | damage evolution parameter |
| D1…D5 | Coefficients of Johnson-Cook material shear failure initiation criterion |
| E | Young’s modulus (MPa) |
| f | Feed rate (mm/rev) |
| FN | Force component conjugate to the Nth variable, N |
| FN after ith iteration | |
| F | Body force per unit volume N/m3 |
| fT | Transpose of f |
| Gf | Fracture energy (N/m) |
| KC I, II | Fracture toughness () for failure mode I and mode II |
| Jacobian matrix | |
| m | Thermal softening coefficient |
| n | Work-hardening exponent |
| NN | Interpolation functions |
| Transpose of NN | |
| P | Hydrostatic pressure (MPa) |
| Heat generation rate due to plastic deformation W/m3 | |
| Heat generation rate due to friction W/m3 | |
| S | Surface bounding volume V, m2 |
| Г | Surface traction per unit area, N/m2 |
| ГT | Transpose of Г |
| T | Temperature at a given calculation instant (°C) |
| Tm | Melting temperature (°C) |
| Tr | Room temperature (°C) |
| Equivalent plastic displacement (mm) | |
| Equivalent plastic displacement at failure (mm) | |
| uM | Value of the Mth variable |
| VC | Cutting speed (m/min) |
| V | Volume occupied by body m3 |
| V0 | Reference Volume m3 |
| Stress, MPa | |
| Johnson-Cook equivalent stress (MPa) | |
| Yield stress (MPa) | |
| τc | Material stress, MPa |
| Stress triaxiality | |
| Equivalent plastic strain | |
| Plastic strain rate (s−1) | |
| Reference strain rate (10−3 s−1) | |
| Equivalent plastic strain at failure | |
| Equivalent plastic strain increment | |
| Plastic strain at damage initiation | |
| δD | Virtual strain rate (s−1) |
| δu | Virtual velocity field (m/sec) |
| βN | Strain variation |
| Inelastic heat fraction | |
| Frictional work conversion factor | |
| ω | Damage initiation criterion |
| ν | Poisson’s ratio |
| α | Expansion coefficient (µm·m−1°C−1) |
| λ | Thermal conductivity (W·m−1°C−1) |
| ρ | Density (kg/m3) |
| γ | Rake angle (degrees) |
| ANOVA | Analysis of variance |
| DOE | Design of experiment |
| RSM | Response surface methodology |
| DF | Degrees of freedom |
| MS | Mean squares (variance) |
| SS | Sum of squares |
| PP | Percent contribution |
| P-value | Probability of significance |
| F-value | Fisher coefficient (variance ratio) |
References
- Aurich, J.C.; Dornfeld, D.A.; Arrazola, P.J.; Frankea, V.; Leitza, L.; Min, S. Burrs—Analysis, control and removal. CIRP Ann Manuf Tech. 2009, 58, 519–542. [Google Scholar] [CrossRef]
- Hashimura, M.; Dornfeld, D.A. Analysis of burr formation mechanism in machining process. Soc. Manuf. Eng. 1995, MR98-178, 1–14. [Google Scholar]
- Leopold, J.; Neugebauer, R.; Löffler, R.M.; M Schwenck, M.; Hänle, P. Influence of coating substrate systems on chip and burr formation in precision manufacturing. Proc. Imechepart B J. Eng. Manuf. 2006, 220, 499–506. [Google Scholar] [CrossRef]
- Sokolowski, A.; Narayanaswami, R.; Dornfeld, D.A. Prediction of burr size using neural networks and fuzzy logic. In Proceedings of the Japan-USA Symposium on Flexible Automation, ISCIE, Kobe, Japan, 11–18 July 1994; pp. 889–896. [Google Scholar]
- Kizhakken, V.; Mathew, J. Modeling of burr thickness in micro-end milling of Ti6Al4V. Proc. IMechE Part B J. Eng. Manuf. 2018. [Google Scholar] [CrossRef]
- Dong, D.; Song, J.; Yu, D.; Chen, M. Finite element analysis of burr formation and an automatic online micro-deburring method in precise end-face grinding process. Proc. Imechepart B J. Eng. Manuf. 2017, 231, 2495–2503. [Google Scholar] [CrossRef]
- Asad, M.; Ijaz, H.; Khan, M.A.; Mabrouki, T.; Saleem, W. Turning modeling and simulation of an aerospace grade aluminum alloy using two-dimensional and three-dimensional finite element method. Proc. Imeche Part B J. Eng. Manuf. 2014, 228, 367–375. [Google Scholar] [CrossRef]
- Asad, M.; Naeem, A.A.; Ashraf, S.R.; Rabbani, T. A numerical approach on the design of a sustainable turning insert. Proc. Pak. Acad. Sci. 2017, 54, 339–345. [Google Scholar]
- Chu, C.H.; Dornfeld, D.A. Tool path planning for avoiding exit burrs. J. Manuf. Process 2000, 2, 116–123. [Google Scholar] [CrossRef]
- Koklu, U.; Basmaci, G. Evaluation of Tool Path Strategy and Cooling Condition Effects on the Cutting Force and Surface Quality in Micromilling Operations. Metals 2017, 7, 426. [Google Scholar] [CrossRef]
- Min, S.; Dornfeld, D.A.; Nakao, Y. Influence of exit surface angle on drilling burr formation. J. Manuf. Sci. Eng. 2003, 125, 637–644. [Google Scholar] [CrossRef]
- Saleem, W.; Zain-ul-abdein, M.; Ijaz, H.; Mahfouz, A.S.B.; Ahmed, A.; Asad, M.; Mabrouki, T. Computational Analysis and Artificial Neural Network Optimization of Dry Turning Parameters—AA2024-T351. Appl. Sci. 2017, 7, 642. [Google Scholar] [CrossRef]
- Karnik, S.R.; Gaitonde, V.; Davim, J.P. Integrating Taguchi principle with genetic algorithm to minimize burr size in drilling of AISI 316L stainless steel using an artificial neural network model. Proc. Imechepart B J. Eng. Manuf. 2007, 221, 1695–1704. [Google Scholar] [CrossRef]
- Niknam, S.A.; Songmene, V. Statistical investigation on burrs thickness during milling of 6061-T6 aluminium alloy. In Proceedings of the CIRP, 1st International Conference on Virtual Machining Process Technology, Montreal, QC, Canada, 28 May–1 June 2012. [Google Scholar]
- Barry, J.; Byrne, G. The mechanisms of chip formation in machining hardened steels. J. Manuf. Sci. Eng. 2002, 124, 528–535. [Google Scholar] [CrossRef]
- Movahhedy, M.R.; Gadala, M.S.; Altintas, Y. FE modeling of chip formation in orthogonal metal cutting process: An ALE approach. Mach. Sci. Technol. 2000, 4, 15–47. [Google Scholar] [CrossRef]
- Childs, T.H.C. Friction modelling in metal cutting. Wear 2006, 260, 310–318. [Google Scholar] [CrossRef]
- Molinari, A.; Cheriguene, R.; Miguelez, H. Contact variables and thermal effects at the tool–chip interface in orthogonal cutting. Int. J. Solids Struct. 2012, 49, 3774–3796. [Google Scholar] [CrossRef]
- Molinari, A.; Cheriguene, R.; Miguelez, H. Numerical and analytical modelling of orthogonal cutting: The link between local variables and global contact characteristics. Int. J. Mech. Sci. 2011, 53, 183–206. [Google Scholar] [CrossRef]
- Guo, Y.B.; Dornfeld, D.A. Finite element modeling of burr formation process in drilling 304 Stainless Steel. J. Mfg Sci. Eng. 2000, 122, 612–619. [Google Scholar] [CrossRef]
- Belhadi, S.; Mabrouki, T.; Rigal, J.F.; Boulanouar, L. Experimental and numerical study of chip formation during a straight turning of hardened AISI 4340 steel. Proc. Imechepart B J. Eng. Manuf. 2005, 219, 515–524. [Google Scholar] [CrossRef]
- Díaz-Álvarez, J.; Cantero, J.L.; Miguélez, H.; Soldani, X. Numerical analysis of thermo mechanical phenomena influencing tool wear in finishing turning of Inconel 718. Int. J. Mech. Sci. 2014, 82, 161–169. [Google Scholar] [CrossRef]
- Yen, Y.C.; Jain, A.; Altan, T. A finite element analysis of orthogonal machining using different tool edge geometries. J. Mater. Process. Technol. 2004, 146, 72–81. [Google Scholar] [CrossRef]
- Asad, M. Elaboration of Concepts and Methodologies to Study Peripheral Down-Cut Milling Process from Macro-to-Micro Scales. Ph.D. Thesis, INSA de Lyon, Villeurbanne, France, 2010. [Google Scholar]
- Subbiah, S.; Melkote, S.N. Effect of finite edge radius on ductile fracture ahead of the cutting tool edge in micro-cutting of Al2024-T3. Mater. Sci. Eng. A 2008, 474, 283–300. [Google Scholar] [CrossRef]
- Johnson, G.R.; Cook, W.H. Fracture characteristics of three metals subjected to various strains, strain rates, temperatures and pressures. Eng. Fract. Mech. 1985, 21, 31–48. [Google Scholar] [CrossRef]
- Ramesh, A. Prediction of Process-Induced Microstructural Changes and Residual Stresses in Orthogonal Hard Machining. Ph.D. Dissertation, Georgia Institute of Technology, Atlanta, GA, USA, 2002. [Google Scholar]
- Mabrouki, T.; Courbon, C.; Zhang, Y.; Rech, J.D.; Asad, M.; Hamdi, H.; Belhadi, S.; Salvatore, F. Some insights on the modelling of chip formation and its morphology during metal cutting operations. Compt Rendu Mec. 2016, 344, 335–354. [Google Scholar] [CrossRef]
- Hillerborg, A.; Modéer, M.; Petersson, P.E. Analysis of crack formation and crack growth in concrete by means of fracture mechanics and finite elements. Cem. Concr. Res. 1976, 6, 773–782. [Google Scholar] [CrossRef]
- Ijaz, H.; Zain-ul-abdein, M.; Saleem, W.; Asad, M.; Mabrouki, T. Numerical simulation of the effects of elastic anisotropy and grain size upon the machining of AA2024. Mach. Sci. Technol. 2018, 22, 522–542. [Google Scholar] [CrossRef]
- Figiel, L.; Kaminski, M. Numerical probabilistic approach to sensitivity analysis in a fatigue delamination problem of a two layer composite. Appl. Math. Comput. 2009, 209, 75–90. [Google Scholar] [CrossRef]
- Lei, S.; Shin, Y.C.; Incropera, F.P. Thermo-mechanical modeling of orthogonal machining process by finite element analysis. Int. J. Mach. Tools Manuf. 1999, 39, 731–750. [Google Scholar] [CrossRef]
- Filice, L.; Micari, F.; Rizzuti, S.; Umbrello, D. A critical analysis on the friction modelling in orthogonal machining. Int. J. Mach. Tools Manuf. 2007, 47, 709–714. [Google Scholar] [CrossRef]
- Wu, X.; Li, L.; He, N. Investigation on the burr formation mechanism in micro cutting. Precis. Eng. 2017, 47, 191–196. [Google Scholar] [CrossRef]


| Parameters | Workpiece (AA2024-T351) | Insert (Tungsten Carbide) |
|---|---|---|
| Density, ρ | 2700 | 11,900 |
| Young’s modulus, E | 73,000 | 534,000 |
| Poisson’s ratio, ν | 0.33 | 0.22 |
| Fracture energy, Gf | 20 × 103 | X |
| Specific heat, Cp | 0.557 T + 877.6 | 400 |
| Expansion Coefficient, αd | 8.91−3 T + 22.2 | X |
| Thermal conductivity, λ | 25 ≤ T ≤ 300: λ = 0.247T + 114.4 300 ≤ T ≤ Tm: λ = −0.125T + 226 | 50 |
| Meting temperature, Tm | 520 | X |
| Room temperature, Tr | 25 | 25 |
| Fracture toughness (KIC and KIIC) | 26 and 37 | X |
| A | B | n | C | m | D1 | D2 | D3 | D4 | D5 |
|---|---|---|---|---|---|---|---|---|---|
| 352 | 440 | 0.42 | 0.0083 | 1 | 0.13 | 0.13 | −1.5 | 0.011 | 0 |
| Feed Rate, f (mm/rev) | Cutting Force, FC (N) | |
|---|---|---|
| Experimental [24] | Numerical | |
| 0.3 | 769 | 718 |
| 0.4 | 976 | 933 |
| Test Number | Cutting Parameters | Burr Length along x-axis at Z = 0 | ||
|---|---|---|---|---|
| Cutting Speed (VC) | Feed Rate (f) | Rake Angle (γ) | ||
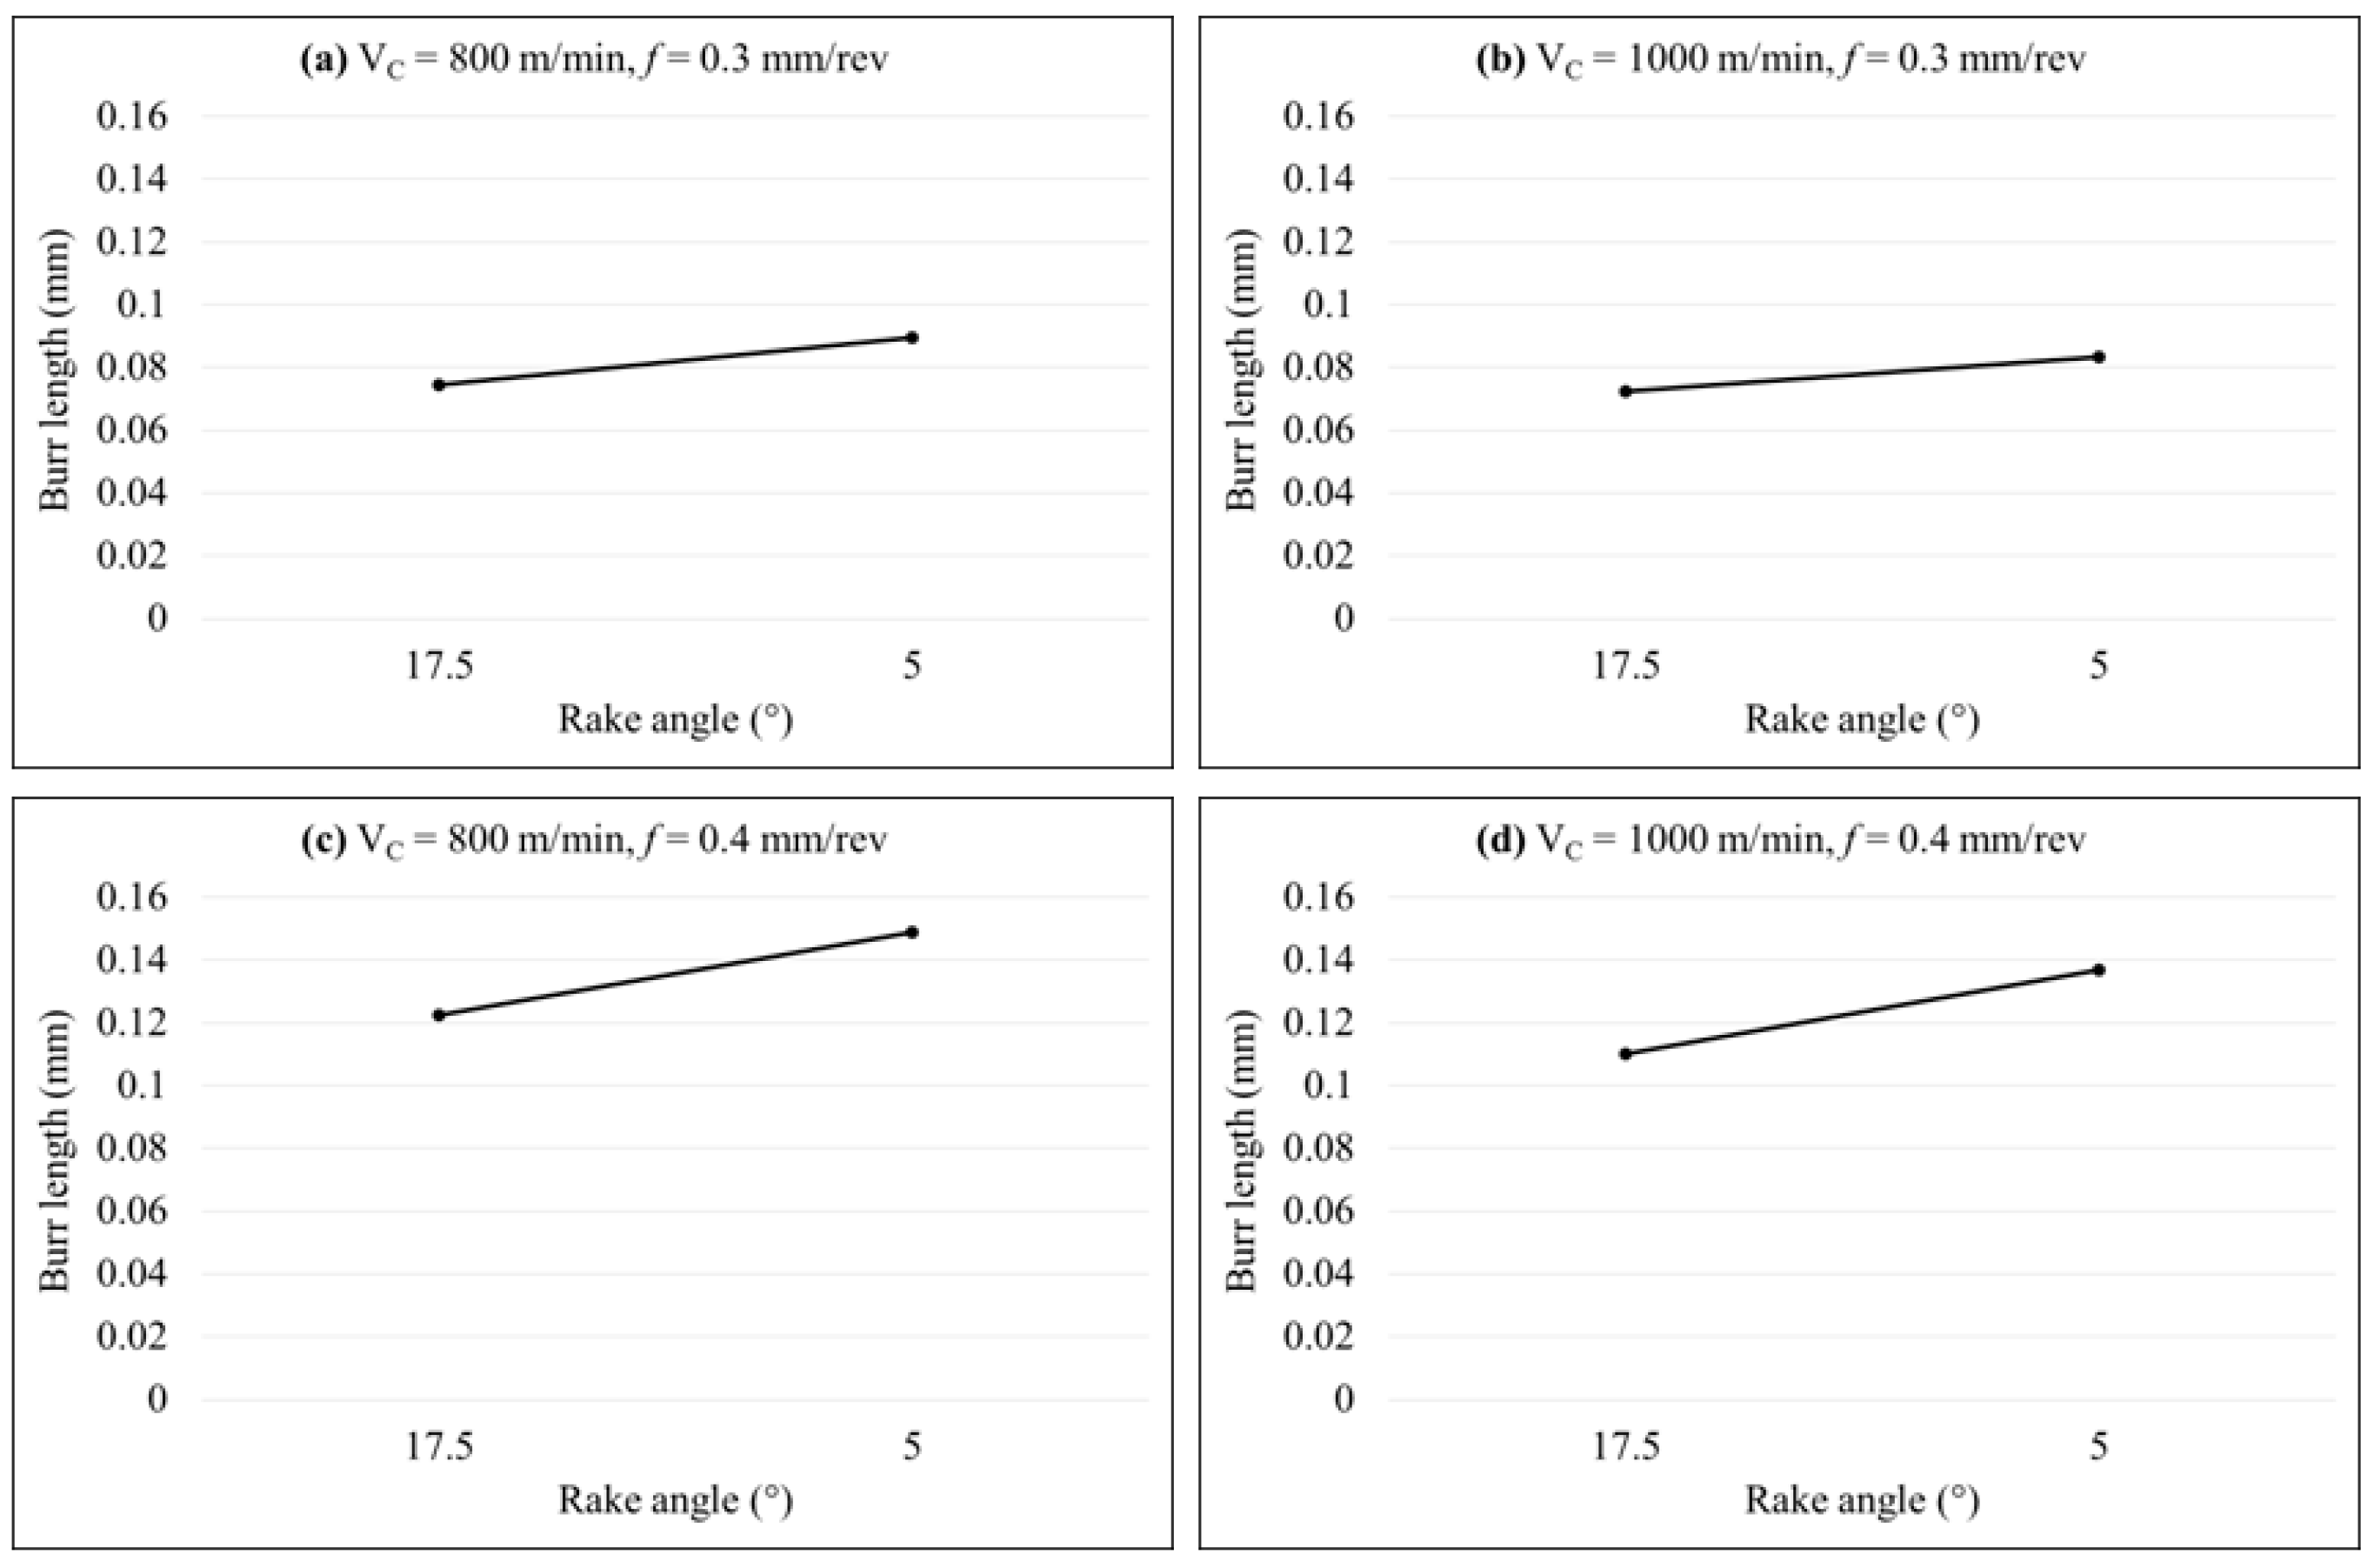
| 1 | 800 | 0.3 | 17.5 | 0.0743 |
| 2 | 800 | 0.3 | 5 | 0.08944 |
| 3 | 1000 | 0.3 | 17.5 | 0.0723 |
| 4 | 1000 | 0.3 | 5 | 0.08344 |
| 5 | 800 | 0.4 | 17.5 | 0.1226 |
| 6 | 800 | 0.4 | 5 | 0.149 |
| 7 | 1000 | 0.4 | 17.5 | 0.11 |
| 8 | 1000 | 0.4 | 5 | 0.137 |
| Level | Factor (Speed) | Factor (Feed) | Factor (Rake Angle) |
|---|---|---|---|
| 1 | 19.57901329 | 21.98483401 | 19.08593539 |
| 2 | 20.20687077 | 17.80105005 | 20.69994867 |
| Difference | 0.627857489 | 4.183783969 | 1.614013276 |
| Rank | 3 | 1 | 2 |
| Source | DF | SS | MS | F-value | P-value | PP (%) | Remarks |
|---|---|---|---|---|---|---|---|
| Model | 3 | 0.005882 | 0.001960 | 60.11 | 0.00087 | - | Significant |
| Speed | 1 | 0.000132 | 0.000132 | 4.07 | 0.11374 | 2.208548 | Insignificant |
| Feed | 1 | 0.004956 | 0.004956 | 151.94 | 0.00024 | 82.42308 | Significant |
| Angle | 1 | 0.000793 | 0.000793 | 24.33 | 0.00785 | 13.19807 | Significant |
| Error | 4 | 0.000130 | 0.000032 | - | - | 2.170298 | - |
| Total | 7 | 0.006013 | - | - | - | 100 |
| Source | DF | SS | MS | F-value | P-value | PP (%) | Remarks |
|---|---|---|---|---|---|---|---|
| Speed | 1 | 180.5 | 180.5 | 288.8 | <0.0001 | 14.37 | Significant |
| Feed | 1 | 760.5 | 760.5 | 1216.8 | <0.0001 | 60.54 | Significant |
| Angle | 1 | 312.5 | 312.5 | 500 | <0.0001 | 24.88 | Significant |
| Error | 4 | 2.5 | 0.63 | - | - | 0.2 | - |
| Total | 7 | 1256 | - | - | - | 100 | - |
| Source | DF | SS | MS | F-value | P-value | PP (%) | Remarks |
|---|---|---|---|---|---|---|---|
| Speed | 1 | 3 | 3 | 0.03 | 0.867 | 0.002 | Insignificant |
| Feed | 1 | 98790 | 98790 | 1001.67 | <0.0001 | 79.42 | Significant |
| Angle | 1 | 25200 | 25200 | 255.51 | <0.0001 | 20.25 | Significant |
| Error | 4 | 394 | 99 | - | - | 0.3 | - |
| Total | 7 | 124388 | - | - | - | 100 | - |
| Source | DF | SS | MS | F-value | P-value | PP (%) | Remarks |
|---|---|---|---|---|---|---|---|
| Speed | 1 | 0.0000231 | 0.0000231 | 0.14 | 0.723 | 0.09 | Insignificant |
| Feed | 1 | 0.006072 | 0.006072 | 37.93 | 0.004 | 25.9 | Significant |
| Angle | 1 | 0.0167079 | 0.0167079 | 104.38 | 0.001 | 71.26 | Significant |
| Error | 4 | 0.0006403 | 0.0001601 | - | - | 2.73 | - |
| Total | 7 | 0.0234433 | - | - | - | 100 | - |
| Source | DF | SS | MS | F-value | P-value | PP (%) | Remarks |
|---|---|---|---|---|---|---|---|
| Speed | 1 | 0.000025 | 0.000025 | 0.05 | 0.831 | 0.02 | Insignificant |
| Feed | 1 | 0.091164 | 0.091164 | 191.94 | <0.0001 | 85.7 | Significant |
| Angle | 1 | 0.013284 | 0.013284 | 27.97 | 0.006 | 12.48 | Significant |
| Error | 4 | 0.0019 | 0.000475 | - | - | 1.78 | - |
| Total | 7 | 0.106373 | - | - | - | 100 | - |
| Source | DF | SS | MS | F-value | P-value | PP (%) | Remarks |
|---|---|---|---|---|---|---|---|
| Speed | 1 | 0.000365 | 0.000365 | 0.74 | 0.438 | 0.48 | Insignificant |
| Feed | 1 | 0.043512 | 0.043512 | 88.42 | 0.001 | 57.73 | Significant |
| Angle | 1 | 0.029525 | 0.029525 | 59.99 | 0.001 | 39.17 | Significant |
| Error | 4 | 0.001968 | 0.000492 | - | - | 2.61 | - |
| Total | 7 | 0.07537 | - | - | - | 100 | - |
© 2019 by the authors. Licensee MDPI, Basel, Switzerland. This article is an open access article distributed under the terms and conditions of the Creative Commons Attribution (CC BY) license (http://creativecommons.org/licenses/by/4.0/).
Share and Cite
Asad, M.; Ijaz, H.; Saleem, W.; Mahfouz, A.S.B.; Ahmad, Z.; Mabrouki, T. Finite Element Analysis and Statistical Optimization of End-Burr in Turning AA2024. Metals 2019, 9, 276. https://doi.org/10.3390/met9030276
Asad M, Ijaz H, Saleem W, Mahfouz ASB, Ahmad Z, Mabrouki T. Finite Element Analysis and Statistical Optimization of End-Burr in Turning AA2024. Metals. 2019; 9(3):276. https://doi.org/10.3390/met9030276
Chicago/Turabian StyleAsad, Muhammad, Hassan Ijaz, Waqas Saleem, Abdullah S.B. Mahfouz, Zeshan Ahmad, and Tarek Mabrouki. 2019. "Finite Element Analysis and Statistical Optimization of End-Burr in Turning AA2024" Metals 9, no. 3: 276. https://doi.org/10.3390/met9030276
APA StyleAsad, M., Ijaz, H., Saleem, W., Mahfouz, A. S. B., Ahmad, Z., & Mabrouki, T. (2019). Finite Element Analysis and Statistical Optimization of End-Burr in Turning AA2024. Metals, 9(3), 276. https://doi.org/10.3390/met9030276