Article

Characterization of Microstructural Evolution by Ultrasonic Nonlinear Parameters Adjusted by Attenuation Factor

1
School of Aerospace Engineering, Xiamen University, Xiamen 361005, China
2
Xiamen Engineering Technology Center for Intelligent Maintenance of Infrastructures, Xiamen 361005, China
3
School of Mechanical Engineering, Pusan National University, Busan 609-735, Korea
*
Authors to whom correspondence should be addressed.
Metals 2019, 9(3), 271; https://doi.org/10.3390/met9030271
Submission received: 15 January 2019 / Revised: 20 February 2019 / Accepted: 21 February 2019 / Published: 26 February 2019
(This article belongs to the Special Issue Opto-Acoustic Characterization of Metals)

Abstract

:
The use of an acoustic nonlinear response has been accepted as a promising alternative for the assessment of micro-structural damage in metallic solids. However, the full mechanism of the acoustic nonlinear response caused by the material micro-damages is quite complex and not yet well understood. In this paper, the effect of material microstructural evolution on acoustic nonlinear response of ultrasonic waves is investigated in rolled copper and brass. Microstructural evolution in the specimens is artificially controlled by cold rolling and annealing treatments. The correlations of acoustic nonlinear responses of ultrasonic waves in the specimens corresponding to the microstructural changes are obtained experimentally. To eliminate the influence of attenuation, which was induced by microstructural changes in specimens, experimentally-measured nonlinear parameters are corrected by an attenuation correction term. An obvious decrease of nonlinearity with the increase of grain size is found in the study. In addition, the influences of material micro-damages introduced by cold rolling on the acoustic nonlinear response in specimens are compared with the ones of grain boundaries controlled by heat treatment in specimens. The experimental results show that the degradation of material mechanical properties is not always accompanied by the increase of acoustic nonlinearity generated. It suggested that the nonlinear ultrasonic technique can be used to effectively characterize the material degradations, under the condition that the variations of grain sizes in the specimens under different damage states are negligible.

1. Introduction

The use of nonlinear ultrasonics for characterizing the material property degradation due to fatigue, creep, aging, and thermal damage has been intensively investigated [1,2,3,4,5,6]. It has been widely accepted that material nonlinearity could be attributed to micro-structural defects, such as lattice deformation or dislocation motion [7,8]. Any process that alters the local atomic potential or impedes the movement of dislocations will change the microstructure and material nonlinearity. Recently, second harmonic generation of ultrasonic wave propagation was used to quantify the amount of nonlinearity in a material by several groups [9,10,11,12]. It is convenient that the acoustic nonlinear response of second harmonic generation is related to the material micro-structural changes. The influences of the growth of grain size on nonlinearity during isothermal annealing by changing the holding time and temperature were examined in copper [13]. However, according to the authors’ literature survey, most previous efforts have been limited to the use of nonlinear ultrasonic approach for qualitatively characterization of material microstructure. The quantification of material nonlinearity by acoustic nonlinearity has been rarely reported. Quantification of material nonlinearity by ultrasonic waves has been of high interest, but at the same time, very challenging from a nondestructive evaluation viewpoint. This is because, in general, acoustic nonlinearity induced by microstructural change is a comprehensive result for many factors, such as dislocation density, grain boundaries, and elastic and plastic deformation. In addition, it is still difficult to understand the full mechanism of acoustic nonlinear response caused by the material micro-damages, for the reason that acoustic nonlinear response is much more complicated than the damages themselves.
It is well accepted that the intrinsic nonlinearity in materials is attributed to the anharmonicity and imperfection of atomic lattices [6,7,8,10]. Interactions of ultrasonic waves with these micro-structural discontinuities, including the grain boundaries, can cause the waveform distortion of acoustic signals, and consequently generate second harmonics [14,15,16,17,18]. The decrease of nonlinearity with the improvement of material properties with heat treatment in Inconel alloy was reported in our earlier work [7]. Despite the fact that heat treatment can release the internal stress and reduce the non-uniformity of micro-structures, hence decreasing the material nonlinearity, the dominant cause of variation of material nonlinearity during the heat treatment process is still obscure. It is important to note that heat treatment, like annealing, can decrease the grain size, and increase the grain boundaries. Grain boundaries are also the sources of material nonlinearity. So, the opposite trend of nonlinearity variation during the process of microstructural evolution makes the coupling effects for mechanisms of acoustic nonlinear response quite complicated.
The objective of this paper is to investigate the effect of microstructural evolution on acoustic nonlinear response in copper and brass. Copper and brass are well documented materials with a relatively simple lattice system. Cold rolling and annealing treatment are used to control the micro-structural changes in the specimens. The influences of grain size, density of dislocations, elastic deformations, and residual stress or strain on acoustic nonlinear response of ultrasonic wave propagation in the specimens are studied, respectively. Comparisons of acoustic nonlinearity in the specimens with different microstructures are obtained. Attempts have been made to show the effects of micro-structural evolution on the change of nonlinearity of ultrasonic waves.

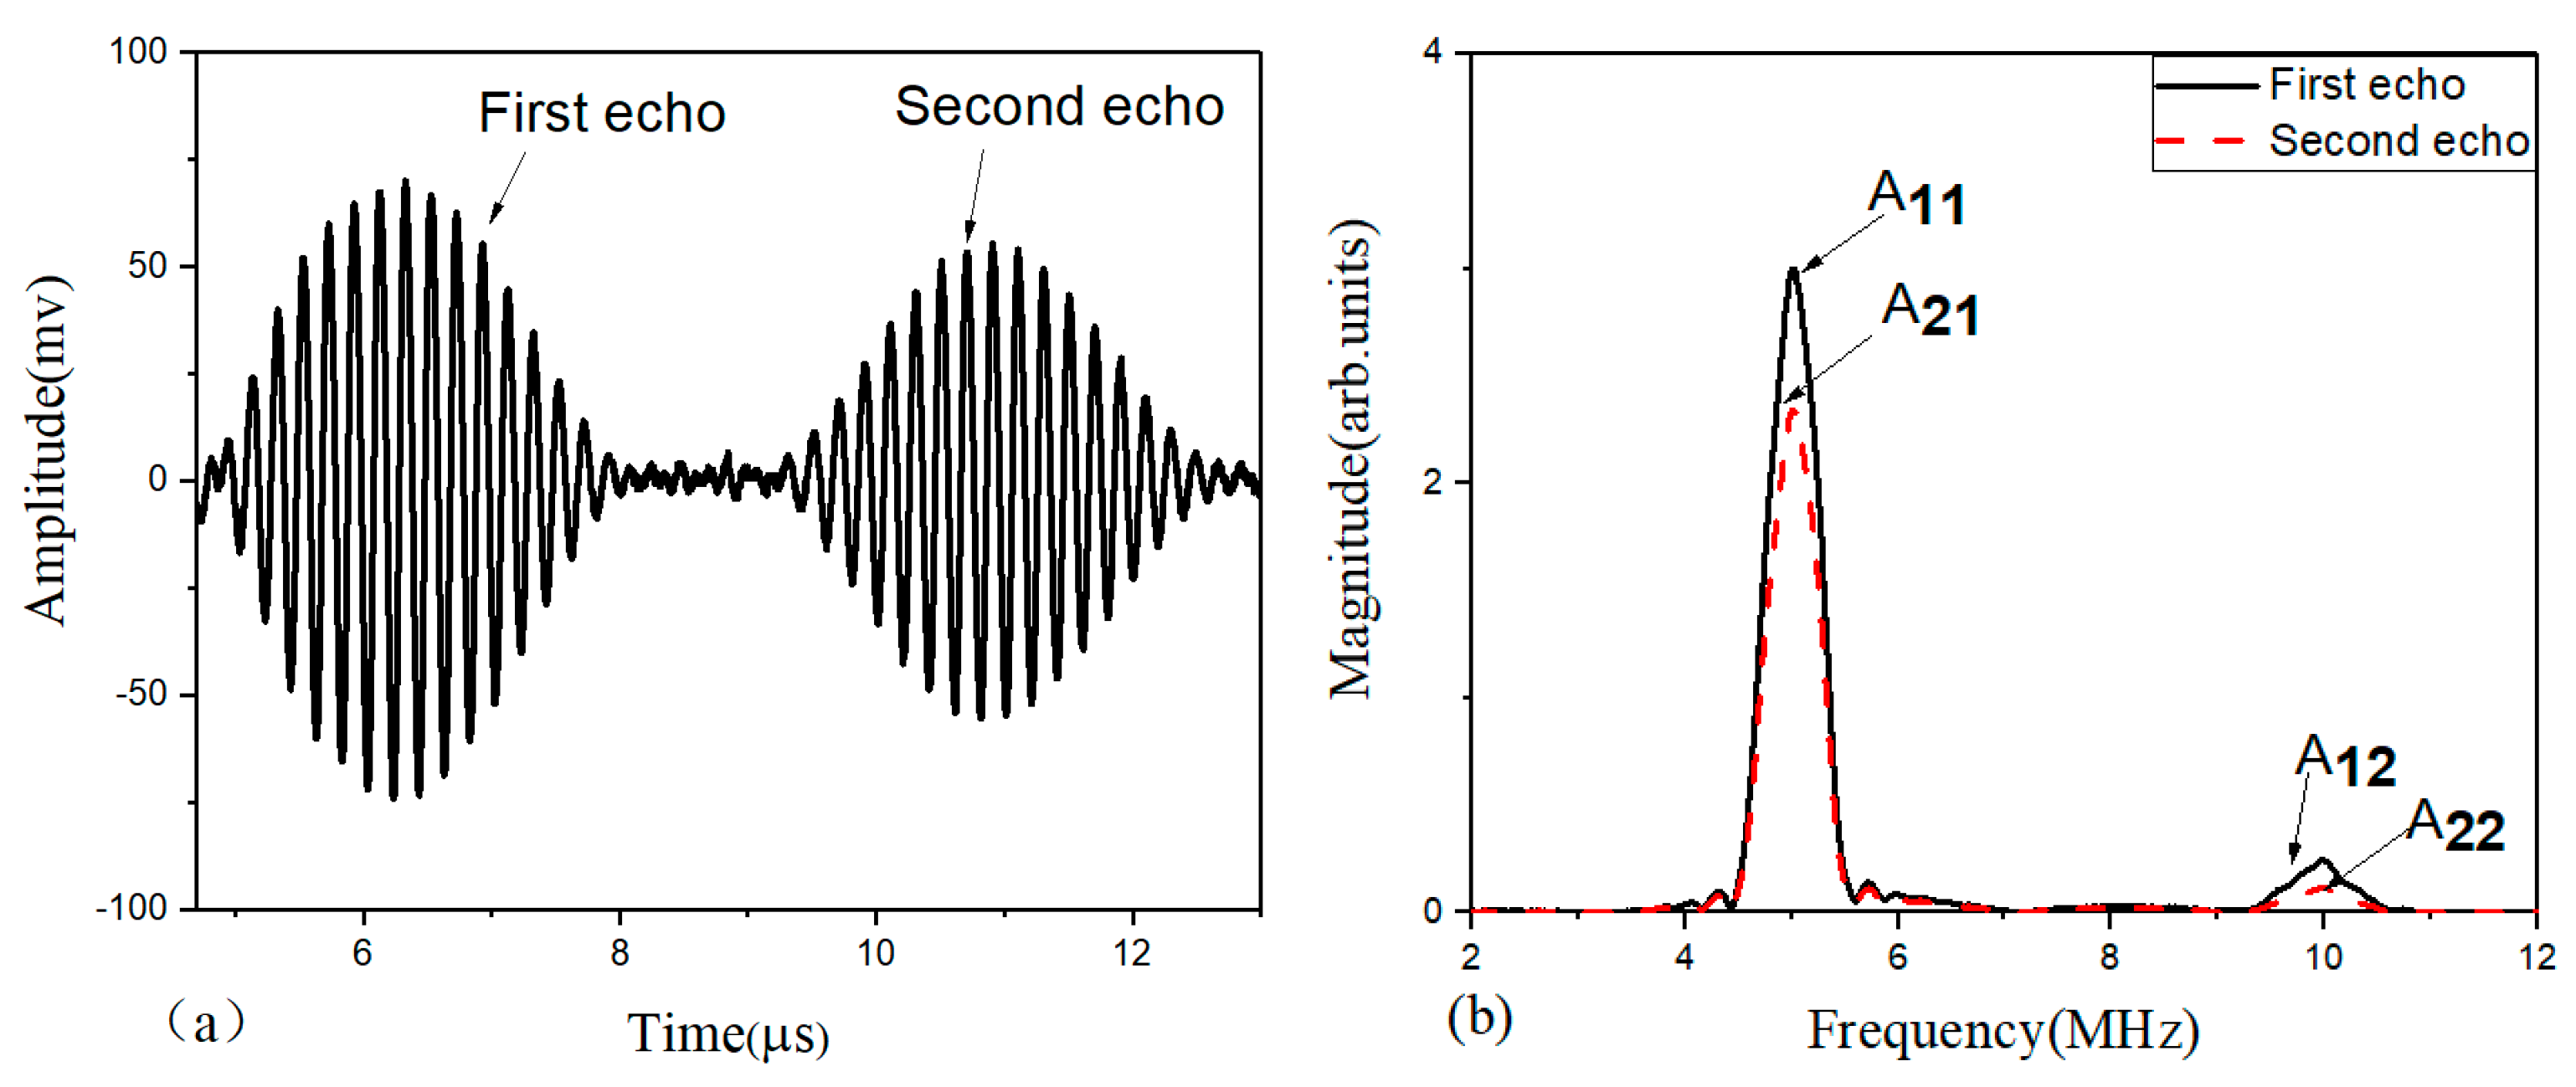
2. Nonlinear Ultrasonic Test

The typical nonlinear phenomenon is the generation of second harmonics. During the wave propagation in the specimen with distributed micro-damages, the formation of harmonics doubles the frequency of the incident ultrasonic wave [7,8,9]. The measurement of higher harmonic generation for micro-structural characterization is typically aimed at determining the value of acoustic nonlinear parameter β . The nonlinear parameter is related to the amplitudes of the fundamental wave and second harmonics [17,19].
β = 8 A 2 A 1 2 k 2 x ,
where A 1 and A 2 are amplitudes of the fundamental and second harmonic wave, respectively. k is wave number, x is wave propagation distance. In experiments, for a fixed wave number and propagation distance, the quantity β ¯ is measured:
β ¯ = A 2 A 1 2 β .
As shown in references [5,7,13], it is indicated that as the microstructure changes, for a fixed frequency and propagation distance, the changes in beta are mainly derived from the changes in the relative acoustic nonlinearity ( β ¯ = A 2 / A 1 2 ); β ¯ can be used to characterize the nonlinearity of a material. Thus, the material nonlinearity can be evaluated by detecting the fundamental and the second harmonic amplitudes.

3. Nonlinearity Adjusted by Attenuation Factor
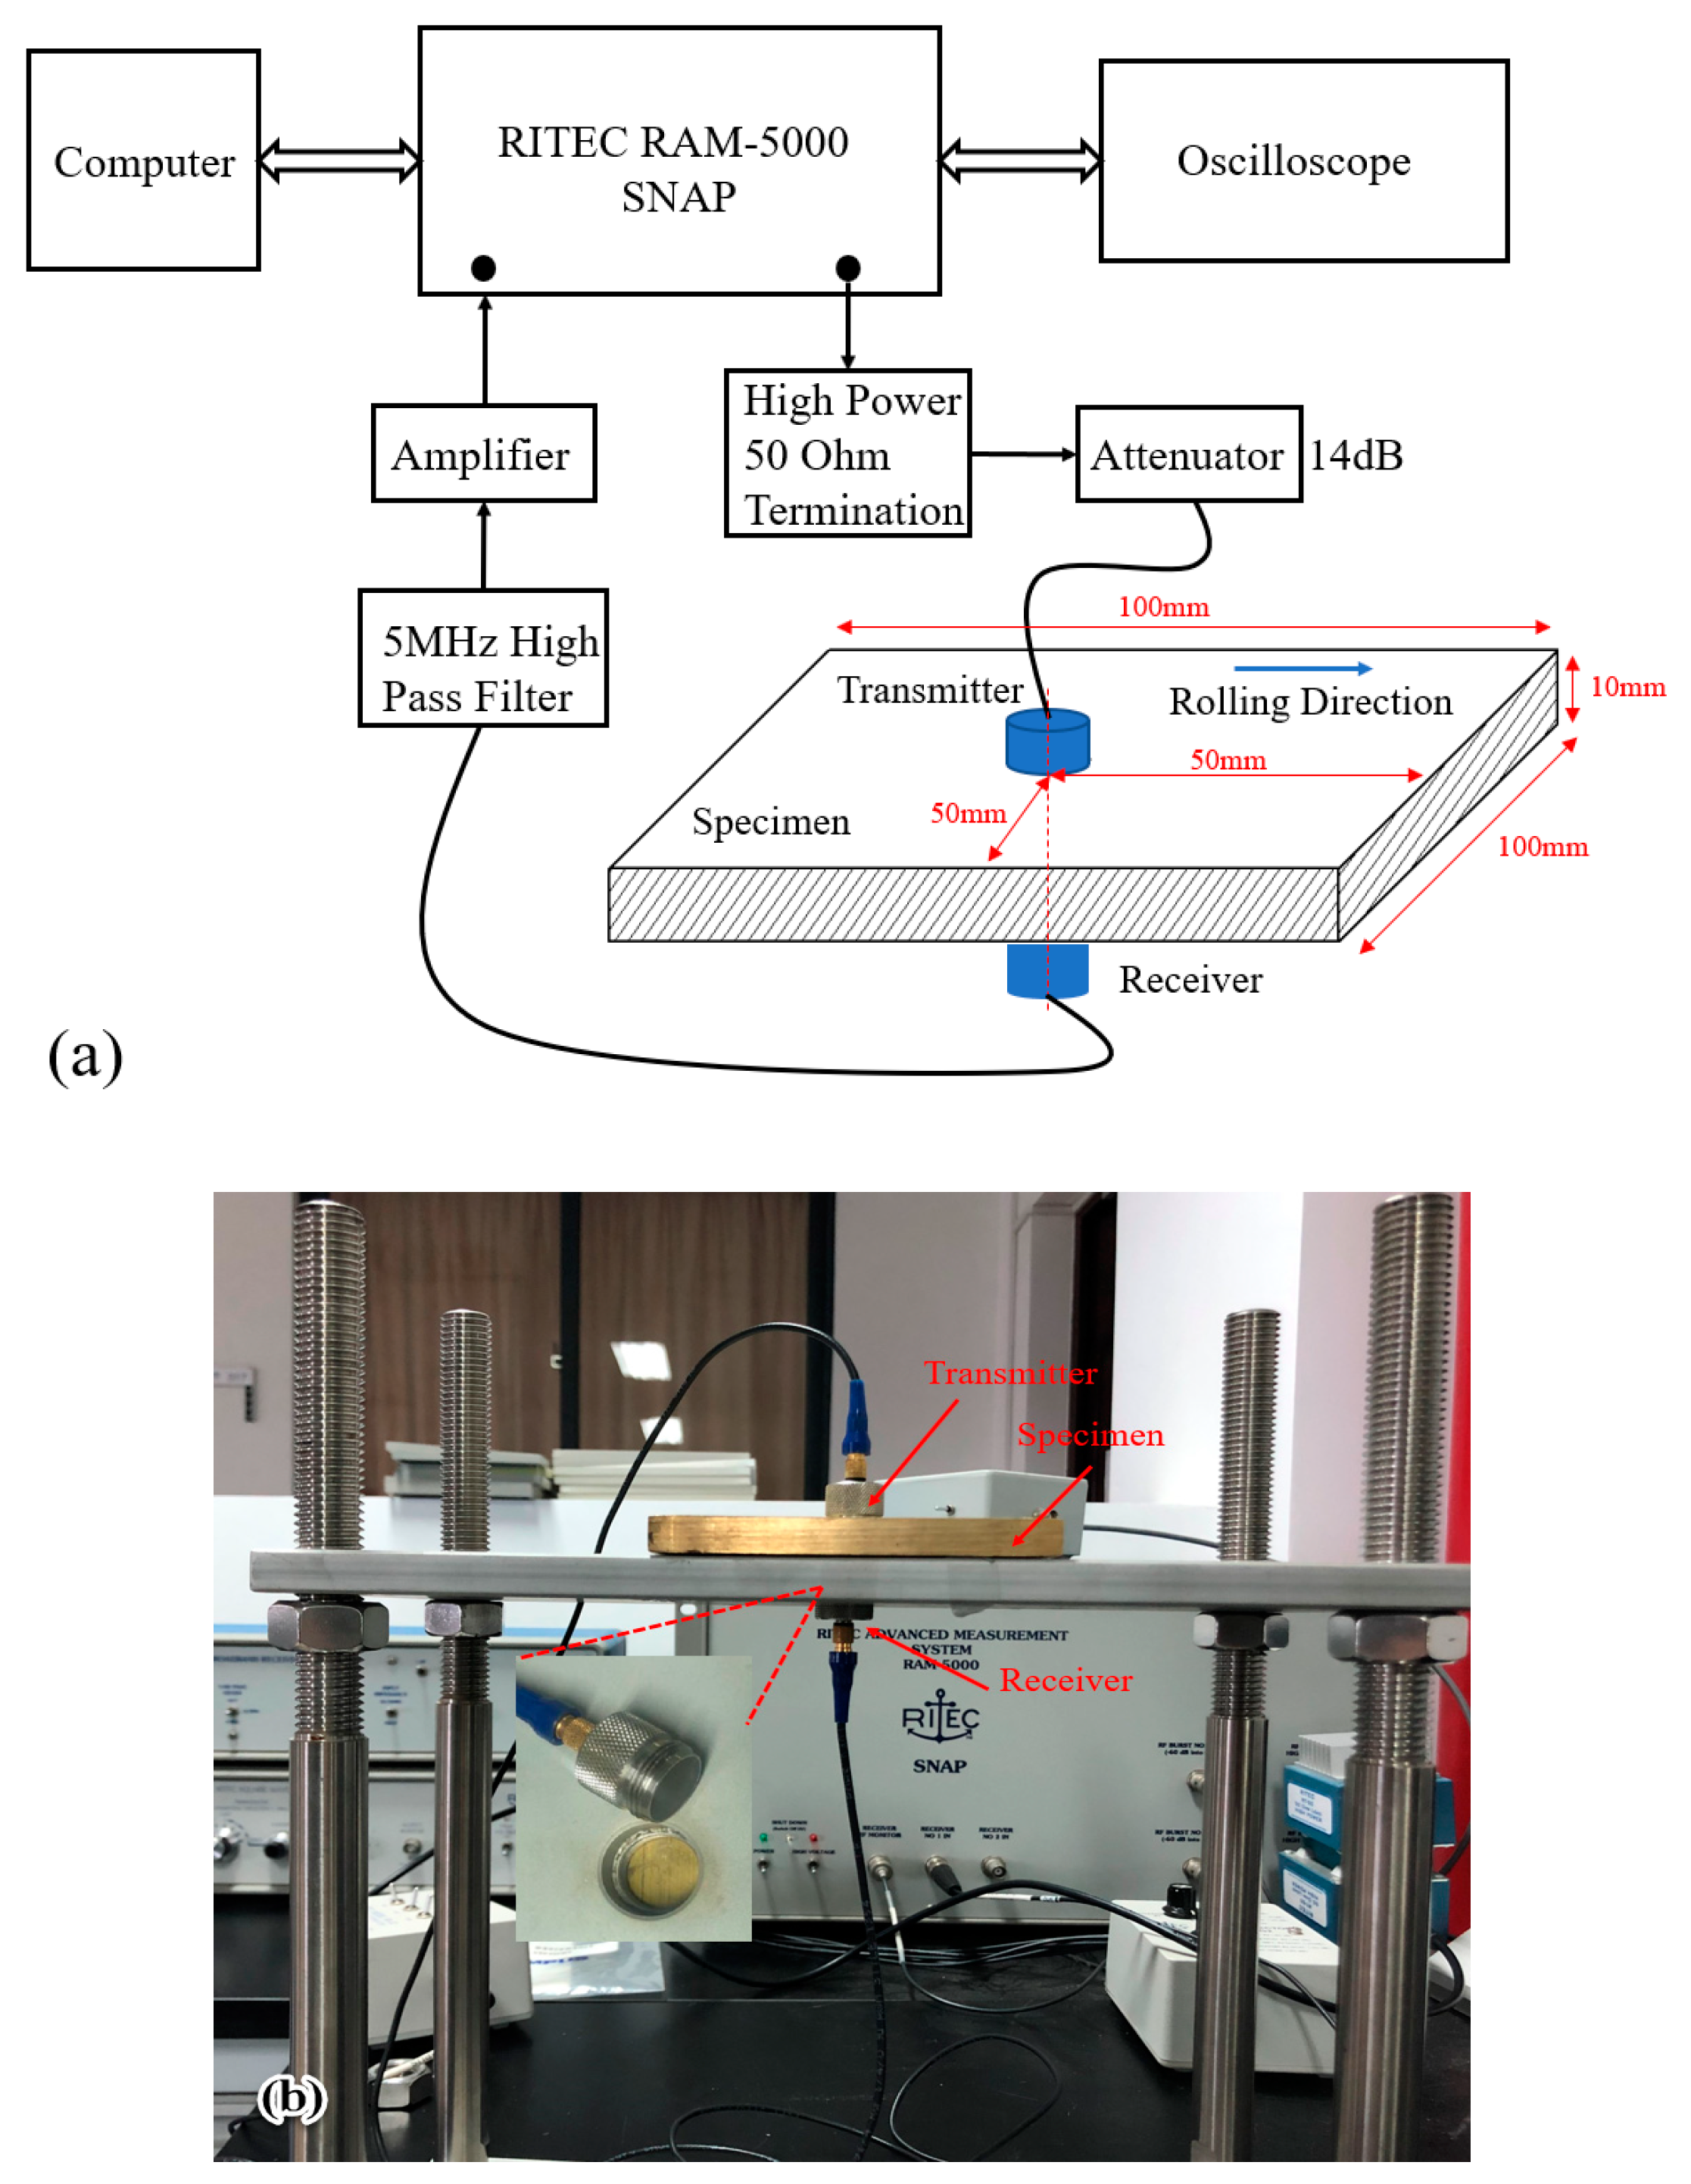
When an ultrasonic wave decays with propagation distance, attenuation can also be counted as a factor affected by material conditions [20]. It refers to the amplitude reduction ratio of wave signal in the logarithmic scale with respect to propagation distance between two neighboring positions, as defined in Equation (3). Generally, attenuation of an ultrasonic wave is highly dependent upon the frequency of propagation waves and microstructure of tested specimens [21]. In this work, the conventional method by the pulse-echo configuration is used to measure ultrasonic wave attenuation. The attenuation is denoted by a coefficient α that depends on frequency f as follows
ln A 1 e A 2 e = 2 α d ,
where, A 1 e and A 2 e are the amplitude of the first and second ultrasonic echo, respectively; α is the attenuation coefficient and d is the thickness of specimens. Regarding the acoustic nonlinear ultrasonic test, correction for the ultrasonic attenuation due to microstructural change in metallic materials is essential to separate nonlinear harmonic generation effects from linear grain scattering effects [22]. The measured acoustic nonlinear parameter can be corrected by the attenuation term [23]:
D α = ( m 1 e m ) , m = ( α 2 2 α 1 ) x ,
where α 1 and α 2 are the attenuation coefficients of the fundamental wave and the second harmonic, respectively, in the given specimen; x is the propagation distance. Thus, the tested relative nonlinear parameter can be adjusted with the attenuation correction factor as:
β ¯ c = A 2 A 1 2 D α ,
where β ¯ c is the measured acoustic nonlinear parameter corrected by attenuation coefficient.

4. Experiment

Copper and brass plates with rolling texture were used as samples. The chemical composition of the copper plate and the brass plate are given in Table 1 and Table 2, respectively. Samples were cut and prepared, each with final dimensions 100 mm × 100 mm × 10 mm. To control the micro-structural evolution, samples were annealed for the generation of new grains. To prevent oxidation of specimens during heat treatment process, samples were placed in a tubular furnace within an inert atmosphere of argon. All samples were cooled naturally inside of furnace. The samples will be annealed at 600 °C for 12 h after cold rolling.
The experimental setup to monitor the nonlinear ultrasonic wave is shown in Figure 1a. A high voltage sinusoidal tone burst signal at a frequency of 5 MHz is generated by the RITEC RAM-5000 SNAP system. The generated sinusoidal tone-burst signal then passes through a 50 Ohm termination and 14 dB attenuator, which is set to suppress the transient and purify the signal for a high signal-to-noise ratio (SNR). One narrow band piezoelectric transducer with a central frequency of 5 MHz is taken as the transmitter, while a broad band piezoelectric transducer with a central frequency of 10 MHz is employed to measure the second harmonics at double the frequency of the incident wave. The transducers are coupled to the specimen with light lubrication oil. The rolling direction of the specimen is marked with a blue arrow in Figure 1a. Both transducers are carefully placed on each side of the specimens with holders designed to ensure uniform coupling conditions, as shown in Figure 1b. The obtained time-domain signal is processed with the fast Fourier transformation after it passes through a 5 MHz high-pass filter and amplifier to extract and enhance the second harmonic generation. Signals are digitally processed by using the fast Fourier transformation (FFT) to obtain the amplitudes A1 at the fundamental frequency and A2 at the double frequency, respectively.

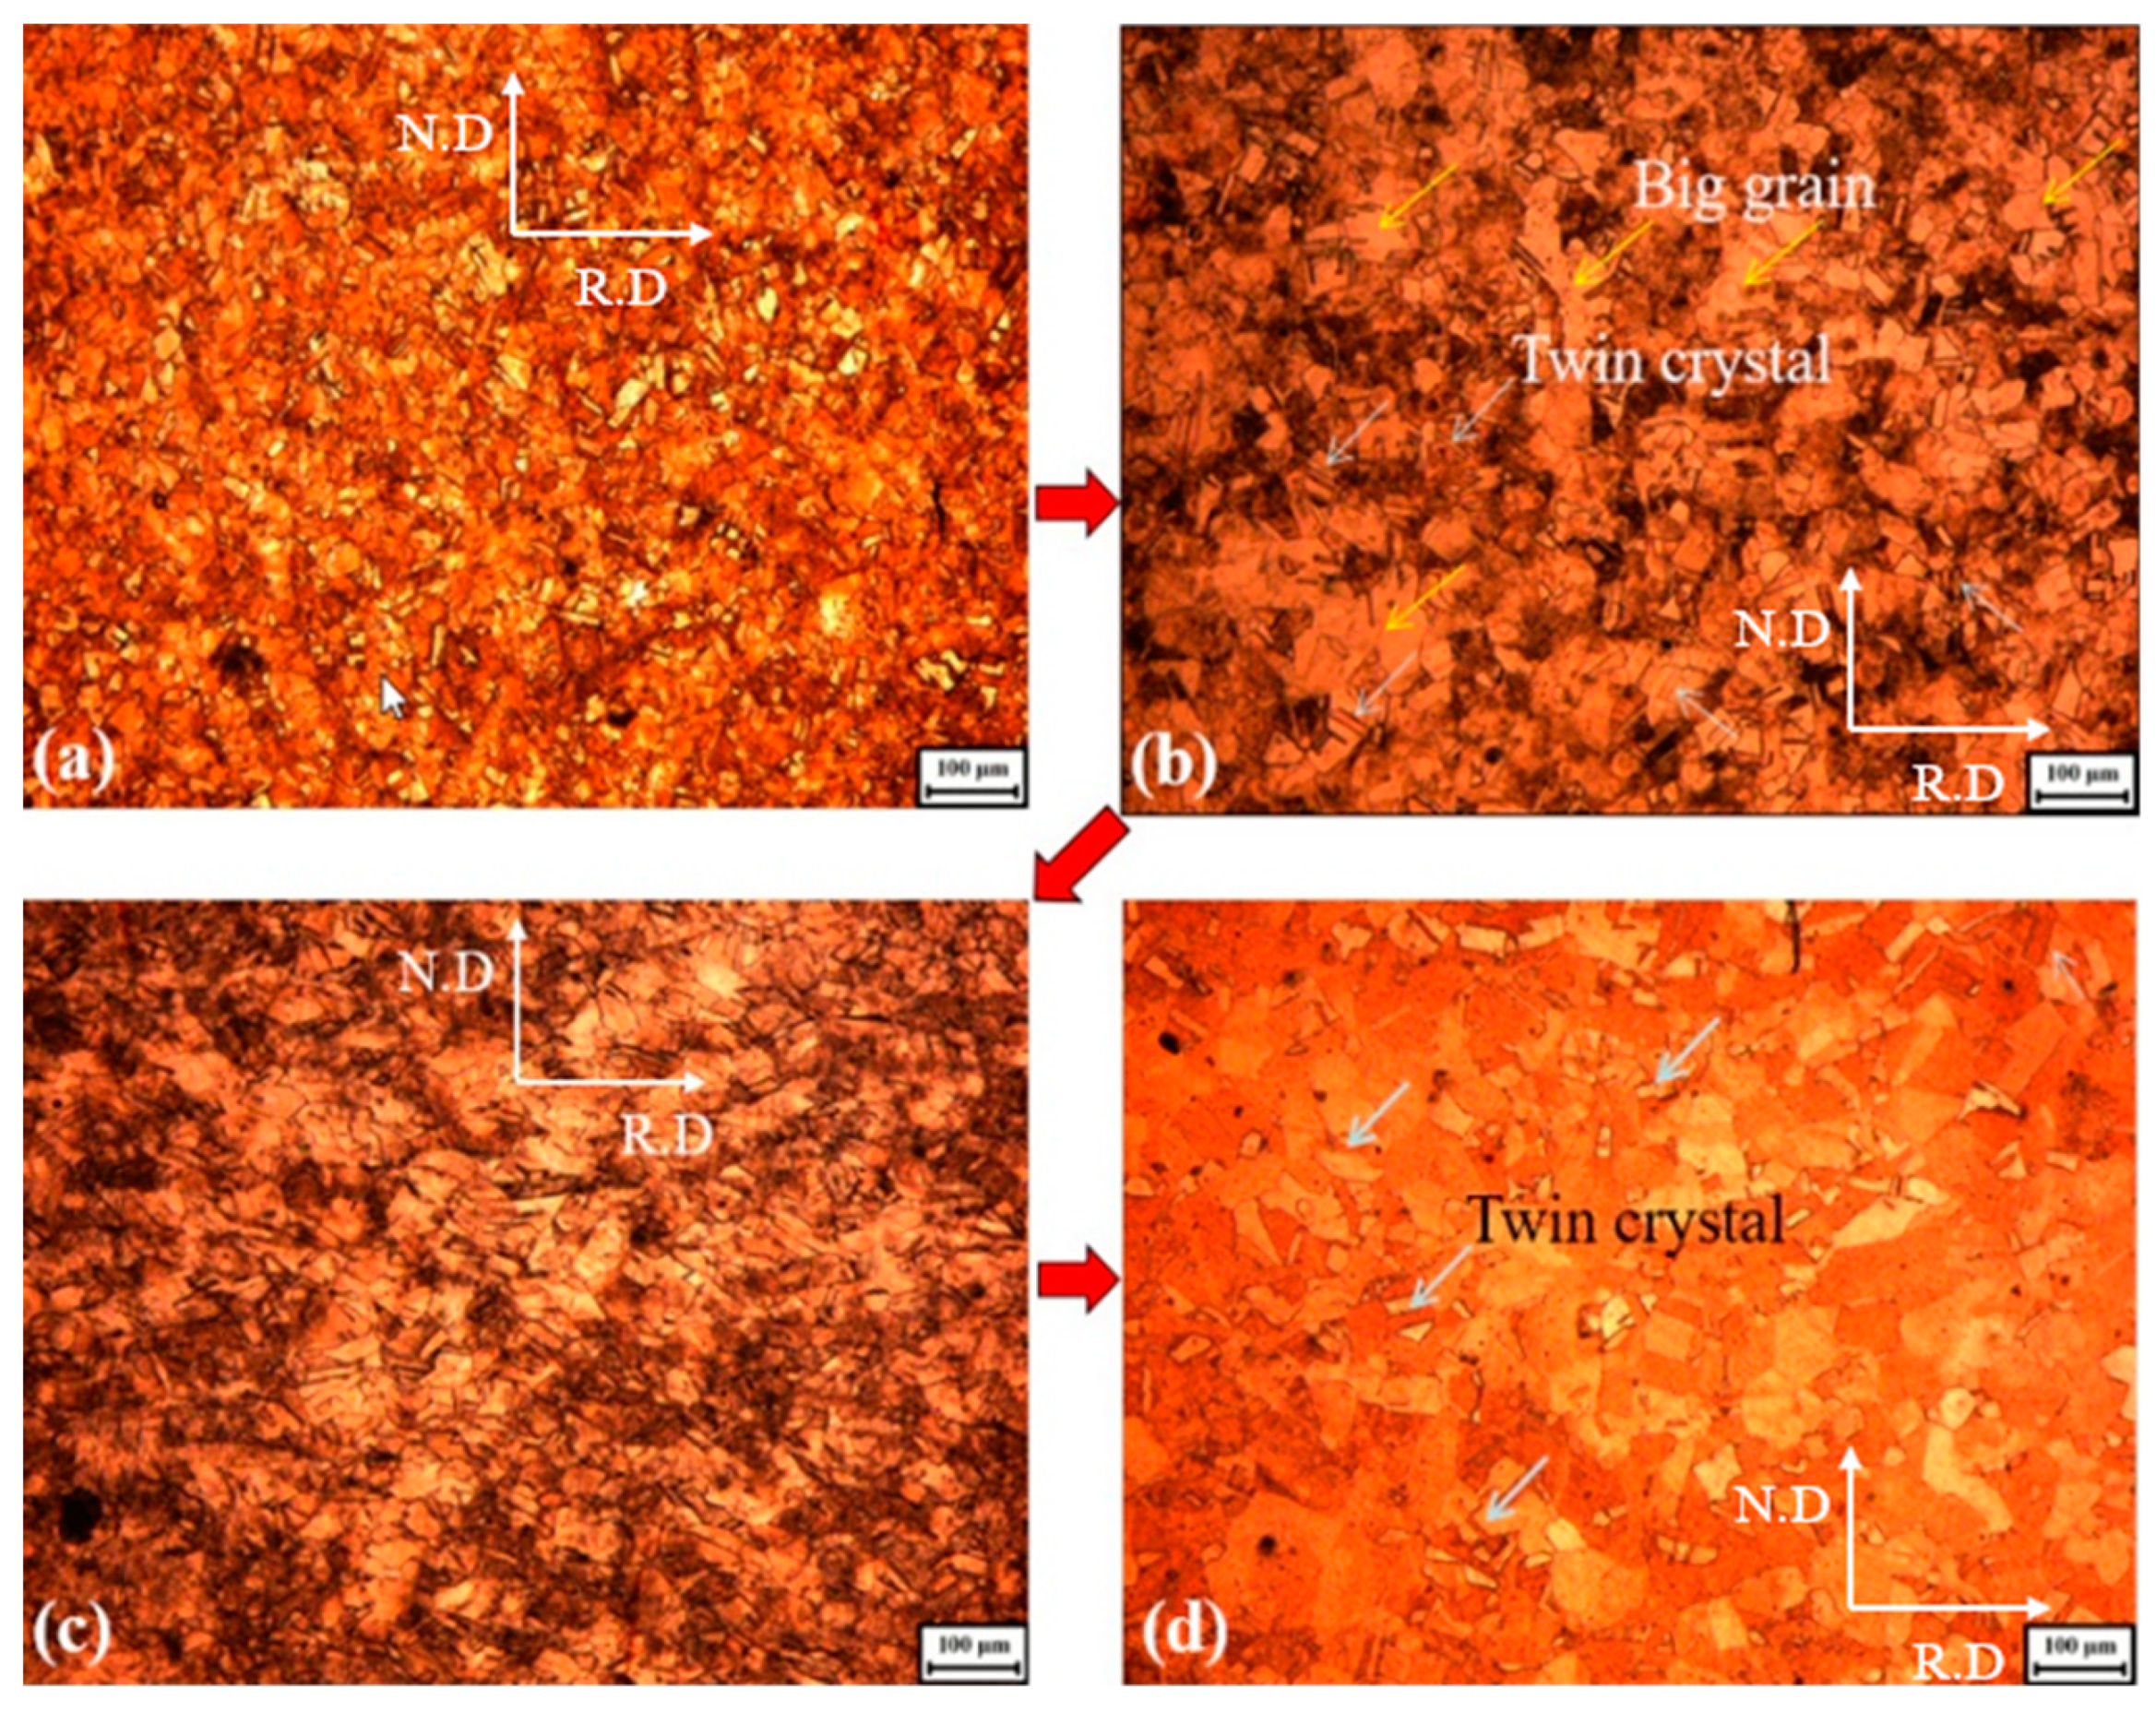
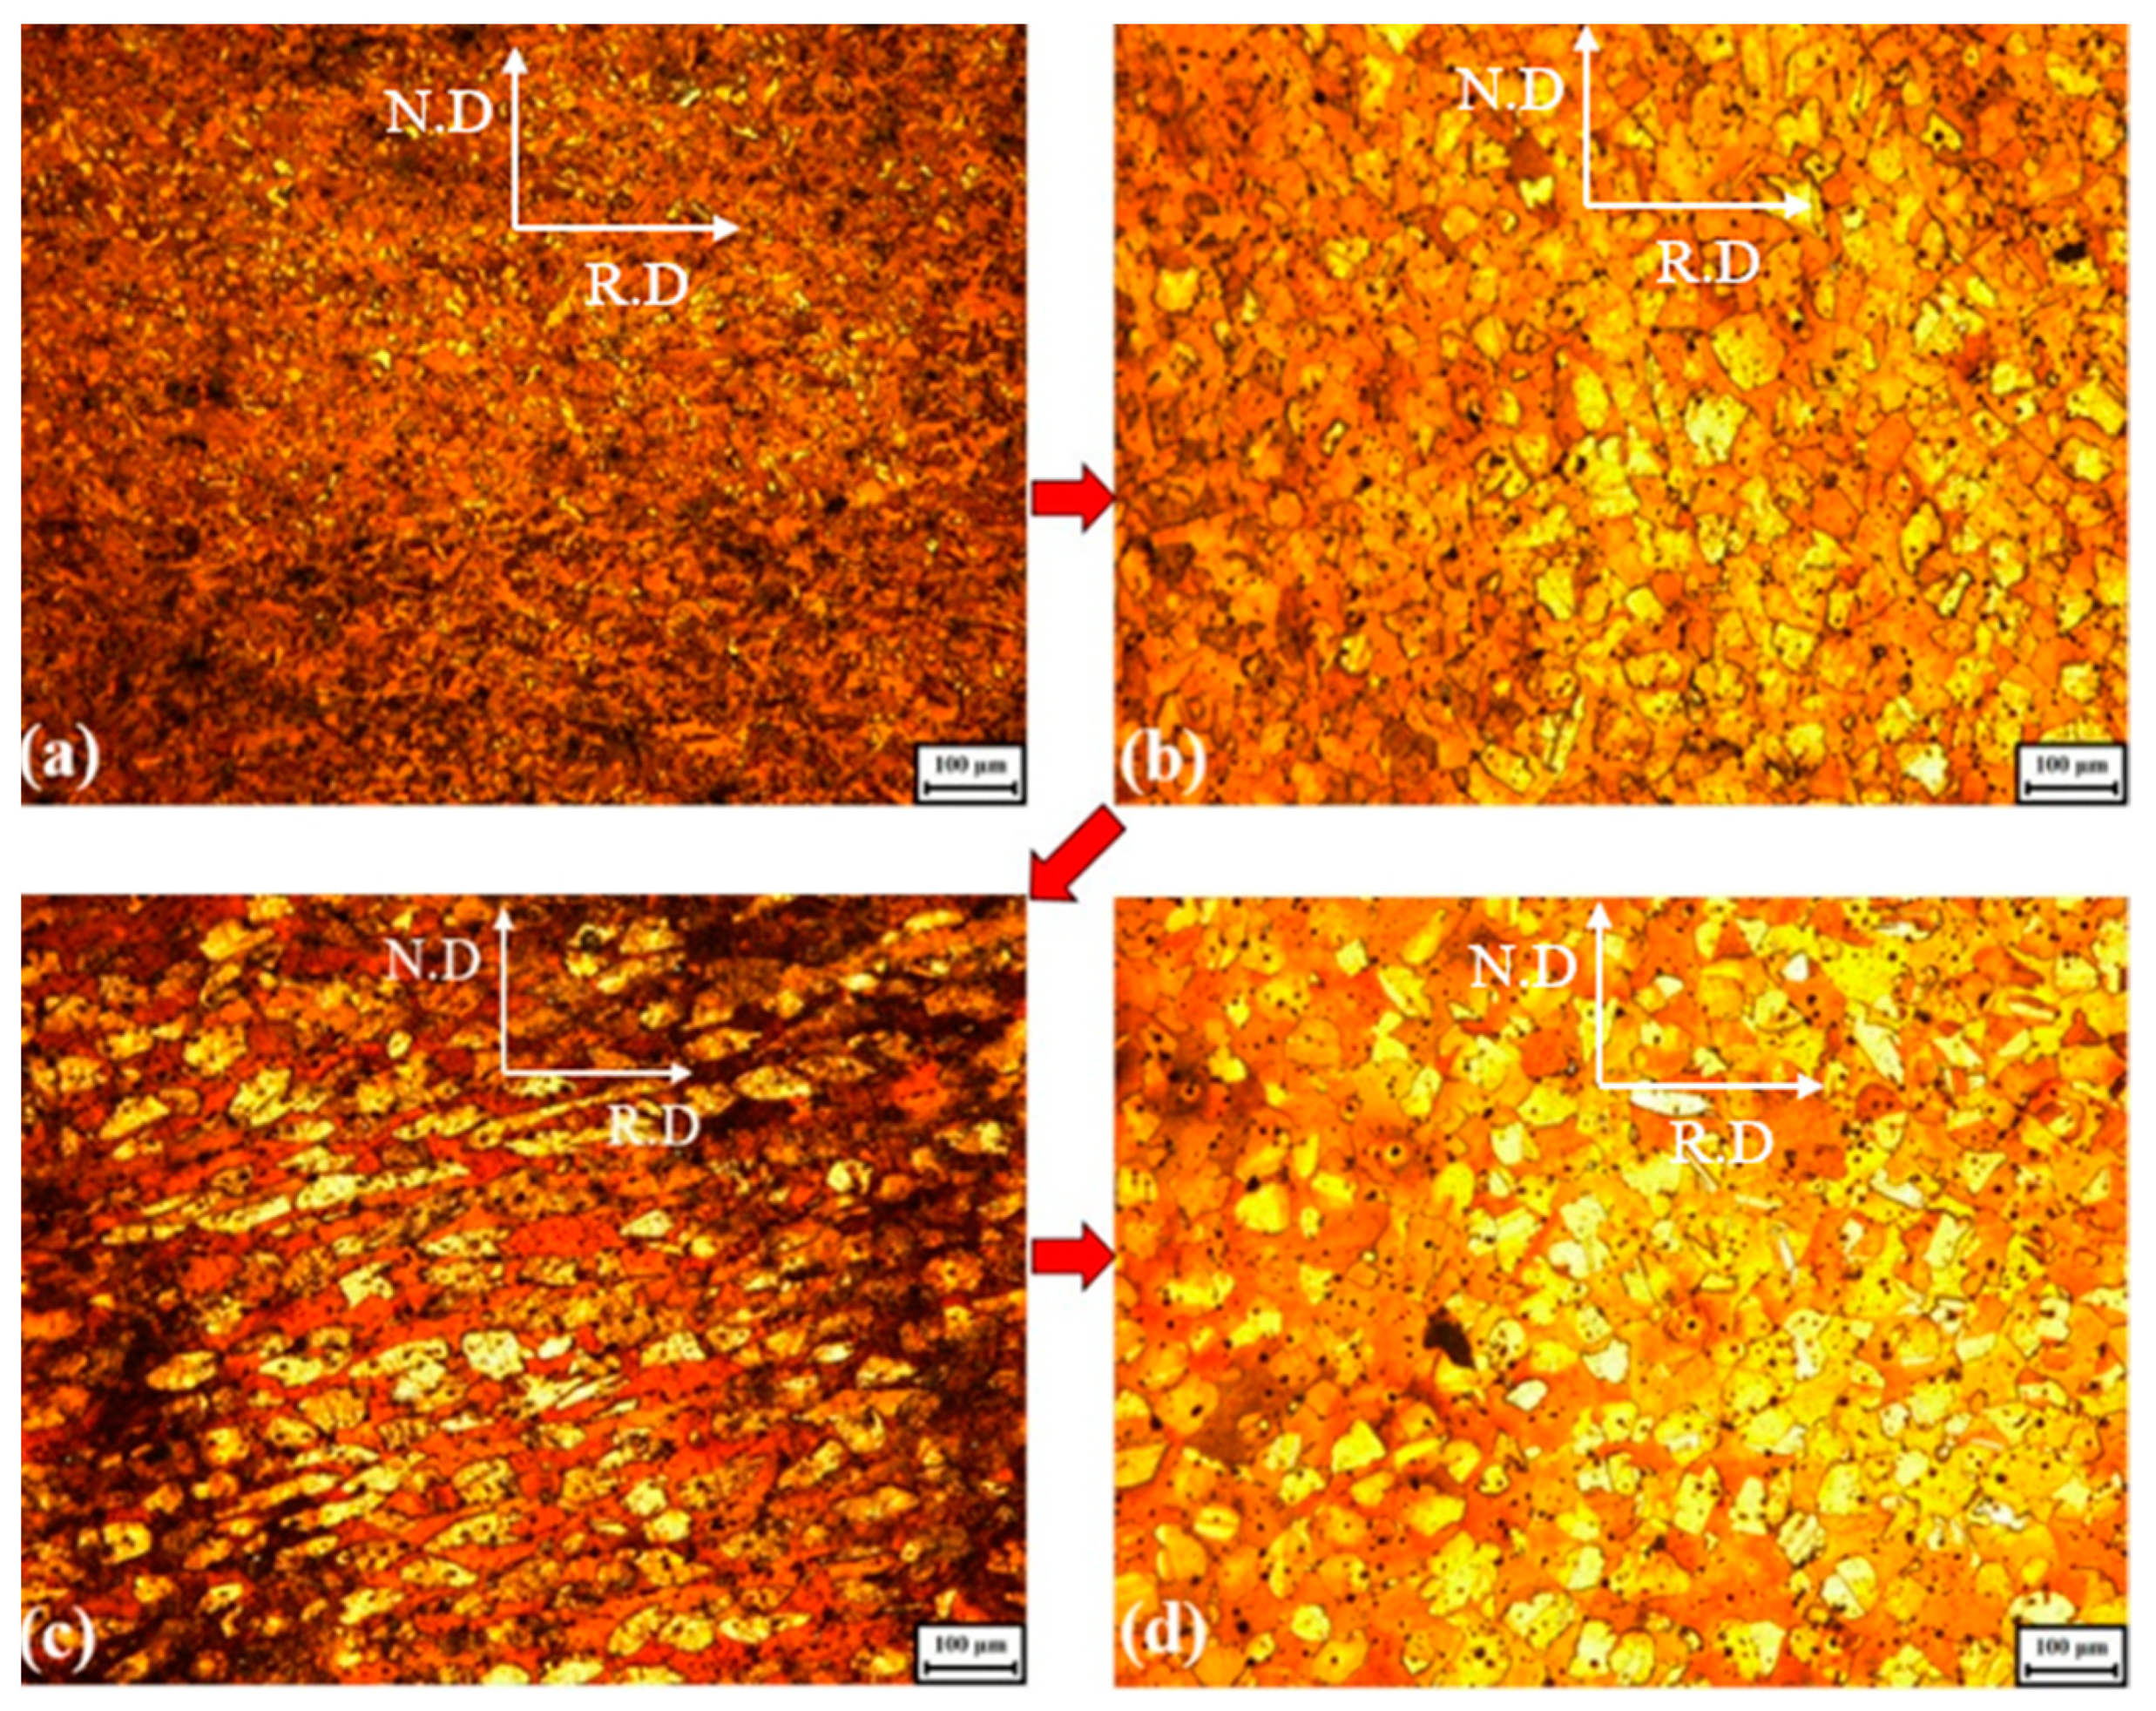
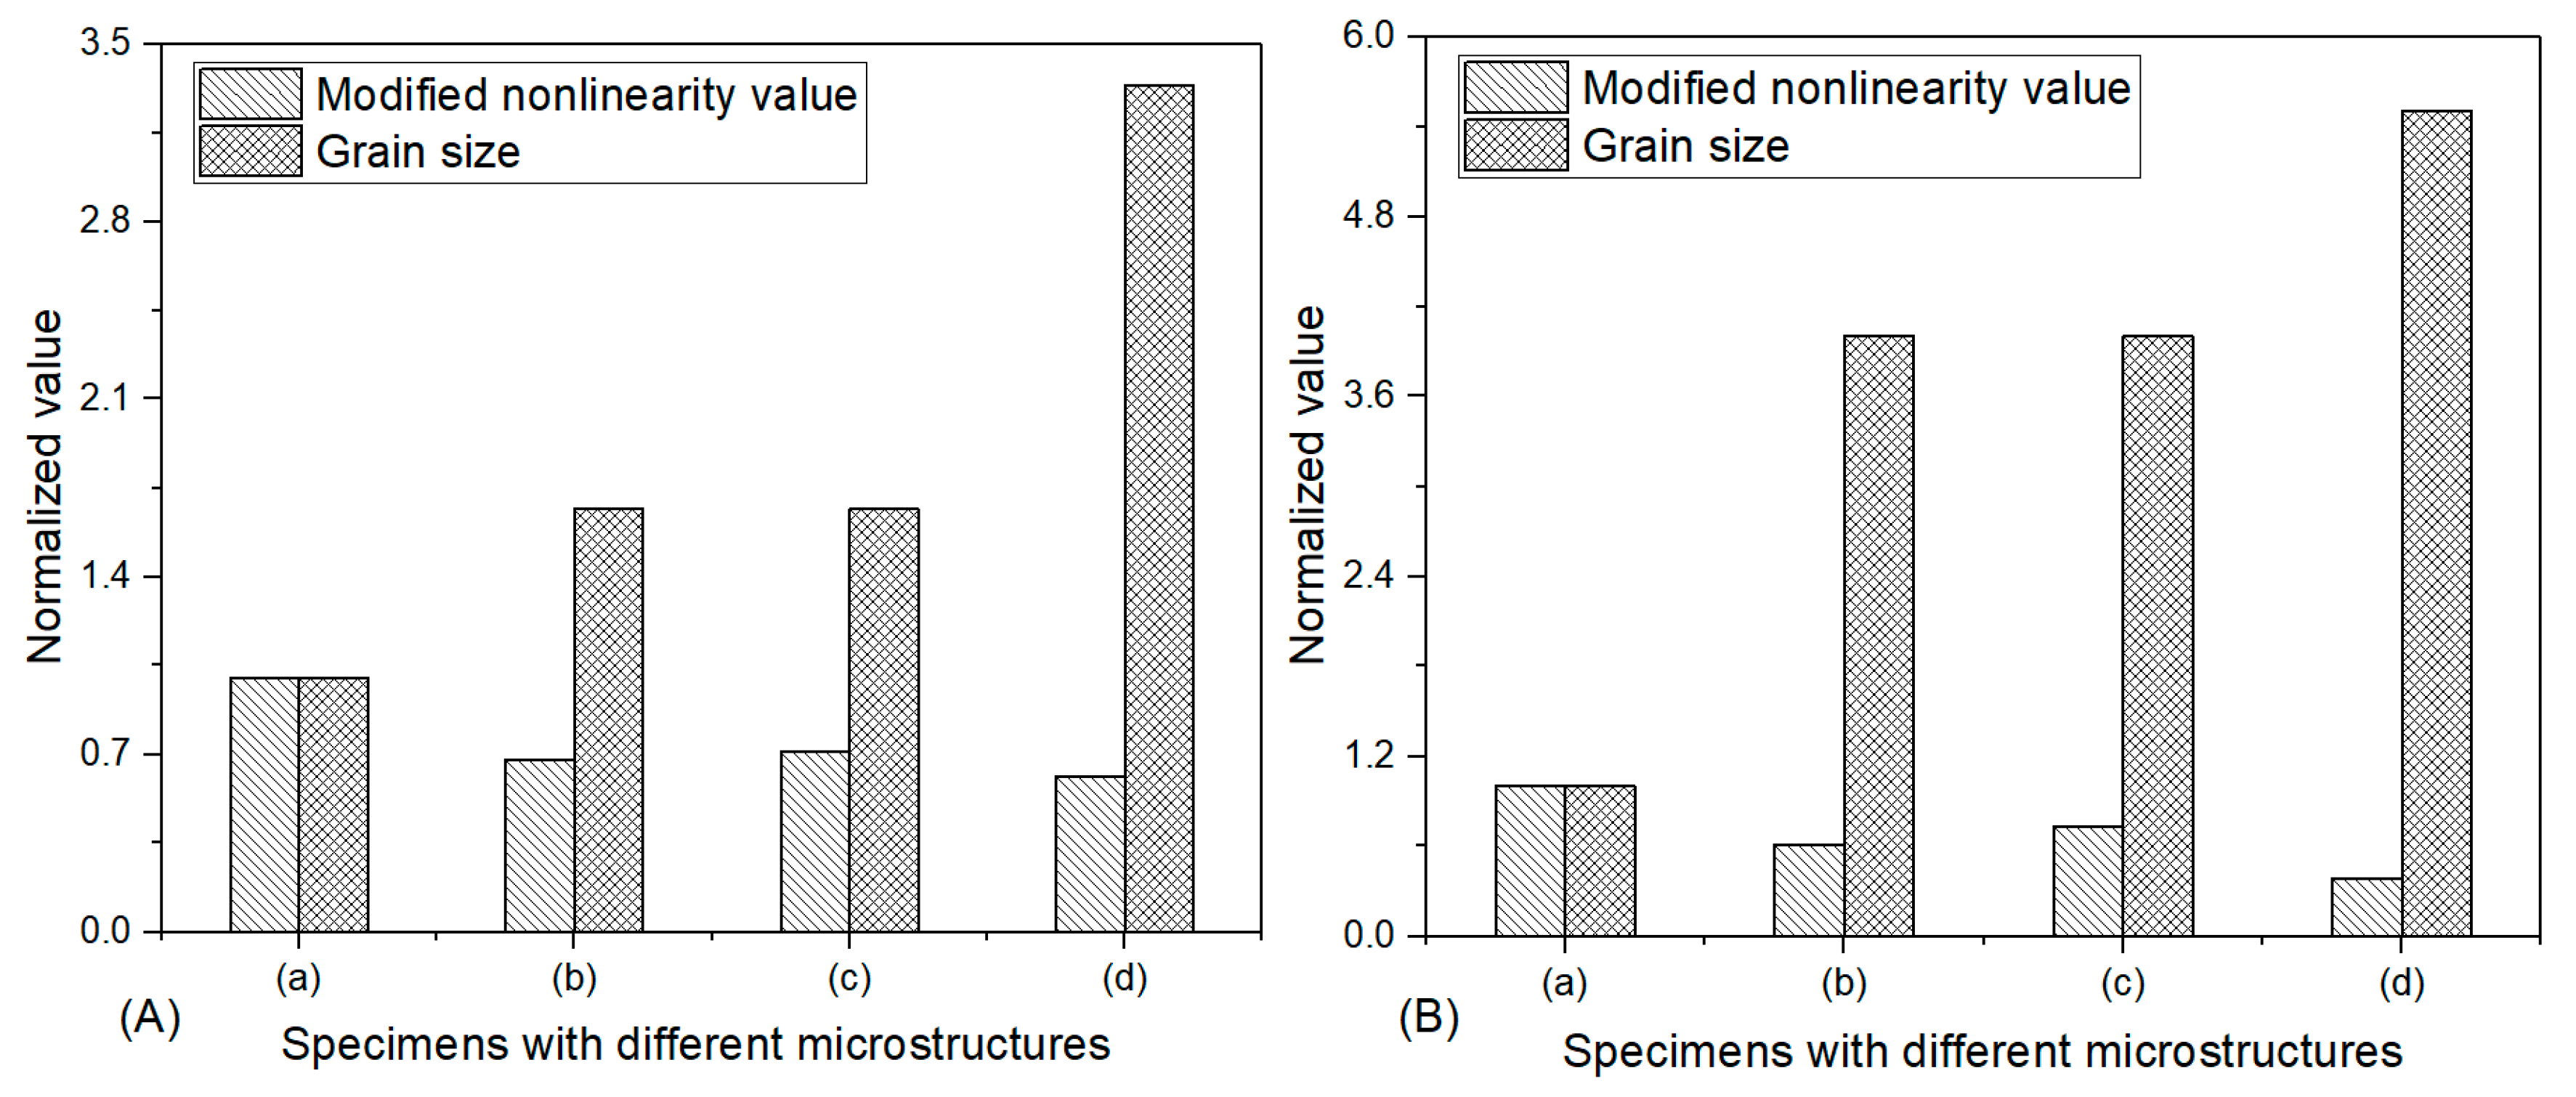
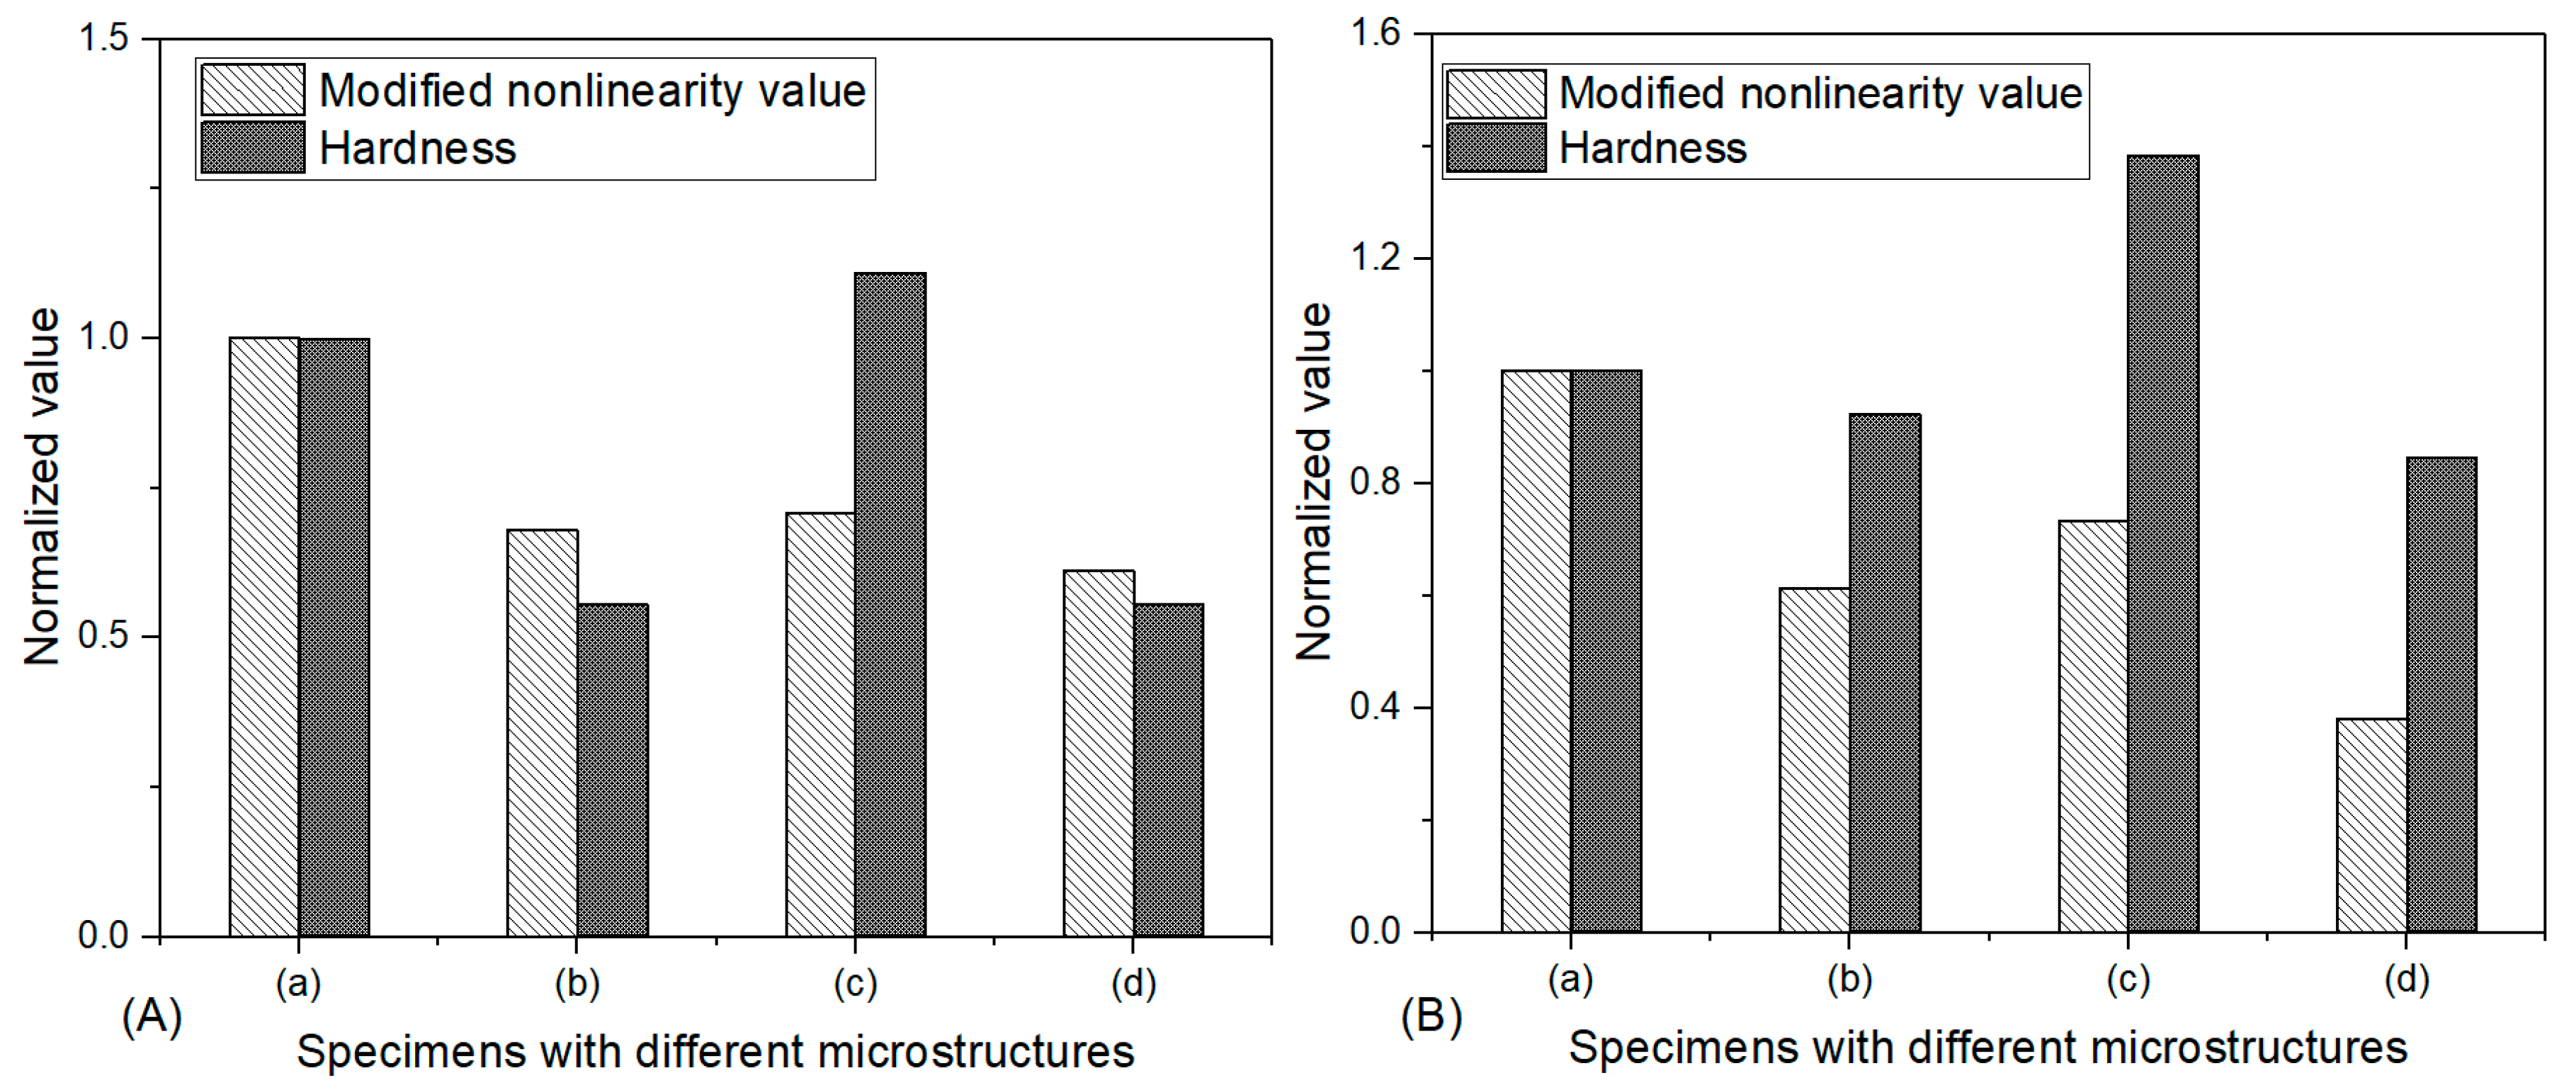
5. Results and Discussions

A typical ultrasonic wave signal is provided in Figure 2. As plotted in Figure 2a, the first echo and second echo of the received signals are obtained in the experiment. Each echo is digitally processed by using the fast Fourier transformation to obtain amplitude at primary wave and second harmonics, respectively. As shown in Equation (1), the nonlinear parameter of the ultrasonic waves is represented as the function of the ratio of the second harmonic amplitude to the square of the fundamental amplitude for a fixed wave number and propagation distance. This value represents the acoustic nonlinearity being correlated with the material nonlinearity of each specimen. The measured parameters are normalized to their initial values to display relative changes for the convenience of reading data. As shown in Figure 2b, A 11 and A 12 are the fundamental frequency amplitude and the second harmonic amplitude of the first echo, respectively. A 21 and A 22 are the fundamental frequency amplitude and the second harmonic amplitude of the second echo, respectively. The attenuation coefficient α 1 is obtained by substituting A 11 , A 21 , and the specimen thickness d into the Equation (3). The attenuation coefficient α 2 is obtained by substituting A 12 , A 22 , and the specimen thickness d into Equation (3). The nonlinear coefficient β ¯ is calculated by substituting A 11 and A 12 into the Equation (2).
Microstructural evolution in the specimens is artificially controlled by cold rolling and annealing treatments. Generally, for the raw copper and brass materials, there is some irreversible elastic deformation along with the residual strain or stress inside the samples. During cold rolling process, the numerous dislocations, elastic deformation and residual stress or strain will be introduced into the specimen, while the grain size will remain relatively unchanged during the cold process. After rolling, the samples will be annealed at 600 °C for 12 h. Oppositely, during the annealing process, the residual strain or stress will be reduced and re-crystallization will occur in the specimens. For the recrystallization, the elastic deformation will be eliminated, thus, the hardness of the specimens will decrease. New grains with bigger size will be generated after annealing, and 12 h are long enough to ensure the growth of the new grains. Thus, the distinctions of acoustic nonlinear response in the specimens under different damage levels but with similar grain sizes, and those in the specimens with different grain sizes, but under same damage levels, can be conducted experimentally in this investigation.
Figure 3 and Figure 4 show the micro-structural evolution of copper and brass at four different stages. The “line intercept” method [24,25] was used for the determination of grain size. Variations of grain size of specimens with different stages were shown in Figure 5. The hardness of each stage was determined using a Wolpert-Wilson micro-Vickers hardness tester. Variations of material hardness of specimens with different stages were shown in Figure 6. For copper, ss shown in Figure 3a, the grain size was about 30 µm at the initial state, and there were some dislocations in microstructure scale. After annealing at 600 °C for 12 h, as shown in Figure 3b, the grain size of the copper sample is bigger than that in the sample at the initial state. In addition, some grains with much bigger sizes (about 100 µm) were observed and some twin grain boundaries were observed too (denoted by the arrows in the figure). Samples were cold rolled after annealing. The deformation rate was about 24.6%, which was calculated by l ˜ l l × 100 % , where l ˜ is the length of the plate in the rolling direction before rolling, and l is the length of the plate in the rolling direction after rolling. As shown in Figure 3c, after cold rolling, the microstructure of the sample was deformed, and a lot of dislocations were generated. Meanwhile, even the shape of the grain was changed somewhat, but the grain size almost remained similar. Re-annealing treatment of 600 °C for 12 h was applied to the samples after cold rolling, and the microstructure for this stage is provided in Figure 3d. As can be seen, compared with the previous stage, the number of dislocations was reduced and the grain size was increased.
Similar phenomena were also observed for brass, as shown in Figure 4. The grain size of the sample was about 20 µm at the initial state. After annealing at 600 °C for 12 h, the grain size of the sample was increased to 80 µm. Cold rolling was used to result in the generation of microstructural defects, including dislocations, elastic deformations, etc., while the grain sizes in the sample stayed similar. The re-annealing process was also applied to the sample for recrystallization. The defects were eliminated after annealing and grain size was about 110 µm in the brass sample at this stage.
Grain boundaries can be taken as the micro-discontinuities in the material. Generally, bigger grain size corresponds to less grain boundaries (more material nonlinearities) in the specimen. As shown in Figure 5, the cold rolling does not affect the grain size in the specimen, which means that the variation of acoustic nonlinear response in the specimens before and after cold rolling is mainly due to the micro-damages rather than grain boundaries. Hardness can be used to identify the density of dislocations in specimens [14]. The increase of hardness in specimens corresponds to the increase of dislocation density. The obvious change of hardness of the specimens can be obtained by the annealing and rolling treatments, as shown in Figure 6.
Figure 7 and Figure 8 show spectrums of ultrasonic testing results for copper and brass plates, respectively. The amplitude parameters in each spectrum are obtained and used to calculate the attenuation coefficient and the nonlinear coefficient. The values of ultrasonic attenuation parameters at fundamental frequency and double frequency in the specimens with different microstructures are calculated as described above. The attenuation correction term can be calculated by the obtained attenuation parameters. In order to ensure repeatability, we repeat the test three times for each particular case and all parameters are calculated three times separately. As shown in Table 3; Table 4, σ is the standard deviation of β ¯ c . The experimental results of ultrasonic testing results in these specimens of copper and brass are corrected by the term D α . The tables reveal that the variation trends of acoustic nonlinearity corresponding to the microstructural evolution in the specimens are approximately consistent before and after the corrections of term D α . It is also clearly found that values of measured acoustic nonlinearity in all the specimens are higher after the modification by correction term. It is important to note that thickness decrease of tested specimens after cold rolling could appear, thus, the rolling process is carefully controlled and introduced into the specimens to minimize the variation of thickness. In addition, this investigation is to correlate the acoustic nonlinear response with material micro-structural change; the effect of slight thickness variations of specimens on measured results is negligible in this work. Regarding the ultrasonic test in solid media, it is known that the minor change of tested specimen thickness has limited effect on the measured acoustic parameter of ultrasonic wave propagation in the specimen, which are generally not considered [21,22,23].
As illustrated in Figure 9 and Figure 10, there is a significant decrease of acoustic nonlinearity of ultrasonic waves in the specimens after the annealing process. This phenomenon can be interpreted precisely as: after annealing, the decrease of hardness is attributed to the decrease of dislocation density in the specimens. A certain level of elastic deformation in the specimens is also eliminated after annealing. The increase of grain size corresponds to the decrease of grain boundaries. All of these contributions which happened in the specimen could minimize the acoustic nonlinear response of ultrasonic wave propagation. Similar results can also be found in our earlier investigation about the heat treatment effect on acoustic nonlinear response [7]. In the following stage, it is found that acoustic nonlinearity in the specimens increase a little after cold rolling due to the increase of dislocation density and elastic deformations. However, it is important to note that the cold rolling process does not affect the grain size, and the contribution from the variations of grain boundaries to the change of nonlinearity can be neglected. In the final stage, after the specimens are re-annealed, it is found that there is another sharp decrease of nonlinearity in the specimens. After comparing the effects of microstructural evolution in (b) and (c) on acoustic nonlinear response, it is found that the variation of acoustic nonlinear response is very tiny. Though the condition of grain sizes of specimens is unchanged, even then, obvious microstructural defects existed in the sample at stage (c). The comparisons of the influences of grain boundaries and the microstructural defects, including elastic deformations, dislocations, as well as the residual stress or strain on the acoustic nonlinear response, indicate that the grain boundaries play a dominant role for the contributions of acoustic nonlinearity. Grain boundaries are interfacial defects that separate grains having different crystallographic orientations in a polycrystalline material, which can be taken as micro-cracks in the specimens. More grain boundaries or intercepts in the wave propagation path can significantly increase the distortion of ultrasonic waves. This interesting finding shows that the use of nonlinear ultrasonics can only be effective to characterize efficiently the material degradations under the condition that the variations of grain sizes in the specimens with different damage states are negligible.

6. Conclusions

The effects of material microstructural evolution on acoustic nonlinear response of ultrasonic waves are studied in rolled copper and brass materials. Cold rolling is used to introduce micro-defects, including elastic deformation, dislocations, and residual stress or strain into the specimens, while the annealing treatment is used to change the grain size. The variations of acoustic nonlinear response of ultrasonic waves corresponding to the evolution of micro-structures in the samples are obtained. The comparisons of influences of grain boundaries and the micro-damages on the acoustic nonlinear response in the specimens show that the grain boundaries play a dominant role for the contributions of acoustic nonlinearity. The experimental results also indicate that the degradation of material properties is not always accompanied by the increase of nonlinearity. It suggested that the nonlinear ultrasonic waves can be used to characterize efficiently the material degradations, in the condition that the variations of grain sizes in the specimens with different damage states are negligible.

Author Contributions

Conceptualization, W.L., X.Q., and Y.C.; formal Analysis, B.C.; writing and editing, W.L., X.Q., B.C., and Y.C.; funding acquisition, W.L., X.Q., and Y.C.

Funding

This work was supported by the National Natural Science Foundation of China (11774295, 11772279), and the open project of Xiamen Engineering Technology Center for Intelligent Maintenance of Infrastructures (TCIMI201812).

Conflicts of Interest

The authors declare no conflict of interest.

References

  1. Cantrell, J.H.; Yost, W.T. Nonlinear ultrasonic characterization of fatigue microstructures. Int. J. Fatigue 2001, 23, 487–490. [Google Scholar] [CrossRef]
  2. Nagy, P.B. Fatigue damage assessment by nonlinear ultrasonic materials characterization. Ultrasonics 1998, 36, 375–381. [Google Scholar] [CrossRef]
  3. Xiang, Y.; Deng, M.; Xuan, F.Z. Creep damage characterization using nonlinear ultrasonic guided wave method: A mesoscale model. J. Appl. Phys. 2014, 115, 004914. [Google Scholar] [CrossRef]
  4. Balasubramaniam, K.; Valluri, J.S.; Prakash, R.V. Creep damage characterization using a low amplitude nonlinear ultrasonic technique. Mater. Charact. 2011, 62, 275–286. [Google Scholar] [CrossRef]
  5. Li, W.; Cho, Y. Thermal fatigue damage assessment in an isotropic pipe using nonlinear ultrasonic guided waves. Exp. Mech. 2014, 54, 1309–1318. [Google Scholar] [CrossRef]
  6. Cantrell, J.H. Dependence of microelastic-plastic nonlinearity of martensitic stainless steel on fatigue damage accumulation. J. Appl. Phys. 2006, 100, 063508. [Google Scholar] [CrossRef] [Green Version]
  7. Li, W.; Lee, J.; Cho, Y.; Achenbach, J.D. Assessment of heat treated inconel x-750 alloy by nonlinear ultrasonics. Exp. Mech. 2013, 53, 775–781. [Google Scholar] [CrossRef]
  8. Jhang, K.Y. Applications of nonlinear ultrasonics to the NDE of material degradation. IEEE Trans. Ultrason. Ferroelectr. Freq. Control 2000, 47, 540–548. [Google Scholar] [CrossRef] [PubMed]
  9. Cantrell, J.H. Substructural organization, dislocation plasticity and harmonic generation in cyclically stressed wavy slip metals. Proc. R. Soc. London Ser. A 2004, 460, 757–780. [Google Scholar] [CrossRef]
  10. Cantrell, J.H. Crystalline structure and symmetry dependence of acoustic nonlinearity parameters. J. Appl. Phys. 1994, 76, 3372–3380. [Google Scholar] [CrossRef]
  11. Pruell, C.; Kim, J.Y.; Qu, J.; Jacobs, L.J. Evaluation of plasticity driven material damage using lamb waves. Appl. Phys. Lett. 2007, 91, 231911. [Google Scholar] [CrossRef]
  12. Kim, J.Y.; Jacobs, L.J.; Qu, J.; Littles, J.W. Experimental characterization of fatigue damage in a nickel-base superalloy using nonlinear ultrasonic waves. J. Acoust. Soc. Am. 2006, 120, 1266–1273. [Google Scholar] [CrossRef]
  13. Mini, R.S.; Balasubramaniam, K.; Ravindran, P. An experimental investigation on the influence of annealed microstructure on wave propagation. Exp. Mech. 2015, 55, 1023–1030. [Google Scholar] [CrossRef]
  14. Zinck, A.A.; Krishnaswamy, S. Ultrasonic nonlinearity measurements on rolled polycrystalline copper. AIP Conf. Proc. 2010, 1211, 1404–1409. [Google Scholar]
  15. Ogi, H.; Hirao, M.; Aoki, S. Noncontact monitoring of surface-wave nonlinearity for predicting the remaining life of fatigued steels. J. Appl. Phys. 2001, 90, 438–442. [Google Scholar] [CrossRef]
  16. Hurley, D.C.; Balzar, D.; Purtscher, P.T.; Hollman, K.W. Nonlinear ultrasonic parameter in quenched martensitic steels. J. Appl. Phys. 1998, 83, 4584–4588. [Google Scholar] [CrossRef]
  17. Barnard, D.J. Variation of nonlinearity parameter at low fundamental amplitudes. Appl. Phys. Lett. 1999, 74, 2447–2449. [Google Scholar] [CrossRef]
  18. Abarkane, C.; Gale-Lamuela, D.; Benavent-Climent, A.; Suarez, E.; Gallego, A. Ultrasonic pulse-echo signal analysis for damage evaluation of metallic slit-plate hysteretic dampers. Metals 2017, 7, 526. [Google Scholar] [CrossRef]
  19. Norris, A.N. Finite-amplitude waves in solids. In Nonlinear Acoustics; Hamilton, M.F., Blackstocks, D.T., Eds.; Academic Press: San Diego, CA, USA, 1998. [Google Scholar]
  20. Rose, J.L. Ultrasonic Waves in Solid Media; Combridge University Press: Combridge, UK, 1999. [Google Scholar]
  21. Liu, D.; Turner, J.A. Numerical analysis of longitudinal ultrasonic attenuation in sintered materials using a simplified two-phase model. J. Acoust. Soc. Am. 2017, 141, 1226. [Google Scholar] [CrossRef] [PubMed]
  22. Cantrell, J.H. Ultrasonic harmonic generation from fatigue-induced dislocation substructures in planar slip metals and assessment of remaining fatigue life. J. Appl. Phys. 2009, 106, 093516. [Google Scholar] [CrossRef]
  23. Hurley, D.C.; Balzar, D.; Purtscher, P.T. Nonlinear ultrasonic assessment of precipitation hardening in ASTM A710 steel. J. Mater. Res. 2000, 15, 2036–2042. [Google Scholar] [CrossRef]
  24. ASTM E112-13, Standard Test Methods for Determining Average Grain Size; ASTM International: West Conshohocken, PA, USA, 2013; Available online: http://www.astm.org/cgi-bin/resolver.cgi?E112-13 (accessed on 21 February 2019).
  25. GB/T6394-2017, Determination of estimating the average grain size of metal (In Chinese); Standardization Administration of China: Beijing, China, 2017; Available online: http://www.gb688.cn/bzgk/gb/newGbInfo?hcno=B83409D8E921097A674E11ED5A66BB06 (accessed on 21 February 2019).
Figure 1. Experimental setup: (a) Block diagram of the ultrasonic measurement system, (b) picture of the specimen and experiment.
Metals 09 00271 g001
Figure 2. (a) Typical time domain signal, (b) frequency spectrogram.
Metals 09 00271 g002
Figure 3. Microstructural evolution of copper at four different stages: (a) raw material, (b) sample after annealing at 600 °C for 12 h, (c) sample after re-cold rolling, and (d) sample after re-annealing at 600 °C for 12 h. (N.D is the normal direction and R.D is the rolling direction).
Metals 09 00271 g003
Figure 4. Microstructural evolution of brass at four different stages: (a) raw material, (b) sample after annealing at 600 °C for 12 h, (c) sample after re-cold rolling, and (d) sample after re-annealing at 600 °C for 12 h. (N.D is the normal direction and R.D is the rolling direction).
Metals 09 00271 g004
Figure 5. Variations of grain size of specimens with different microstructures.
Metals 09 00271 g005
Figure 6. Variations of material hardness of specimens with different microstructures.
Metals 09 00271 g006
Figure 7. Spectrums of ultrasonic testing results for copper plates at four different stages: (a) raw material, (b) sample after annealing at 600 °C for 12 h, (c) sample after re-cold rolling, and (d) sample after re-annealing at 600 °C for 12 h.
Metals 09 00271 g007
Figure 8. Spectrums of ultrasonic testing results for brass plates at four different stages: (a) raw material, (b) sample after annealing at 600 °C for 12 h, (c) sample after re-cold rolling, and (d) sample after re-annealing at 600 °C for 12 h.
Metals 09 00271 g008
Figure 9. Variations of acoustic nonlinear response ( β ¯ c ) in (A) copper and (B) brass with different microstructures.
Metals 09 00271 g009
Figure 10. Variations of acoustic nonlinear response ( β ¯ c ) in (A) copper and (B) brass with different microstructures.
Metals 09 00271 g010
Table 1. Chemical Composition of Copper (in wt.%).
CuOPbSBi
99.70.10.010.010.002
Table 2. Chemical Composition of Brass (in wt.%).
CuZnFePbPSbBi
63.5360.150.080.010.0050.002
Table 3. Experimental results of ultrasonic testing in copper plates.
Specimens (Copper) α 1 (db/cm) α 2 (db/cm) D α β (10−2) β ¯ c (10−2) σ ( β ¯ c ) (10−2)
(a)0.01240.14761.123.64.0320.132
(b)0.02150.37921.372.02.740.23
(c)0.02050.36971.362.12.8560.236
(d)0.03740.76431.541.62.4640.214
Table 4. Experimental results of ultrasonic testing in brass plates.
Specimens (Brass) α 1 (db/cm) α 2 (db/cm) D α β (10−2) β ¯ c (10−2) σ ( β ¯ c ) (10−2)
(a)0.02320.35131.334.86.3840.704
(b)0.03370.60181.632.43.9120.712
(c)0.03160.58741.612.94.6690.559
(d)0.04460.80191.871.32.4310.201

