Effect of Bubbles on Crystallization Behavior of CaO–SiO2 Based Slags

Abstract
:1. Introduction
2. Materials and Methods
2.1. Material Preparation
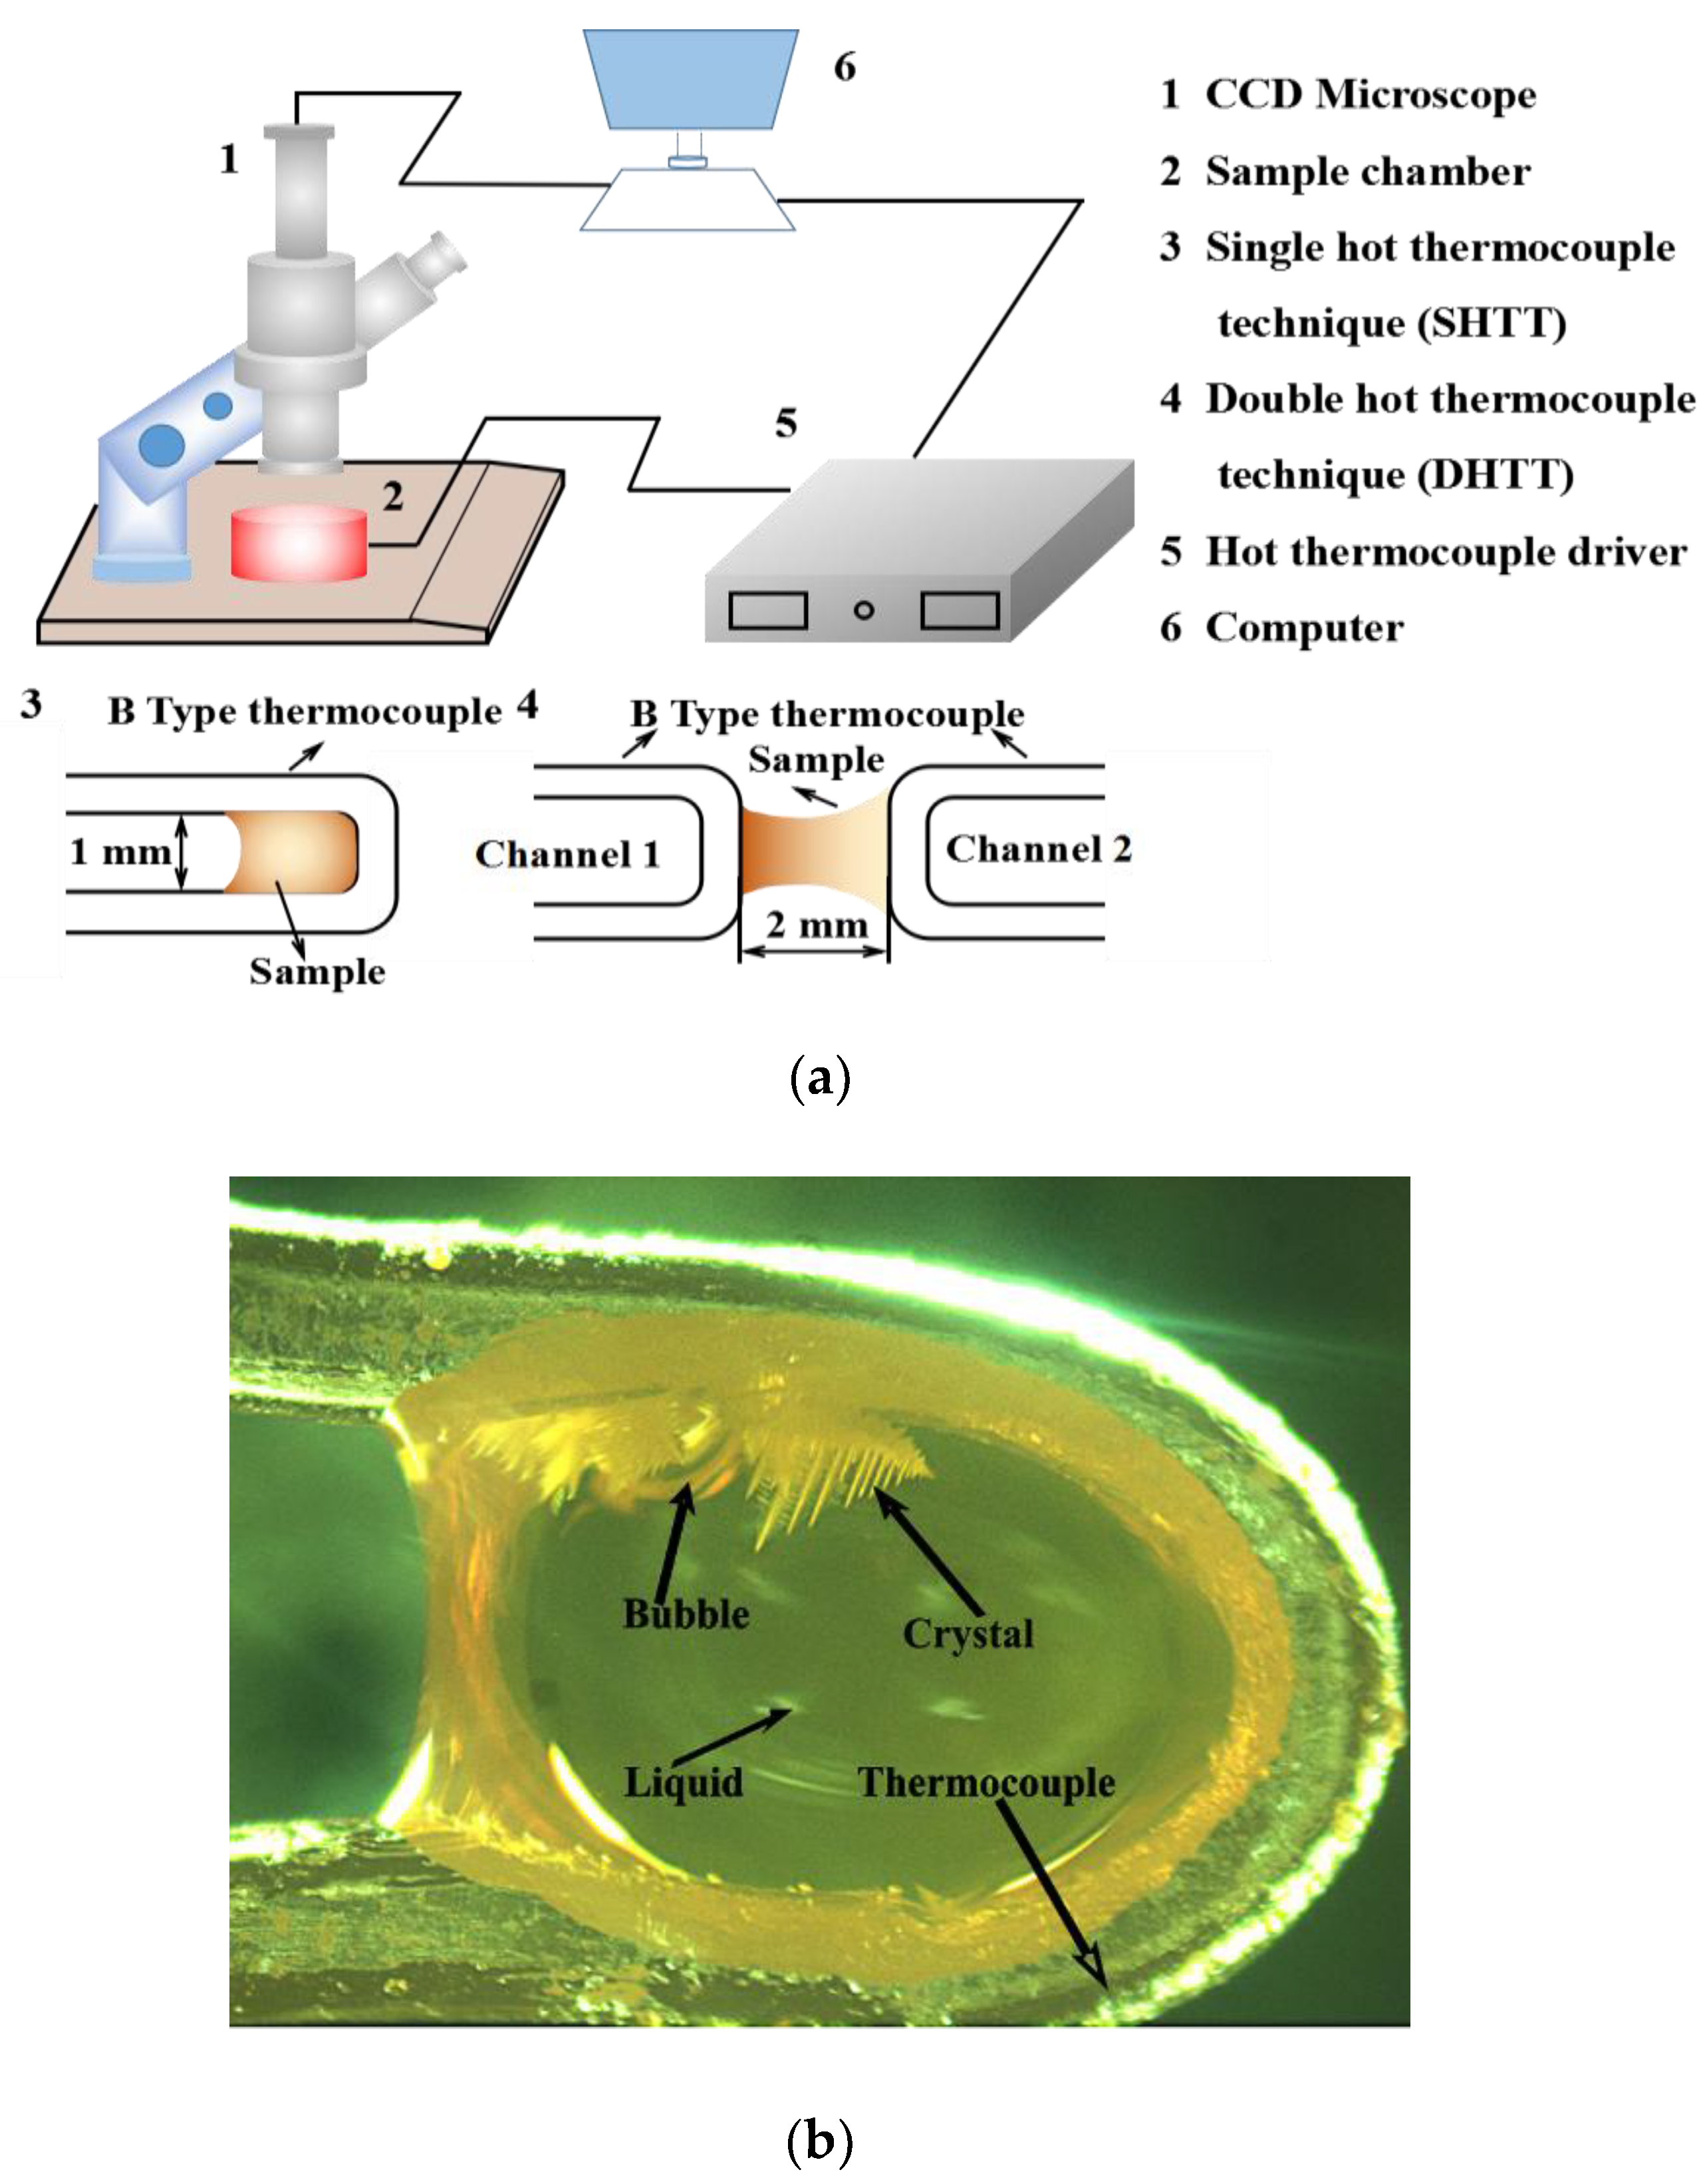
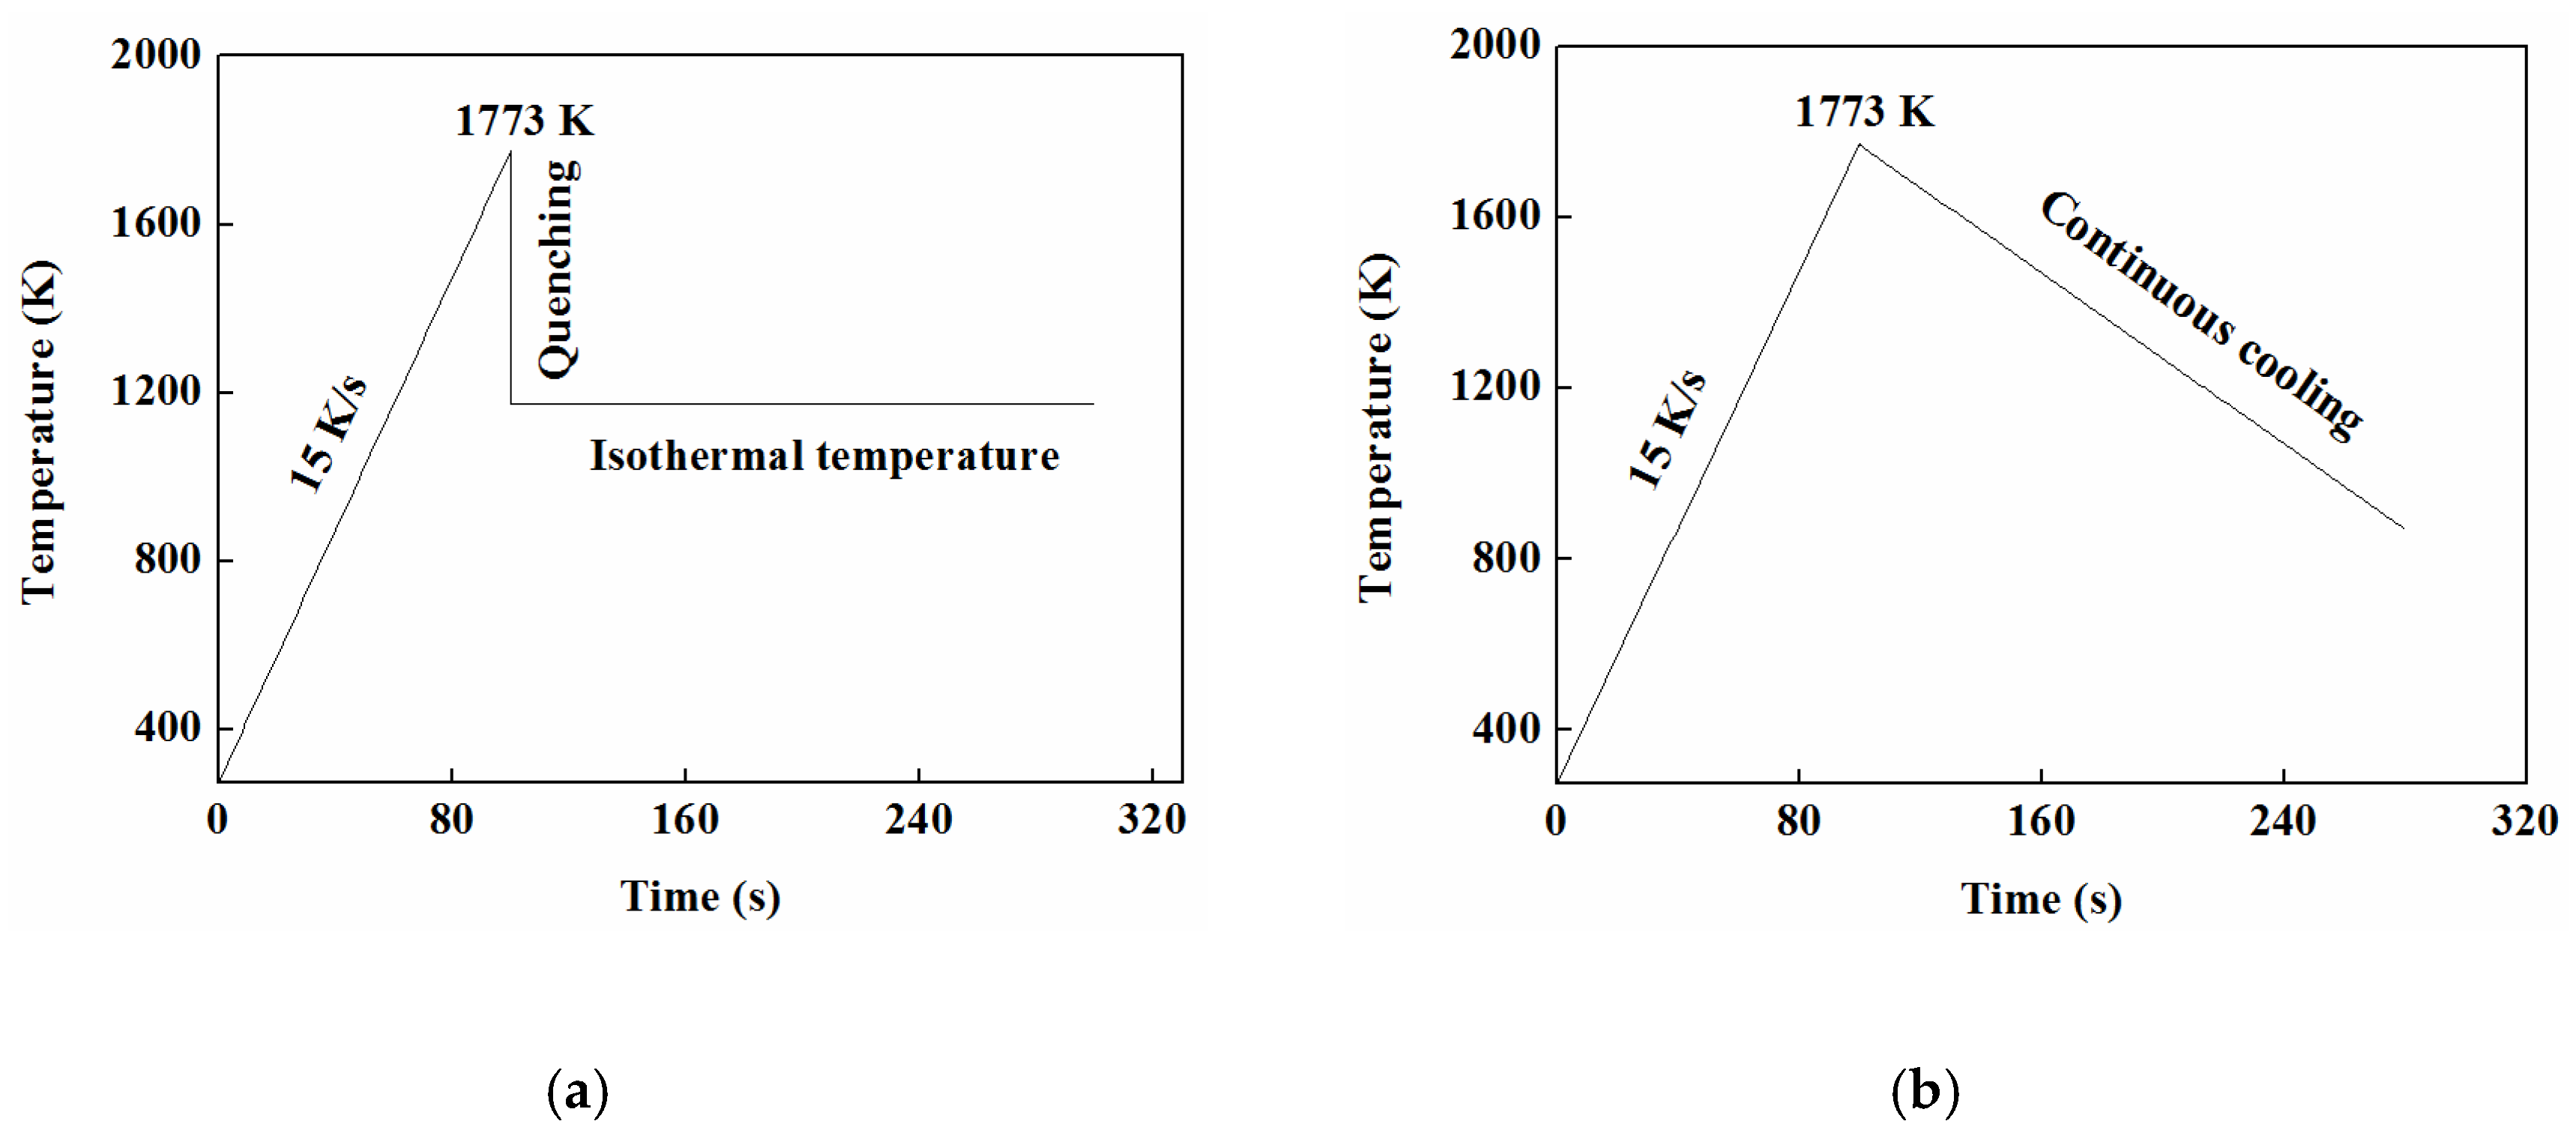
2.2. Experimental Methods
3. Results and Discussion
3.1. Microstructure
3.2. Crystal Phase
3.3. Crystalline Fraction, Slag Film Thickness, and Surface Roughness of Slag Film
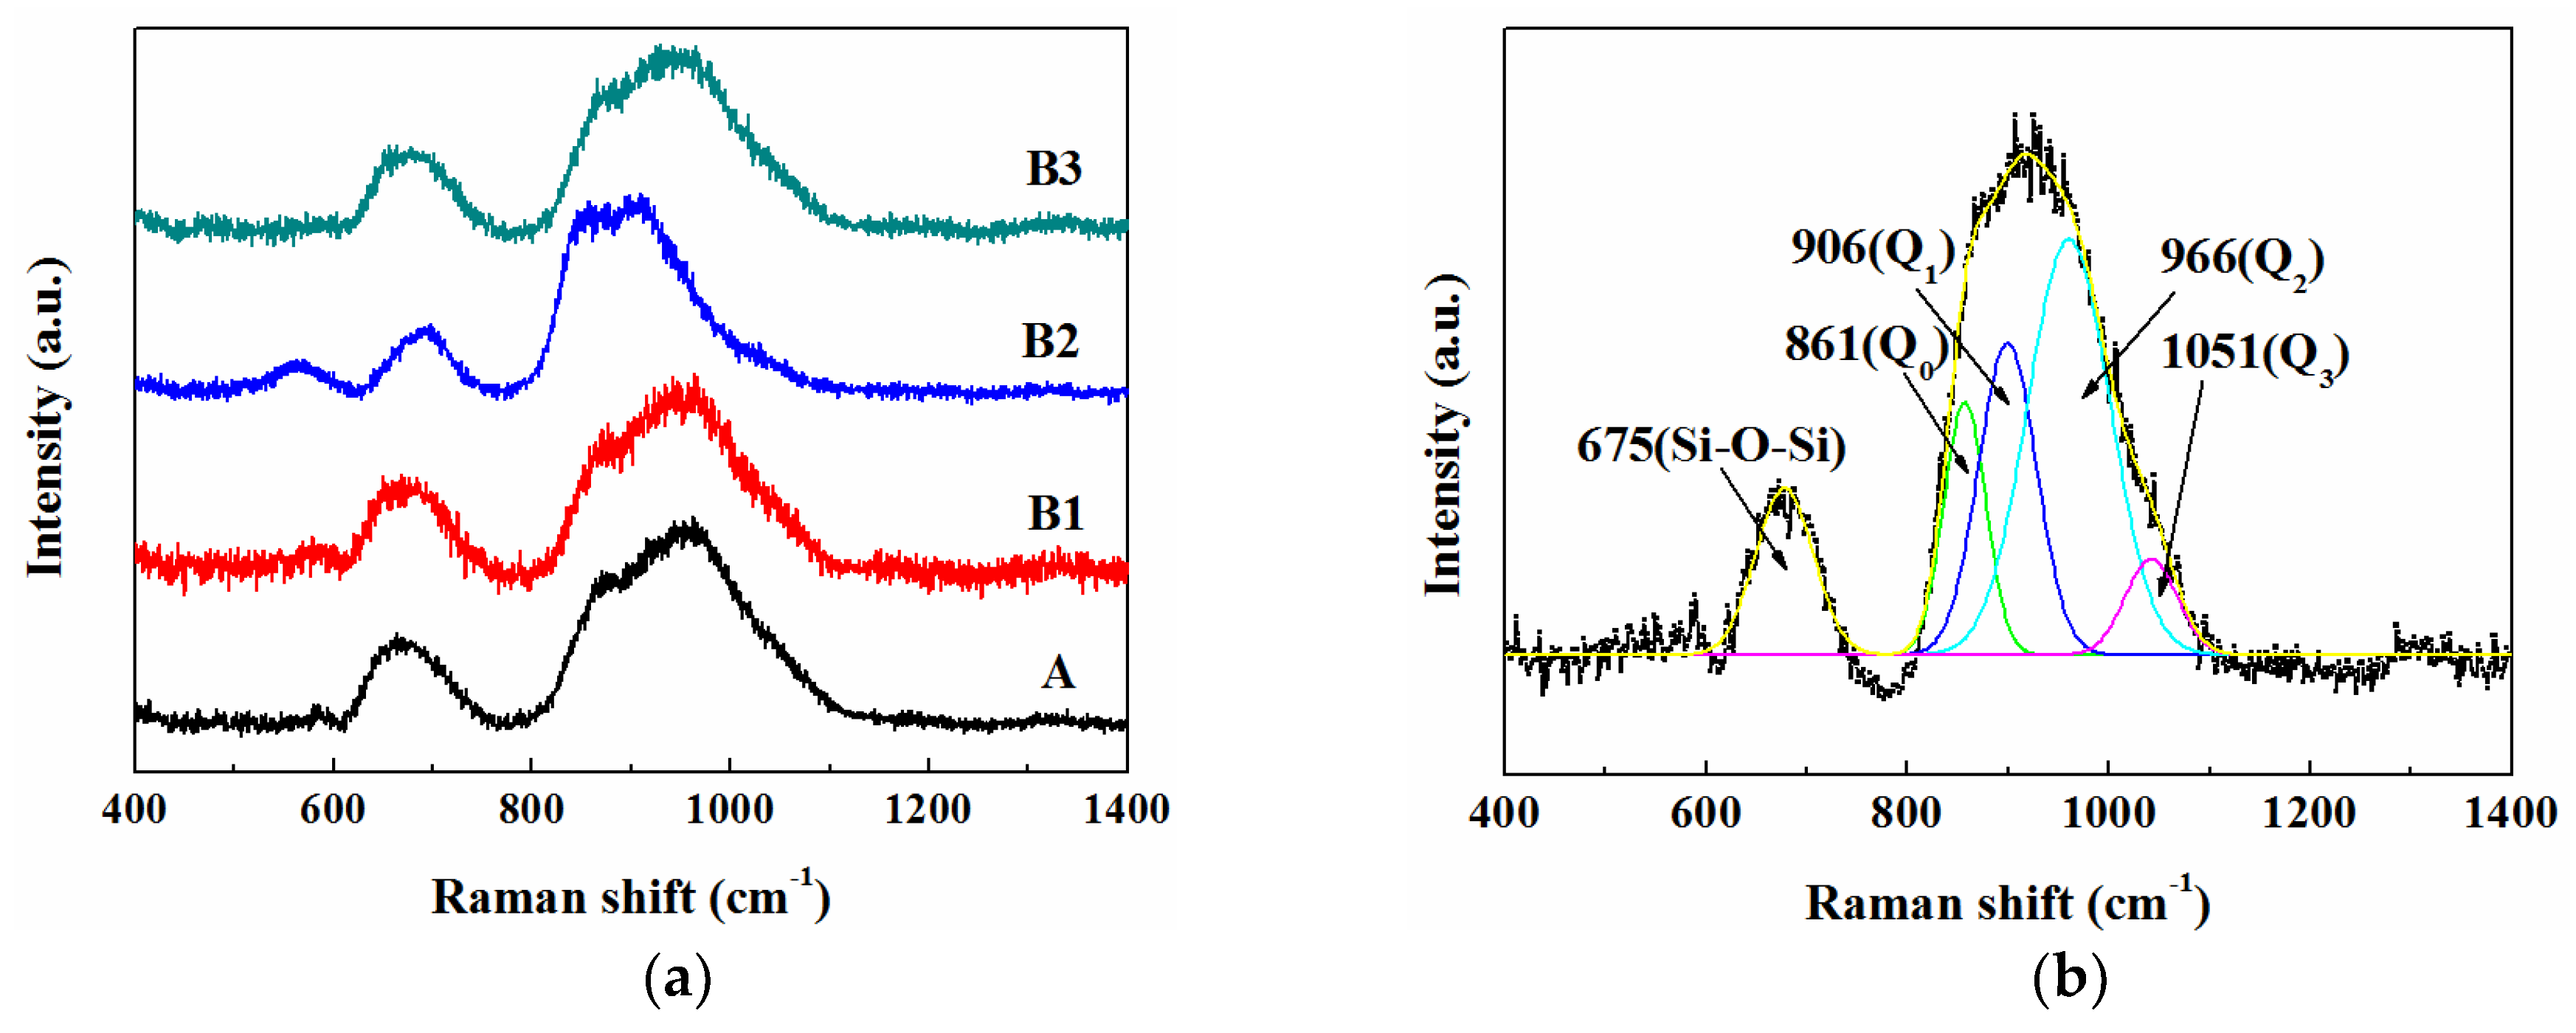
3.4. Structure of Molten Slags
3.5. TTT and CCT
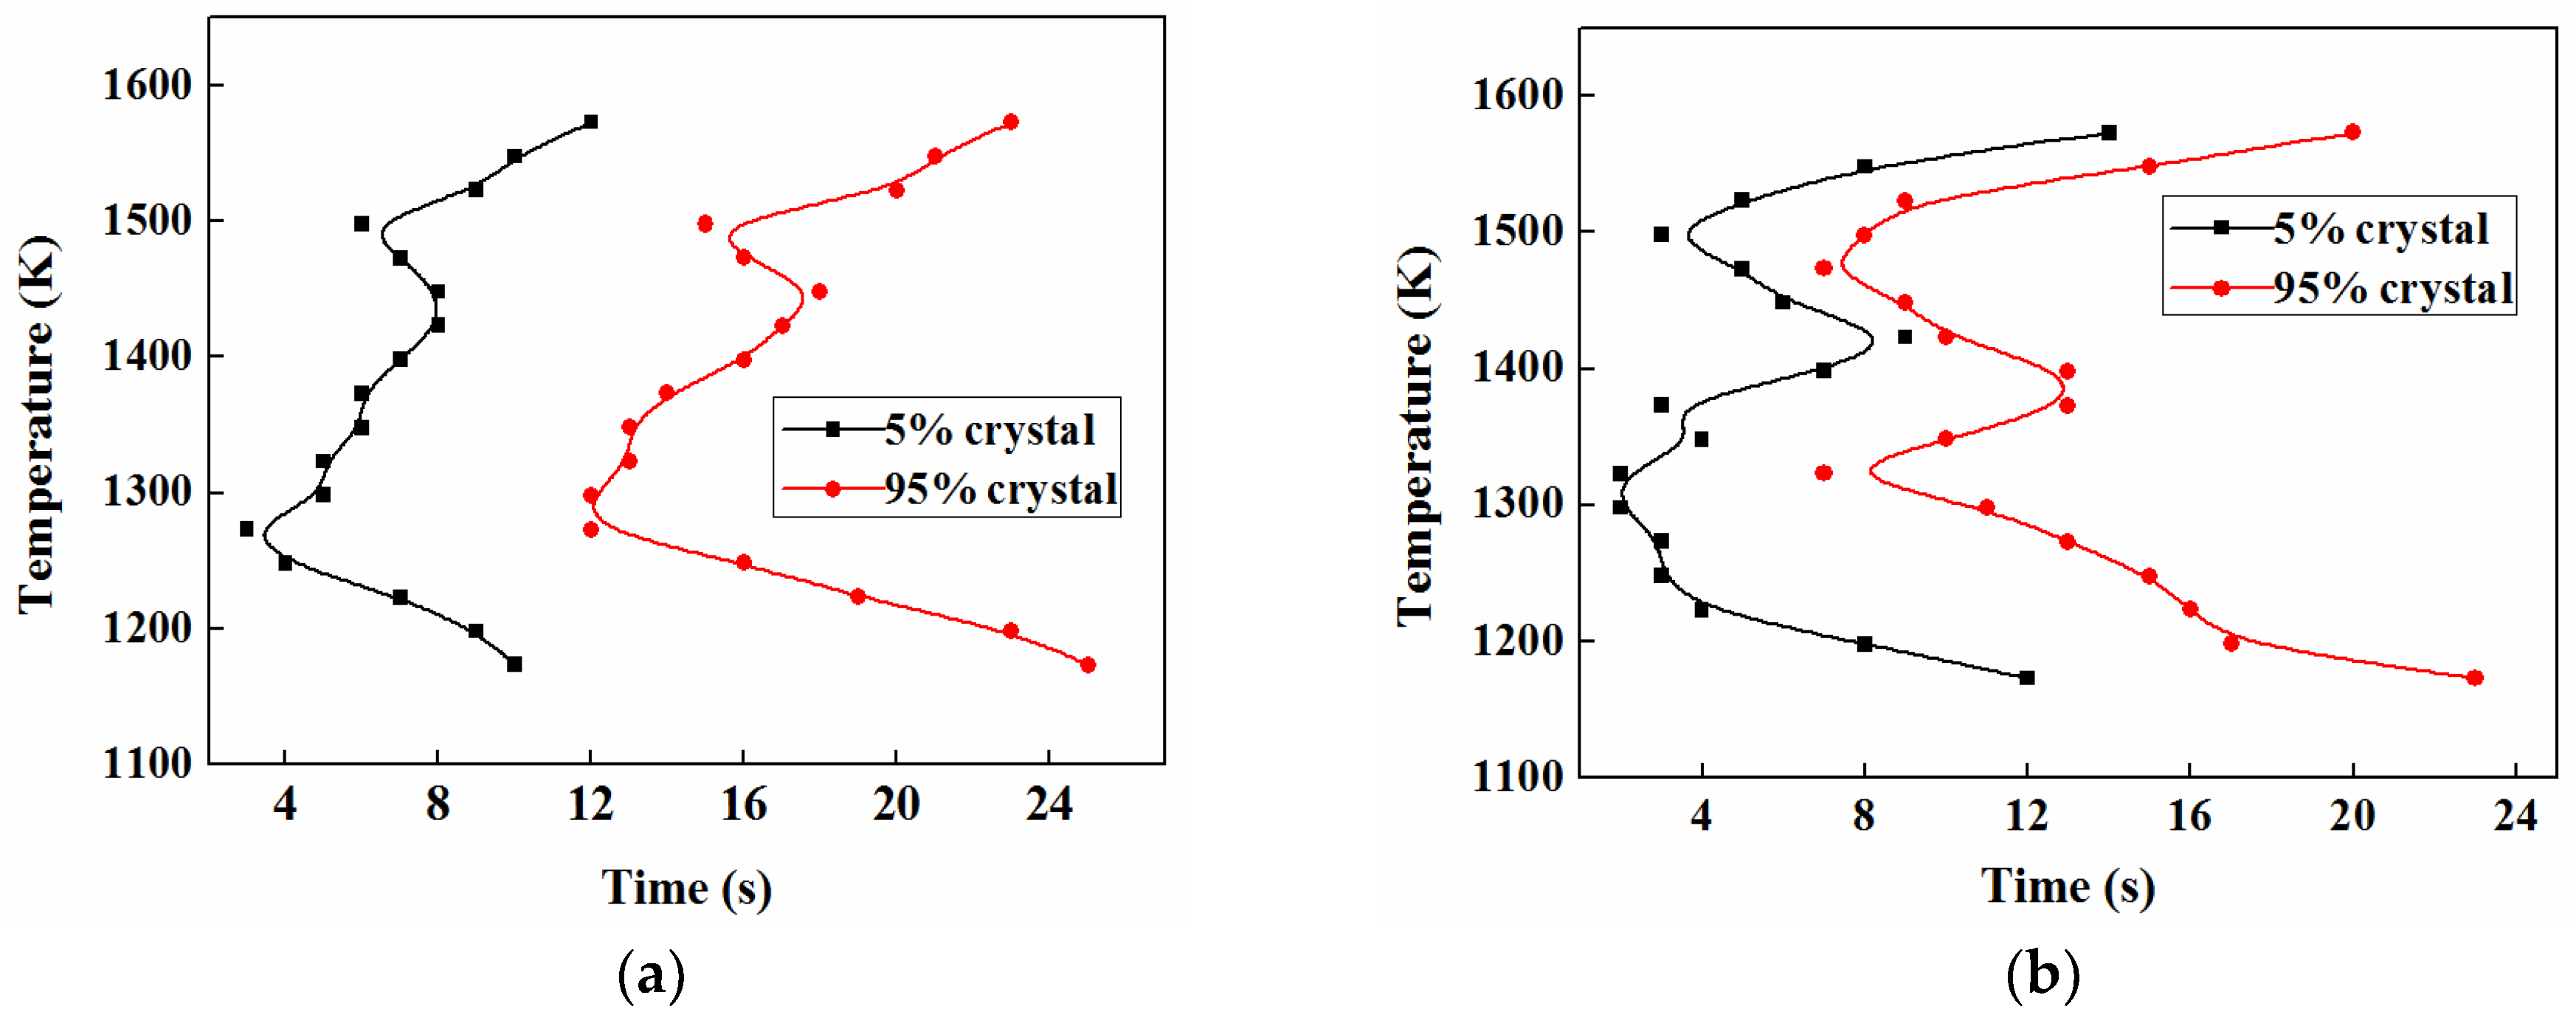
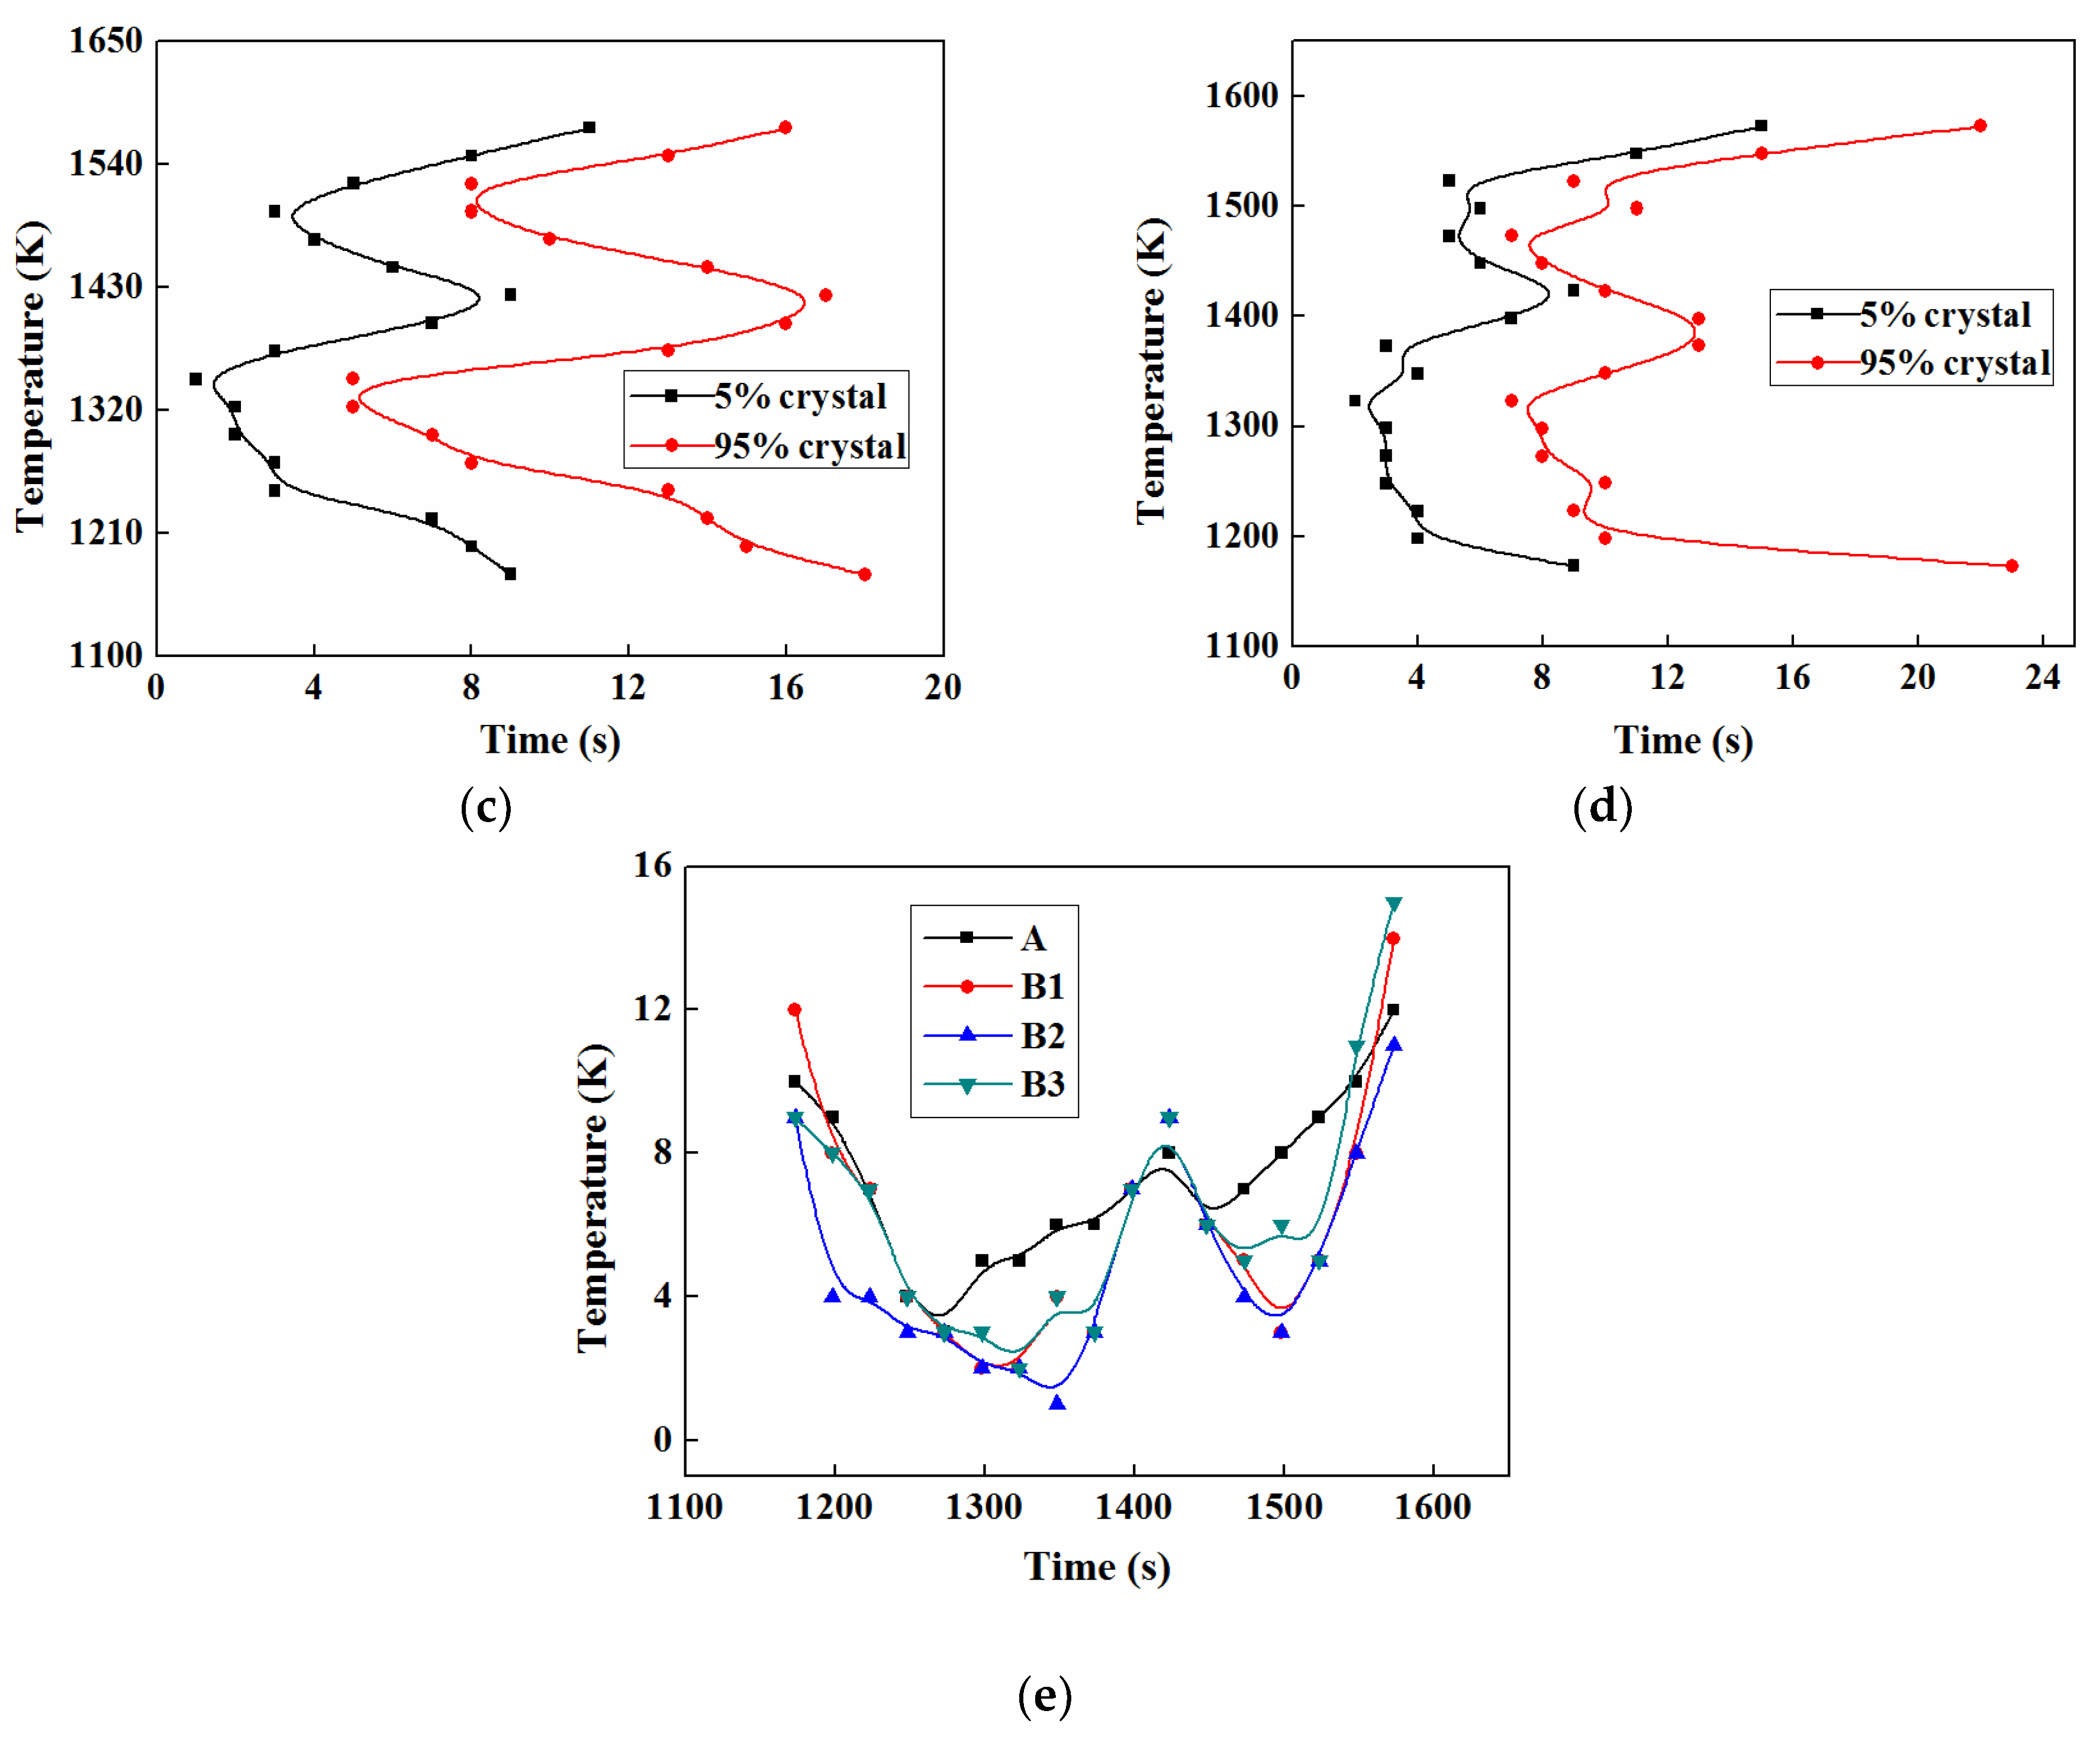
3.5.1. TTT
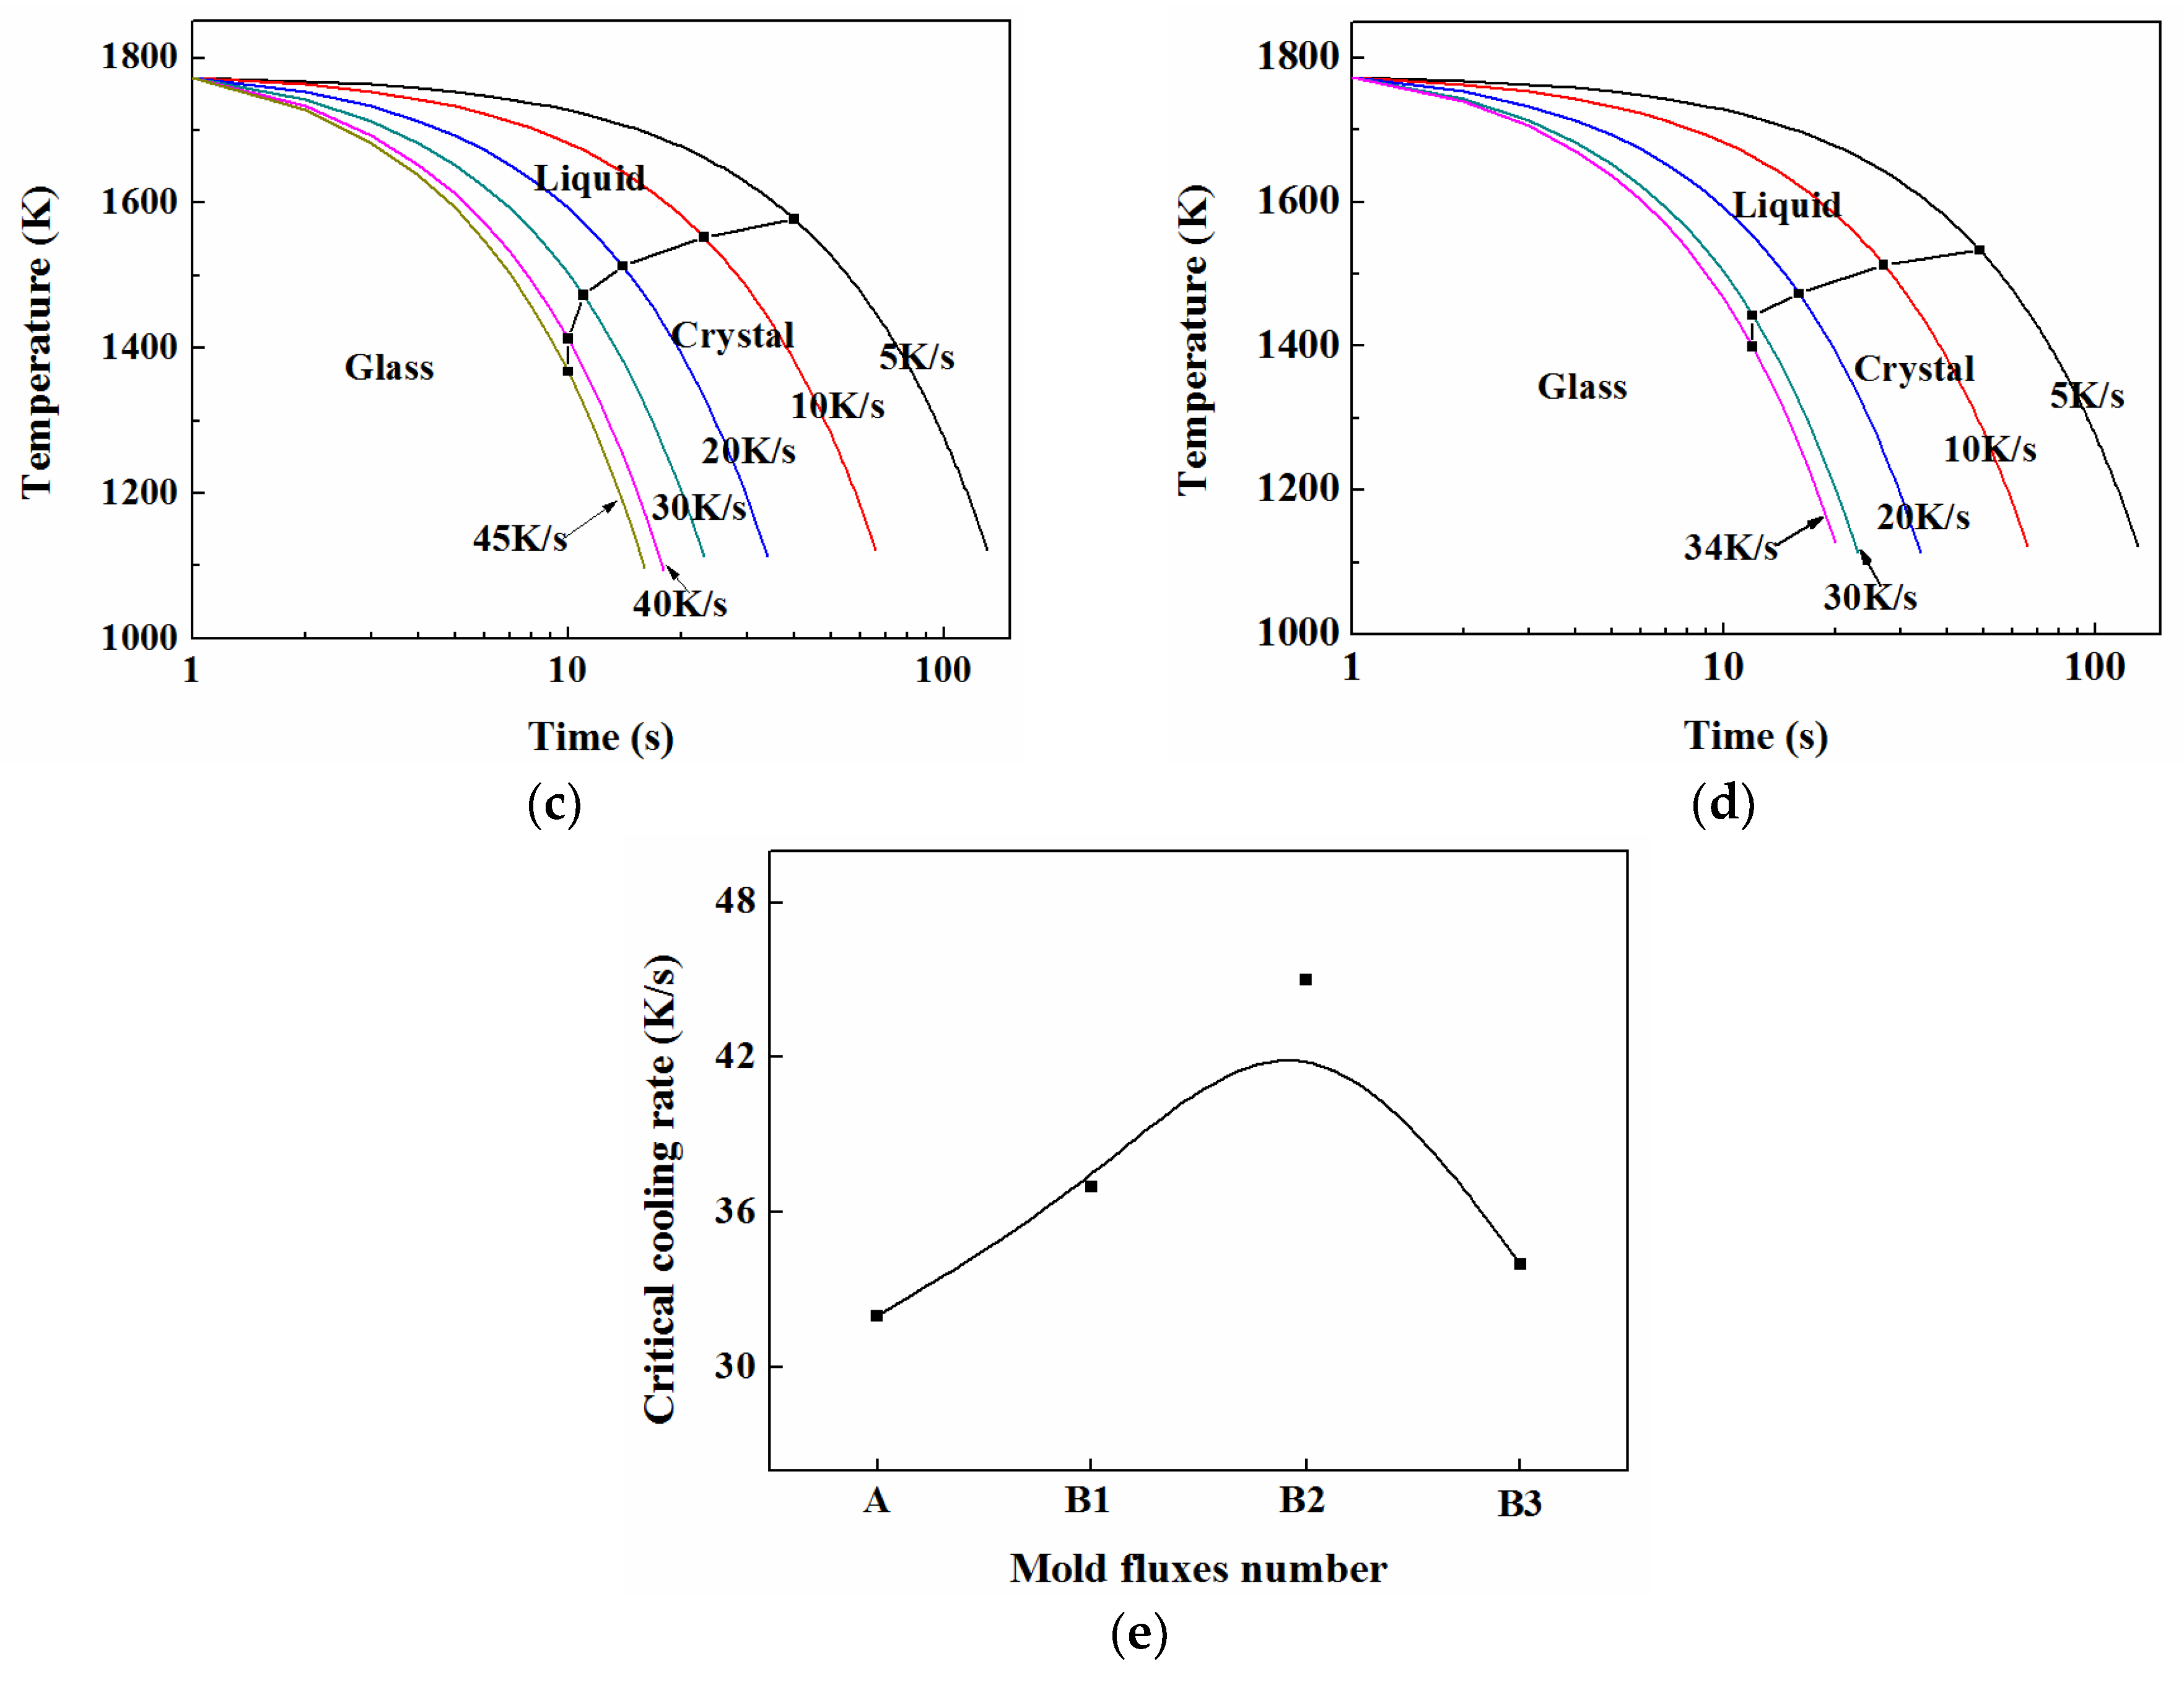
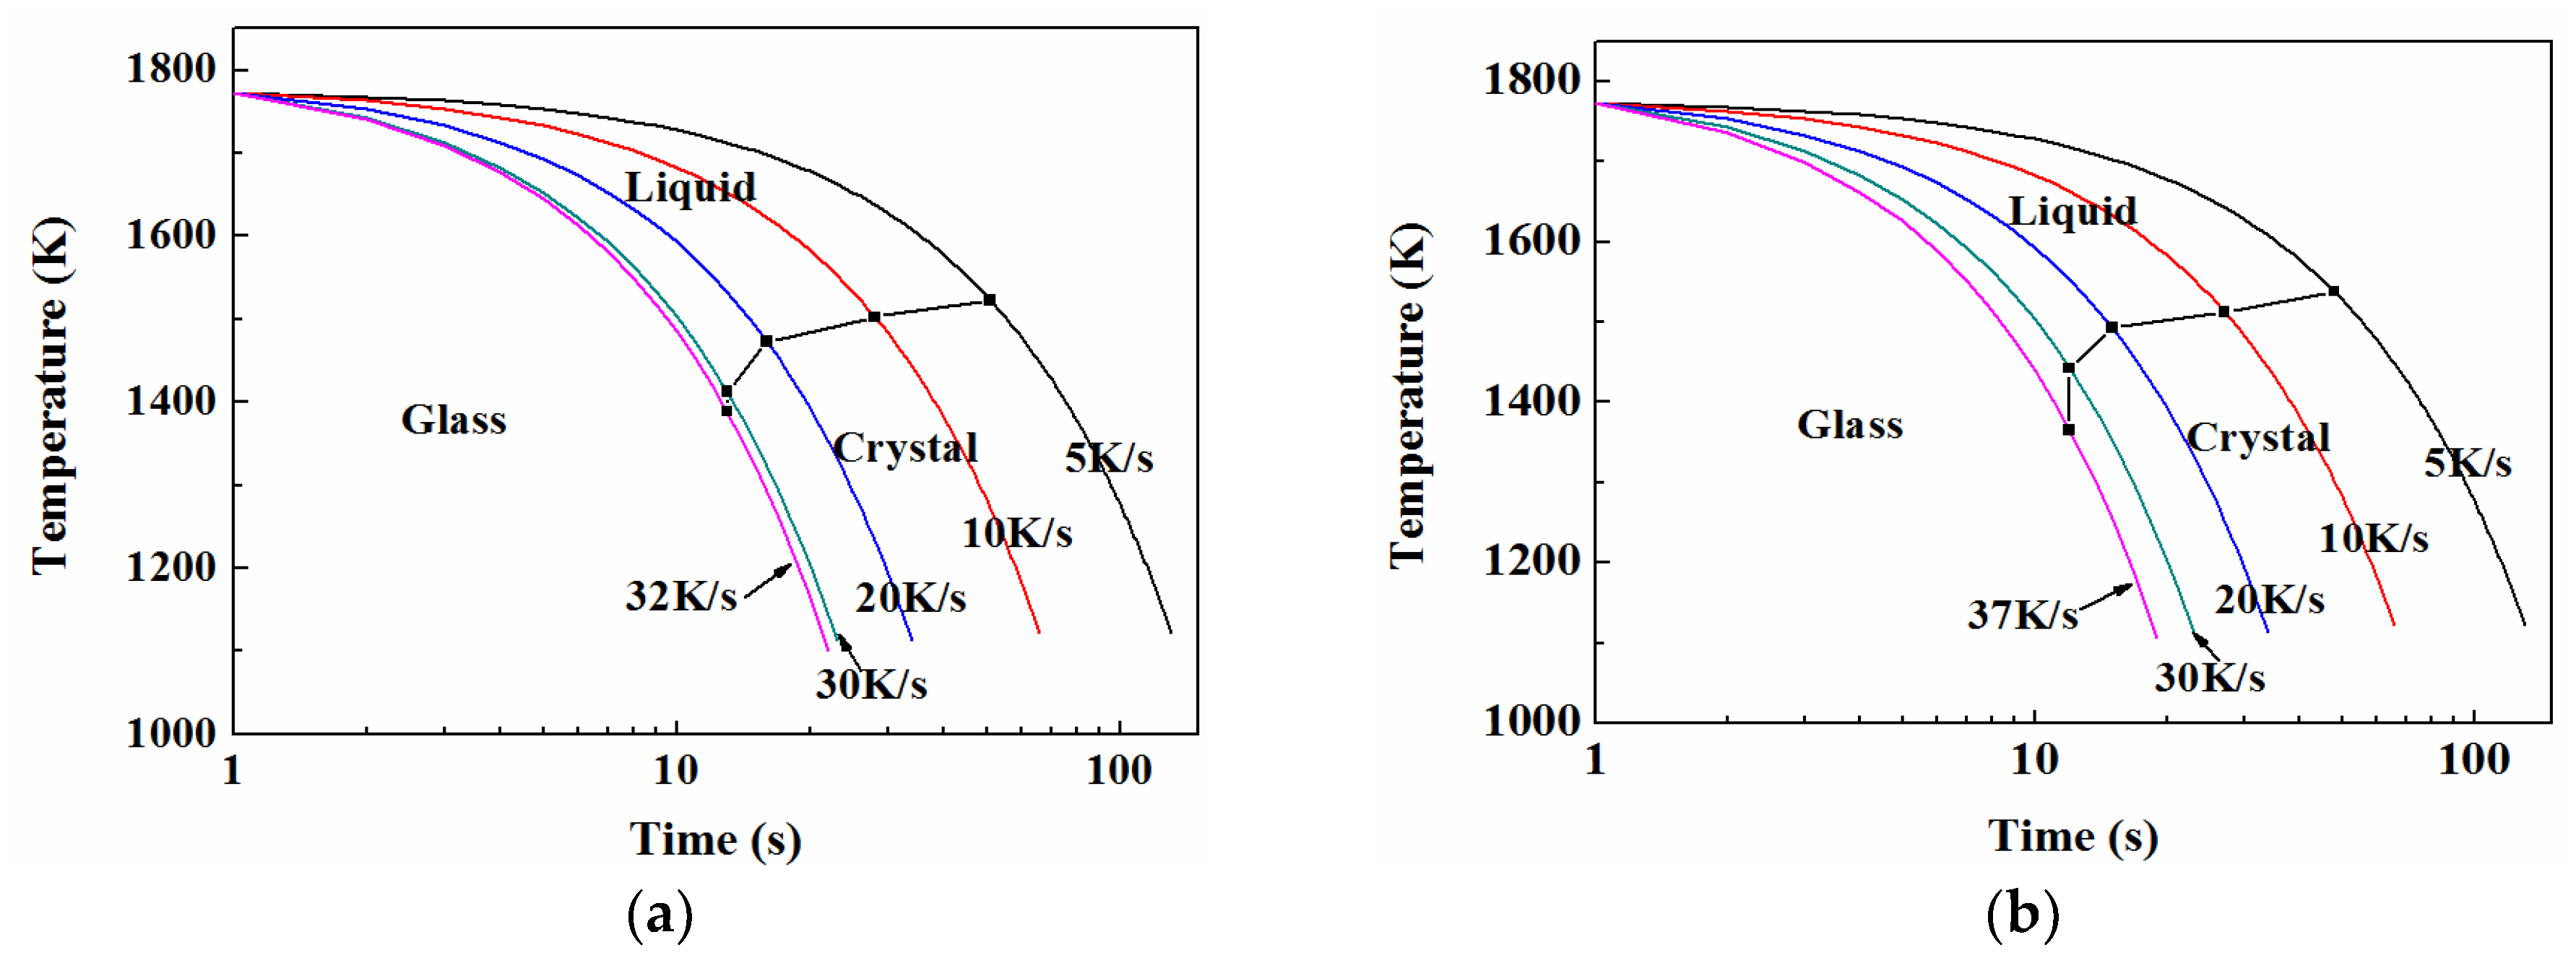
3.5.2. CCT
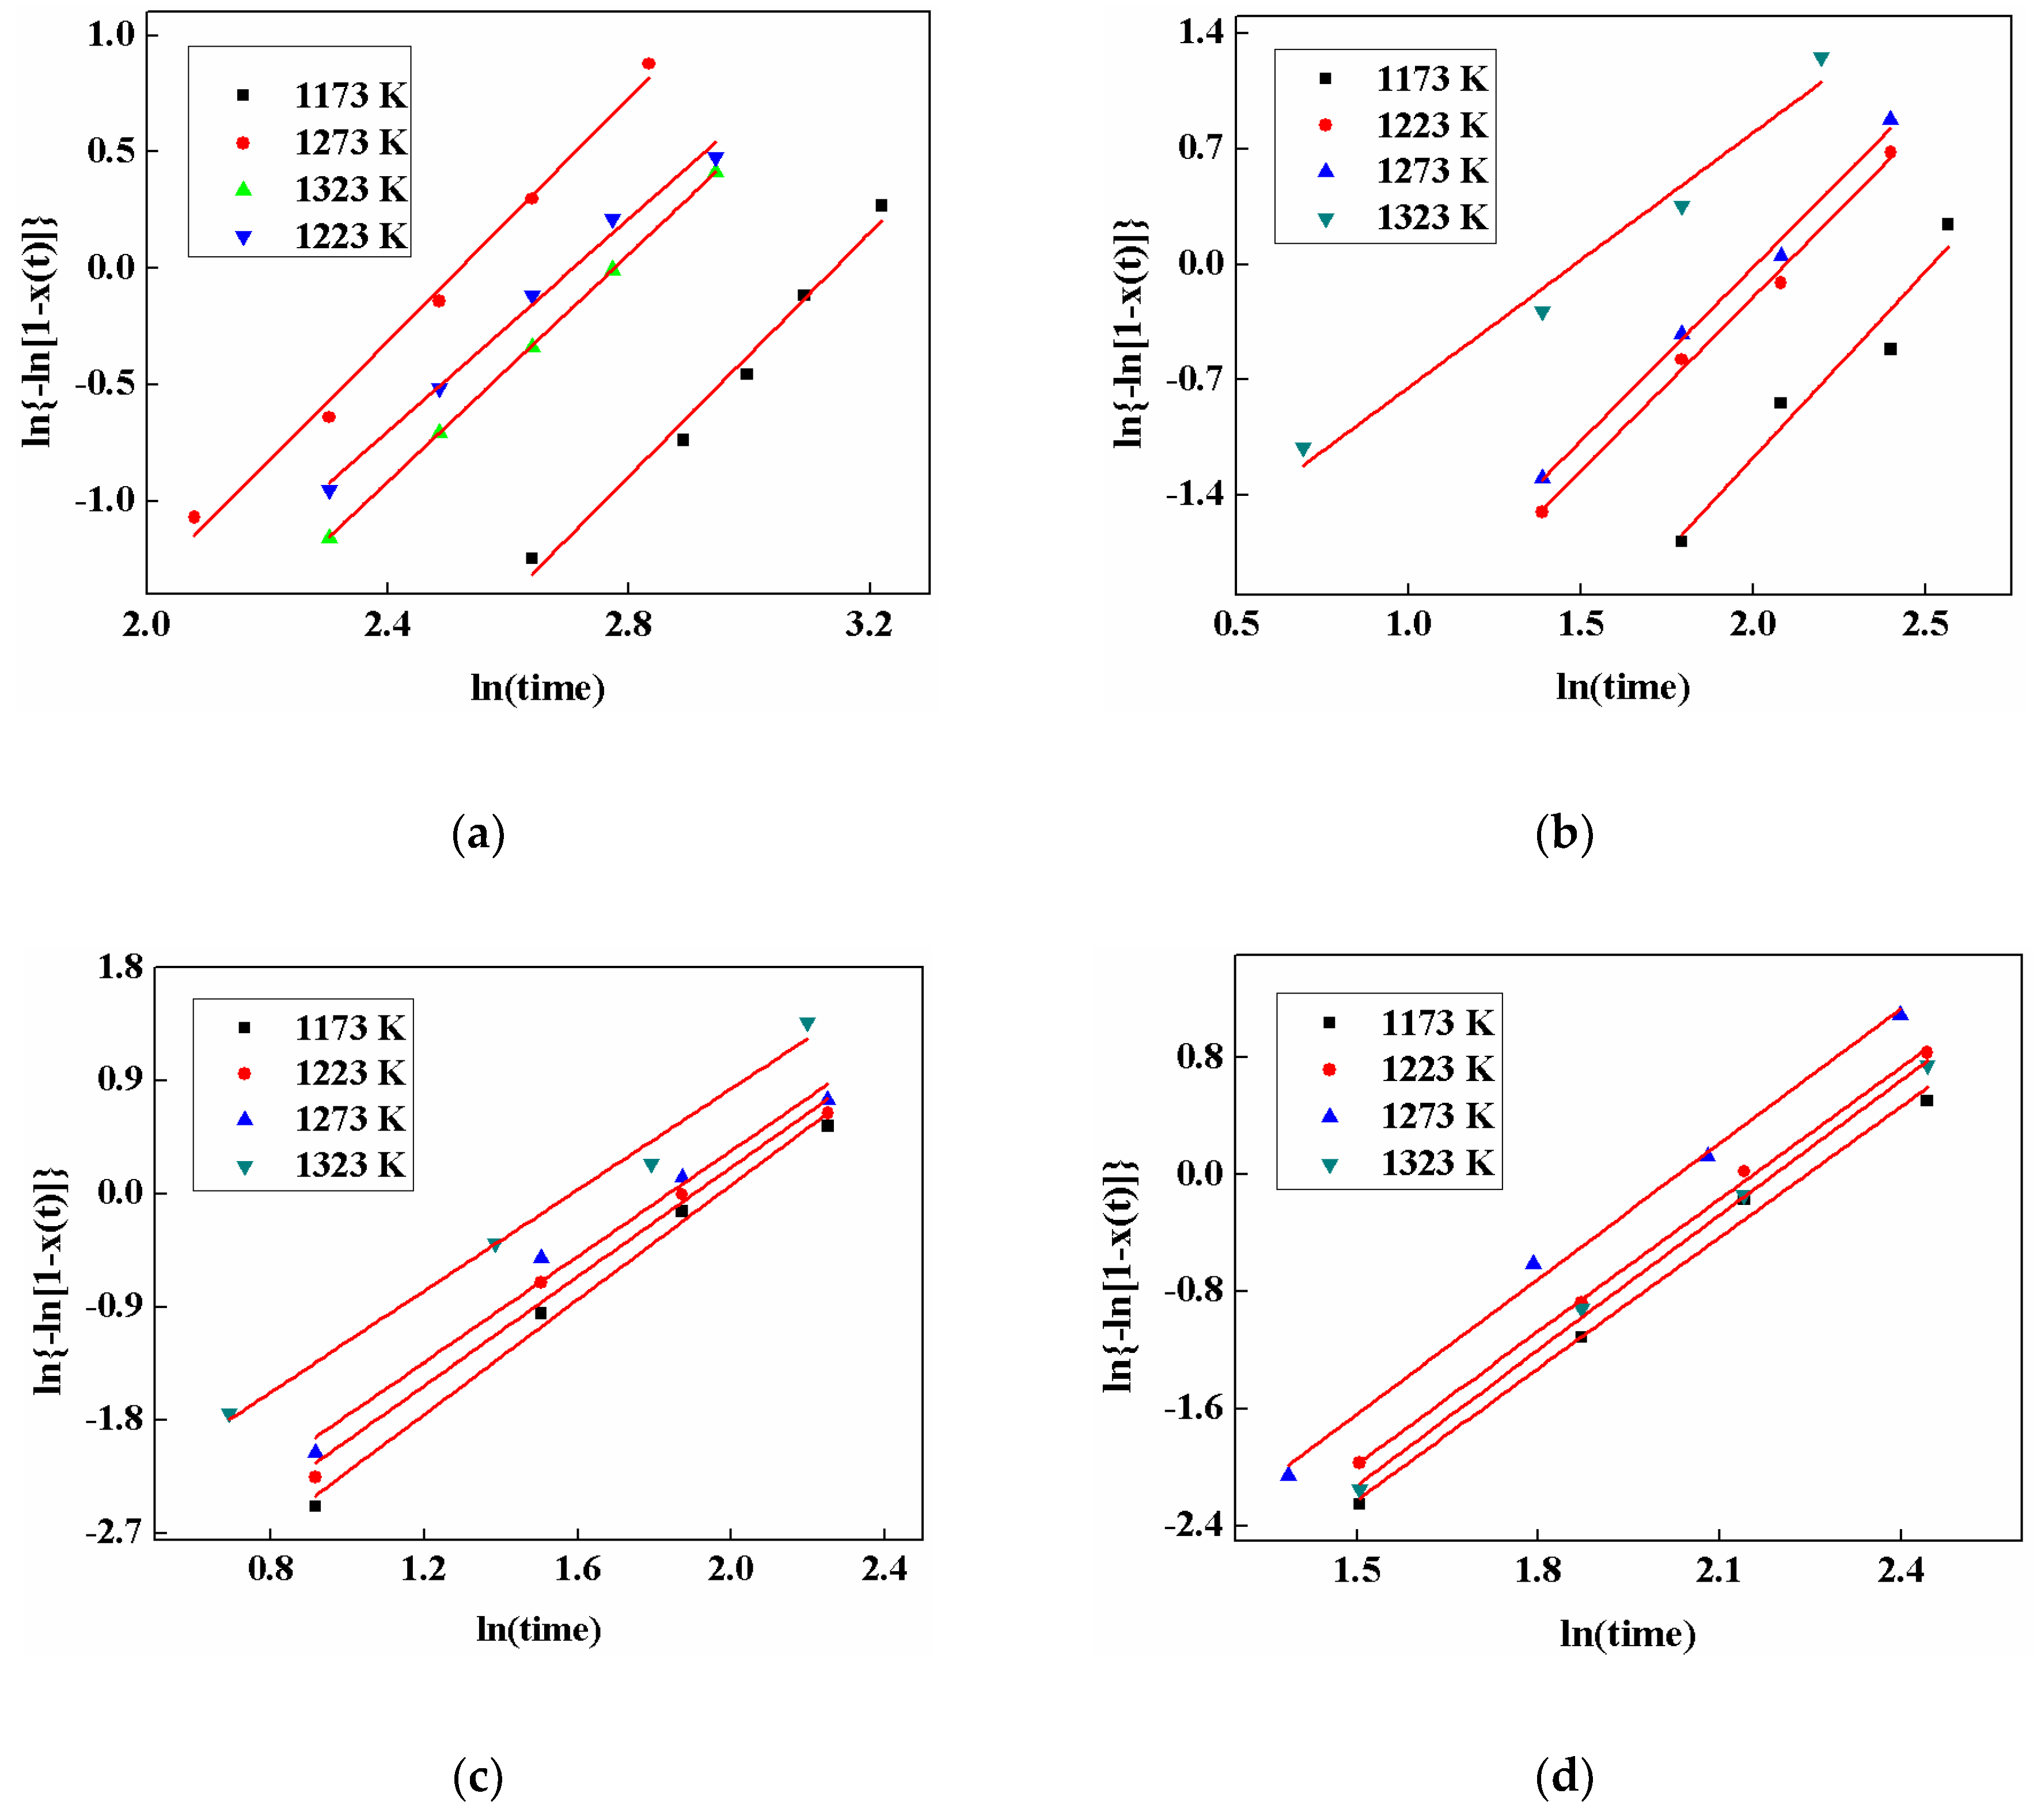
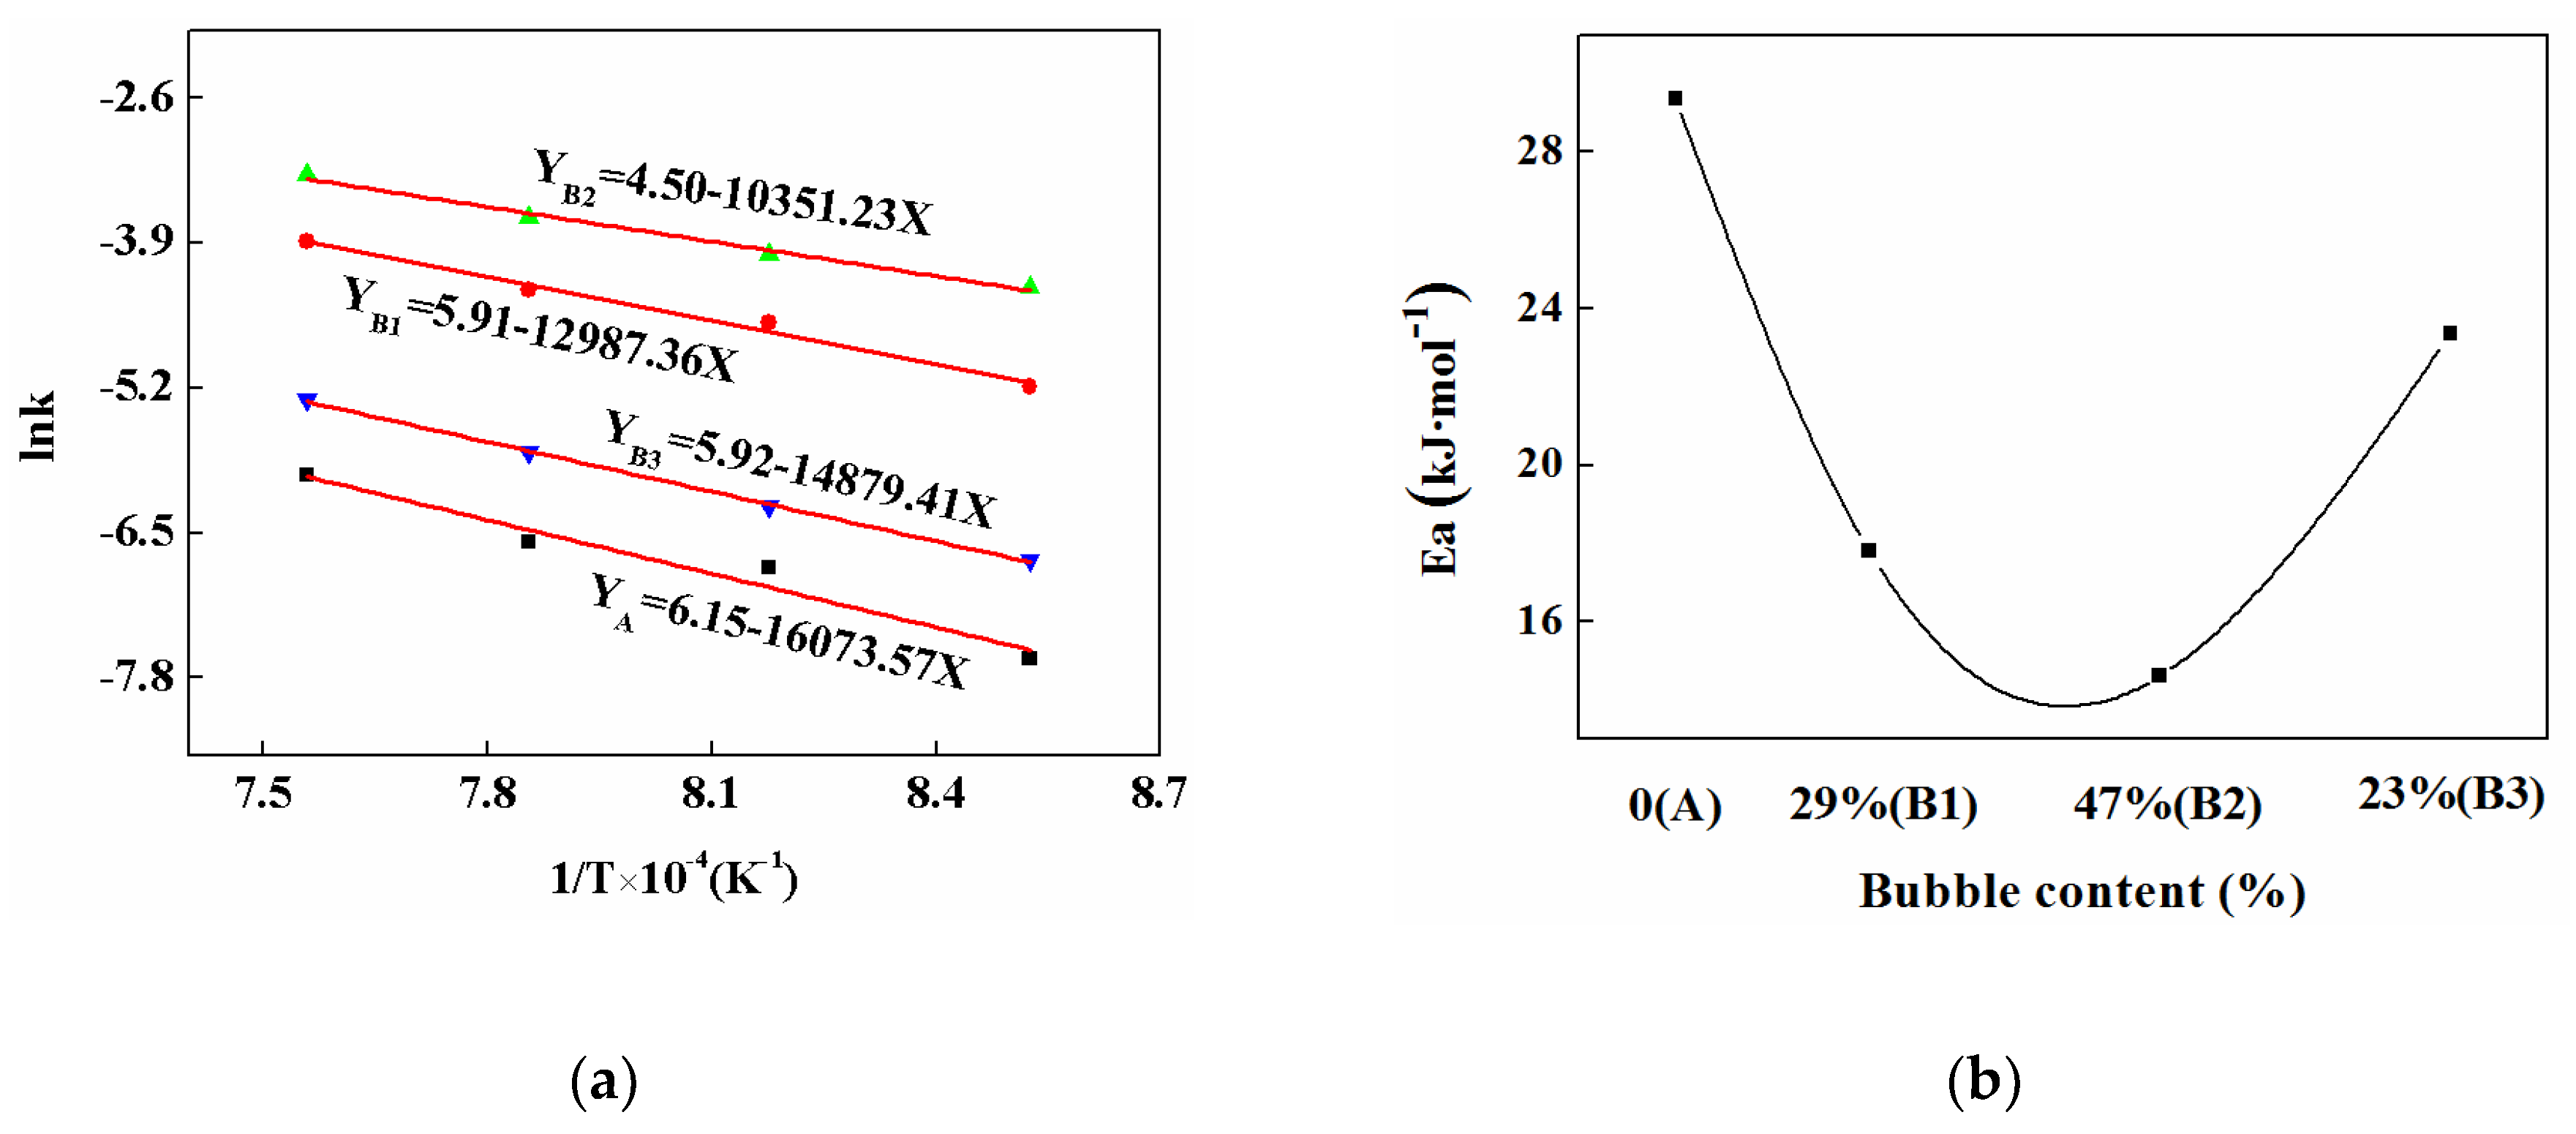
3.6. Crystalline Kinetics
4. Conclusions
Author Contributions
Funding
Conflicts of Interest
References
- Mills, K.C. Structure and properties of slags used in the continuous casting of steel: Part 2 specialist mould powders. ISIJ Int. 2016, 56, 14–23. [Google Scholar] [CrossRef]
- Mills, K.C. Structure and properties of slags used in the continuous casting of steel: Part 1 conventional mould powders. ISIJ Int. 2016, 56, 1–13. [Google Scholar] [CrossRef]
- Zhou, L.J.; Wang, W.L.; Ma, F.J.; Li, J.; Wei, J.; Matsuura, H. A kinetic study of the effect of basicity on the mold fluxes crystallization. Metall. Mater. Trans. B 2012, 43, 354–362. [Google Scholar] [CrossRef]
- Guo, J.L.; Wen, G.H.; Pu, D.Z.; Tang, P. A novel approach for evaluating the contraction of hypo-peritectic steels during initial solidification by surface roughness. Materials 2018, 11, 571–581. [Google Scholar]
- Wang, W.L.; Yan, X.; Zhou, L.J.; Xie, S.L.; Huang, D.Y. Influences of basicity and Li2O on the properties of fluorine-free mold flux for the casting of medium carbon steels. Metall. Mater. Trans. B 2016, 47, 963–973. [Google Scholar] [CrossRef]
- Long, X.; He, S.P.; Xu, J.F.; Huo, X.L.; Wang, Q. Properties of high basicity mold fluxes for peritectic steel slab casting. Metall. Mater. Trans. B 2017, 48, 1–5. [Google Scholar] [CrossRef]
- Mills, K.C.; Fox, A.B.; Li, Z.; Thackray, R.P. Performance and properties of mould fluxes. Ironmak. Steelmak. 2017, 32, 26–34. [Google Scholar] [CrossRef]
- Schulz, T.; Lychatz, B.; Haustein, N.; Janke, D. Structurally based assessment of the influence of fluorides on the characteristics of continuous casting powder slags. Metall. Mater. Trans. B 2013, 44, 317–327. [Google Scholar] [CrossRef]
- Yang, C.L.; Wen, G.H.; Zhu, X.F.; Tang, P. In situ observation and numerical simulation of bubble behavior in CaO-SiO2 based slag during isothermal and non-isothermal processes. J. Non-Cryst. Solids 2017, 464, 56–72. [Google Scholar] [CrossRef]
- Mills, K.C. A short history of mould powders. Ironmak. Steelmak. 2017, 44, 326–332. [Google Scholar] [CrossRef]
- Davis, M.J.; Ihinger, P.D. Heterogeneous crystal nucleation on bubbles in silicate melt. Am. Miner. 1998, 83, 1008–1015. [Google Scholar] [CrossRef]
- Wen, G.H.; Zhu, X.B.; Tang, P.; Yang, B.; Yu, X. Influence of raw material type on heat transfer and structure of mould slag. ISIJ Int. 2011, 51, 1028–1032. [Google Scholar] [CrossRef]
- Gu, S.P.; Wen, G.H.; Ding, Z.Q.; Tang, P.; Liu, Q. Effect of shear stress on isothermal crystallization behavior of CaO-Al2O3-SiO2-Na2O-CaF2 slags. Materials 2018, 11, 1085. [Google Scholar] [CrossRef] [PubMed]
- Yang, C.L.; Wen, G.H.; Sun, Q.H.; Tang, P. Investigation of the coupled conductive and radiative heat transfer of molten slag in a cylindrical enclosure based on the zonal method. Int. J. Heat Mass Transf. 2017, 110, 523–538. [Google Scholar] [CrossRef]
- Gao, J.X.; Wen, G.H.; Huang, T.; Sun, Q.H.; Tang, P.; Liu, Q. Effect of Al speciation on the structure of high-Al steels mold fluxes containing fluoride. J. Am. Ceram. Soc. 2016, 99, 3941–3947. [Google Scholar] [CrossRef]
- Ren, Q.Q.; Zhang, Y.Z.; Long, Y.; Zou, Z.S.; Pei, J.J. Crystallisation behaviour of blast furnace slag modified by adding fly ash. Ceram. Int. 2018, 44, 11628–11634. [Google Scholar] [CrossRef]
- Gao, J.X.; Wen, G.H.; Sun, Q.H.; Tang, P.; Liu, Q. The influence of Na2O on the solidification and crystallization behavior of CaO-SiO2-Al2O3-based mold flux. Metall. Mater. Trans. B 2015, 46, 1850–1859. [Google Scholar] [CrossRef]
- Li, J.L.; Yan, B.J.; Shu, Q.F.; Chou, K.C. Structure and crystallization kinetics of glassy CaO-Al2O3-SiO2-CaF2-Na2O mold fluxes with varying basicity. Metall. Mater. Trans. B 2015, 46, 2458–2470. [Google Scholar] [CrossRef]
- Martin, J.; Beauparlant, M.; Lesage, J.; Tra, H.V. Development of a quantification method for quartz in various bulk materials by X-ray diffraction and the rietveld method. Powder Diffr. 2012, 27, 12–19. [Google Scholar] [CrossRef]
- Yang, C.L.; Wen, G.H.; Tang, P.; Xi, C.C.; Sun, Q.H. Quantification of crystalline fraction of solid slag film using X-ray powder diffraction. Powder Diffr. 2016, 31, 40–51. [Google Scholar] [CrossRef]
- Fox, A.B.; Mills, K.C.; Lever, D.; Bezerra, C.; Valadares, C.; Unamuno, I. Development of fluoride-free fluxes for billet Casting. ISIJ Int. 2005, 45, 1051–1058. [Google Scholar] [CrossRef]
- Wajda, A.; Sitarz, M. Structural and microstructural comparison of bioactive melt-derived and gel-derived glasses from CaO-SiO2 binary system. Ceram. Int. 2018, 44, 8856–8863. [Google Scholar] [CrossRef]
- Shin, S.; Cho, J.; Kim, S. Shear thinning behavior of calcium silicate-based mold fluxes at 1623 K. J. Am. Ceram. Soc. 2014, 97, 3263–3269. [Google Scholar] [CrossRef]
- Gao, J.; Wen, G.; Huang, T.; Tang, P. Effect of slag-steel reaction on the structure and viscosity of CaO-SiO2 -based mold flux during high-Al steel casting. J. Non-Cryst. Solids 2016, 452, 119–124. [Google Scholar] [CrossRef]
- Yan, K.; Che, D. A coupled model for simulation of the gas-liquid two-phase flow with complex flow patterns. Int. J. Multiph. Flow 2010, 36, 333–348. [Google Scholar] [CrossRef]
- Shi, C.B.; Seo, M.D.; Wang, H.; Cho, C.K.; Kim, S.H. Crystallization kinetics and mechanism of CaO-Al2O3-based mold flux for casting high-aluminum TRIP steels. Metall. Mater. Trans. B 2015, 46, 345–356. [Google Scholar] [CrossRef]
- Wang, Z.; Shu, Q.F.; Chou, K.C. Crystallization kinetics and structure of mold fluxes with SiO2 being substituted by TiO2 for casting of titanium-stabilized stainless steel. Metall. Mater. Trans. B 2013, 44, 606–613. [Google Scholar] [CrossRef]
- Li, J.; Wang, W.L.; Wei, J.; Huang, D.Y.; Matsuura, H. A kinetic study of the effect of Na2O on the crystallization behavior of mold fluxes for casting medium carbon steel. ISIJ Int. 2012, 52, 2220–2225. [Google Scholar] [CrossRef]


| Number | CaCO3 | CaO | SiO2 | MgO | Al2O3 | Na2SO4 | Na2CO3 | Na2O | F |
|---|---|---|---|---|---|---|---|---|---|
| A | 0 | 45.2 | 33.4 | 0.8 | 5.0 | 0 | 0 | 8.0 | 7.6 |
| B1 | 14.4 | 37.2 | 33.4 | 0.8 | 5.0 | 0.5 | 3.1 | 6.0 | 7.6 |
| B2 | 28.6 | 29.2 | 33.4 | 0.8 | 5.0 | 2.0 | 5.4 | 4.0 | 7.6 |
| B3 | 42.9 | 21.2 | 33.4 | 0.8 | 5.0 | 3.5 | 7.6 | 2.0 | 7.6 |
| Sample Number | Crystalline Fraction (%) | Slag Film Thickness (mm) | Surface Roughness (um) | |
|---|---|---|---|---|
| Wide Side | Narrow Side | |||
| A | 69.3 | 2.9 | 3.2 | 32.6 |
| B1 | 80.3 | 3.3 | 3.6 | 47.1 |
| B2 | 87.1 | 3.5 | 3.8 | 53.4 |
| B3 | 73.6 | 3.2 | 3.5 | 40.9 |
| Raman Bands | Raman Shift (cm−1) | Peak Area Ratio (%) | ||||||
|---|---|---|---|---|---|---|---|---|
| A | B1 | B2 | B3 | A | B1 | B2 | B3 | |
| Symmetric stretching Si-O− of Q0 | 866 | 860 | 869 | 863 | 10.88 | 13.68 | 19.38 | 21.18 |
| Symmetric stretching Si-O− of Q1 | 905 | 905 | 902 | 909 | 17.02 | 20.03 | 38.84 | 19.84 |
| Symmetric stretching Si-O− of Q2 | 959 | 966 | 953 | 951 | 58.99 | 59.21 | 36.95 | 52.41 |
| Symmetric stretching Si-O− of Q3 | 1055 | 1051 | 1046 | 1049 | 13.11 | 7.08 | 4.91 | 6.57 |
| R2 | 0.9981 | 0.9987 | 0.9979 | 0.9985 | - | - | - | - |
| Mold Fluxes | Temperature/K | n | lnk |
|---|---|---|---|
| A | 1173 | 1.54 | −5.12 |
| 1223 | 2.01 | −4.71 | |
| 1273 | 2.10 | −4.18 | |
| 1323 | 2.11 | −4.98 | |
| B1 | 1173 | 2.28 | −3.68 |
| 1223 | 2.44 | −2.41 | |
| 1273 | 2.61 | −2.22 | |
| 1323 | 2.62 | −1.59 | |
| B2 | 1173 | 2.99 | −2.49 |
| 1223 | 3.02 | −2.13 | |
| 1273 | 3.08 | −1.86 | |
| 1323 | 3.09 | −1.18 | |
| B3 | 1173 | 2.11 | −4.74 |
| 1223 | 2.17 | −4.26 | |
| 1273 | 2.26 | −3.77 | |
| 1323 | 2.28 | −4.31 |
| Grow Mode | Crystallization Mode | |
|---|---|---|
| Diffusion Controlled | Interface Reaction Controlled | |
| Constant nucleation rate | - | - |
| 3-dimensional growth | 2.5 | 4 |
| 2-dimensional growth | 2 | 3 |
| 1-dimensional growth | 1.5 | 2 |
| Instantaneous nucleation | - | - |
| 3-dimensional growth | 1.5 | 3 |
| 2-dimensional growth | 1 | 2 |
| 1-dimensional growth | 0.5 | 1 |
| Surface nucleation | 0.5 | 1 |
© 2019 by the authors. Licensee MDPI, Basel, Switzerland. This article is an open access article distributed under the terms and conditions of the Creative Commons Attribution (CC BY) license (http://creativecommons.org/licenses/by/4.0/).
Share and Cite
Gu, S.; Wen, G.; Ding, Z.; Guo, J.; Tang, P.; Liu, Q. Effect of Bubbles on Crystallization Behavior of CaO–SiO2 Based Slags. Metals 2019, 9, 193. https://doi.org/10.3390/met9020193
Gu S, Wen G, Ding Z, Guo J, Tang P, Liu Q. Effect of Bubbles on Crystallization Behavior of CaO–SiO2 Based Slags. Metals. 2019; 9(2):193. https://doi.org/10.3390/met9020193
Chicago/Turabian StyleGu, Shaopeng, Guanghua Wen, Zequan Ding, Junli Guo, Ping Tang, and Qiang Liu. 2019. "Effect of Bubbles on Crystallization Behavior of CaO–SiO2 Based Slags" Metals 9, no. 2: 193. https://doi.org/10.3390/met9020193
APA StyleGu, S., Wen, G., Ding, Z., Guo, J., Tang, P., & Liu, Q. (2019). Effect of Bubbles on Crystallization Behavior of CaO–SiO2 Based Slags. Metals, 9(2), 193. https://doi.org/10.3390/met9020193