Article

Effect of SiO2 on the Mechanical Property and Reduction of Calcium Ferrite

1
State Key Laboratory of Refractories and Metallurgy, Wuhan University of Science and Technology, Wuhan 430081, China
2
Key Laboratory for Ferrous Metallurgy and Resources Utilization of Ministry of Education, Wuhan University of Science and Technology, Wuhan 430081, China
*
Authors to whom correspondence should be addressed.
Metals 2019, 9(2), 152; https://doi.org/10.3390/met9020152
Submission received: 28 November 2018 / Revised: 11 January 2019 / Accepted: 24 January 2019 / Published: 29 January 2019

Abstract

:
SiO2-Fe2O3-CaO (SFC) is believed to be the transition phase during the SiO2-Fe2O3-CaO-Al2O3 (SFCA) formation process. The effect of SiO2 on the mechanical property and reduction of the CaO-Fe2O3-SiO2 system was inspected in this study. Experiments were carried out under air at 1200 °C with different amounts of SiO2 mixed with Fe2O3 and CaO. The mechanical properties and reduction of samples were studied. Results indicate that the hardness of samples gradually increases with the increase of SFC content. That may be caused by SiO2 solid solution in calcium ferrite. The larger the amount and smaller size of acicular calcium ferrites in samples, the greater the fracture toughness. The solid solution of SiO2 in calcium ferrite is beneficial to decrease the initial reduction temperature. The apparent activation energy values of the samples with the different content of SiO2 from 0% to 5% are 167.23, 84.36, 87.90, 96.02, 92.44 and 107.83 kJ·mol−1, respectively. The microstructure of lump samples after reduction consists of four phases, i.e., CF (CaFe2O4), SFC, calcio-wüstite (CW) and Fe. It was not difficult to find the Fe in the samples reduced from CW. Scanning electron micrograph images have revealed that the acicular-like calcium ferrites are more easily reduced than the platy-like ones.

1. Introduction

Under the pressures of the decreases of high-quality iron ore, the iron and steel enterprises in China turn to use low-quality ores. The SFCA phase (SiO2-Fe2O3-CaO-Al2O3) is regarded as a desirable bonding phase for fluxed sinter [1,2]. Silica content influences the phase composition and bonding phase mass of SFCA because of their low melting point [3,4], high mechanical strength [5,6,7,8], and SFCA is an important part of the point of view of saving cost and energy from low temperature sinter. SiO2-Fe2O3-CaO (SFC) is believed to be the transition phase during the SFCA formation process and has been widely investigated [9,10,11].
SFCA mechanical properties of calcium ferrite with different morphologies and content vary greatly. Compared with grained or plate-like calcium ferrite, fine acicular calcium ferrite has higher microhardness, and it can prevent crack extension effectively. That makes acicular calcium ferrite better the compressive strength and metallurgical properties than grained or plate-like calcium ferrite [12,13]. Many researchers considered that SiO2 and Al2O3 were necessary components for the formation of acicular calcium ferrite [14,15]. Furthermore, acicular calcium ferrite can also enable the better reduction of sinter. Murakami T et al. [12] found that the reduction of columnar calcium ferrite in sinter was worse than that of acicular calcium ferrite. It seems that the diffusion of the reducing gas is difficult compared with the case of acicular calcium ferrite coexisted with small pores. Cai B et al. [16] SFCA phases in ‘Acicular SFCA’ have fine pores around them. It is significant to study the effect of silico and aluminum on the mechanical property and reduction mechanism of calcium ferrite. The reduction of powdered samples under isothermal conditions research of ternary calcium ferrite of CaO-Fe2O3-x system (x: SiO2, Al2O3) have been further investigated by Ding C et al. [17,18], but it is still not comprehensive enough, and more research on different aspects is needed.
In this paper, the effect of SiO2 on the mechanical property and reduction of calcium ferrite will be investigated. Specifically, we include the following methods: the samples of hardness and fracture toughness test, powder non-isothermal reduction and block isothermal reduction. This will contribute to more deeply understanding the effect of SiO2 on the properties of calcium ferrite and sinter.

2. Experimental Materials and Methods

2.1. Materials

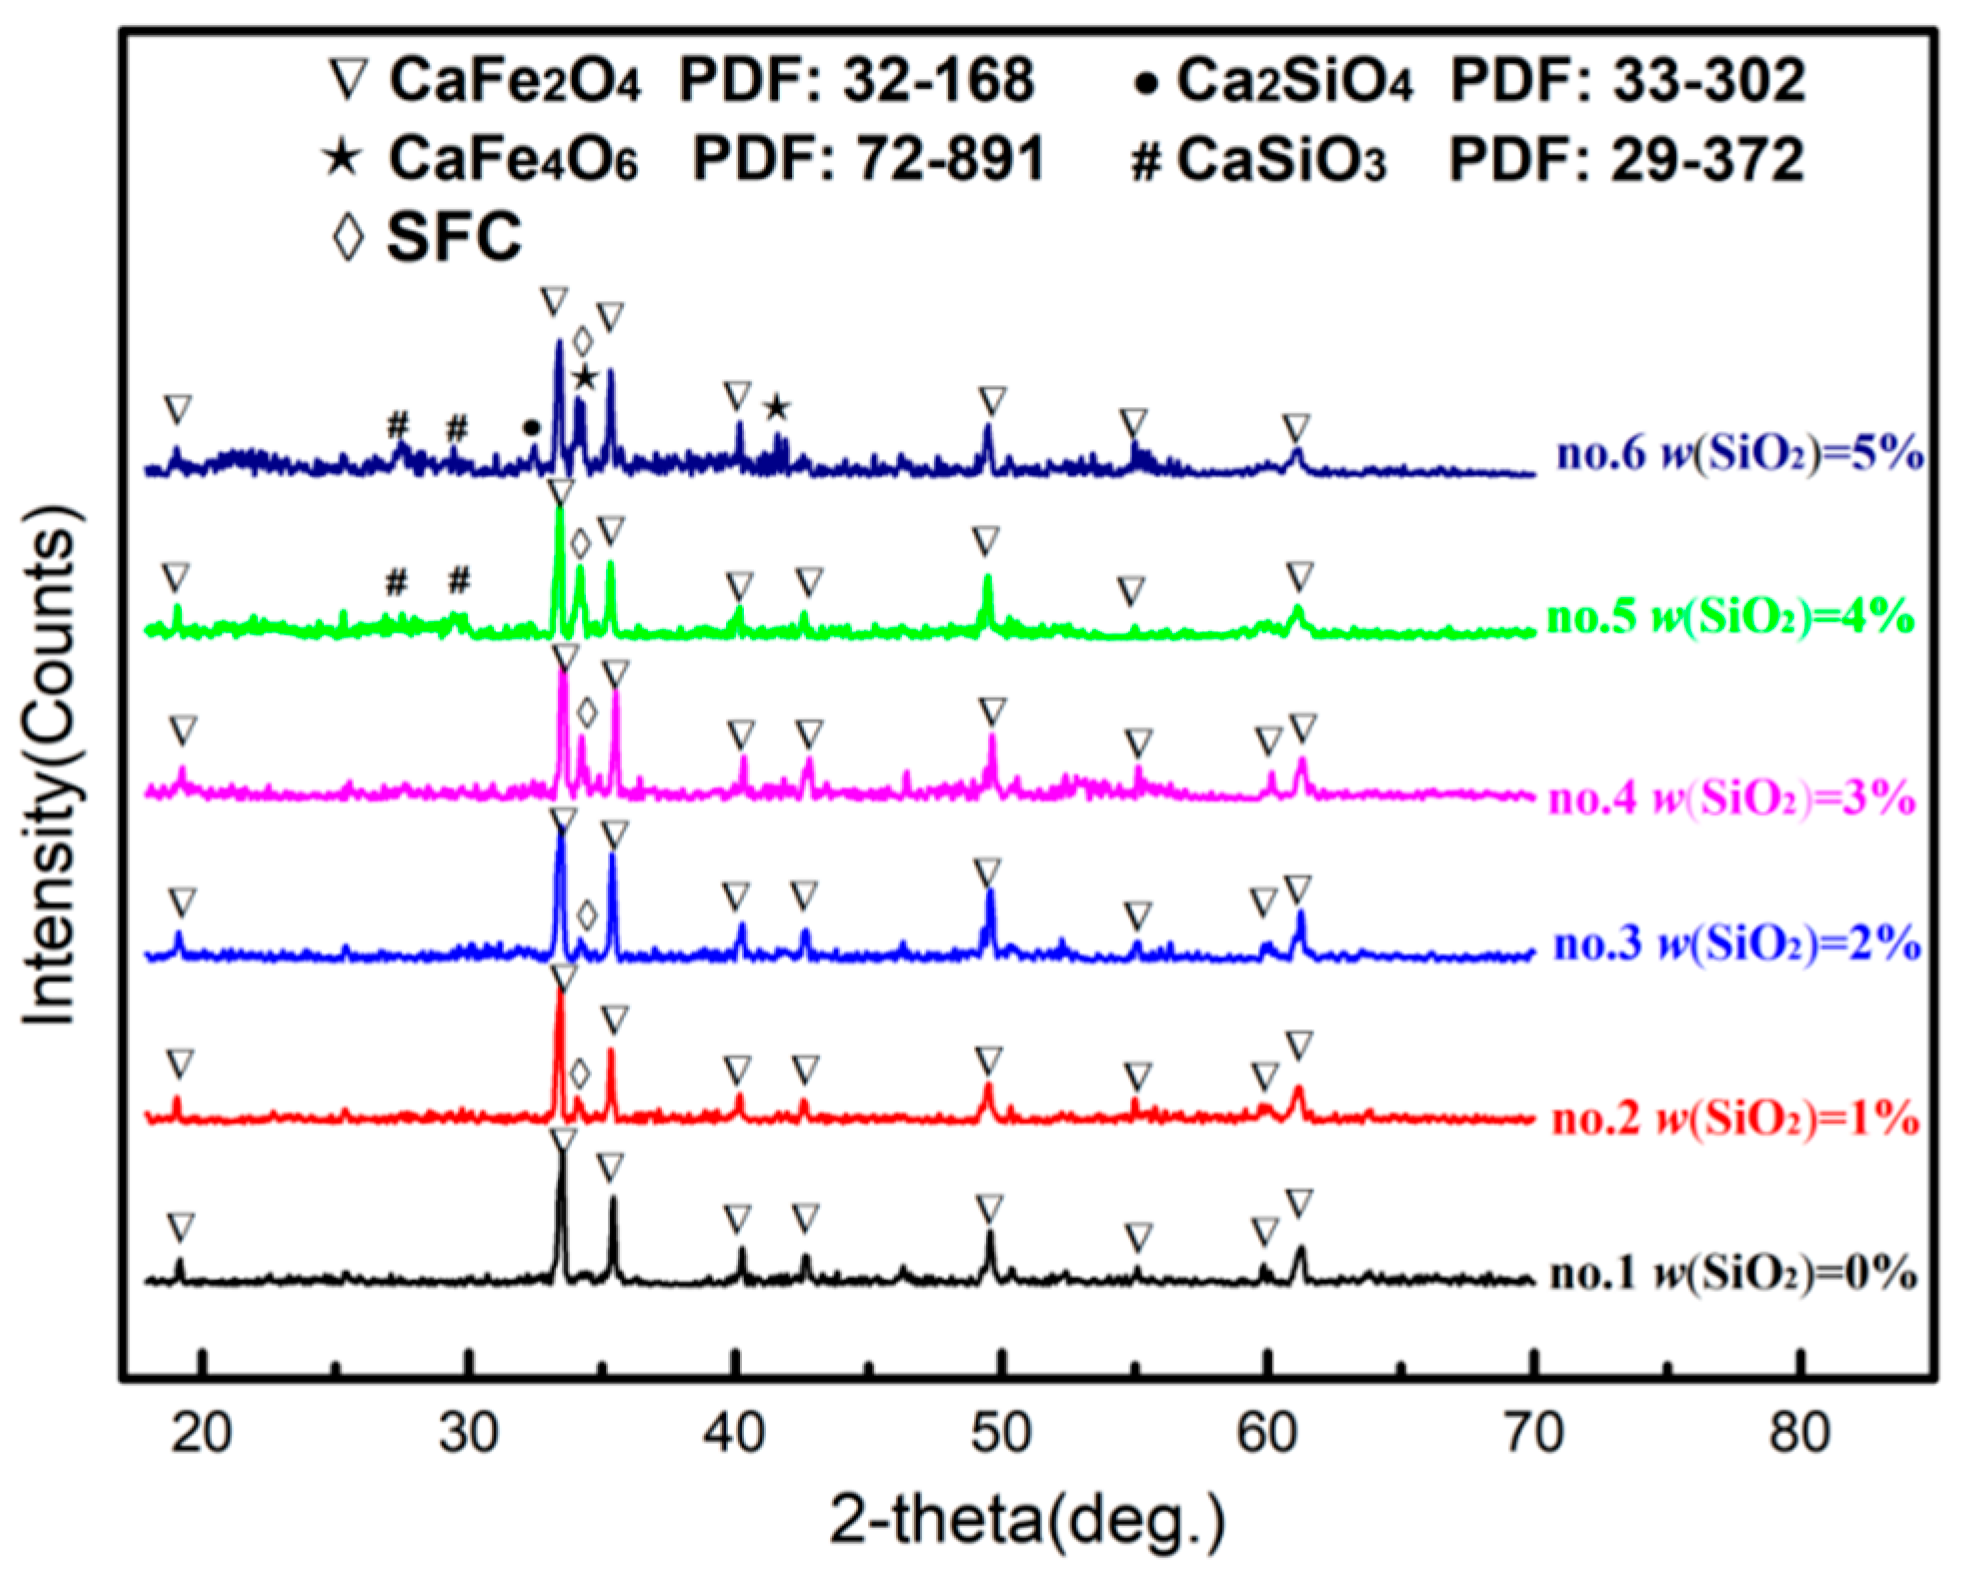
The samples were prepared from Fe2O3 (w(Fe2O3) ≥ 99.99%), SiO2 (w(SiO2) ≥ 99.99%) and Ca(OH)2 (w(Ca(OH)2) ≥ 99.99%). In order to assure that the main formed phase is CaO·Fe2O3 in the samples, the mole ratio of Ca(OH)2 and Fe2O3 is 1:1. Fe2O3, Ca(OH)2 and SiO2 were added according to the mass ratio in Table 1. The samples were pressed into briquettes size of Φ 20 mm × 20 mm using a briquetting machine at a pressure of 5.0 MPa for nearly 1 min. Subsequently, prepared sample was placed into an alumina crucible. Then the sintering experiment was carried out in a muffle furnace (SX2-10-13, Experimental electric furnace factory, Changsha, China). The sintering temperature raised from room temperature to 1200 °C (1473 K) at 10 °C/min (10 K/min), held for 8 h to react completely. Finally, sintered samples were cooled down in the air. X-ray diffraction (XRD, X’Pert PRO MPD, PANalytical Co. Ltd., Almelo, Netherlands) analysis was conducted to confirm the phase composition of the roasted samples. Scanning was carried out at an angular range from 10° to 90° and scan rate of 5°/min, the test results are shown in Figure 1.

2.2. Mechanics and Reduction Experiments

Hardness of samples was tested by HV1000B micro Vickers hardness tester (Xinyun Co., Ltd., Hebi, China) and was reported as standard Vickers hardness number (Hv). Polished sinter samples were used for this study. Standard indentation procedures were employed throughout, and a load of 981 mN was used for all the phases. The indentation time was kept constant at 10 s. The H (Microhardness) is determined based on the average of 10 data points for each phase by Vickers. E (Modulus of Elasticity) and KIC (Fracture toughness) were defined as follows by Knoop indentation [19].
K IC = δ ( E H ) 1 2 P c 3 2 ,
where δ (δ = 0.0153) is material independent constant, P is the applied load pressure, c is crack length.
b a = 1 7.11 α H E ,
where the ratio of the diagonal dimensions of the Knoop head is defined by the indenter geometry 7.11, and a/b is impression long and short diagonal ratio and α (α = 0.45) is using a gradient adjusted to fit the data.
TG measurement of the reduction of samples was conducted using a microcomputer differential thermal balance (HCT-3, Henven Scientific Instrument Factory, Beijing, China). Powdered samples (20 mg) were heated at heating rate of 10 K/min from room temperature to 1100 °C (1373 K) with 50 mL/min mix gas (30% CO and 70% N2). Lump samples (160 ± 0.5 mg) were placed in an alumina crucible (Φ 7 mm ×1.5 mm) and were heated at heating rate of 10 K/min from room temperature to 700 °C (973 K) in alumina crucible with 50 mL/min 100% N2 atmosphere. Then, it was held for 60 min at 50 mL/min mix gas (30% CO and 70% N2) at 700 °C (973 K). Finally, the morphology of reacted lumpy sample was observed using scanning electron microscopy (EVO-MA10, SEM Zeiss, Oberkochen, Germany).

3. Results and Discussion

3.1. Effect of SiO2 on the Mechanical Properties of Calcium Ferrite

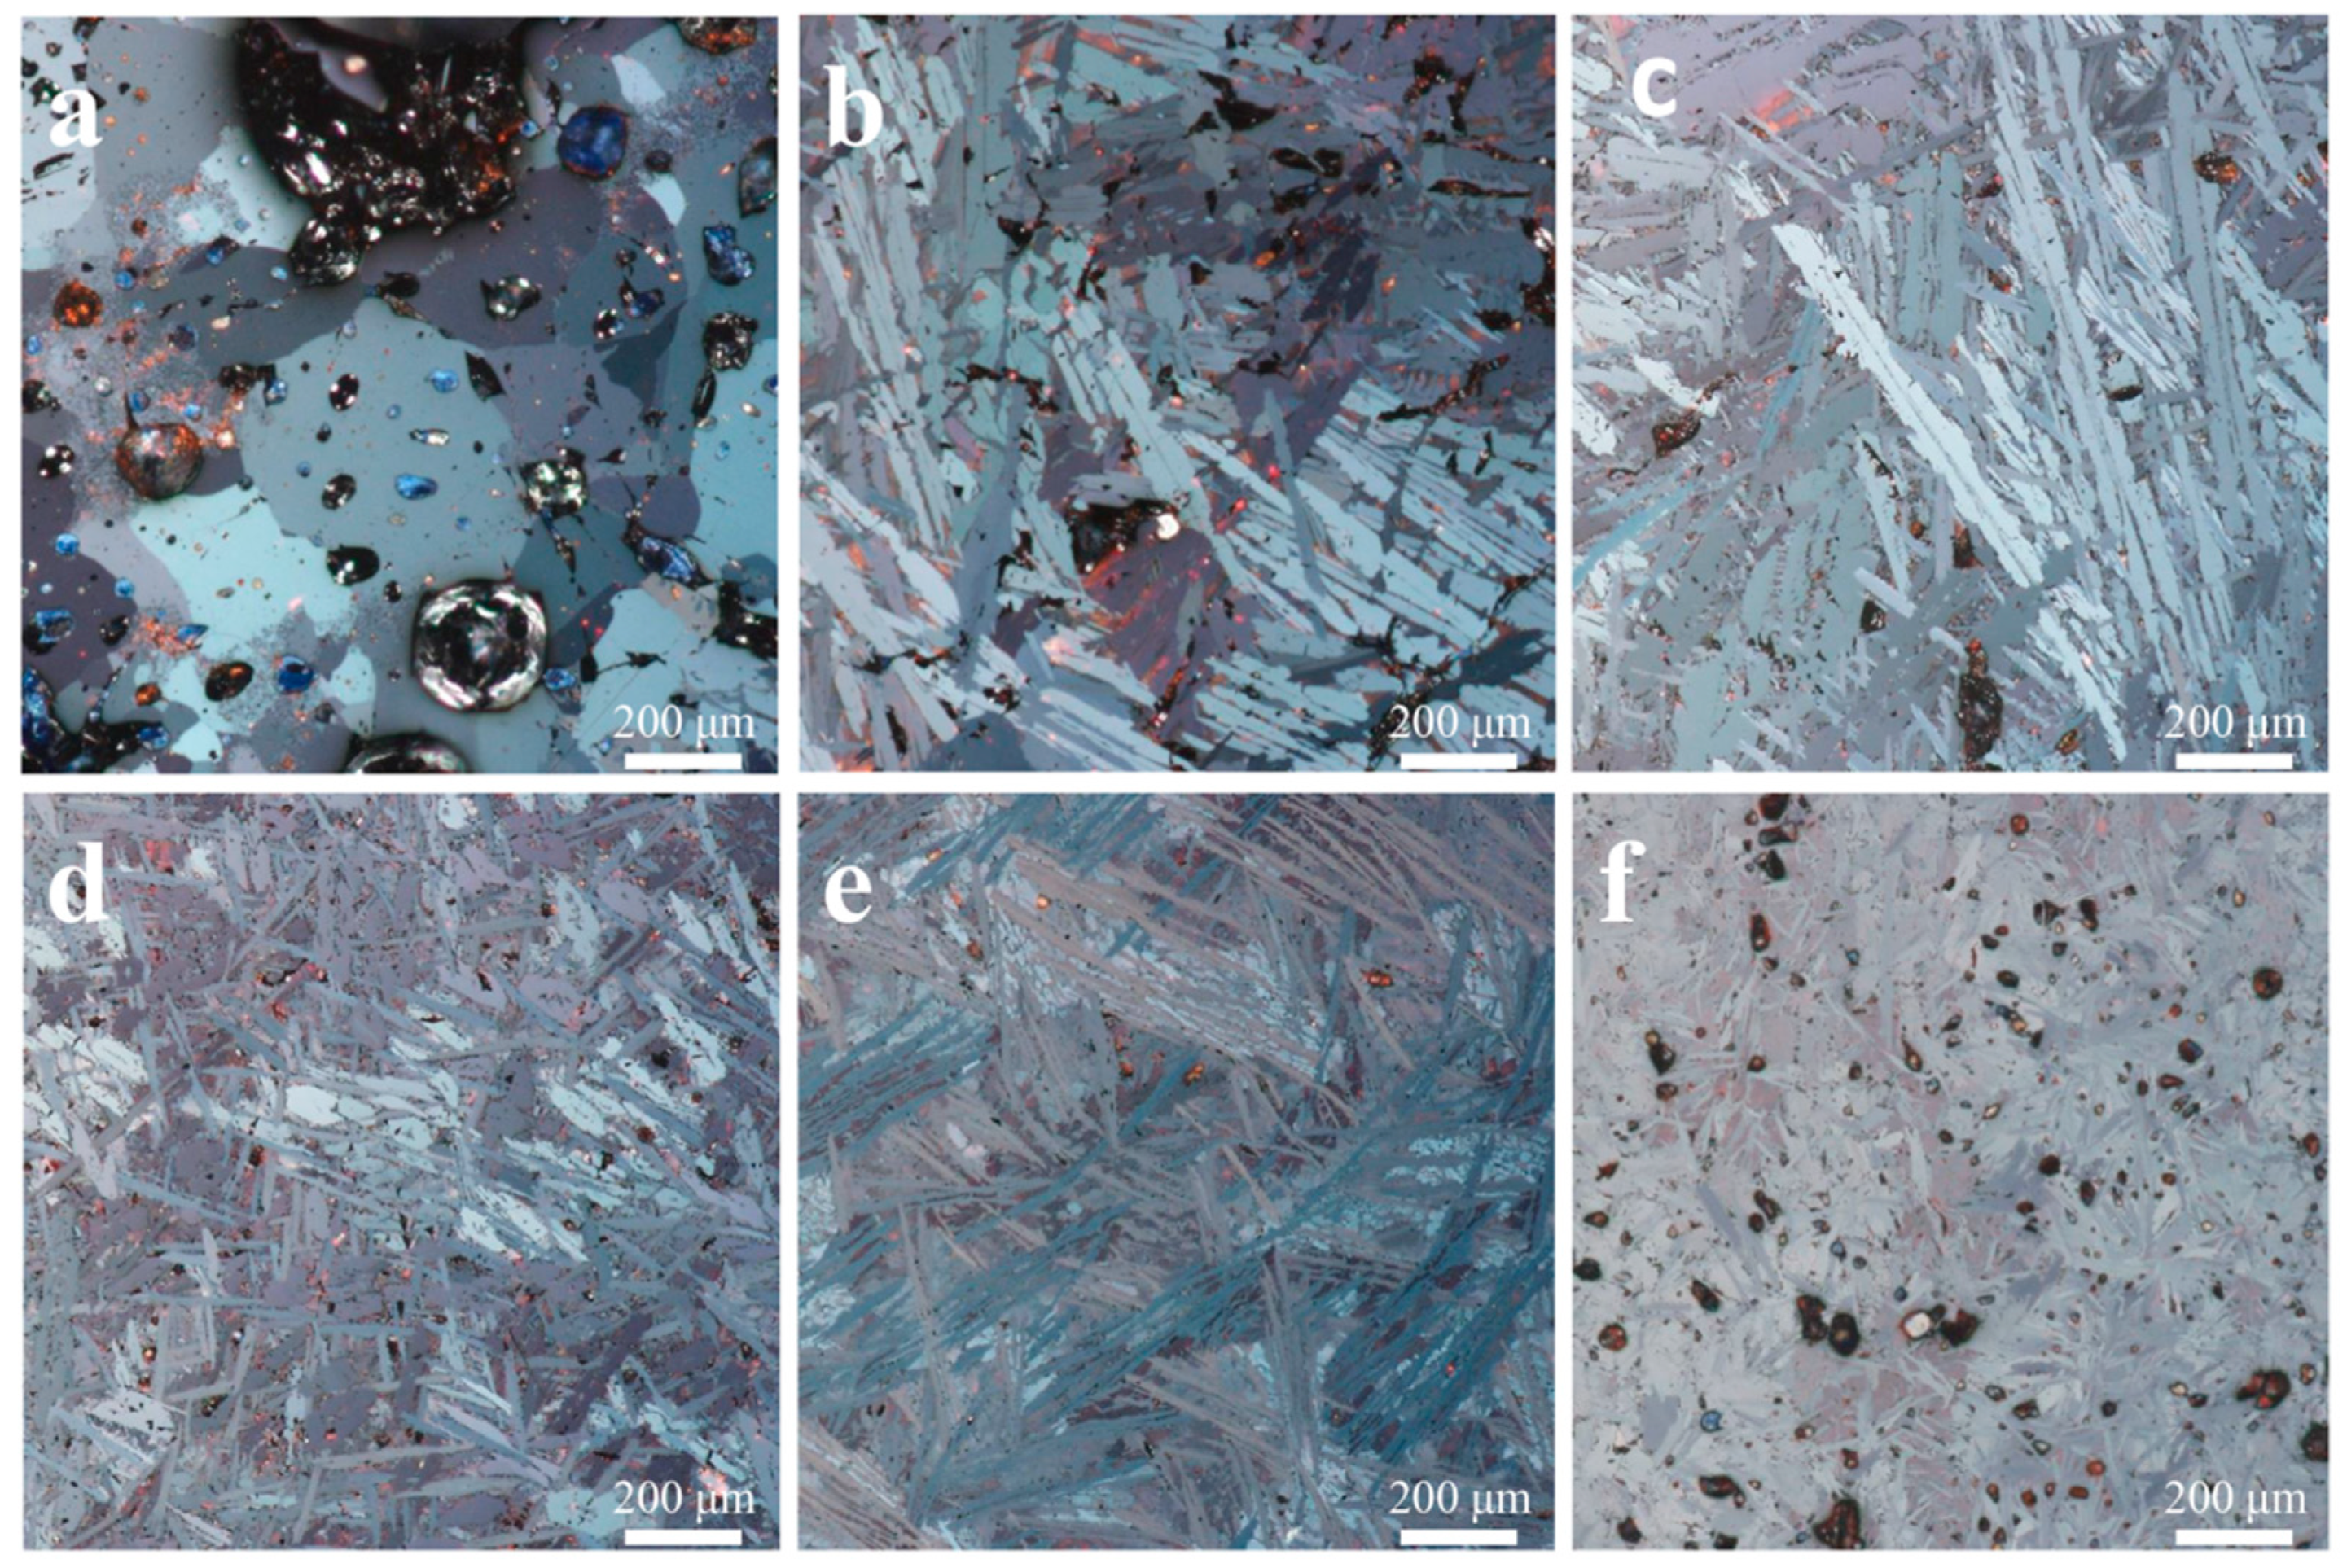
The morphologies of samples with different SiO2 contents at 1200 °C are shown in Figure 2. The content of SiO2 has great influence on the morphology of mineral phases in sintered samples. The morphology of calcium ferrite in sample no.1 is mainly grained. The grained calcium ferrites are gradually transformed into the column or acicular calcium ferrites with SiO2 added, as shown in samples no.1 to samples nos.2 and 3. With the content of SiO2 increasing, the sizes of calcium ferrites gradually become smaller.
Vickers hardness of samples with the different content of SiO2 were measured. The experimental results are shown in Table 2. The Vickers hardness and fracture toughness of the samples increased first and then decreased with the increase of SiO2 content at 1200 °C. Combined with XRD analysis, the Vickers hardness in the sample increases with the increase of SFC diffraction peak strength. It indicates that SiO2 solid solution in calcium ferrite forms SFC. It is helpful to increase the hardness. From Figure 2 and Table 2, it is possible to find that the size of acicular calcium ferrite is smaller with the content SiO2 increasing, and the greater the fracture toughness. However, when w(SiO2) > 4%, a small amount of silicate with high melting point and low strength was formed and the hardness and the fracture toughness of the sample decreased obviously.

3.2. Effect of SiO2 on the Reduction of Calcium Ferrite

3.2.1. Reduction Kinetic Analysis of Powder Sample

The reduction conversion was calculated by mass loss of samples. Reduction degree (x) can be described as follows [20,21]:
x = m 0 m t m 0 m ,
where m0 is the samples mass at the start of reduction, mg; mt is the samples mass at reduction time of t, mg; m is the theoretical sample mass assuming full reduction of iron oxide (s) contained in the sample, mg. The m of samples no.1 to no.6 are 4.44, 4.40, 4.35, 4.31,4.27 and 4.22 mg in this paper. The reduction route of CF is described as follows:
CF → CWF + C2F → CW3F + C2F → C2F → Fe
The mass loss rate of samples sintered during reduction is a function of reaction time and temperature, and it can be expressed as [22,23]:
d x d t = k ( T ) f ( x ) ,
d x d t is the mass loss rate, s−1, k(T) is the rate constant, which is a function of temperature; f(x) is the differential form of the reaction mechanism function; t is the reaction time, s; x is the reaction conversion.
According to the Arrhenius equation shown in Equation (5):
k = A exp ( E R T ) ,
where A is the pre-exponential factor, which contributes to the reaction rate, s−1; E is the activation energy, kJ·mol−1; R is the standard molar gas constant, kJ·mol−1·K−1.
During a non-isothermal process, the heating rate β (°C·s−1) is constant:
β = d T d t ,
The following formula can be obtained from Equations (4) and (6):
d x d T = A B exp ( E R T ) f ( x ) ,
Equation (5) can be integrated to give:
G ( x ) = 0 x d x f ( x ) = A β 0 T exp ( E R T ) d T ,
The following Equations (7) and (8) can be obtained by approximate calculation:
A B 0 T exp ( E R T ) d T A R T 2 β E ( 1 2 R T E ) exp ( E R T ) ,
1 2 R T E 1 .
The following formula can be obtained from Equations (9) and (10):
ln [ G ( x ) T 2 ] = ln ( A R β E ) E R T .
Model function G(x) was obtained to describe the relationship of reaction degree with time. Eight normal functions expressing the solid-state reaction are listed in Table 3 [24,25,26].
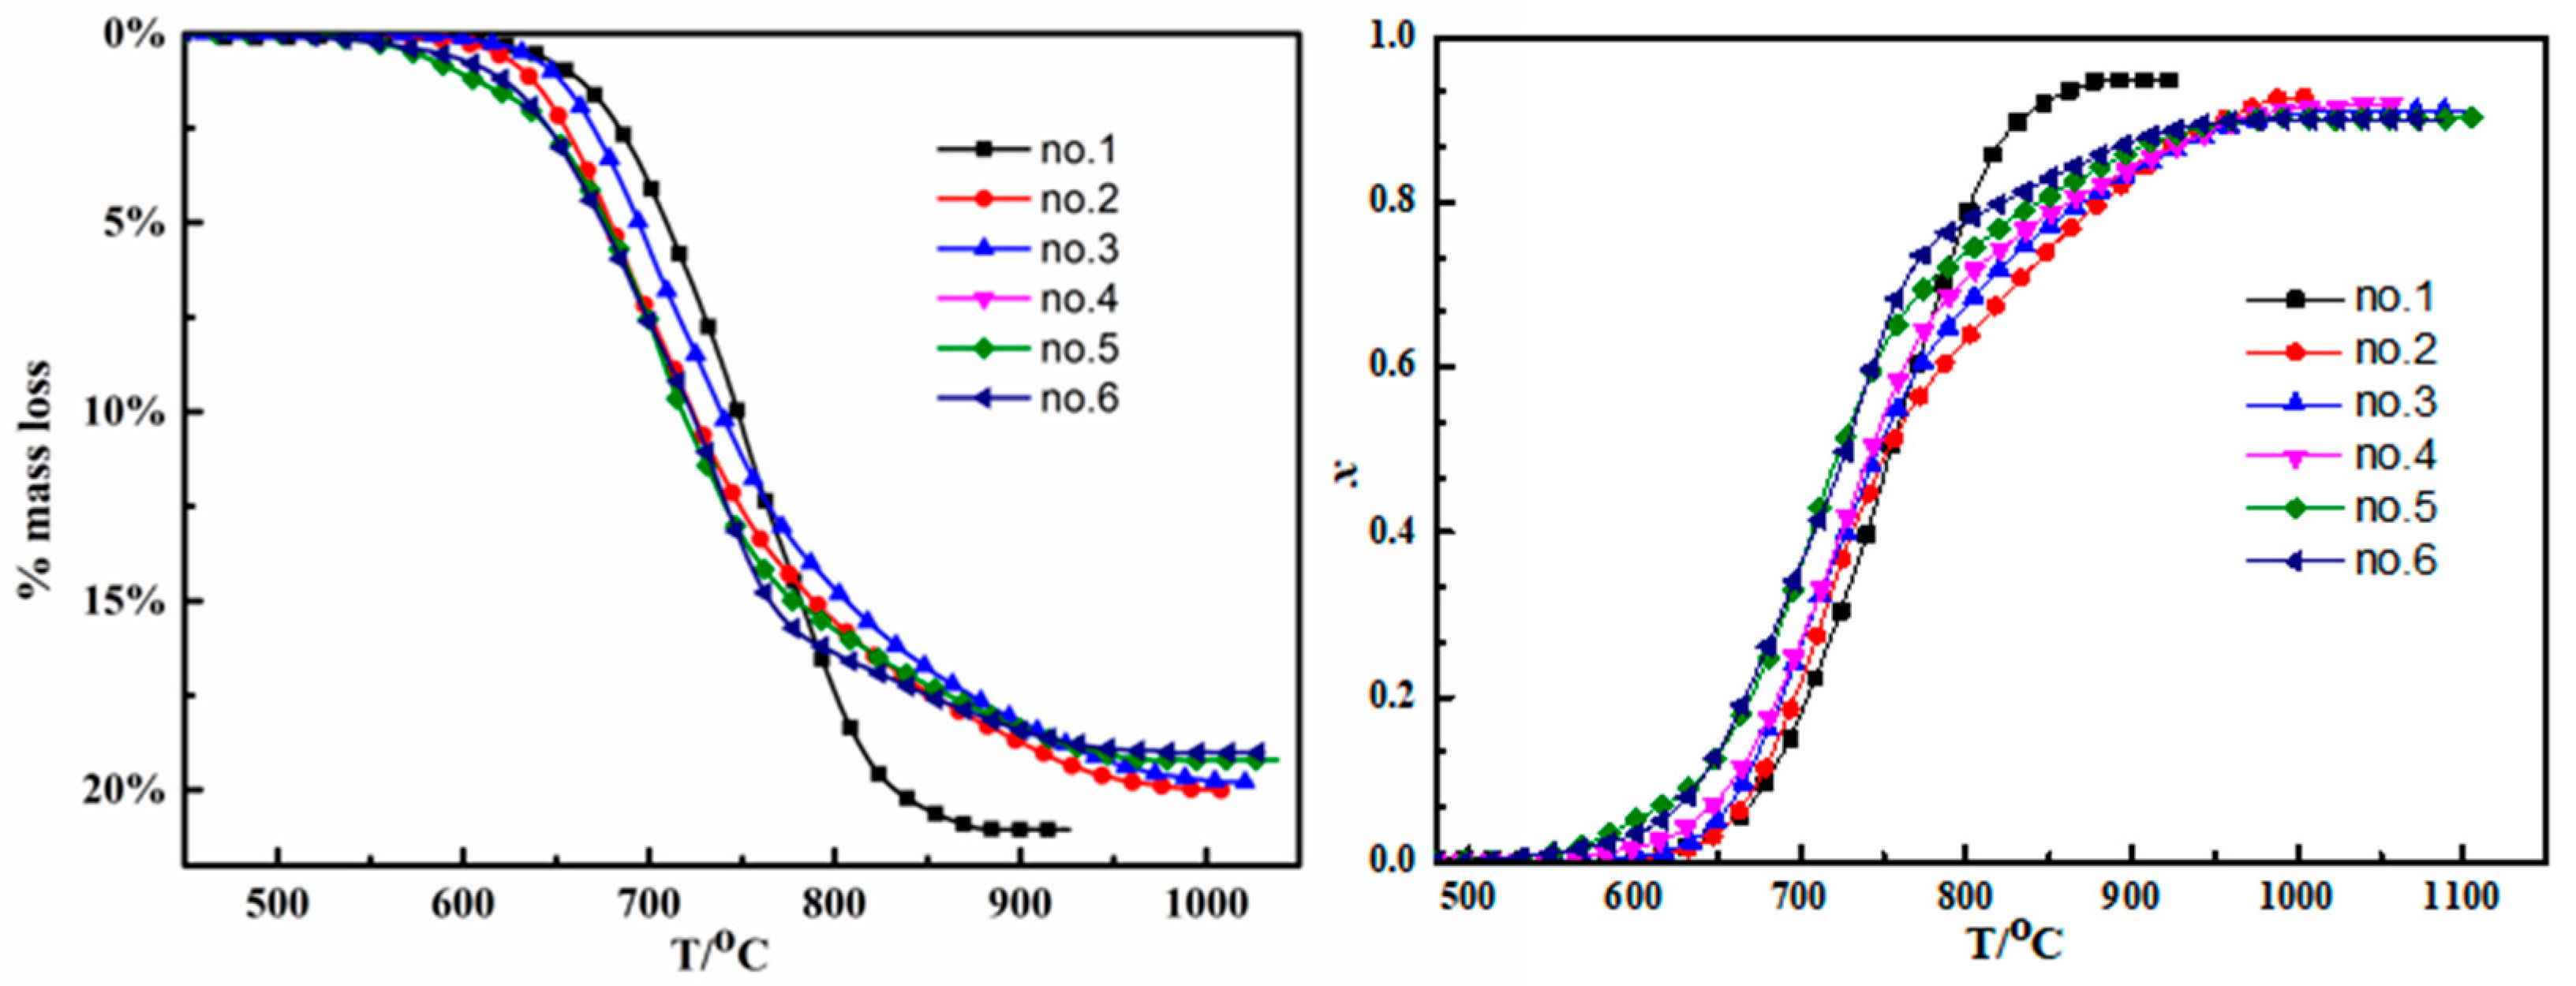
The relationship between reduction degree and temperature of powdered samples with different SiO2 content is shown in Figure 3. The maximum reduction degree and its corresponding time for samples are shown in Table 4, where xm, Ti and Tf [27] are the maximum reduction degree, initial mass loss temperature and maximum mass loss temperature of reduction reaction, respectively. With the increase of SiO2 content, the initial reduction temperature decreases gradually, and when w(SiO2) content exceeds 3%, the initial reduction temperature is stable (508.6–510.6 °C). The formation and increasing of SFC by solid solution of SiO2 in CF are beneficial to decrease the initial reaction temperature.
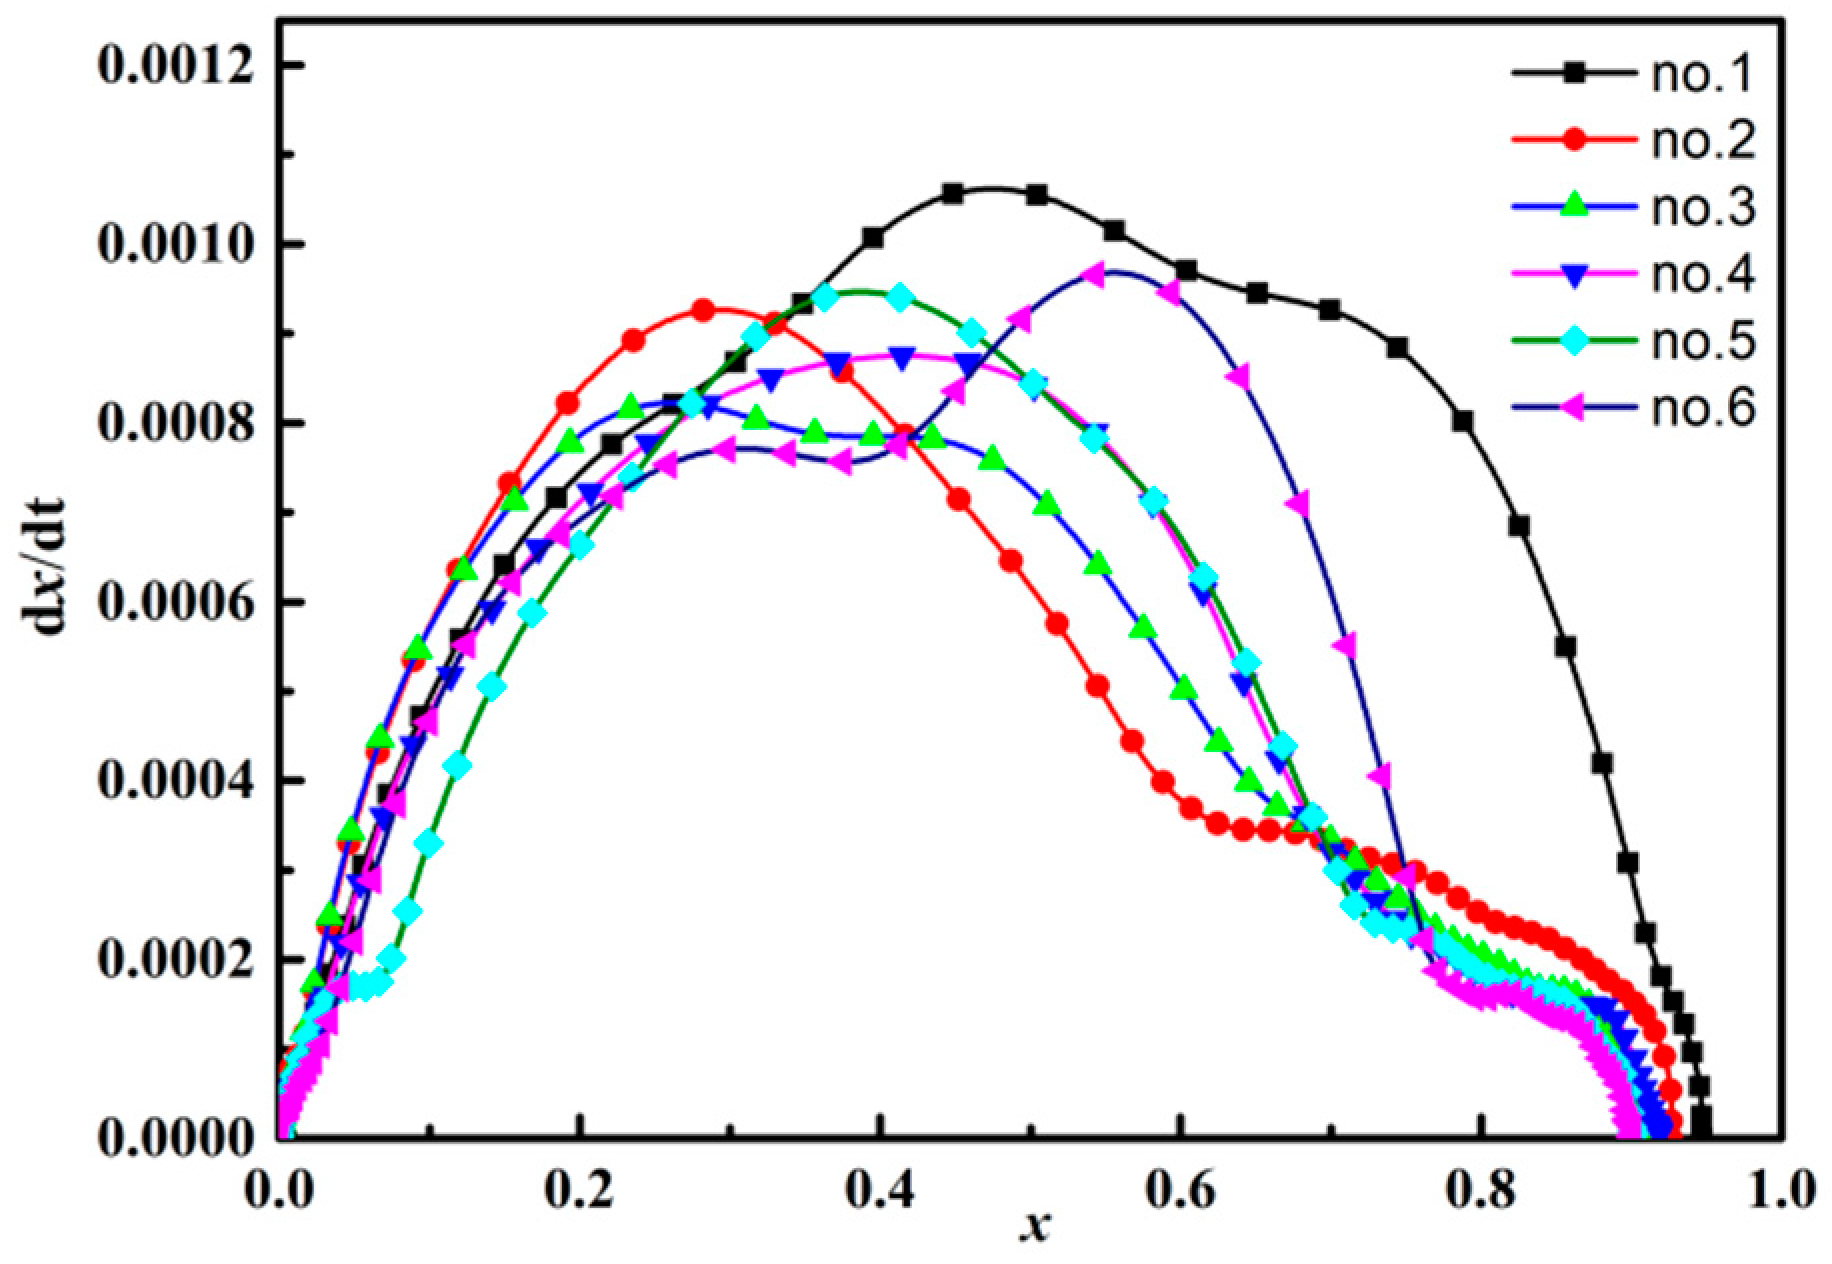
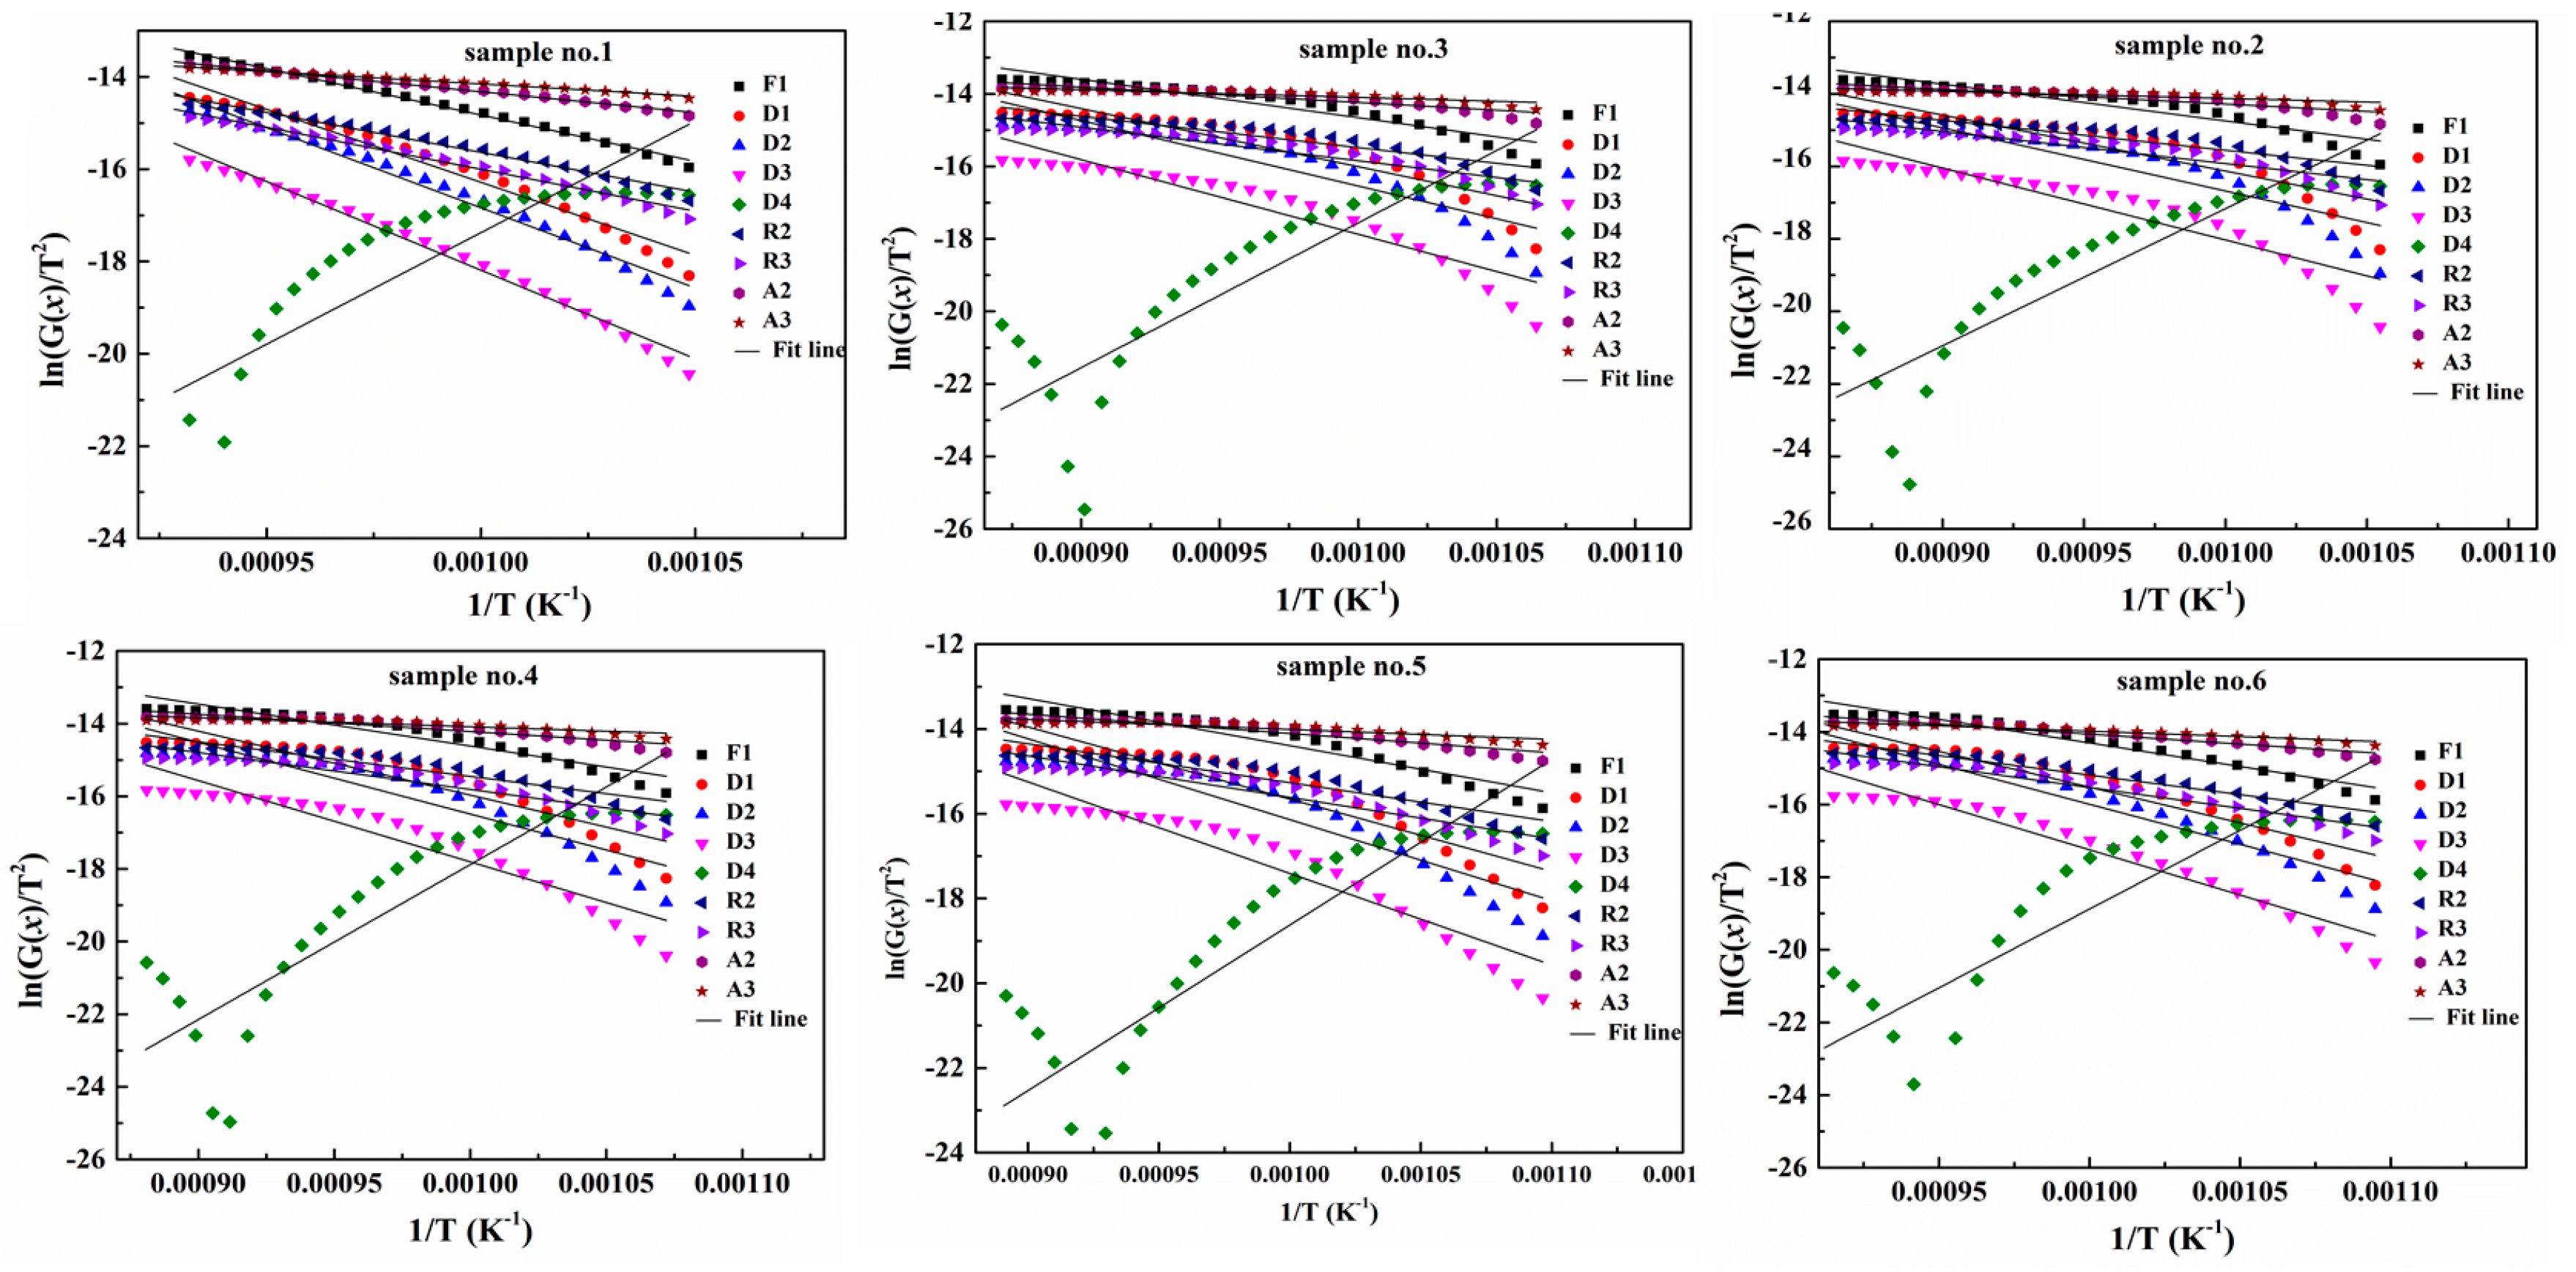
The relationship between reduction degree and reduction rate of powdered samples with different SiO2 content by non-isothermal thermal analysis is shown in Figure 4. It can be seen from Figure 3 that when x was over 0.6, the reduction rate of sample 1 was much higher than that of sample 2, although the reduction temperature of sample 1 was lower than that of the rest of samples. This may be due to the fact that there are FeO·SiO2 or CaO·FeO·SiO2 during the reduction process, which is difficult to reduce. The reduction termination temperature of the samples was increased. The fitting lines for the reaction of samples and kinetic parameters are shown in Figure 5 and Table 5, respectively. R is the correlation coefficient, and the larger the R, the better correlation of the mechanism function. It can be seen that the best fittings for all samples are those of F1. The apparent activation energy values of all samples are 167.23, 84.36, 87.90, 96.02, 92.44 and 107.83 kJ·mol-1. Sample reduction tends to be easy with the addition of SiO2 in the Fe2O3-CaO system. Moreover, the reduction of sample No. 2 is the most easily activated among all the samples.

3.2.2. Reduction Analysis of Lump Sample

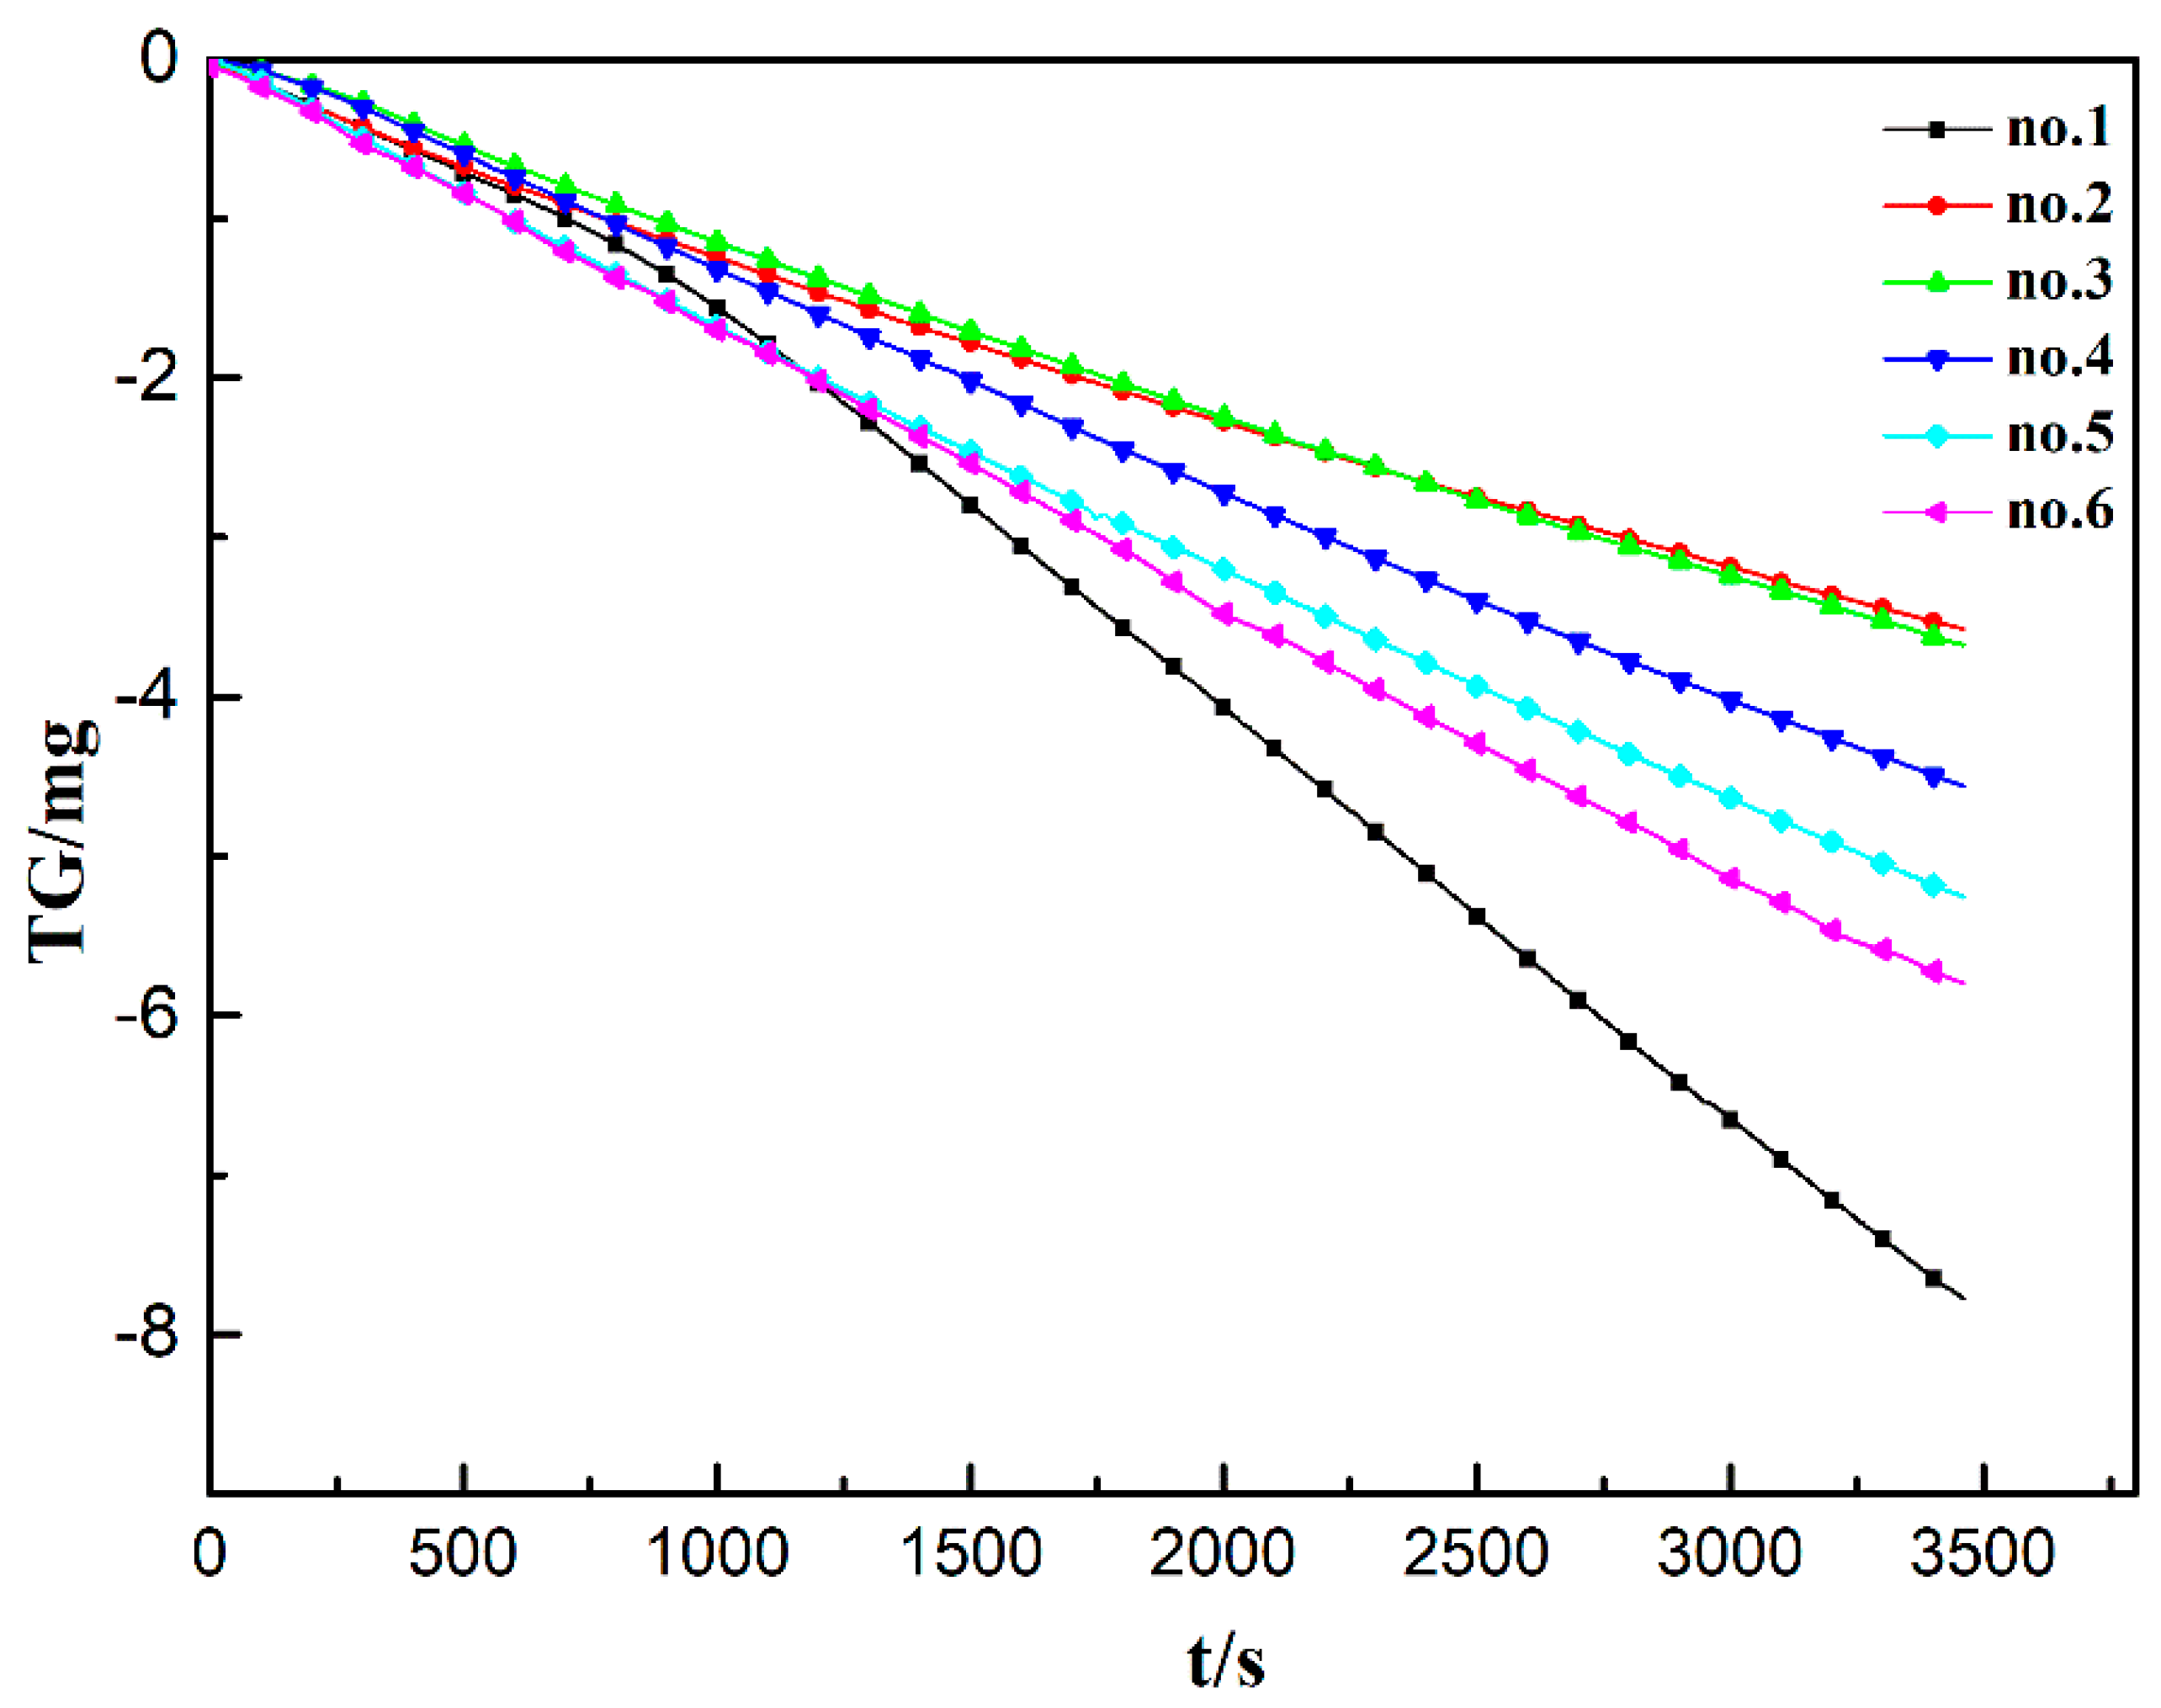
Figure 6 shows the changes in mass loss of samples with different content of SiO2 at 700 °C, under max gas (30%CO and 70%N2). The main factors affecting the reduction of lump samples are porosity, phase composition and morphology. The number of holes at sample no.1 which belongs to solid sintering, is obviously higher than that of the other samples. The mass loss of the rest of lump samples increases gradually with the increase of SiO2 content. As shown in Figure 2, there was no obvious difference in the number of holes for samples 2–5. It conduced that the mass loss of sample no.1 was obviously higher than that of other samples. The difference of mass loss of samples no.2 and no.3 was not particularly large. This was consistent with the difference of the morphology and the activation energy between samples no.2 and no.3. Although the activation energy of the powder sample no.4 is higher than that of sample no.3, the rate of lump sample no.4 reduction is obviously higher than that of no.3. The reductions of calcium ferrite in these samples are greatly affected by the morphology. In other words, the finer acicular calcium ferrite helps to increase the reduction rate.
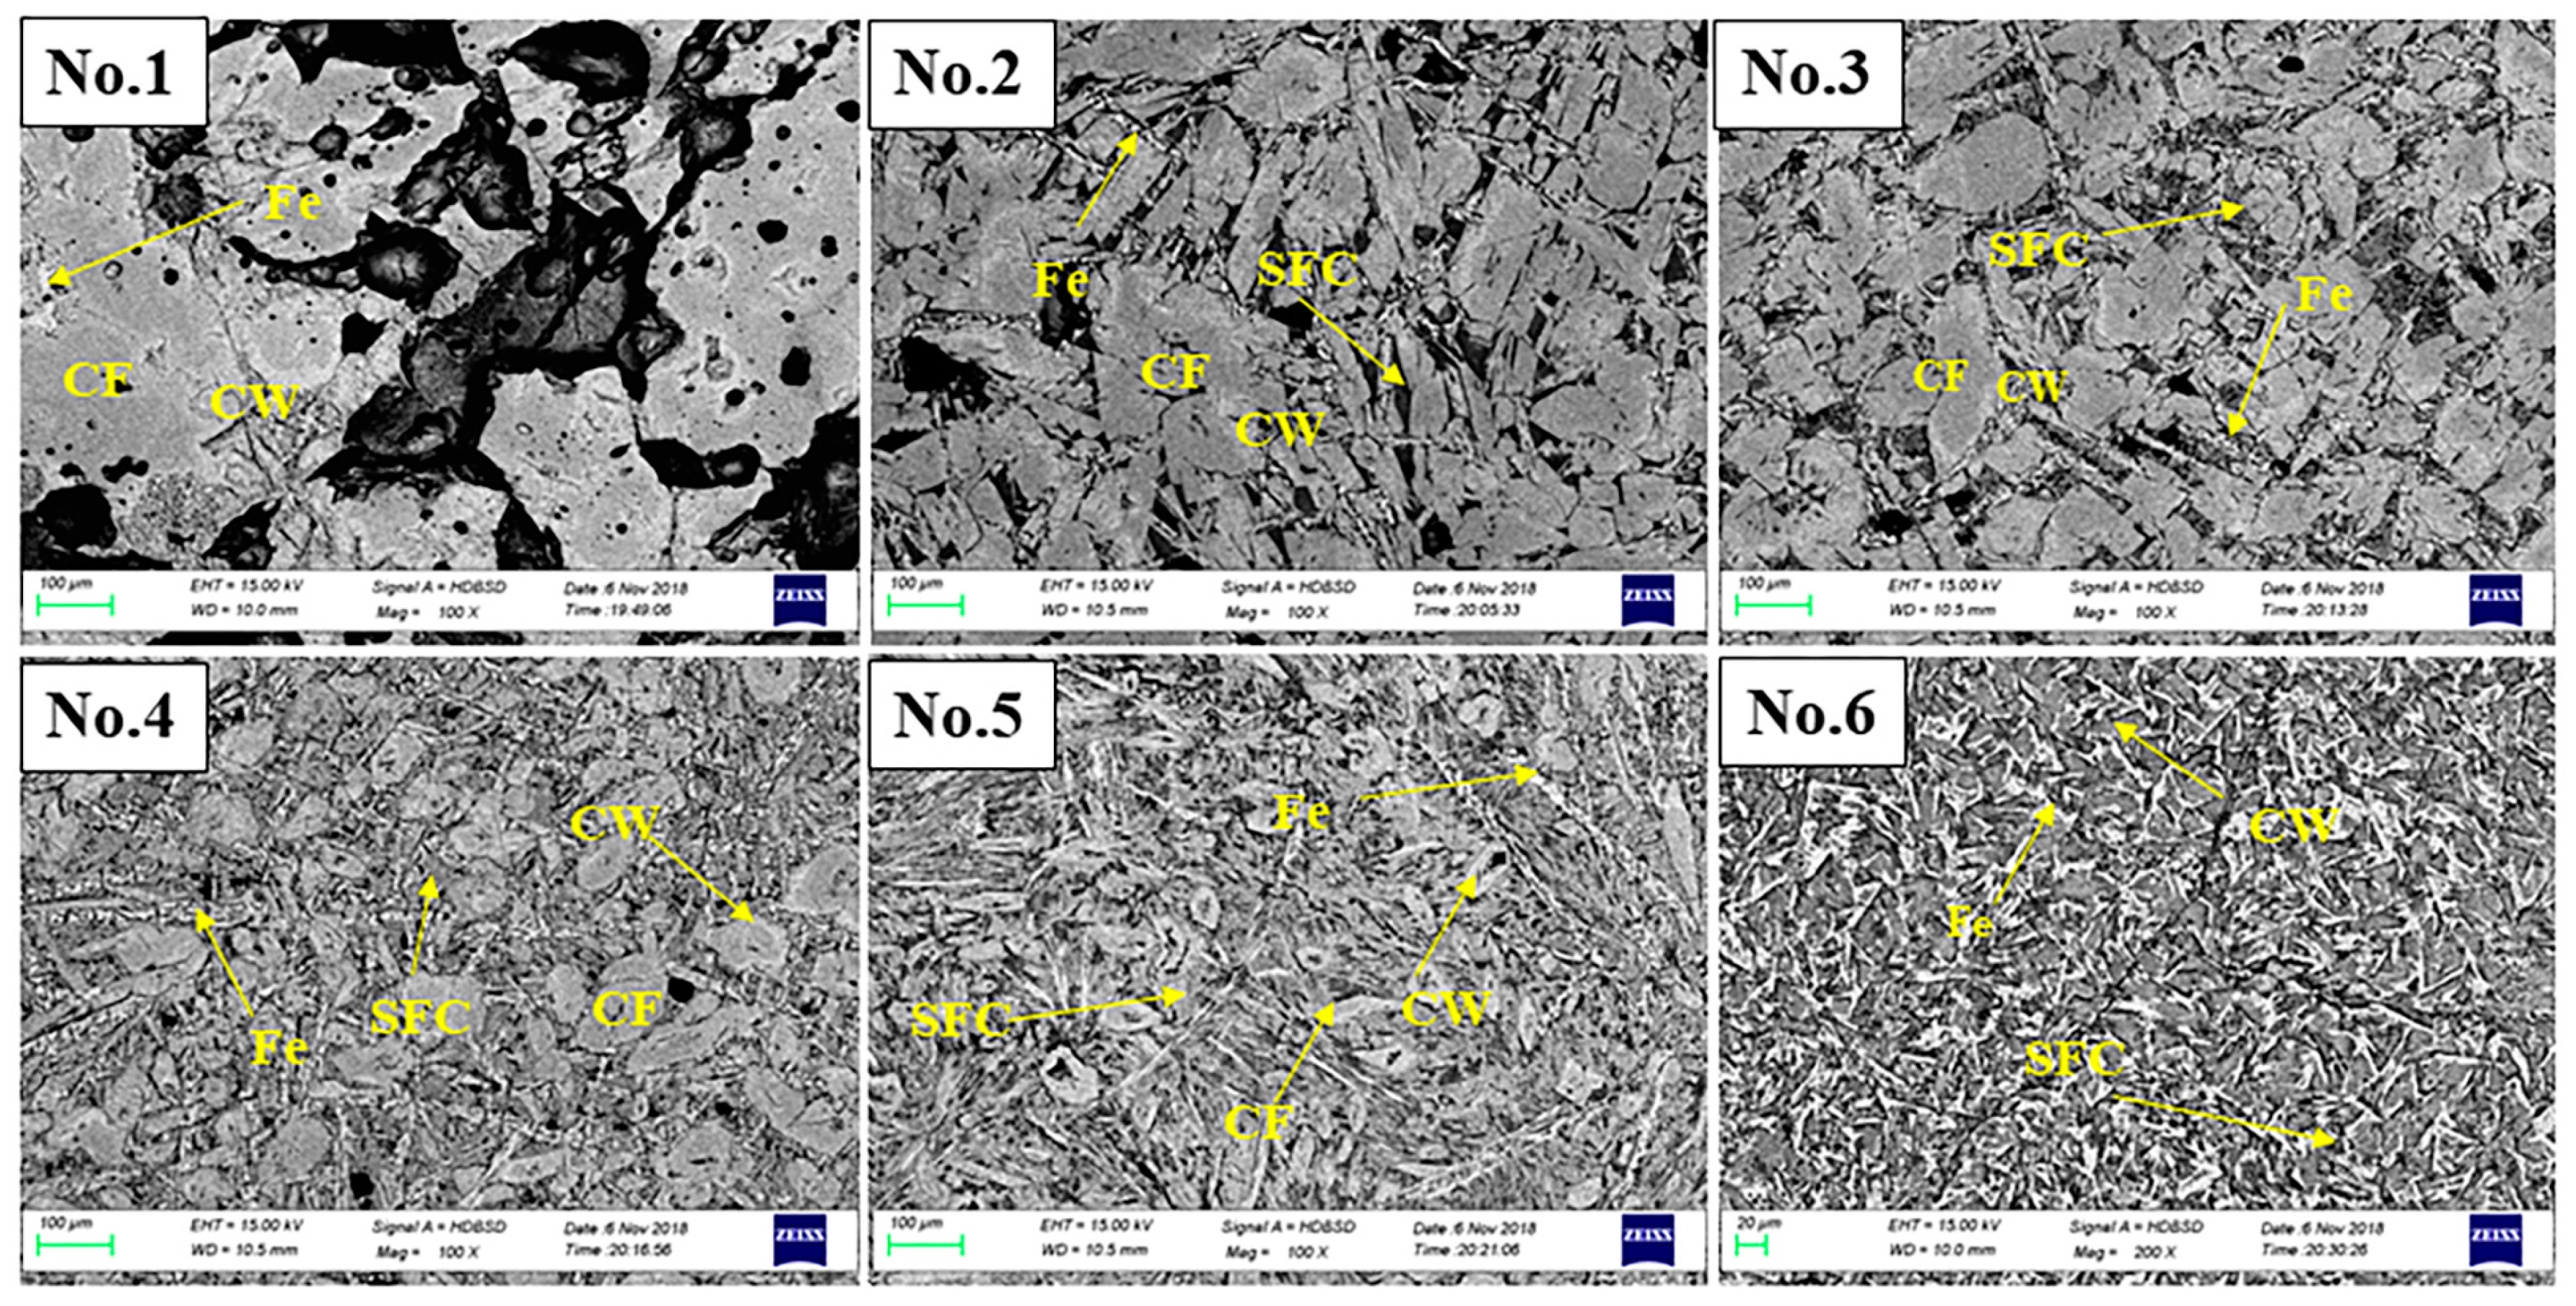
The morphologies of the samples after reduction, with w(SiO2) values ranging from 0 to 5%, were observed as shown in Figure 7. The microstructure in Figure 7 consists of four phases, i.e., calcium ferrite (CF), SFC, calcio–wüstite (CW) reduced from CF and SFC, Fe. The element compositions of the phases in these samples are listed in Table 6. It was not difficult to find the samples were reduced to Fe via CW. There are mainly Fe near acicular calcium ferrites and the pore in Figure 7. Most of the newly formed iron is acicular calcium ferrite in samples no.2–6. Therefore, it can be concluded that the acicular calcium ferrites are more easily reduced than the platy-like calcium ferrite.

4. Conclusions

This was a fundamental study of the effect of SiO2 on the mechanical property and reduction mechanism of calcium ferrite in iron ore sinter. Obtained results are summarized as follows.
Results indicate that SFC with SiO2 solid solution in calcium ferrite forms is helpful in increasing hardness. With the content of SiO2 increasing, the size of calcium ferrites gradually becomes smaller. The size of ACF is smaller with the content SiO2 increasing, and the greater the fracture toughness.
The SiO2 in CF is beneficial to decrease the initial reaction temperature and the apparent activation energies of reduction. The reduction termination temperature of the sample is also increased with the SiO2 addition. The apparent activation energy values of the samples with the different content of SiO2 from 0% to 5% are 167.23, 84.36, 87.90, 96.02, 92.44 and 107.83 kJ·mol−1, respectively.
The finer acicular calcium ferrite helps to increase the reduction rate. The samples were reduced to Fe from calcio–wüstite (CW) and most of the Fe was near acicular calcium ferrites and the pore rather than the platy calcium ferrites. This indicatea that the acicular-like calcium ferrites are more easily reduced than the platy-like ones.

Author Contributions

W.W., R.X. and D.Y. conceived and designed the experiments; D.Y. and J.L. performed the experiments; W.W. and D.Y. analysed the data and wrote the original manuscript; M.S. and R.X. reviewed and corrected the paper.

Funding

This research was funded by the National Natural Science Foundation of China grant number 51474164, 51704216, U1760101.

Acknowledgments

The authors acknowledge financial support from the National Natural Science Foundation of China (51474164, 51704216, U1760101).

Conflicts of Interest

The authors declare no conflict of interest.

References

  1. Fernández-González, D.; Ruiz-Bustinza, I.; Mochón, J.; González-Gasca, C.; Verdeja, L.F. Iron ore sintering: Process. Miner. Proc. Extr. Metall. Rev. 2017, 38, 215–227. [Google Scholar] [CrossRef]
  2. Fernández-González, D.; Ruiz-Bustinza, I.; Mochón, J.; González-Gasca, C.; Verdeja, L.F. Iron ore sintering: Quality Indices. Miner. Proc. Extr. Metall. Rev. 2017, 38, 254–264. [Google Scholar] [CrossRef]
  3. Webster, N.A.S.; Pownceby, M.I.; Madsen, I.C. In situ X-ray Diffraction Investigation of the Formation Mechanisms of Silico-Ferrite of Calcium and Aluminium-I-type (SFCA-I-type) Complex Calcium Ferrites. ISIJ Int. 2013, 53, 1334–1340. [Google Scholar] [CrossRef] [Green Version]
  4. Webster, N.A.S.; O’Dea, D.P.; Ellis, B.G.; Pownceby, M.I. Effects of Gibbsite, Kaolinite and Al-rich Goethite as Alumina Sources on Silico-Ferrite of Calcium and Aluminium (SFCA) and SFCA-I Iron Ore Sinter Bonding Phase Formation. ISIJ Int. 2017, 57, 41–47. [Google Scholar] [CrossRef] [Green Version]
  5. Sinha, M.; Ramna, R.V. Effect of Variation of Alumina on the Microhardness of Iron Ore Sinter Phases. ISIJ Int. 2009, 49, 719–721. [Google Scholar] [CrossRef] [Green Version]
  6. Zhou, M.; Yang, S.T.; Jiang, T.; Xue, X.X. Influence of MgO in form of magnesite on properties and mineralogy of high chromium, vanadium, titanium magnetite sinters. Ironmak. Steelmak. 2015, 42, 217–225. [Google Scholar] [CrossRef]
  7. Sinha, M.; Nistala, S.H.; Chandra, S.; Mankhand, T.R.; Ghose, A.K. Correlating mechanical properties of sinter phases with their chemistry and its effect on sinter quality. Ironmak. Steelmak. 2017, 44, 100–107. [Google Scholar] [CrossRef]
  8. Loo, C.E.; Wan, K.T.; Howes, V.R. Mechanical properties of natural and synthetic mineral phases in sinters having varying reduction degradation indices. Ironmak. Steelmak. 1988, 15, 279–285. [Google Scholar]
  9. Ding, X.; Guo, X.-M. The Formation Process of Silico-Ferrite of Calcium (SFC) from Binary Calcium Ferrite. Metall. Mater. Trans. B-Process Metall. Mater. Proc. Sci. 2014, 45, 1221–1231. [Google Scholar] [CrossRef]
  10. Ding, X.; Guo, X.-M. The Sintering Characteristics of Mixing SiO2 with Calcium Ferrite at 1473 K (1200 degrees C). Metall. Mater. Trans. B-Process Metall. Mater. Proc. Sci. 2015, 46, 1742–1750. [Google Scholar] [CrossRef]
  11. Ding, X.; Guo, X.-M.; Ma, C.-Y.; Tang, K.; Zhao, Y.-D. Effect of SiO2 on the Crystal Structure Stability of SFC at 1473 K (1200 A degrees C). Metall. Mater. Trans. B-Process Metall. Mater. Proc. Sci. 2015, 46, 1146–1153. [Google Scholar] [CrossRef]
  12. Murakami, T.; Kodaira, T.; Kasai, E. Effect of the Reduction of Calcium Ferrite on Disintegration Behavior of Sinter under High Hydrogen Atmosphere. ISIJ Int. 2015, 55, 1197–1205. [Google Scholar] [CrossRef] [Green Version]
  13. Hessien, M.M.; Kashiwaya, Y.; Ishii, K.; Nasr, M.I.; El-Geassy, A.A. Sintering and heating reduction processes of alumina containing iron ore samples. Ironmak. Steelmak. 2008, 35, 191–204. [Google Scholar] [CrossRef]
  14. Ying, Z.W.; Xu, L.X.; Jiang, M.F.; Shen, Y.S. Effect of Calcium Ferrite Morphology on Anti-Fracture Ability of Sinters. J. Iron Steel Res. Int. 2006, 18, 55–58. [Google Scholar] [CrossRef]
  15. Hida, Y.; Okazaki, J.; Itoh, K.; Sasaki, M. Formation Mechanism of Acicular Calcium Ferrite of Iron Ore Sinter (Sinter). Tetsu Hagane 1987, 73, 1893–1900. [Google Scholar] [CrossRef]
  16. Cai, B.; Watanabe, T.; Kamijo, C.; Susa, M.; Hayashi, M. Comparison between Reducibilities of Columnar Silico-ferrite of Calcium and Aluminum (SFCA) Covered with Slag and Acicular SFCA with Fine Pores. ISIJ Int. 2018, 58, 642–651. [Google Scholar] [CrossRef]
  17. Ding, C.; Lv, X.; Xuan, S.; Qiu, J.; Chen, Y.; Bai, C. Effect of Silica on Reduction of Calcium Ferrite with CO-N-2 Gas Mixtures. ISIJ Int. 2017, 57, 634–642. [Google Scholar] [CrossRef]
  18. Xuan, S.; Lv, X.; Ding, C.; Tang, K.; Li, G.; Pei, G.; Wu, S. Reduction Behavior of Aluminate Calcium Ferrite (CFA) in CO-N-2 Atmosphere. Steel Res. Int. 2018, 89, 1700452. [Google Scholar] [CrossRef]
  19. Marshall, D.B.; Tatsuo, N.; Evans, A.C. A simpled method for determining elastic modulus to hardness ratios using Knoop indentation measurements. J. Am. Ceram. Soc. 1982, 65, 175–176. [Google Scholar] [CrossRef]
  20. Wang, G.; Zhang, J.; Hou, X.; Shao, J.; Geng, W. Study on CO2 gasification properties and kinetics of biomass chars and anthracite char. Bioresour. Technol. 2015, 177, 66–73. [Google Scholar] [CrossRef] [PubMed]
  21. Wang, G.; Zhang, J.; Shao, J.; Ren, S. Characterisation and model fitting kinetic analysis of coal/biomass co-combustion. Thermochim. Acta 2014, 591, 68–74. [Google Scholar] [CrossRef]
  22. Xu, R.; Zhang, J.; Wang, G.; Zuo, H.; Li, P.; Wang, H.; Lin, H.; Liu, S. Isothermal kinetic analysis on fast pyrolysis of lump coal used in COREX process. J. Therm. Anal. Calorim. 2016, 123, 773–783. [Google Scholar] [CrossRef]
  23. Xu, R.; Dai, B.; Wang, W.; Schenk, J.; Xue, Z. Effect of iron ore type on the thermal behaviour and kinetics of coal-iron ore briquettes during coking. Fuel Proc. Technol. 2018, 173, 11–20. [Google Scholar] [CrossRef]
  24. Xu, R.; Zheng, H.; Wang, W.; Schenk, J.; Xue, Z. Influence of Iron Minerals on the Volume, Strength, and CO2 Gasification of Ferro-coke. Energy Fuels 2018. [Google Scholar] [CrossRef]
  25. Zheng, H.; Wang, W.; Xu, R.; Zan, R.; Schenk, J.; Xue, Z. Effect of the particle size of iron ore on the pyrolysis kinetic behaviour of coal-iron ore briquettes. Energies 2018, 11, 2595. [Google Scholar] [CrossRef]
  26. Xu, R.; Wang, W.; Dai, B. Influence of particle size on the combustion behaviors of bamboo char used for blast furnace injection. J. Iron Steel Res. Int. 2018, 25, 1213–1222. [Google Scholar] [CrossRef]
  27. Wang, G.; Zhang, J.; Zhang, G.; Wang, H.; Zhao, D. Experiments and Kinetic Modeling for Reduction of Ferric Oxide-biochar Composite Pellets. ISIJ Int. 2017, 57, 1374–1383. [Google Scholar] [CrossRef] [Green Version]
Figure 1. XRD analysis of the powdered samples with different of SiO2 mass fractions at 1200 °C.
Metals 09 00152 g001
Figure 2. Morphology of samples with different of SiO2 mass fraction: (a) sample no.1 w(SiO2) = 0%; (b) sample no.2 w(SiO2) = 1%; (c) sample no.3 w(SiO2) = 2%; (d) sample no.4 w(SiO2) = 3%; (e) sample no.5 w(SiO2) = 4%; (f) sample no.6 w(SiO2) = 5%.
Metals 09 00152 g002
Figure 3. % mass loss versus temperature (a) and reduction degree versus reaction temperature (b).
Metals 09 00152 g003
Figure 4. Reduction rate dx/dt vs. reduction degree α for the reduction.
Metals 09 00152 g004
Figure 5. Reduction kinetic calculation of samples with different SiO2 content.
Metals 09 00152 g005
Figure 6. Experimental weightlessness curves of different lump samples with different SiO2 content.
Metals 09 00152 g006
Figure 7. Phase morphology of sample nos. 1–6 after reduction at 700 °C (CF: CaFe2O4, CW: calcio–wüstite).
Metals 09 00152 g007
Table 1. The composition of samples.
Sample Numberw(CaO) %w(Fe2O3) %w(SiO2) %
125.974.10.0
225.773.31.0
325.472.62.0
425.171.93.0
524.971.14.0
624.670.45.0
Table 2. Vickers hardness of calcium ferrites with different SiO2 content.
SamplesHV/Gg·m−2KIC/(MN·m−2/3)
Range of MeasurementAverage of Measurement
1490.8–623.3578.70.94
2567.7–747.5681.71.36
3639.4–762.8716.31.39
4686.3–890.3758.81.56
5633.5–744.8681.82.10
6600.2–710.9658.81.83
Table 3. Model function G(x) for normal solid-state reactions.
SymbolKinetic ModelsCodeG(x)
Reaction-orderInstantaneous nucleation and unidimensional growthF1−ln(1 − x)
Diffusion modelsOne-dimensional diffusionD1x2
Two-dimensional diffusion cylindrical symmetryD2x + (1 − x)ln(1 − x)
Three-dimensional diffusion spherical symmetry, N = 3D3[1 − (1 − x)1/3]2
Three-dimensional diffusion cylindrical symmetryD4(1 − 2/3x) − (1 − x)2/3
Geometrical contractionPhase boundary reaction, cylindrical symmetry, N = 1/2R21 − (1 − x)1/2
Phase boundary reaction, spherical symmetry, N = 1/3R31 − (1 − x)1/3
Nucleation modelsRandom nucleation and subsequent growth, N = 1/2, M = 2A2[−ln(1 − x)]1/2
Random nucleation and subsequent growth, N = 1/3, M = 3A3[−ln(1 − x)]1/3
Table 4. Initial and terminational temperature of reduction reaction of samples.
SamplesxmTi/°CTf/°C
10.947588.4875.4
20.925578.8987.1
30.910569.51035.2
40.918546.51047.0
50.902510.6991.0
60.900508.6980.2
Table 5. Kinetic parameters fitted by different mechanism function.
SamplesThe Best Mechanism FunctionsE/(kJ·mol−1)A/s−1R2
1F1167.23663514.900.995
2F184.3617.020.882
3F187.9029.360.899
4F196.0289.620.910
5F192.4470.230.903
6F1107.83568.320.952
Table 6. EDS analysis results of the samples after reduction, in atomic %.
Sample NumberElements
FeOCaSi
no.1CF29.0755.8515.080.00
CW39.1043.7617.150.00
Fe89.976.024.010.00
no.2CF29.5955.1315.280.00
CW35.3946.8817.720.00
Fe63.3327.948.570.14
SFC24.1054.9816.723.67
no.3CF28.4354.7616.800.00
CW35.9351.5212.430.10
Fe57.1821.6920.970.14
SFC21.5262.1113.162.82
no.4CF26.3358.0815.590.00
CW37.0150.6312.240.11
Fe84.608.057.350.00
SFC19.5962.5313.164.13
no.5CF29.5955.1315.280.00
CW36.9350.6012.230.21
Fe58.8123.2913.873.52
SFC20.9859.0316.702.88
no.6CW40.7947.4411.770.00
Fe53.9537.428.620.00
SFC33.3147.0216.782.53