Abstract
First-principles calculation was used to systematically investigate hydrogen solubility in Pd3Ag phases. It was found that the solubility of hydrogen in Pd3Ag phases was much greater than in face-centered cubic (FCC) Pd, suggesting that Ag atoms enhanced hydrogen solubility with respect to FCC Pd. In addition, the present calculation also revealed that the anti-site defect formation enthalpies of Pd3Ag were close to zero, and the values of vacancy were positive and large, which indicated that Pd3Ag distributed compactly. In the process of hydrogen separation, anti-site defects decreased the hydrogen solubility in the Pd3Ag phases, i.e., the ordered Pd3Ag phases bestowed excellent properties of H selectivity. The results presented not only explore the fundamental properties of Pd3Ag phases and their various potential applications, but also agree with experimental observations reported in the literature.
1. Introduction
In recent decades, Pd–Ag bimetallic systems have attracted significant research interest for their superior hydrogen (H) catalytic and separation properties [1,2,3,4], mainly due to their unique hydrogen selectivity and permeability [5,6]. It is well known that Ag would improve a pure Pd membrane lifetime and lower the operation temperature of H separation [1,7,8]. Moreover, substituting Pd with Ag can reduce the price of the membranes, and the so-called hydrogen embrittlement would be eliminated [8,9,10]. Accordingly, after studies on hydrogenation were performed [11,12], interest in the Pd–Ag system for use in hydrogen energy has increased [13,14].
As a typical hydrogen separation material, PdAg membranes with various Ag content have been the focus of attention. PdAg phases with 23–32% of Ag have an optimal performance in hydrogen permeation experiments [9,10,15]. Very recently, the mechanism of hydrogen diffusion in Pd3Ag phases has been reported by means of first-principles calculation [13]. Nevertheless, there is a lack of further theoretical investigations on the effects of Pd3Ag phases on H selectivity. In addition, point defects have important effects on the physicochemical properties of PdAg phases and play a deleterious role in the performance of Pd3Ag phases. As for the fundamental effects of point defects on H selectivity, however, there are no more results so far in the literature to the best of our knowledge.
By means of a highly accurate theoretical calculation based on density function theory (DFT), this study is aimed to systematically investigate the effects of point defects on hydrogen solubility in Pd3Ag phases, as, based on experimental observations, this composition of PdAg membranes confers high hydrogen permeability [9,10,15]. H solubility in Pd3Ag phases with and without point defects were also computationally predicted, and the mechanism in relation to bond charge and charge density was determined. The derived results not only are in good agreement with experimental results in the literature, but also provide a deep understanding of hydrogen separation by Pd3Ag.
2. Theoretical Methods
The present first-principles calculation was performed by means of the well-established Vienna Ab initio Simulation Package (VASP) [16,17]. To handle the wave functions near the core region, the PAW method has been widely used [18]. The exchange-correlation potential was approximated by the generalized gradient approximation (GGA) of Perdew-Burke-Ernzerhof (PBE) [19]. Electron wave functions were expanded in a plane-wave basis set with a kinetic energy cutoff of 400 eV, and periodic boundary conditions were fixed in three directions.
A unit cell of 2 × 2 × 2 (32 atoms) was chosen for L12 Pd3Ag. To simulate the Pd3AgH phases, one hydrogen atom was added at the octahedral (O) and tetrahedral (T) sites of the unit cell, and each phase with H addition was required to fully relax. As typical examples, Figure 1 shows the O and T sites of the L12 Pd3Ag phase. Notice from Figure 1c,d that there are two kinds of O sites for Pd3Ag: the O1 site is only surrounded by Pd atoms, and the O2 site by four Pd and two Ag atoms.
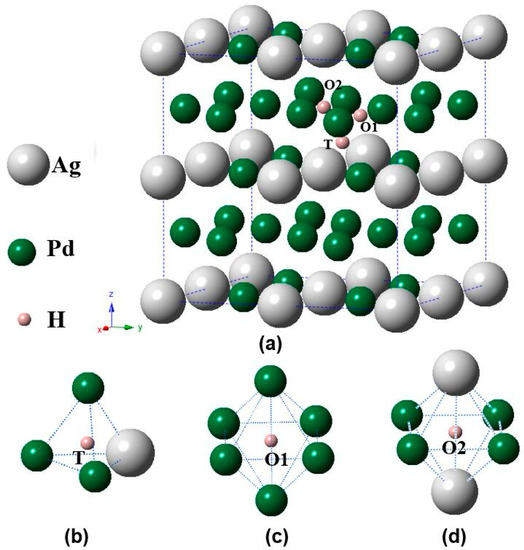
Figure 1.
Schematic illustrations of (a) various interstitial sites of the Pd3Ag phase, (b) tetrahedral (T) site, (c) octahedral (O1) site, and (d) octahedral (O2) site.
The relaxation and static calculations were conducted in a GAMMA-centered scheme with 9 × 9 × 9 and 11 × 11 × 11 respectively, together with a k-point broadening of 13 × 13 × 13 for the calculations of density of states (DOS) and bond charge. The force criterion acting on each atom during relaxation was 1.0 × 10⁻³ eV/Å, and the criteria of energy convergence were 1.0 × 10⁻² and 1.0 × 10⁻³ meV for relaxation and static calculations respectively.
The zero-point energy (ZPE) of H is considered in the present study and is derived through the following formula:
where and are Planck’s constant and the frequency associated with the harmonic mode, respectively. It should be noted that the vibration frequencies () of H atoms at interstitial sites of the Pd3Ag phases are derived through harmonic approximation by relaxing only the hydrogen atom and fixing the Pd and Ag atoms, since the Pd and Ag atoms have a much larger mass than the H atoms [20].
The solubility (C) of hydrogen in the Pd3Ag phases can be estimated using the formula C = KsPH0.5, where PH is the H pressure in the gas phase, and KS is the Sieverts’ constant with the following forms [21,22]:
where and , kB is the Boltzmann constant, Eb and denote the binding energy and vibration frequency of interstitial H atoms in the Pd3Ag phases respectively, γi is the vibration frequency of gaseous H2, h is the Plank constant and m and I represent the mass and moment of inertia of H2 respectively. In most cases, the experimental solubility of H in metal is closer to the total solubility values predicted for its octahedral (O) and tetrahedral (T) sites. Accordingly, the Sieverts’ constant of each PdAg phase is obtained through the summation of the KS values of all its interstitial sites.
3. Results and Discussion
To simulate the H effects, the binding energy of one H atom in the Pd3Ag phases was calculated according to the following formula:
where and are the total energies of Pd3Ag with and without the H atom respectively, and is the total energy of the H2 molecule. After a series of calculations, Table 1 was compiled listing the lattice constants (a), the zero-point energy of hydrogen (ZPE), and the binding energies (Eb) of the Pd3Ag phases. Meanwhile, the corresponding data of H in the interstitial sites of FCC Pd were also considered for comparison. The results of pure Pd from a supercell of 2 × 2 × 2 are also present in Table 1. One can clearly see from this table that the calculated lattice constants of FCC Pd and L12 Pd3Ag from the present simulation were not only in good agreement with experimental values reported in the literature [23,24], but also consistent with the other calculated results [13]. Moreover, the obtained binding energies of PdH also agreed well with the data of GGA-PW91 in the literature [25]. Such nice agreements suggest that the present PAW-PBE method would be suitable for revealing the behavior of H in Pd3Ag phases.

Table 1.
Lattice constants (a), zero-point energy of hydrogen (ZPE), binding energies (Eb) of pure Pd and Pd3Ag phases. The corresponding experimental and calculated data in the literature are also listed for comparison [13,23,24,25].
Consequently, it can clearly be observed from Table 1 that the Eb value of PdH (O) was much lower than that of PdH (T), suggesting that the O site is energetically more stable than the T site for H in pure Pd. This phenomenon is in excellent agreement with similar experimental observations in the literature [26]. Next, as Ag atoms occurred in Pd, it is important to recognize from this table not only that Pd3AgH (O1) was energetically more favorable with a much lower Eb value than Pd3AgH (T) and PdH (O), but also that the difference of Eb values between the O1 and T sites of Pd3AgH was much bigger than the corresponding value between PdH (O) and PdH (T). Such a phenomenon predicts that a super-high hydrogen selectivity could be obtained with both Ag–H and Pd–H bonds. In other words, substituting Pd with Ag had no effect on the preferred location of H found in pure Pd, and a lower Eb value of Pd3AgH (O1) could enhance the solubility of H in the O site of Pd.
According to Equation (1), Figure 2 plots the temperature-dependent solubility of H atoms in the Pd3Ag phases. The corresponding solubility of H in pure Pd is also shown in this Figure for comparison. It can be clearly observed that the determined H solubility in pure Pd was in excellent agreement with similar experimental and calculated values available in the literature [25,27]. For instance, H concentration in pure Pd at the temperature of 770 K was 1.27 × 10⁻², which matched well with the corresponding values of 1.15 × 10⁻² and 1.41 × 10⁻² from experimental and calculated data available in the literature [25,27].
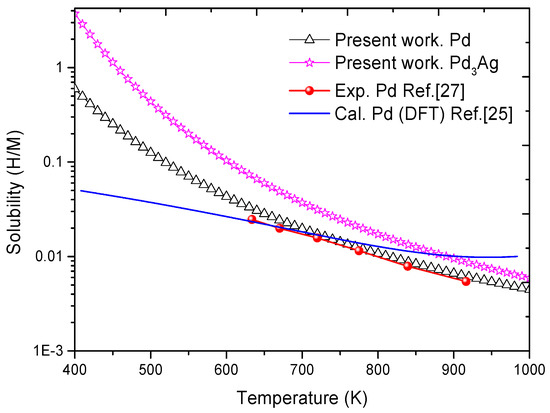
Figure 2.
Solubility of hydrogen in Pd and Pd3Ag phases. The experimental and calculated values of solubility in pure Pd reported in the literature [25,27] are also listed for comparison.
Figure 2 shows that as the temperatures rose, there was a decline in H solubility in pure Pd and Pd3Ag phases. Such a downtrend is consistent with experimental observations reported in the literature [28,29]. In addition, by directly comparing the values reported in Figure 2 we found that H solubility was slightly higher in the Pd3Ag phase than in pure Pd, which suggests that a low amount of Ag in the alloy would increase H solubility with respect to pure Pd. This may be the primary mechanism leading to the observed excellent hydrogen permeability of the Pd3Ag phase [30,31,32]. The calculated values also matched well with those obtained from similar experimental measurements found in the literature [28,29,30,31,32]. All the above agreements suggest that the theoretical method here presented should be relevant when it comes to reflecting the intrinsic features of the solubility of H in Pd3Ag phases.
It is important to investigate the intrinsic mechanism of the increase of H solubility in Pd3Ag phases and to calculate the charge transfers of PdH and Pd3AgH. The Bader analysis [33,34] was used to handle the charge transfers between H and Pd or Ag atoms in both O and T sites of PdH and Pd3AgH. As a typical example, the bond charge in the O (0.071 e) site, O1(0.170 e), and O2 (0.006 e) sites of PdH and Pd3AgH were selected and discussed. Interestingly, the bond charge in the O sites of PdH and Pd3AgH decreased in the order Pd3AgH (O1) → PdH(O) → Pd3AgH (O2), which is the exact opposite of that of the binding energy listed in Table 1. Such a descending trend confirmed that the chemical bond formed in Pd3AgH (O1) was much stronger than that in PdH (O), which helps explain the higher H solubility in the Pd3Ag phase found in the experiments.
We then focused on the point defects in the Pd3Ag phases. All possible point defects introduced into Pd3Ag phases are represented in Figure 3. It can be seen clearly from this Figure that there were four kinds of single point defects in Pd3Ag: (a) Ag vacancy (VAg), (b) Pd vacancy (VPd), (c) Ag anti-site (AgPd), and (d) Pd anti-site (PdAg). In the following figure, according to the Wagner-Schottky model, the defect formation enthalpy (Hd) in the Pd3Ag phases is calculated by the following Equation [35,36]:
where ΔHd and ΔHf represent the formation enthalpy of L12 Pd3Ag with and without a single point defect respectively, and Xd is the defect’s concentrations. It is well known that one possible selection criterion to describe stability is formation enthalpy. A lower formation enthalpy normally means a more stable structure and vice versa.
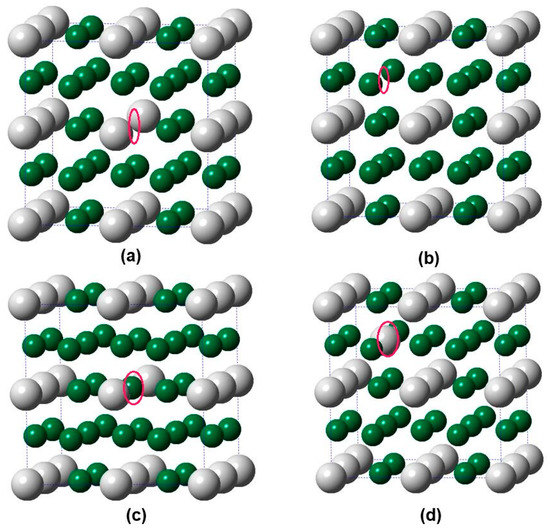
Figure 3.
Schematic illustrations of defective supercells (2 × 2 × 2) of L12 Pd3Ag containing a single point defect, (a) Ag vacancy (VAg), (b) Pd vacancy (VPd), (c) Ag anti-site (AgPd), and (d) Pd anti-site (PdAg). The big white and small green balls represent Ag and Pd atoms, respectively.
Table 2 lists structure, lattice constants (a), Ag percentage, and formation enthalpy (ΔHf) of Pd3Ag with and without a single point defect. The corresponding four kinds of defect formation enthalpy (Hd) were also derived and are listed for comparison. It can be clearly observed from this table that the PdAg phase could keep the original FCC structure in the presence of less than 25% of Ag, while a face-centered tetragonal (FCT) structure was obtained with more Ag atoms. It should be also noted that the calculated formation enthalpy of Pd3Ag was small and negative, as well as those of Pd25Ag7 (AgPd) and Pd23Ag9 (PdAg). More importantly, the values of defect formation enthalpies (Hd) of AgPd and PdAg were close to zero, which implies that the dominant single point defects were anti-site defects in the Pd3Ag phases. Additionally, the defect formation enthalpies of vacancy defects had positive and large values, suggesting that vacancy defects were difficult to form.
Table 2.
Structure, lattice constants (a), and formation enthalpy (ΔHf) of Pd3Ag with and without a single point defect. The corresponding four kinds of defect formation enthalpy (Hd) werealso derived and are listed for comparison.
We now discuss a little bit more about the effects of point defects on the solubility of H in Pd3Ag. Accordingly, Pd3Ag with AgPd and PdAg were selected to investigate H behavior. Figure 4 shows various interstitial sites of Pd3Ag with Pd and Ag anti-sites, and Table 3 lists the zero-point energy values of hydrogen (ZPE) and the binding energies (Eb) of the Pd25Ag7 and Pd23Ag9 phases. Several features could be deduced from Table 3 as well as from Table 1 and Figure 4.
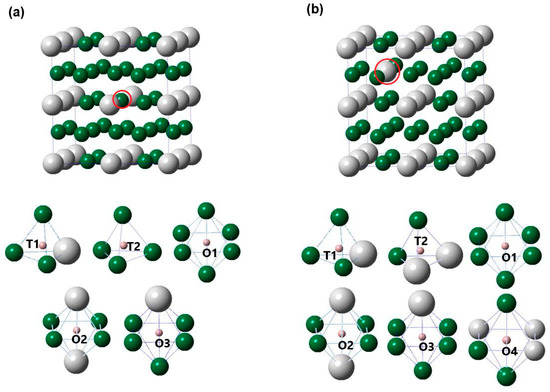
Figure 4.
Schematic illustrations of various interstitial sites of (a) Pd25Ag7 (AgPd) and (b) Pd23Ag9 (PdAg). The largest gray, second largest green, and third largest red balls represent Ag, Pd, and H atoms, respectively.
Table 3.
Zero-point energy of hydrogen (ZPE) and binding energies (Eb) of the Pd25Ag7 and Pd23Ag9 phases.
Firstly, it can be clearly seen from Figure 4 that, for the Pd25Ag7 and Pd23Ag9 phases, there were two kinds of T sites and different kinds of O sites, indicating that Ag and Pd anti-sites would lead to O sites with different surrounding atoms of Pd and Ag. Secondly, one notices in Table 3 that the value of Pd25Ag7H (O1) was lower than that of Pd25Ag7H (T1), Pd25Ag7H (T2), Pd25Ag7H (O2), and Pd25Ag7H (O3), and a similar phenomenon could be observed for Pd23Ag9H. Such a direct comparison suggests that anti-site defects had a negligible effect on the preferred location of H in Pd3Ag. Thirdly, for the Pd3Ag, Pd25Ag7 (AgPd), and Pd23Ag9 (PdAg) phases, the calculated Eb value (−0.227 eV) of Pd3AgH (O1) seemed lower and higher than its corresponding values at the O1 site of Pd (−0.196 eV) and at the Ag (−0.232 eV) anti-sites respectively, suggesting that anti-site defects had different effects on the thermodynamic stability of Pd3AgH. In addition, Figure 5 plots the solubility of hydrogen in the Pd3Ag, Pd25Ag7 (AgPd), and Pd23Ag9 (PdAg) phases. It can be observed from this Figure that H solubility in the Pd3AgH phases with and without point defects decreased in the following order: Pd3AgH → Pd25Ag7H → Pd23Ag9H, suggesting that anti-site defects would decrease hydrogen solubility in the Pd3Ag phases. Specifically, the solubility of hydrogen in the Pd3Ag phases would be severely decreased because of the appearance of a Pd anti-site. Considering the above effects of anti-site defects in the Pd3Ag phases, a useful suggestion for future experiments might be that Pd anti-sites should be prevented.
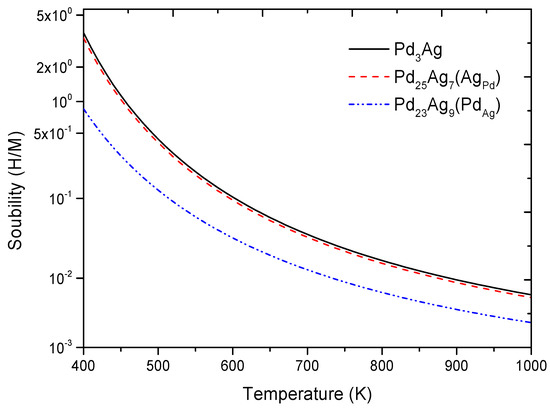
Figure 5.
Solubility of hydrogen in L12 Pd3Ag, Pd25Ag7 (AgPd), and Pd23Ag9 (PdAg) phases.
To understand the difference of H solubility, the charge density of H at all interstitial sites was considered and calculated. As another example, Figure 6 shows charge density plots of (a) Pd25Ag7 and (b) Pd23Ag9 with an H atom at the O1 site. The charge densities of H–Pd interactions in the Pd25Ag7 phases were denser than those in the Pd23Ag9 phases, which implies that the H atom formed a stronger bond in the O1 site of Pd25Ag7. Moreover, it can be observed from this Figure that the charge densities from H to Ag were sparse, suggesting a repulsive nature of the Ag–H bond. The results from this section also contribute to our understanding of the higher H solubility in Pd25Ag7 shown in Figure 5.
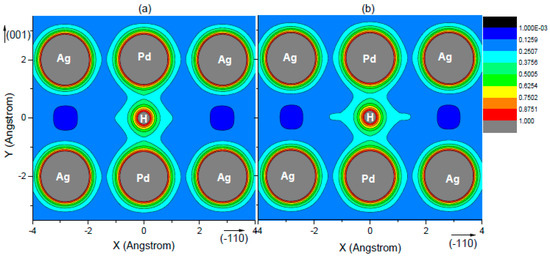
Figure 6.
Charge density plots of (a) Pd23Ag9 and (b) Pd25Ag7 with hydrogen atom at the O1 site; the charge density is expressed as e/Å3.
4. Conclusions
We performed a comparative first-principles calculation to examine the effects of point defects on hydrogen solubility in Pd3Ag. The defect formation enthalpies of Pd3Ag were first calculated and discussed, and it was found that the membrane possessed the perfect compact structure for hydrogen separation, as the vacancy defects were difficult to form. Our simulations also showed that in the Pd3Ag phase there was a slightly higher hydrogen solubility, and H presented the same preferred location as in pure Pd. In addition, a Pd anti-site (Hd = 0.086 eV) is more stable an Ag anti-site (Hd = −0.116 eV), thus suggesting that the favorable anti-site in the Pd3Ag phases was a Pd anti-site. The calculated results of H solubility in the Pd3AgH phases predicted that anti-site defects have different effects on the Pd3Ag phases, that is, Ag and Pd anti-sites have a neglected and an extremely negative effect on H solubility respectively. The calculated results not only agree well with similar experimental observations in the literature, but also provide a deep understanding of the fundamental effects of Ag on hydrogen solubility in Pd3Ag phases.
Author Contributions
Conceptualization, L.C. and Q.W.; methodology, L.C. and H.G.; software, L.C. and W.J.; validation, L.C., Q.W. and W.J.; formal analysis, L.C. and Q.W.; investigation, L.C.; resources, L.C.; data curation, L.C. and Q.W.; writing—original draft preparation, L.C.; writing—review and editing, L.C.; visualization, L.C.; supervision, L.C.; project administration, L.C. and Q.W.; funding acquisition, L.C. and W.J.
Funding
This research work was supported by the Youth Project of Science and Technology of Jiangxi Provincial Education Development (Grant No. GJJ160714), the Natural Science Foundation of Jiangxi Province (Grant No. 20171BAB216002), and the National Natural Science Foundation of China (Grant No. 11772145).
Conflicts of Interest
The authors declare no conflict of interest.
References
- Shu, J.; Grandjean, B.P.A.; Vanneste, A.; Kaliaguine, S. Catalytic palladium-based membrane reactors: A review. Can. J. Chem. Eng. 1991, 69, 1036–1060. [Google Scholar] [CrossRef]
- Timofeev, N.I.; Berseneva, F.N.; Makarov, V.M. New palladium-based membrane alloys for separation of gas mixtures to generate ultrapure hydrogen. Int. J. Hydrogen Energy 1994, 19, 895–898. [Google Scholar] [CrossRef]
- Tosti, S.; Bettinali, L.; Violante, V. Rolled thin Pd and Pd–Ag membranes for hydrogen separation and production. Int. J. Hydrog. Energy 2000, 25, 319–325. [Google Scholar] [CrossRef]
- Zea, H.; Lester, K.; Datye, A.K.; Rightor, E.; Gulotty, R.; Waterman, W.; Smith, M. The influence of Pd–Ag catalyst restructuring on the activation energy for ethylene hydrogenation in ethylene–acetylene mixtures. Appl. Catal. A 2005, 282, 237–245. [Google Scholar] [CrossRef]
- Shu, J.; Bongondo, B.E.W.; Grandjean, B.P.A.; Adnot, A.; Kaliaguine, S. Surface segregation of Pd-Ag membranes upon hydrogen permeation. Surf. Sci. 1993, 291, 129–138. [Google Scholar] [CrossRef]
- Peters, T.; Kaleta, T.; Stange, M.; Bredesen, R. Development of thin binary and ternary Pd-based alloy membranes for use in hydrogen production. J. Membr. Sci. 2011, 383, 124–134. [Google Scholar] [CrossRef]
- Pietrzak, R.; Szatanik, R.; Szuszkiewicz, M. Investigation of diffusion and electromigration of hydrogen in palladium and PdAg alloy. J. Aollys Compd. 1999, 282, 130–136. [Google Scholar] [CrossRef]
- Armor, J.N. Catalysis with permselective inorganic membranes. Appl. Catal. 1989, 49, 1–25. [Google Scholar] [CrossRef]
- Uemiya, S.; Matsuda, T.; Kikuchi, E. Hydrogen permeable palladium–silver alloy membrane supported on porous ceramics. J. Membr. Sci. 1991, 56, 315–325. [Google Scholar] [CrossRef]
- Gryaznov, V.M. Metal containing membranes for the production of ultrapure hydrogen and the recovery of hydrogen isotopes. Sep. Purif. Methods 2000, 29, 171–187. [Google Scholar] [CrossRef]
- Santos, R.B.; Rivelino, R.; Mota, F.B.; Gueorguiev, G.K. Exploring Hydrogenation and Fluorination in Curved 2D Carbon Systems: A Density Functional Theory Study on Corannulene. J. Phys. Chem. C 2012, 116, 9080–9087. [Google Scholar] [CrossRef]
- Georgieva, A.K.; Gueorguiev, G.K.; Stafström, S.; Hultman, L.; Janzén, E. AlGaInN metal-organic-chemical-vapor-deposition gas-phase chemistry in hydrogen and nitrogen diluents: First-principles calculations. Chem. Phys. Lett. 2007, 431, 346–351. [Google Scholar] [CrossRef]
- Wang, J.W.; Song, M.; He, Y.H.; Gong, H.R. Stability, adsorption, and diffusion of hydrogen in Pd3Ag phases. J. Membr. Sci. 2016, 503, 124–131. [Google Scholar] [CrossRef]
- Kurokawa, H.; Yakabe, H.; Yasuda, I.; Peters, T.; Bredesen, R. Inhibition effect of CO on hydrogen permeability of Pd-Ag membrane applied in a microchannel module configuration. Int. J. Hydrogen Energy 2014, 39, 17201–17209. [Google Scholar] [CrossRef]
- Amandusson, H.; Ekedahl, L.G.; Dannetun, H. Hydrogen permeation through surface modified Pd and PdAg membranes. J. Membr. Sci. 2001, 193, 35–47. [Google Scholar] [CrossRef]
- Chen, L.; Fan, J.L.; Song, M.; Gong, H.R. Structural stability and magnetic properties of WFeH phases. Int. J. Hydrogen Energy 2016, 41, 13093–13100. [Google Scholar] [CrossRef]
- Liang, C.P.; Gong, H.R. Atomic structure, mechanical quality, and thermodynamic property of TiHx phases. J. Appl. Phys. 2013, 114, 043510. [Google Scholar] [CrossRef]
- Kresse, G.; Joubert, J. From ultrasoft pseudopotentials to the projector augmented-wave method. Phys. Rev. B 1999, 59, 1758–1775. [Google Scholar] [CrossRef]
- Wang, Q.; Chen, L.; Xiong, L.; Gong, H.R. Mechanical and thermodynamic properties of cubic boron nitride from ab initio calculation. J. Phys. Chem. Solids 2017, 104, 276–280. [Google Scholar] [CrossRef]
- Chen, L.; Wang, Q.; Xiong, L.; Gong, H.R. First-principles calculations of hydrogen in perfect WFe and WFeNb crystals. Solid State Commun. 2017, 249, 24–29. [Google Scholar] [CrossRef]
- Liu, L.C.; Wang, J.W.; He, Y.H.; Gong, H.R. Solubility, diffusivity, and permeability of hydrogen at PdCu phases. J. Membr. Sci. 2017, 542, 24–30. [Google Scholar] [CrossRef]
- Chen, L.; Wang, Q.; Xiong, L.; Gong, H.R. Computationally predicted fundamental behaviors of embedded hydrogen at TiC/W interfaces. Int. J. Hydrogen Energy 2018, 43, 16180–16186. [Google Scholar] [CrossRef]
- Wolf, R.J.; Mansour, K.A.; Lee, M.W.; Ray, J.R. Temperature dependence of elastic constants of embedded-atom models of palladium. Phys. Rev. B 1992, 46, 8027–8035. [Google Scholar] [CrossRef]
- Fowler, R.H.; Smithells, C.J. A theoretical formula for the solubility of hydrogen in metals. Proc. R. Soc. Lond. Ser. A 1937, 160, 37–47. [Google Scholar]
- Sonwane, C.G.; Wilcox, J.; Ma, Y.H. Solubility of Hydrogen in PdAg and PdAu Binary Alloys Using Density Functional Theory. J. Phys. Chem. B 2006, 110, 24549–24558. [Google Scholar] [CrossRef] [PubMed]
- Rowe, J.M.; Rush, J.J.; De, G.L.A.; Ferguson, G.A. Neutron quasielastic scattering study of hydrogen diffusion in a single crystal of palladium. Phys. Rev. Lett. 1972, 29, 1250–1253. [Google Scholar] [CrossRef]
- Yoshihara, M.; McLellan, R.B. Thermodynamics of Pd-Cu-H solid solutions. Acta Metall. 1983, 31, 61–68. [Google Scholar] [CrossRef]
- Kamakoti, P.; Morreale, B.D.; Ciocco, M.V.; Howard, B.H.; Killmeyer, R.P.; Cugini, A.V.; Sholl, D.S. Prediction of Hydrogen Flux Through Sulfur-Tolerant Binary Alloy Membranes. Science 2005, 307, 569–573. [Google Scholar] [CrossRef]
- Knapton, A.G. Palladium alloys for hydrogen diffusion membranes. Platinum Met. Rev. 1977, 21, 44–50. [Google Scholar]
- Graham, T. On the relation of hydrogen to palladium. Proc. R. Soc. Lond. 1869, 17, 212–220. [Google Scholar] [CrossRef]
- Uemiya, S. State-of-the-art of supported metal membranes for gas separation. Sep. Purif. Methods 1999, 28, 51–85. [Google Scholar] [CrossRef]
- Zhang, Y.; Ozaki, T.; Komaki, M.; Nishimura, C. Hydrogen permeation characteristics of V–15Ni membrane with Pd/Ag overlayer by sputtering. J. Alloys Compd. 2003, 356–357, 553–556. [Google Scholar] [CrossRef]
- Tang, W.; Sanville, E.; Henkelman, G. A grid-based Bader analysis algorithm without lattice bias. J. Phys. Condens. Matter 2009, 21, 084204. [Google Scholar] [CrossRef] [PubMed]
- Sanville, E.; Kenny, S.D.; Smith, R.; Henkelman, G. An improved grid-based algorithm for Bader charge allocation. J. Comput. Chem. 2007, 28, 899–908. [Google Scholar] [CrossRef] [PubMed]
- Chen, L.; Wang, Q.; Xiong, L.; Gong, H.R. Mechanical properties and point defects of MC (M = Ti, Zr) from first-principles calculation. J. Alloys Compd. 2018, 747, 972–977. [Google Scholar] [CrossRef]
- Zhang, C.M.; Jiang, Y.; Yin, D.F.; Tan, H.J.; Sun, S.P.; Yao, J.G. Effects of point defect concentrations on elastic properties of off-stoichiometric L12-type A13Sc. Acta Phys. Sin. 2016, 65, 076101. [Google Scholar]
© 2019 by the authors. Licensee MDPI, Basel, Switzerland. This article is an open access article distributed under the terms and conditions of the Creative Commons Attribution (CC BY) license (http://creativecommons.org/licenses/by/4.0/).