Article

The Application of DIC Technique to Evaluate Residual Tensile Strength of Aluminum Alloy Plates with Multi-Site Damage of Collinear and Non-Collinear Cracks

1
Sino-European Institute of Aviation Engineering, Civil Aviation University of China, Tianjin 300300, China
2
Beijing Ruituo Technology Co., Ltd, Beijing 100020, China
*
Author to whom correspondence should be addressed.
Metals 2019, 9(2), 118; https://doi.org/10.3390/met9020118
Submission received: 18 December 2018 / Revised: 20 January 2019 / Accepted: 22 January 2019 / Published: 23 January 2019
(This article belongs to the Special Issue Quasi-Static and Dynamic Testing of Metallic Materials)

Abstract

:
This paper introduces an aviation industrial application of digital image correlation (DIC) technique on the measurement of residual tensile strength (RTS). In order to investigate multi-site damage (MSD) that is common in the fuselage of aging aircraft, RTS of 2024-T4 aluminum alloy sheet with MSD was evaluated using DIC technique. Firstly, the four-factor and three-level orthogonal experiment was designed to optimize the DIC method to control the strain calculation error by considering subset size, interpolation tap, calibration score and step size. Secondly, RTS and strain fields were generated to analyze the path of crack propagation. The results show the optimal factor combination is 0.018 of calibration score, 23 pixels of subset size, step size is 1/4 of subset size and the filter size of interpolation calibration is 8 pixels. With the increase of spacing between adjacent holes, the RTS increases and the collinear cracked specimen becomes more perilous than that of non-collinear cracked while the hole spacing is 25 mm from the statistical analysis. Based on the Net section yield criterion, the RTS was calculated, which can give a conservative prediction of RTS.

Graphical Abstract

1. Introduction

2024-T4 aluminum alloy is highly attractive for mechanical properties such as high strength ratio, low density, machining, plastic forming and brilliant heat performance [1,2,3]. These properties have led to its extensive use in aircraft components and structures that undergo loading, including the fuselage, airframe, wing ribs and scar. Multi-site damage (MSD) is a special kind of failure that is commonly found in aging aircraft structures, it leads people to realize what is called the aging aircraft problem, which has developed into the main concern for research on airframe strength [4]. Experiments revealed that the design of the fuselage may affect the ultimate failure type of longitudinal lap joints in the case of MSD [5,6,7,8]. The effects of overloading, under-loading and bending on MSD were examined. Overloading extended effectively the fatigue life of riveted joints with a constant amplitude while bending and under-loading had a significant reduction of mechanical performances on the MSD structures of the fuselage [9]. Compared with a single crack, the prediction of MSD crack propagation was much more interesting and challenging because of the number of cracks and complex features [10,11,12].
As a non-contact and whole field measurement method, 3D DIC (3D digital image correlation) is widely used for testing the mechanical behaviors of different kinds of materials in varies fields [13,14]. By comparing the changes of random speckle pattern covered on the specimen before and after deformation, DIC can provide full-field strains and displacements with sub-pixel accuracy. In comparison with other optical measurement methods, it has the following advantages including simple optical path, automation, anti-interference, and strong universality [15]. However, it has problems in the process of application, i.e., the accuracy of measurement is uncertain. The sources of error are (1) image pollution, such as dust on the camera sensor, which leads the local displacement deviation; (2) speckle quality, the characteristics of non-repetitive, isotropic and high contrast are important for good correlation of images. The surface speckle as a carrier of deformation information has an important influence on image recognition, tracking and calculation precision [16,17]; (3) test parameters of DIC, the selection of parameters such as speckle quality parameters and image acquisition system parameters is crucial and improper choice of the parameters can cause noise [18,19]; (4) the effect of environmental factors, including the high temperature application condition [20,21].
The DIC technique has been applied to the characterization of mechanical properties under the condition of quasi-static tensile loading. Robert [19] conducted four-point bending and tensile tests on a fiber reinforced refractory castable and the DIC results were better than using the measurements of classical beam detection that demonstrated the ability to determine Young’s modulus from heterogeneous strain fields. Orteu [22] investigated the tensile mechanical behavior of ceramic refractories reinforced with metallic fibers and correlated a micro-mechanical model with macro-mechanical results. Xie [23] evaluated the aluminum edge stretching limit using DIC. The average edge stretch thinning limits showed a consistent increasing trend as the pre-stretch strain increased. Wang [24] carried out tensile tests on three kinds of soft materials by employing the DIC method. It was found that satisfactory accuracy and measurement range can be obtained. Härtel [25] analyzed the plastic deformation behavior during tensile testing of 2017 aluminum alloy characterized by DIC and acoustic emission. The combination of these two methods could provide detailed information on nucleation events and on the propagation of individual deformation band.
The residual tensile strength of structures containing various damage is a significant issue in aviation industries. Some results in previous works have been obtained and applied. Wang [26] analyzed the ultimate strength of 2024-T3 in the case of a lead crack with one or two random cracks nearby, which has shown that the existence of small disturbing cracks reduces RTS with respect to the plate with a single crack. Moreover, the RTS of unstiffened 2024-T3 panels containing multiple site damage was investigated by Cherry [27], and the ligament yield failure criteria was evaluated to give a more accurate prediction of the panels with MSD damage. Xu [28] has proposed a unified method based on the weight function to solve the RTS problem for collinear cracks in 2024-T3 aluminum alloy sheets, which was able to predict the RTS within 9% error compared to the test results. Smith [29] has modified the linkup model to predict the RTS of 2024-T3 panels with MSD in two different thicknesses, while the results gave a conservative prediction for the specimens with short ligaments and non-conservative estimation for those with long ligaments.
Currently, most researchers on the MSD problem have mainly paid attention to collinear cracks under quasi-static or cyclic loadings, while few studies have focused on non-collinear cracks, many of which were supported by theoretical calculation or experimental tests [30]. In this paper, the DIC technique and tensile test were performed to investigate the influence of strain calculation precision of DIC as well as the spacing between adjacent holes on the RTS of 2024-T4 aluminum alloy plates with MSD. Tensile tests provided a clear and simple comparison while the field of strain obtained from DIC revealed the crack propagation state. Furthermore, computation of RTS was carried out based on the Net section yield criterion [27] to validate and correlate with the previous results.

2. Experimental Program

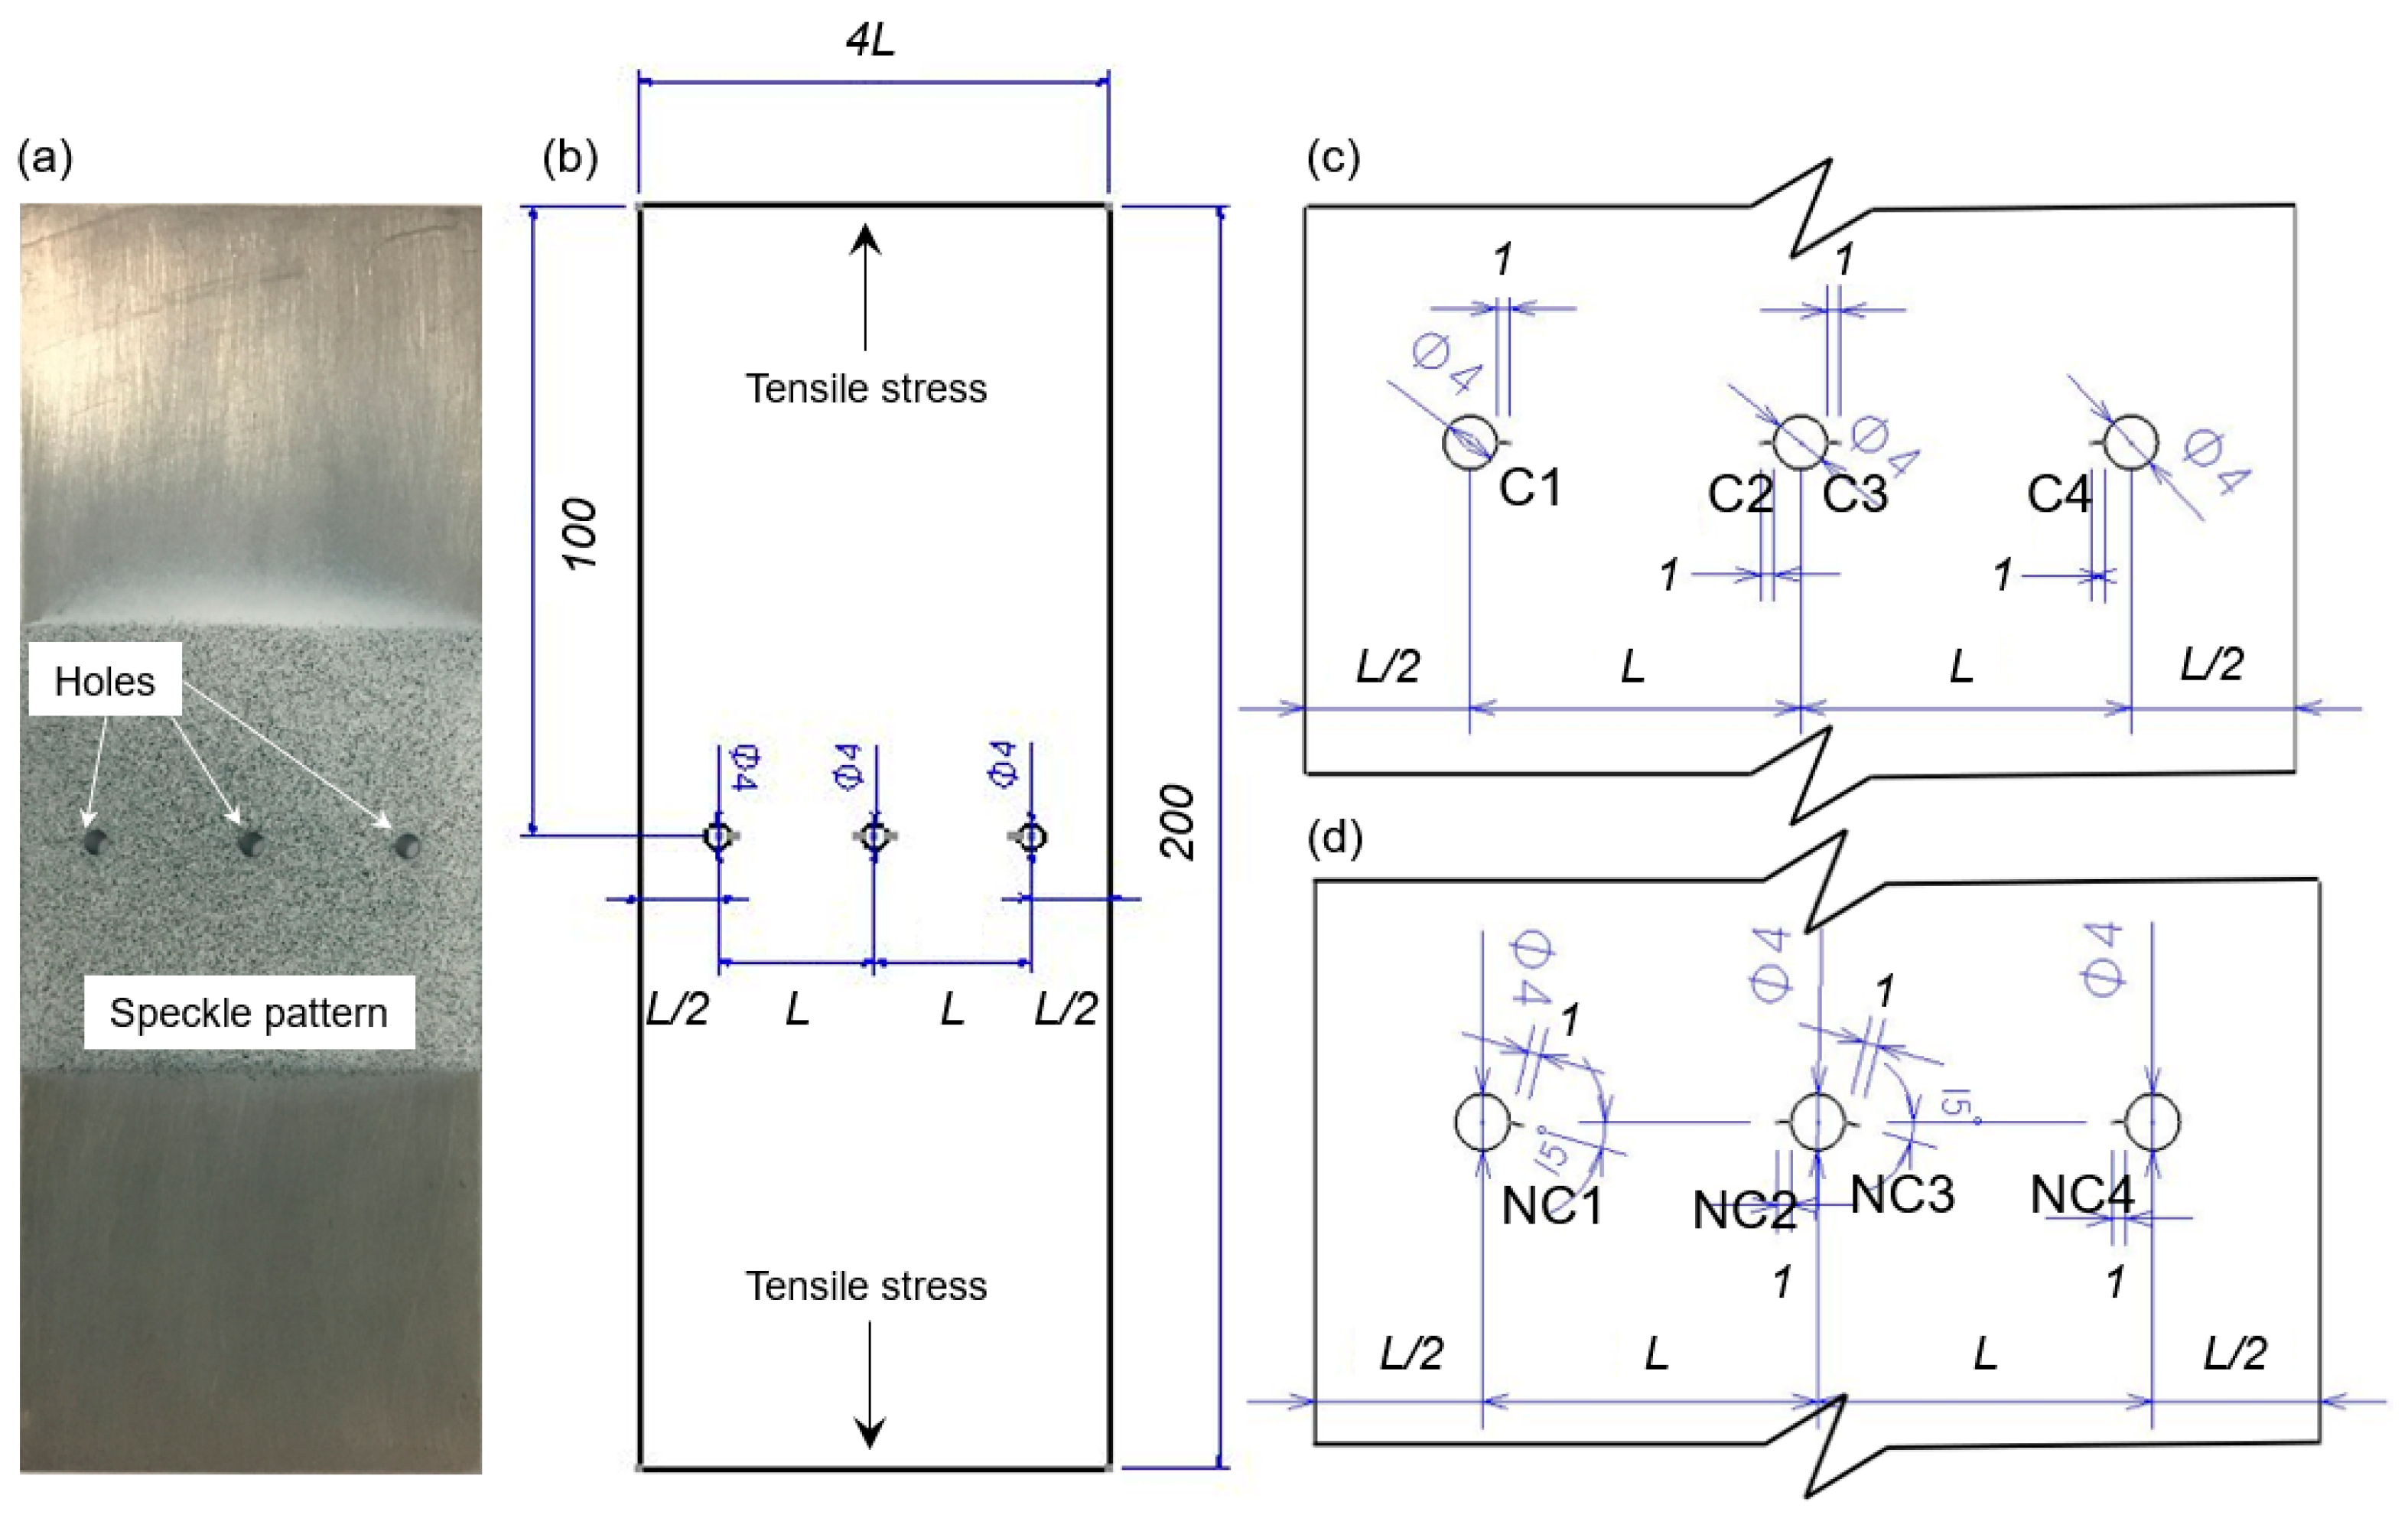
2.1. Material and Specimens

In the present research, the specimens were machined from 2024-T4 aluminum alloy which is supplied in the form of 2 mm-thick sheets, with the Young’s modulus of 71 GPa, the yield strength of 305 MPa, the ultimate tensile strength of 456 MPa, the Poisson ratio of 0.33 and the average grain size of 25 μm on which crack propagation strongly depends [31]. MSD cracks typically are found on the upper row rivets along the lap joints of aging aircraft, as this position experiences the highest level of stress in service [32]. Therefore, tensile tests were conducted on the sheets having one row of rivet holes; linear cutting specimens were sized the same as those used in Reference [33] with a hole diameter of 4 mm. The spacing between adjacent holes L should be 4 to 8 times the hole diameter on the basis of relevant manuals. In the current investigation, its impact on RTS was studied when L varied among 21, 25, and 29 mm; the distance between the hole and edge of the specimen, which contains three holes in each row is half of L. In order to simulate invisible cracks during the maintenance process which were covered by rivet heads and the effect of cracks between holes, four cracks were precut to 1 mm on the edges of holes by the same wire-electrode cutting without grind as illustrated in Figure 1.
To investigate the impact of the inter-crack angle, two different types of cracks were prepared. One was the collinear cracks with four paralleled cracks, the other was the non-collinear cracks with the inter-crack angle of 15 degrees [34]. The angle and positions of the cracks are presented in Figure 1. In the following parts, CC represents the collinear cracked specimens while NCC represents the non-collinear cracked specimens.

2.2. Experimental Methods

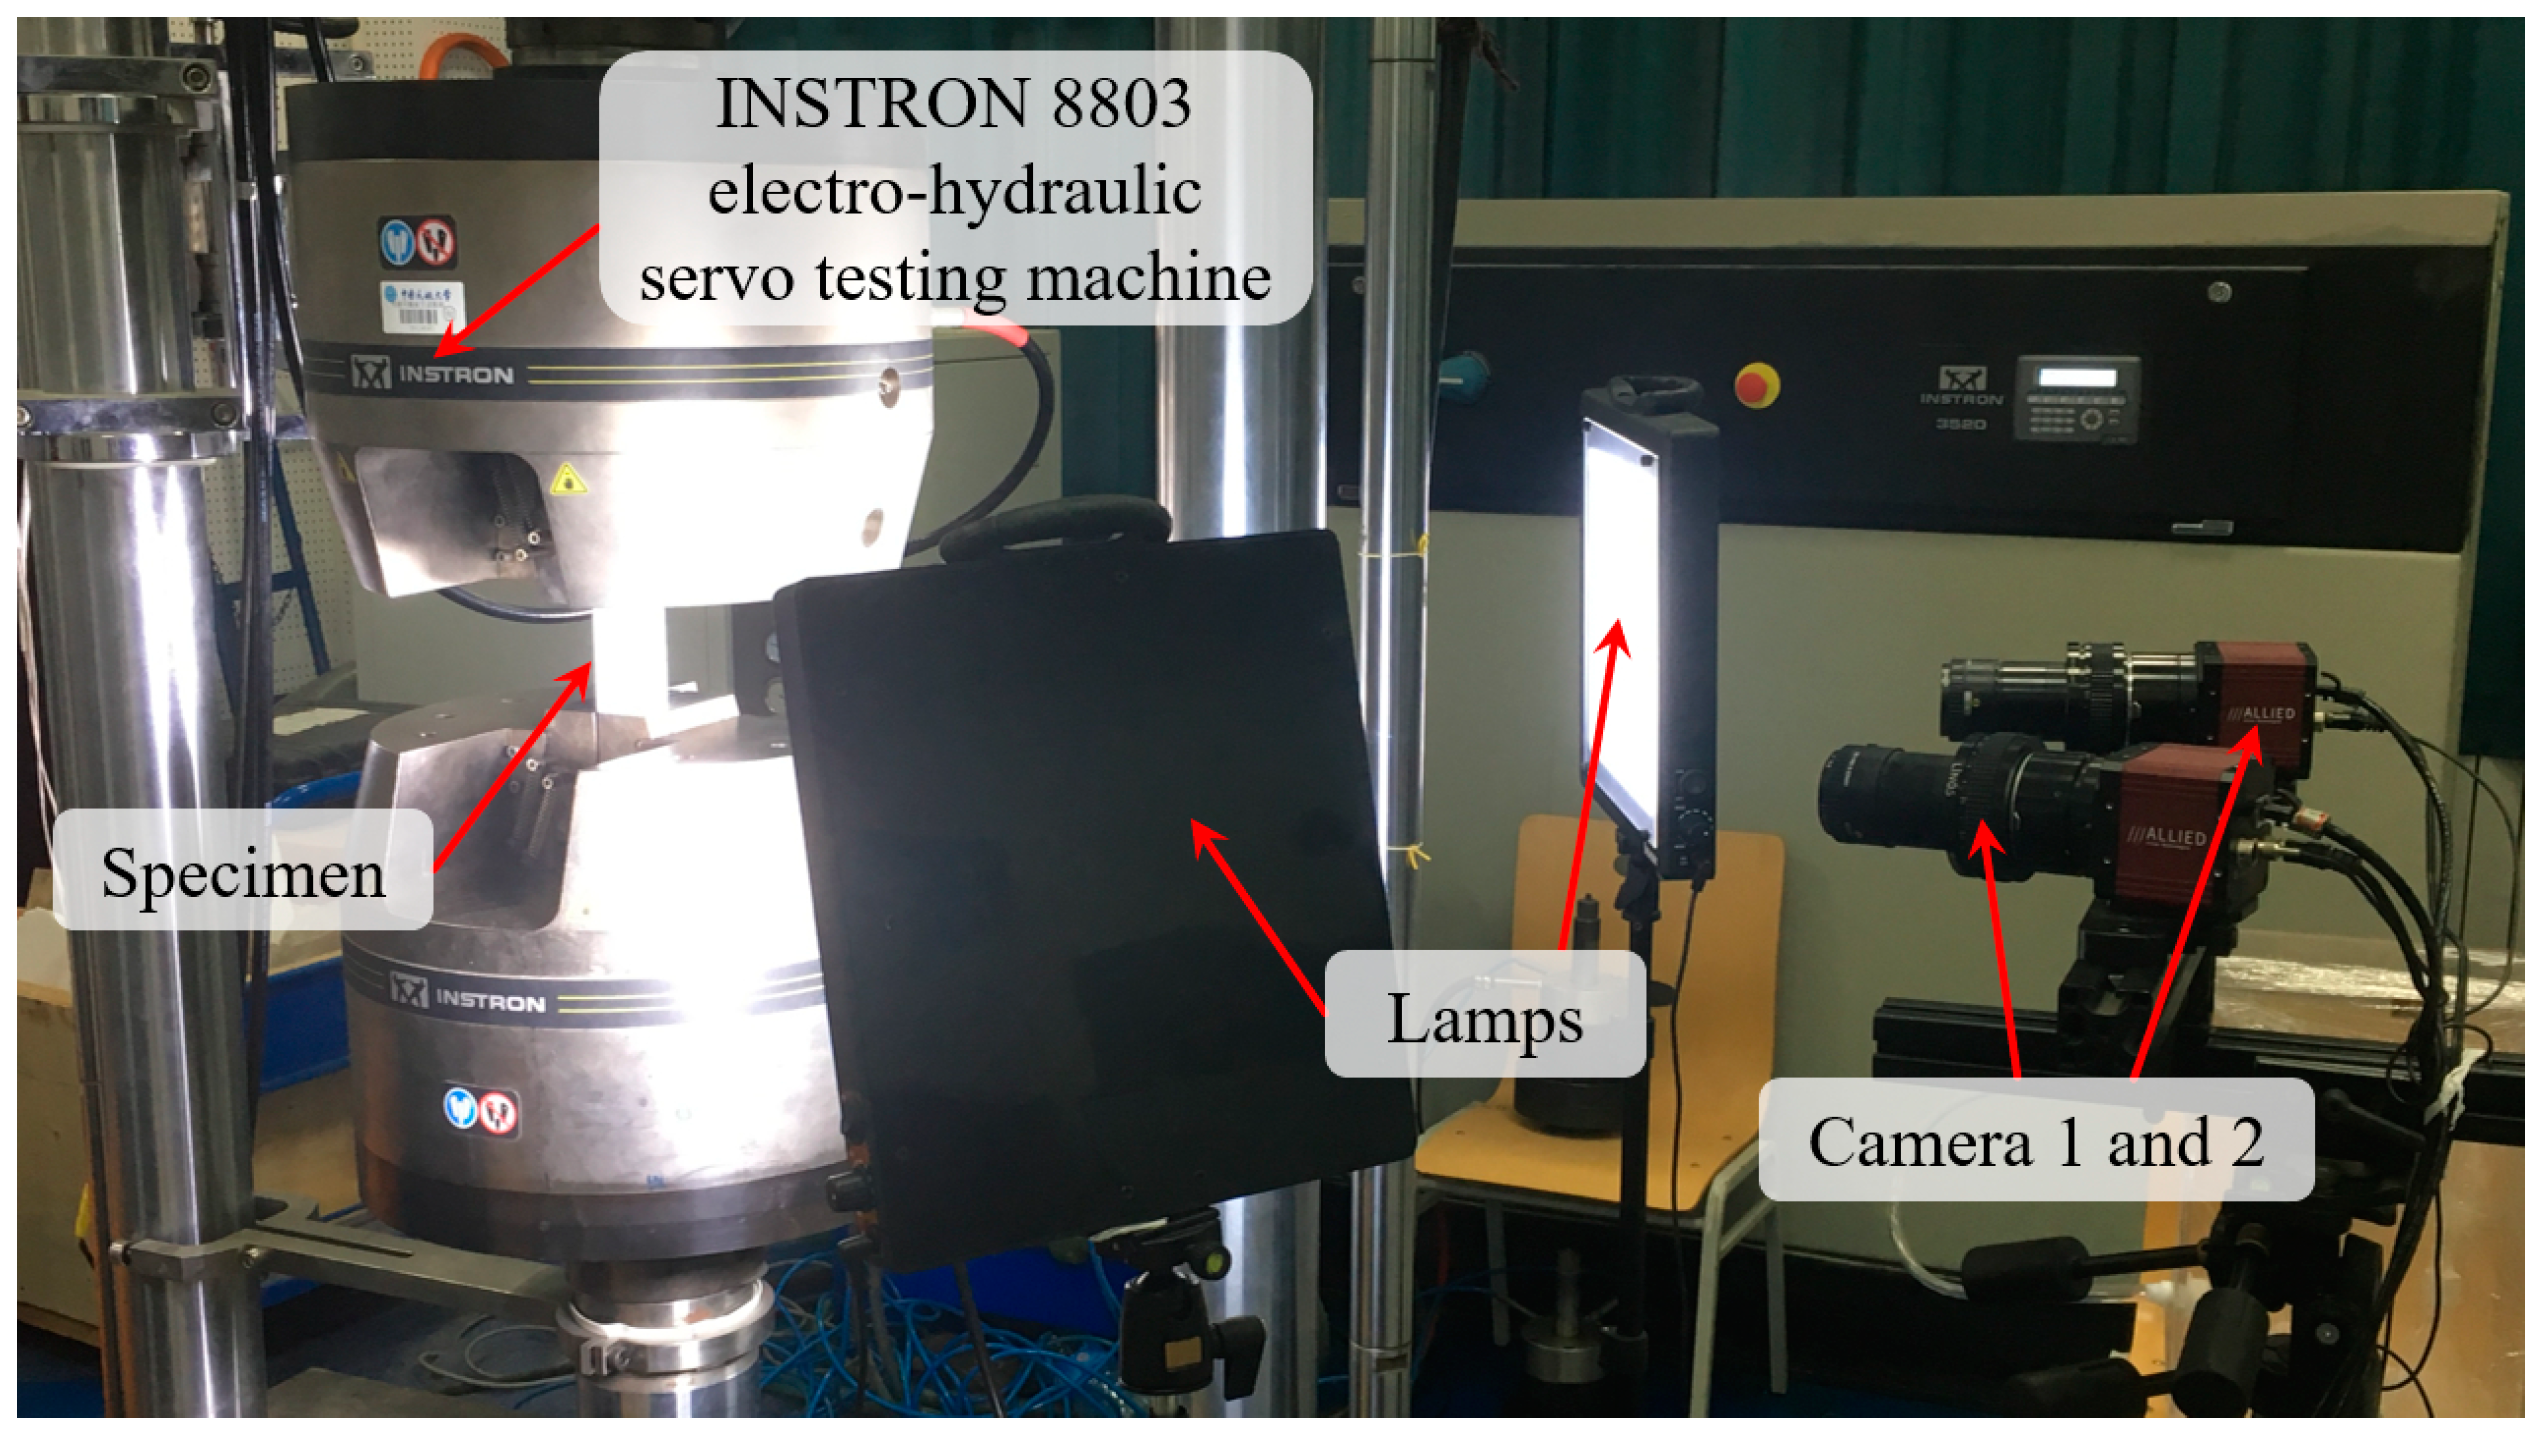
2.2.1. Tensile Testing

The tensile tests were conducted in air, under the condition of displacement control, using the Instron 8803 testing machine (Instron, Boston, MA, USA), the orientation of the tensile loading was vertical to the rolling direction of the specimen with a constant strain rate of 8.3 × 10⁻⁵ s−1. For each type of condition, three parallel tests were performed to acquire the distribution of RTS. The propagation of cracks was observed in real time. VIC-3D is a software developed by Correlated Solutions, Inc. (Columbia, SC, USA), and it was used to calculate the surface displacement and strain fields based on the images taken during the tensile tests.

2.2.2. DIC Analysis

The interest regions on the specimen were coated with a thin-layered white painting, then sprayed randomly with black speckles in appropriate sizes to obtain the pattern with random speckles (Figure 1a) required for DIC analysis. The 3D DIC system was calibrated to determine the positions of the cameras using a standard 10 × 14 dots calibration grid with a 7 mm pitch before starting the test. The relative angle of the cameras placed in front of the sample was approximately 25 degrees and the aperture was 5.6 to 8 in an object plane with a spatial image resolution of 4278 pixels × 3248 pixels. The experimental setup is illustrated in Figure 2.

2.3. Orthogonal Experiment Based on Strain Calculation Error

The orthogonal experiment, including four factors and three levels [35,36,37], was applied to analyze the influential degree of factors on the strain calculation precision, which are calibration score, subset size, step size and interpolation tap. Moreover, each factor has three levels which are shown in Table 1. To obtain the strain error, two images without deformation before loading were acquired, one is the reference image in DIC analysis and the other is used to calculate the strain error.

3. Results and Discussion

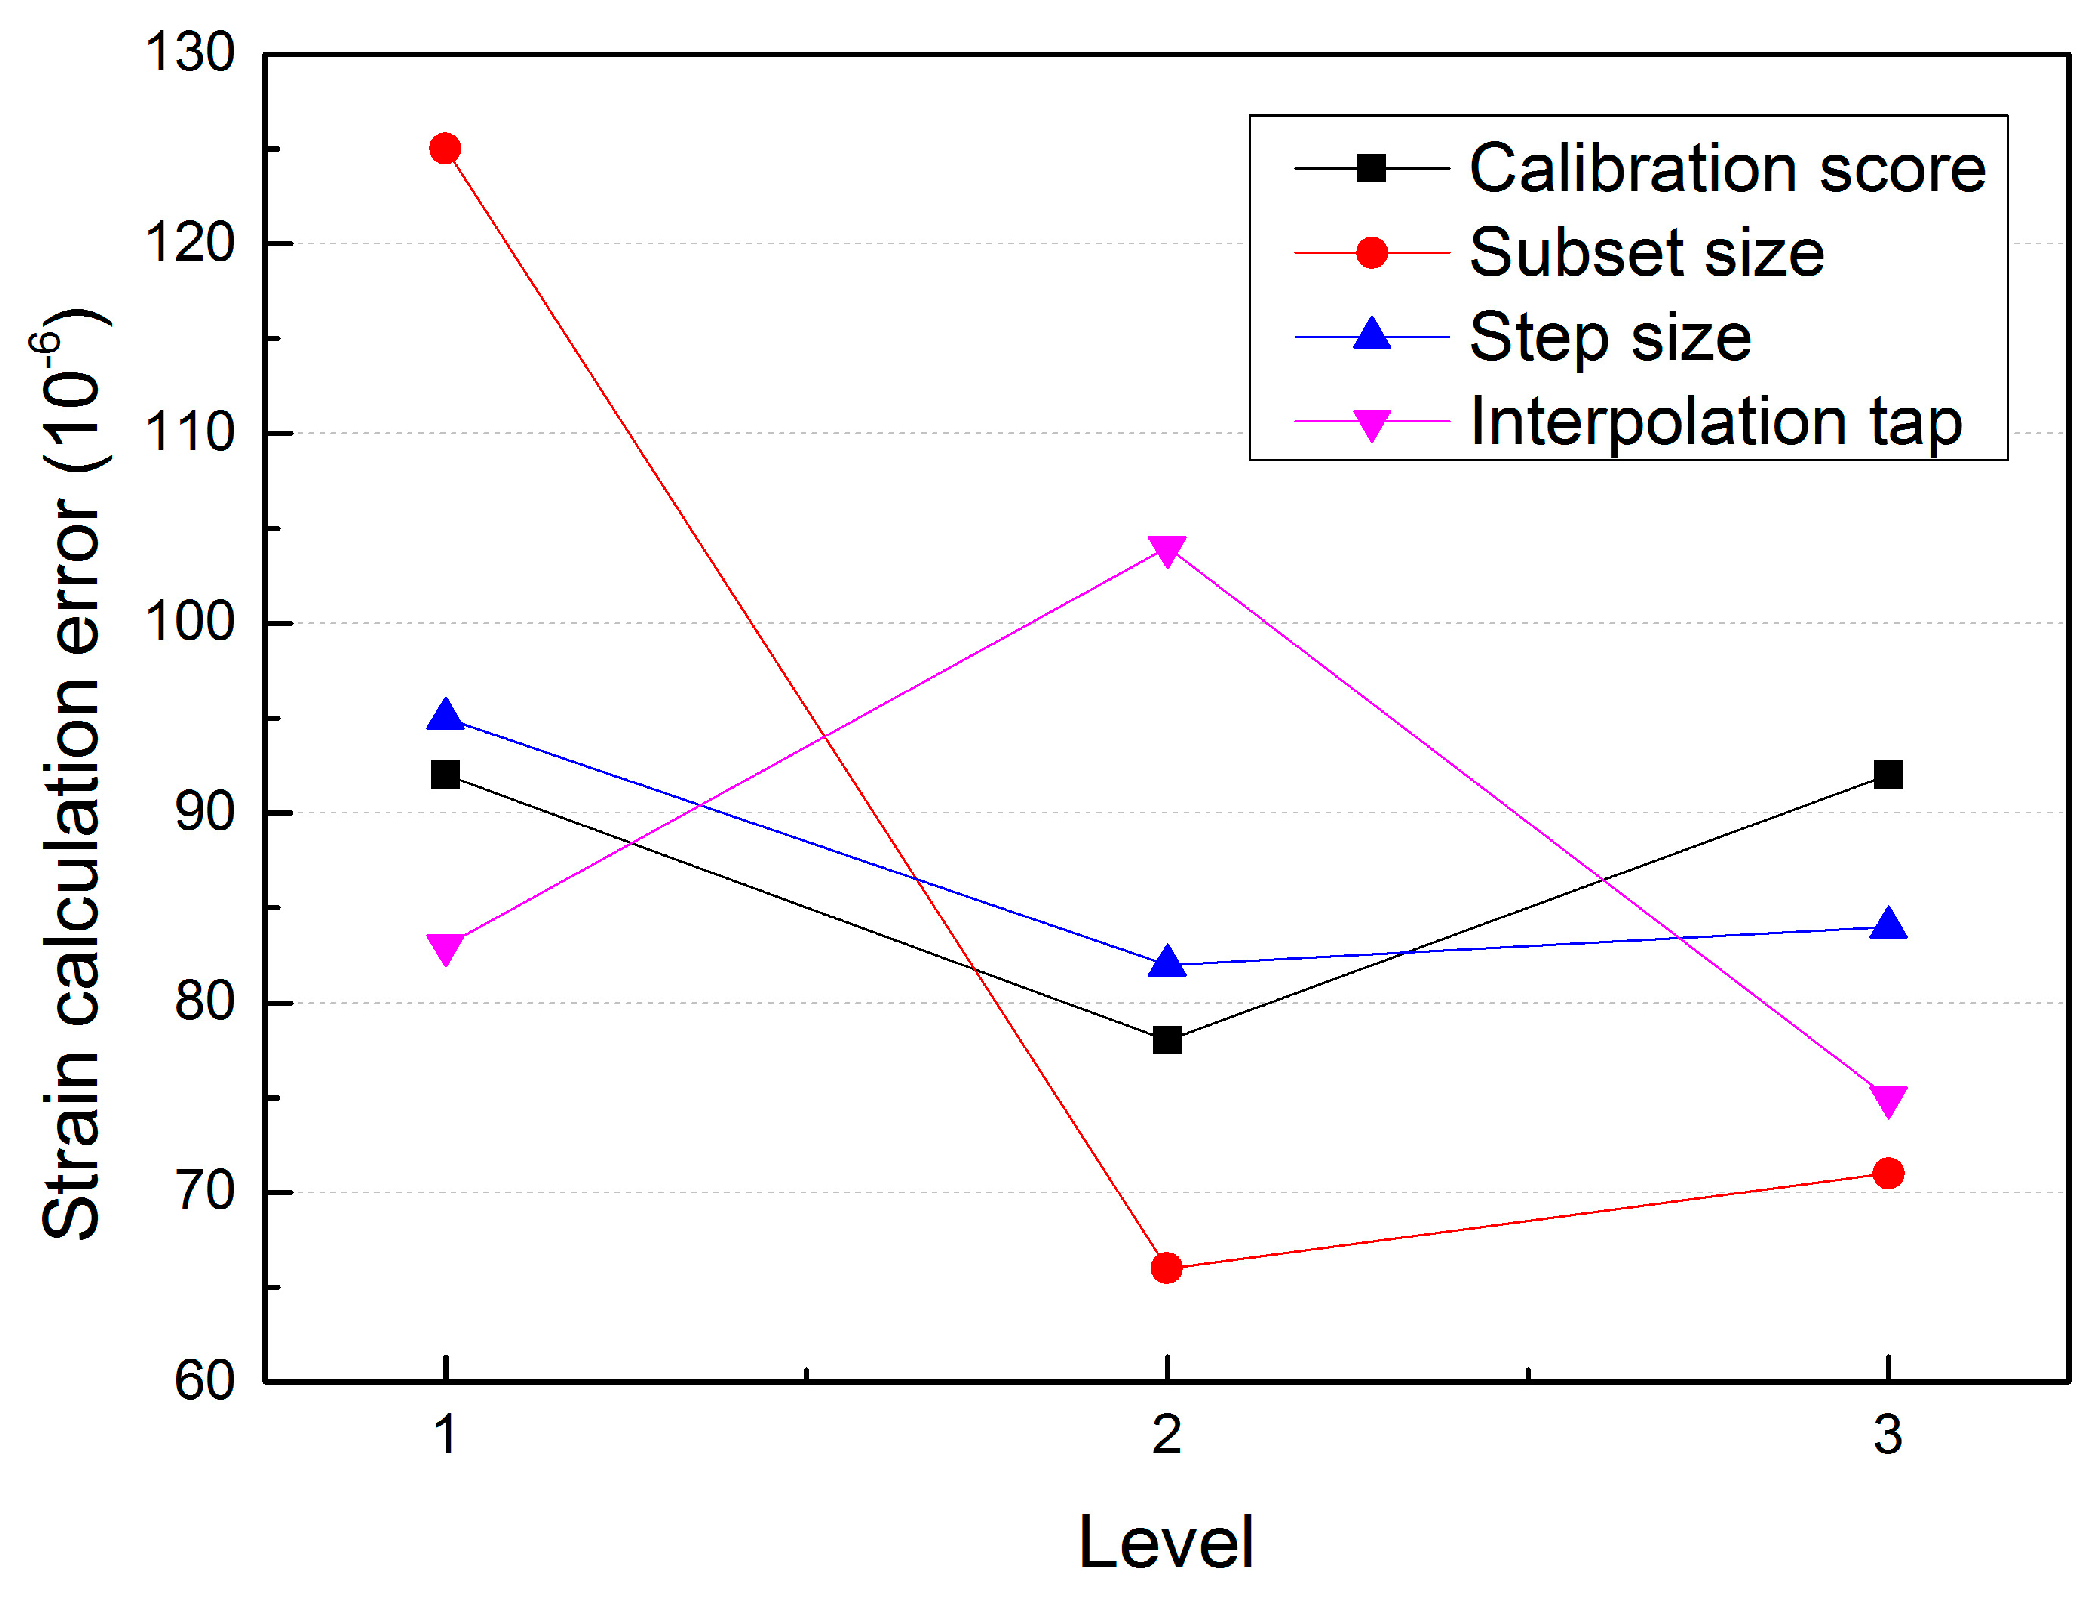
3.1. Orthogonal Experiment

The orthogonal experimental results and range analysis of the strain calculation precision are summarized in Table 2 and Table 3. The items were calculated by Equations (1)–(3). “Kx” is the summation of the average RTS for level “x” which ranged from 1 to 3 under the respective factors here. The “kx” is the average value of “Kx”. “Δk” is the difference value between the maximum and minimum of “kx”. Furthermore, “Δk” represents the influential degree of different factors. “zx” is the average RTS of the specimens under the level “x”. “w” is the number of levels, in this paper, “w” equals to 3. “kmax” and “kmin” are the maximum and minimum values of “kx” respectively. According to the calculation results, a conclusion was obtained that the influential order of relevant factors for RTS is: subset size > interpolation tap > calibration score > step size. The optimal factor combination within our parameters was 0.018 of calibration score, 23 pixels of subset size, step size was 1/4 of subset size, filter size of interpolation calibration was 8 pixels. The optimal factor combination was used to analyze the strain error in the subsequent DIC analysis for the RTS of the MSD specimens, the strain error was 35 micro-strains, which was better than the other factor combinations.
K x = z x
k x = K x w
k = k max k min
According to the diagram shown as Figure 3, when the calibration score was 0.018, the calculated strain error was lower than that of 0.106 and 0.012. This result is consistent with the influence of the calibration score to the error of the camera parameters. It shows that the lower calibration score does not cause the smaller strain error. In order to achieve a good calibration result, both the lower calibration score and sufficient calibration information need to be satisfied. When the calibration score was lower than a certain degree, the cost of reducing the calibration score was to delete a large number of calibration images, which will lead to an increase of strain error because of lack of calibration information. The optimal level of the three subset levels was 23 pixels (about 5 times the speckle size). The bigger subset size is, the more information is contained in a single subset and the correlation match is better between the subsets. However, the strain should be calculated based on the subset size and step size simultaneously. When the step size is fixed, increasing the subset size will make the data involved in the DIC analysis squarely reduction and if the subset size is too large, it will increase the interpolation calculation error which is to increase the strain error. Therefore, it is necessary to balance the matching accuracy and the amount of calculation data. The optimal level of step size within our parameters was the second level (1/4 subset size), which is consistent with the previous relationship between the step size and correlation match.
The accuracy of the DIC calculation is largely determined by the phase accuracy of the interpolation filter, which is used to reconstruct gray values at non-integer positions. As the gray values obtained by interpolation are the approximate values between pixels, which will introduce calculation results error during matching algorithm, accordingly, it is important to employ a suitable interpolation method. The cubic polynomial interpolation method is obviously not suitable for DIC due to introducing errors. The minimization process of Equation (4) [38] was accomplished to minimize the difference between the ideal transfer function and the transfer function of the interpolation filter. Under the same filter coefficients, the amplitude and phase errors of the B-spline interpolation method are much lower than the cubic polynomial interpolation method. Based on the B-spline transformation, better results can be achieved by integrating recursive prefilters [39,40]. Moreover, a weighting function f(k) was used, which allowed some flexibility in selecting the wave number range for which the filters were optimized. It has been used to support the filters of 4, 6 and 8 pixels separately. In this paper, it was most effective to improve the strain accuracy by using the optimized tap value before interpolation to calculate strain.
0.5 0.5 0 1 f ( k ) | h ( ε , k ) h ideal ( ε , k ) | 2 d ε d k     min
where h is the transfer function of the interpolation filter, hideal is the ideal transfer function and f(k) is the weighting function.

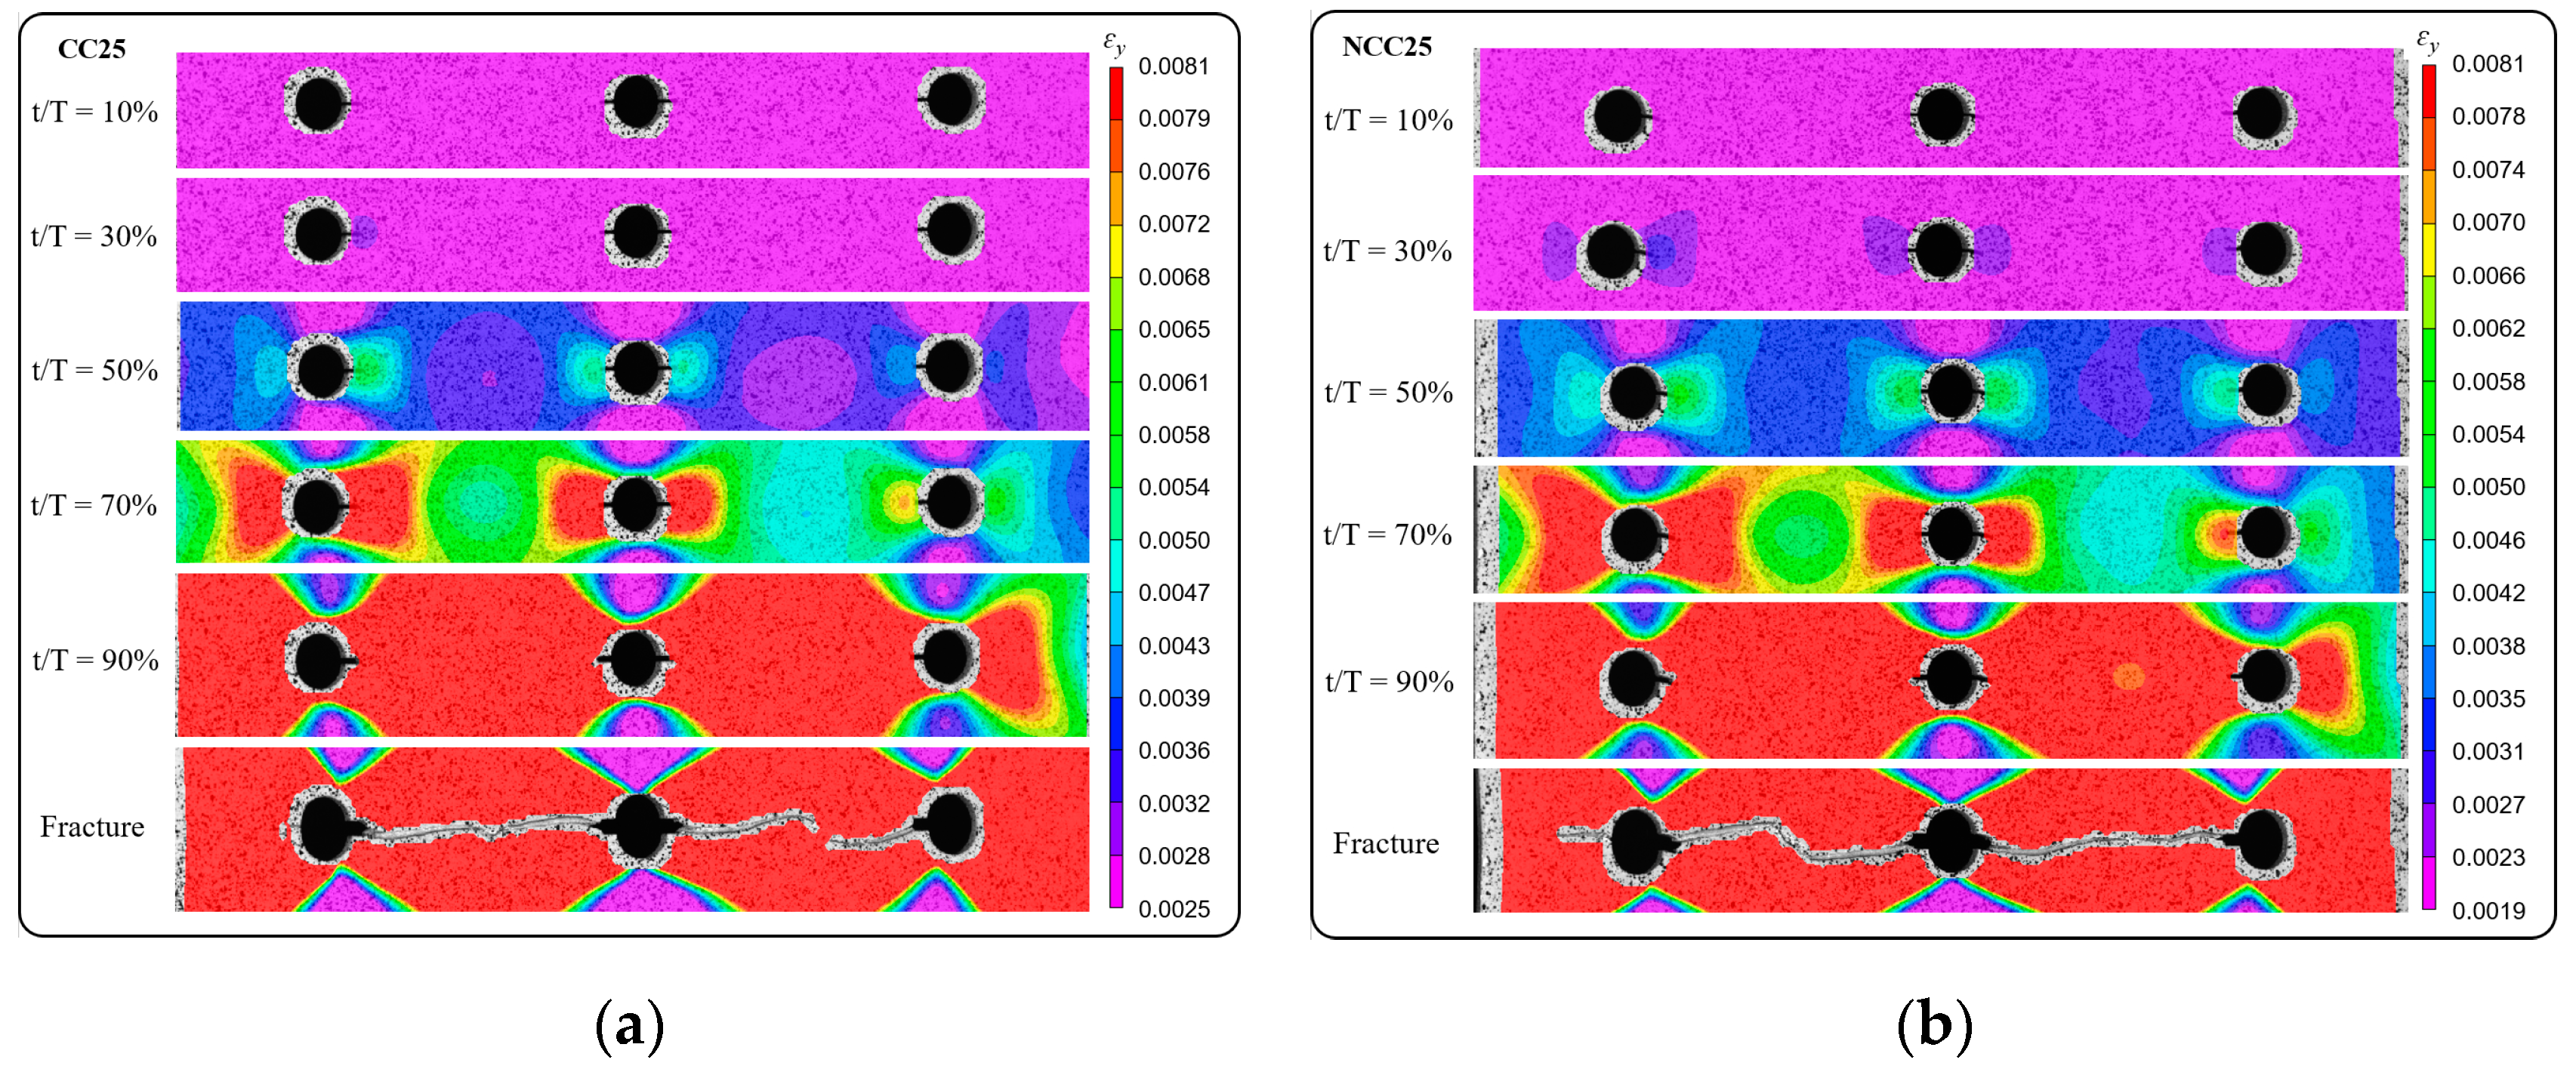
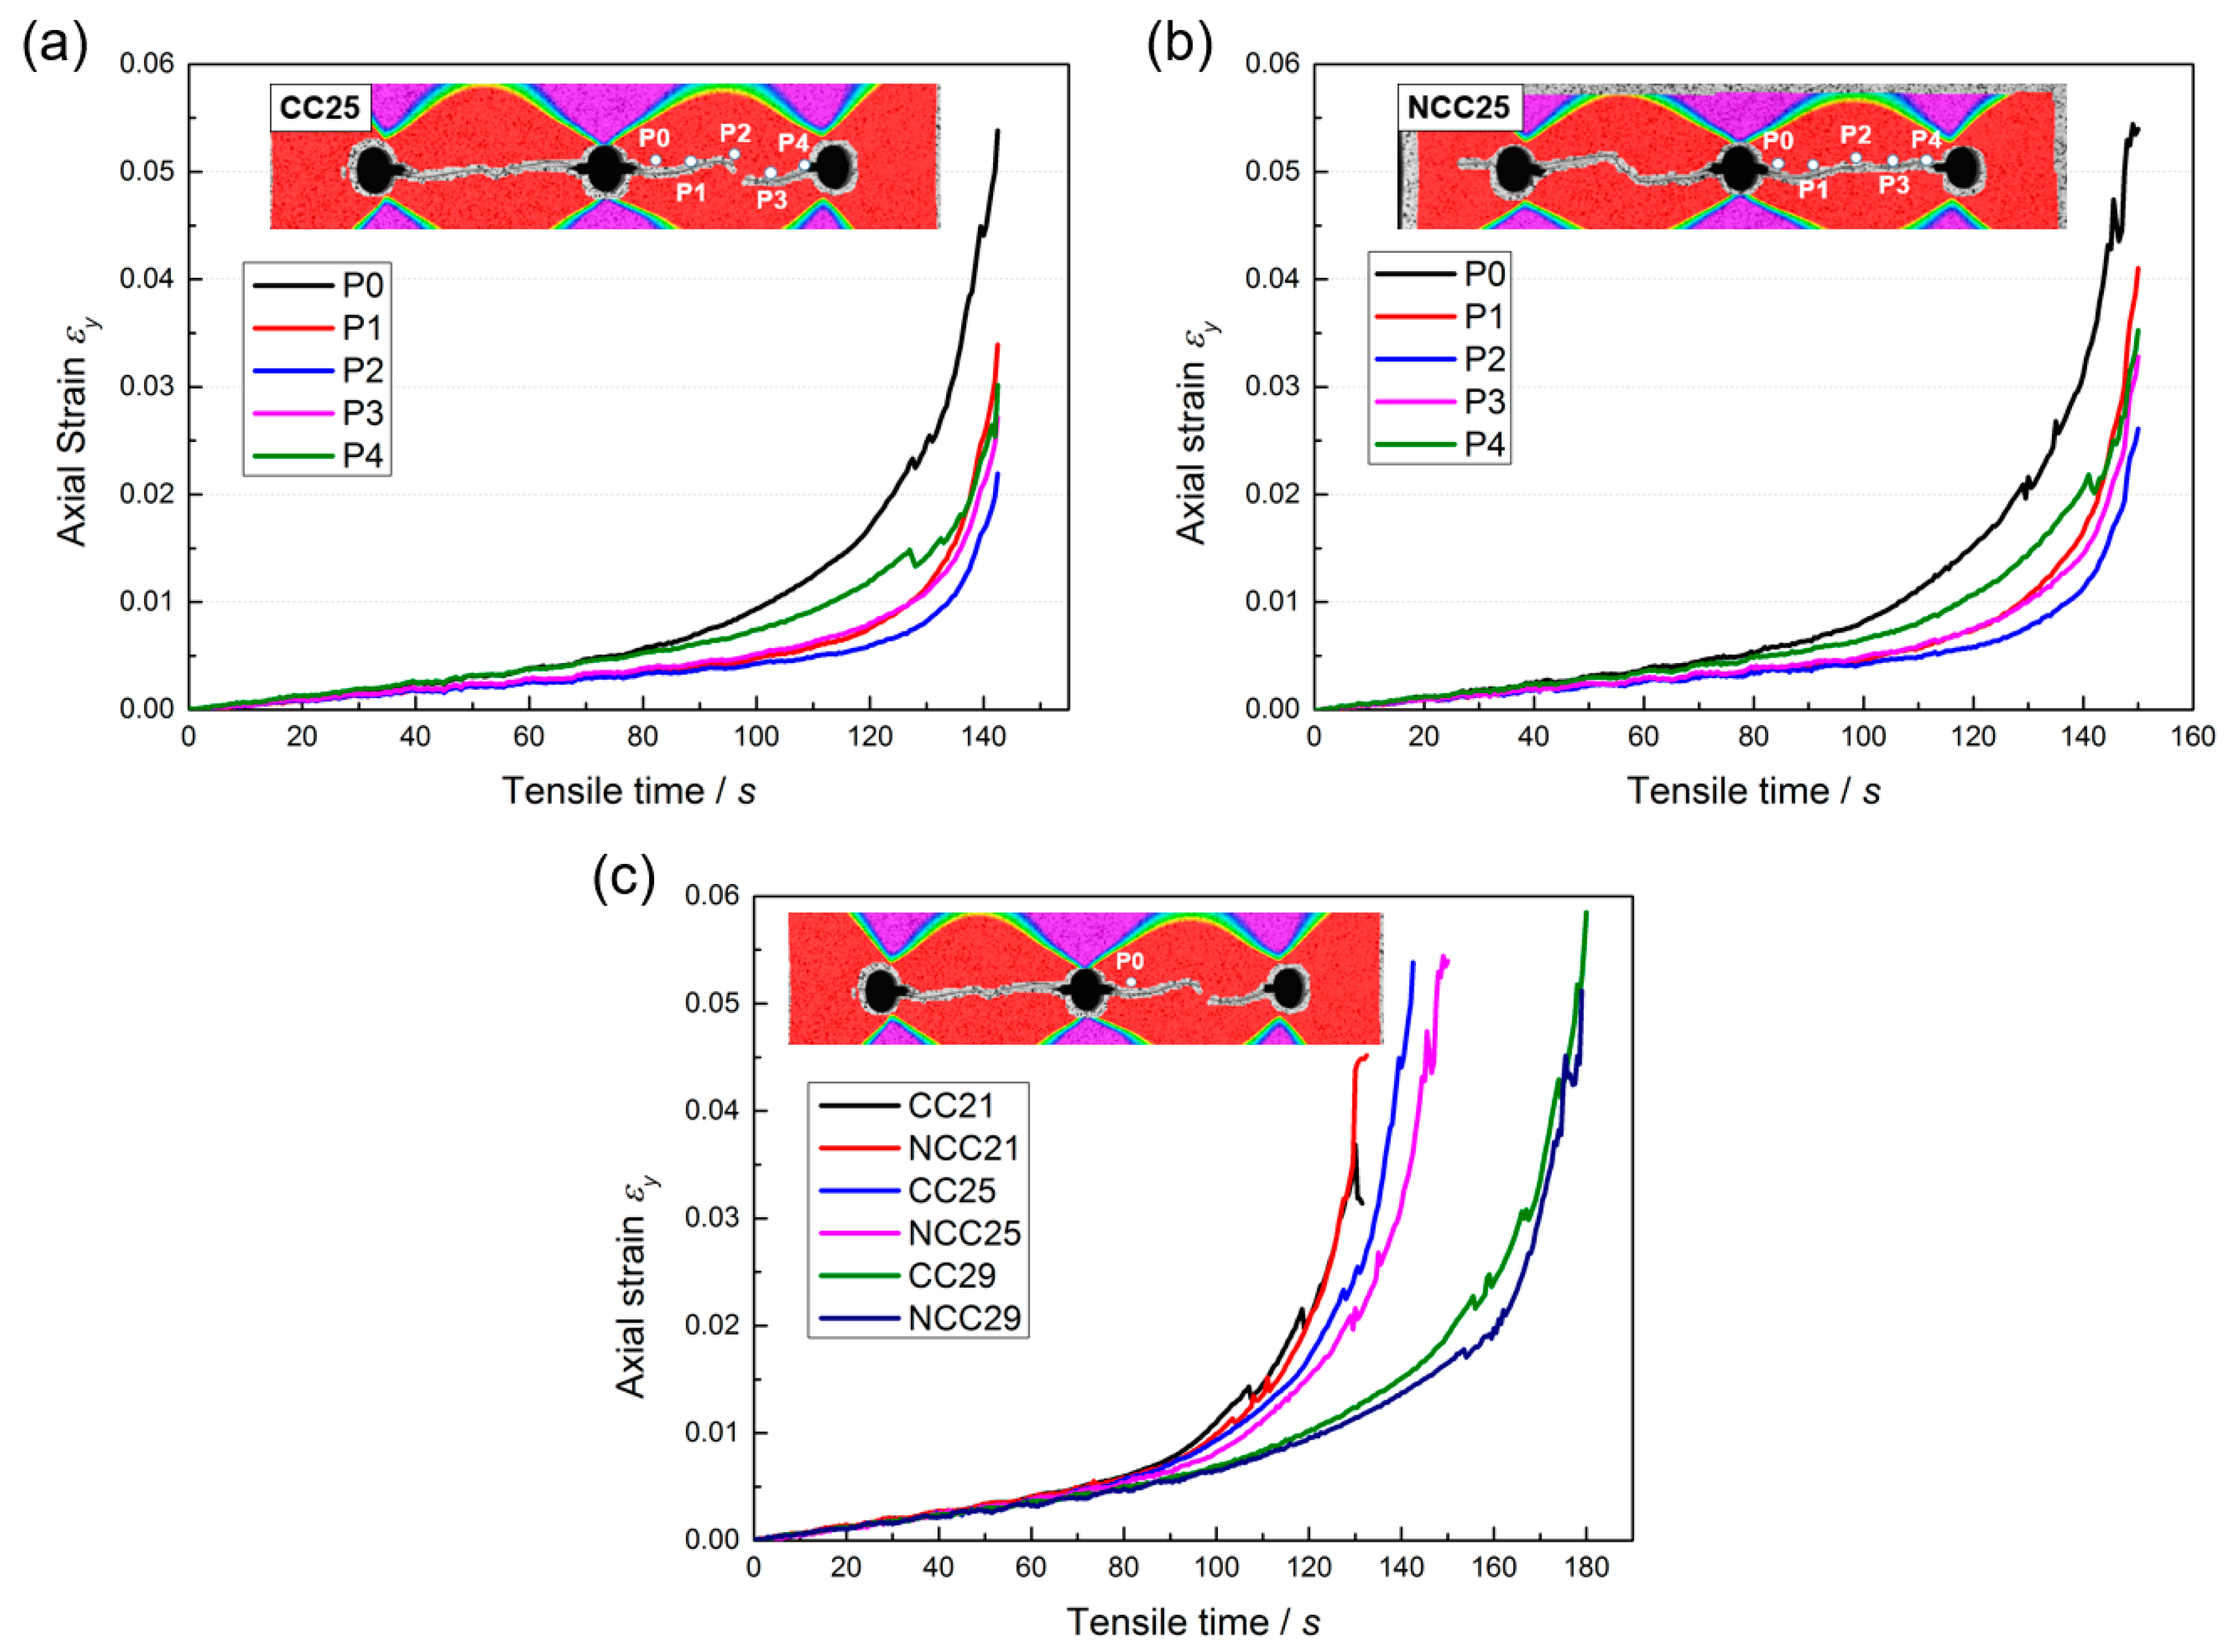
3.2. DIC Strain Nephogram

As a result of the DIC analysis, the full-field strain variations of these six types of specimens (CC and NCC of 21, 25, 29 mm) reveal a similar strain trend. A set of strain nephogram was used to represent an entire process of crack propagation by selecting CC25 in Figure 4, as an example, which are sorted by t/T increments. t/T represents the ratio of the static tension time and the total time until static tension failure. It demonstrates the full field nephogram of the axial strain εy acquired by the DIC method, which changed with t/T in Figure 4. At the beginning period (t/T = 30%) of quasi-static tensile loading, the full field strain was little and the sample’s hollow pre-notched zones displayed an area of strain concentration which was larger than the other areas, as illustrated at t/T = 50%. When t/T gradually rose to 70%, obvious strain clusters firstly appeared at the tips of the cracks and then the strain concentration extended to the whole net section (t/T = 90%). Finally, the specimens failed in the form of instantaneous fracture when the stress and strain in the net section reached the critical state.
It has already been announced in other academic research on fatigue loading [41] that the connection of plastic zones between two adjacent cracks is the basic failure principle of CC. In addition, based on the plastic zone connectivity model, a series of crack connectivity criteria are proposed, including the average stress criterion, average displacement criterion, and ligament yield criterion. However, it is different with fatigue loading conditions, the cracks did not propagate during the early stages before 90% under a static tensile loading condition. Based on strain nephogram acquired from the DIC results, it is shown that the Net section yield criterion is the main criterion of crack failure for both CCs and NCCs.
Strain values at 5 points along the CC25 and NCC25 fracture path were analyzed respectively, the points P0, P1, P2, P3 and P4 are shown in Figure 5a,b, which also illustrates the axial strain and tensile time evolution curve of CC25 and NCC25. As can be observed in the strain nephogram, the maximum εy was always distributed around the cracks. Moreover, the failure time of the five points of CC25 has the following relationship: P2 > P3 > P1 > P4 > P0, so at P0 failure occurs first. A similar trend can be seen in NCC, which demonstrates that the crack growth path is from the pre-notched of the adjacent hole to the middle position. It was also noticed that the points of NCC25 spent more time in failure than those of CC25 respectively.
Axial strains were extracted respectively to indicate strain evolution status of the point P0 along the whole tensile time in six types of specimen as shown in Figure 5c. For six samples, it can be observed that in the early stages before 80 s, tendencies of six curves are consistent, therefore, L has little impact on the propagation of cracks at this stage. Subsequently, the strains of six curves go through a period of increase stably and have an approximately exponential increase after 95 s. From that point on, due to the inter-influence among adjacent cracks, the MSD hazard was more obvious. With the increasing of local strain, the net section of MSD cracks yields, leading to the failures of samples. A similar trend of strain increasing was observed in other CCs and NCCs. It can be seen that the failure times of the six points P0, which have the relationship that has a remarkable accordance with the trend of Figure 6 as follows: tCC21 < tNCC21 < tCC25 < tNCC25 < tCC29 < tNCC29. Consequently, the samples take longer to reach the failure time with the increase of spacing between adjacent holes.

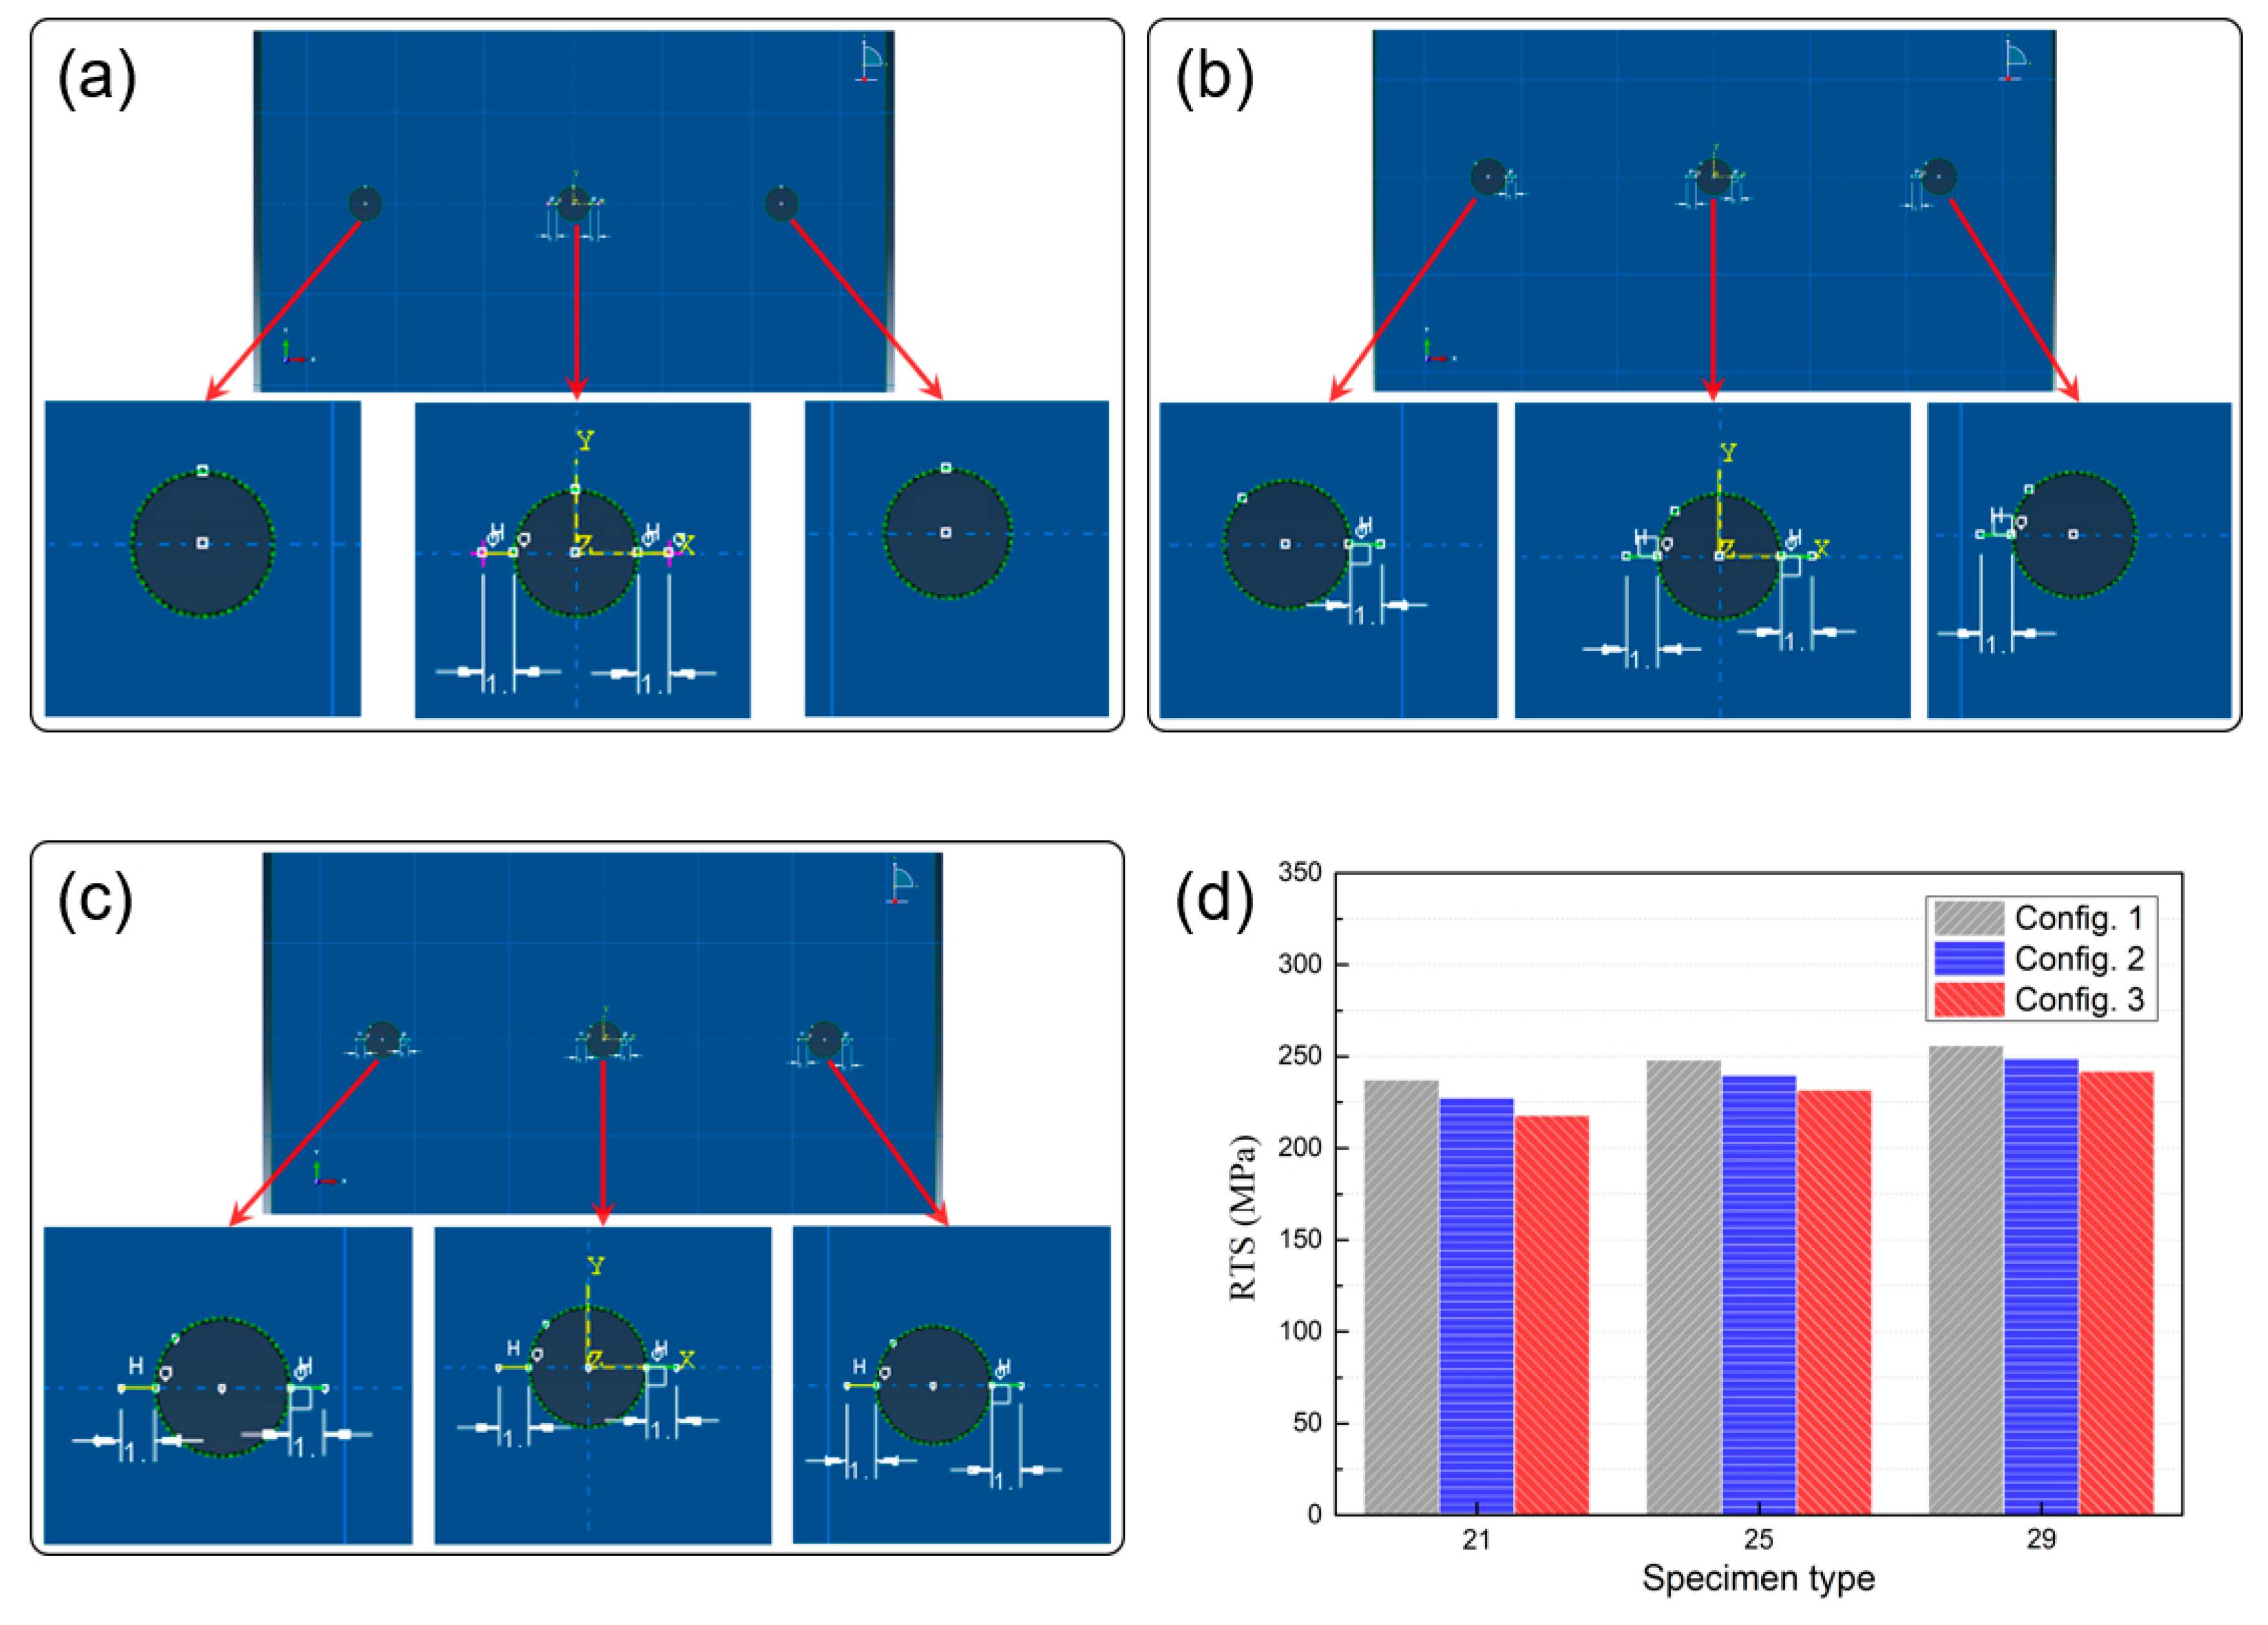
3.3. Influence of Spacing between Adjacent Holes on RTS

Figure 6 shows the average RTS of each specimen with an error bar. It reveals that with the increase of L, the RTS of specimens with MSD increase [42], which could be verified by a two-sample t-test. The p-values between CC21 and CC25, CC25 and CC29, NCC21 and NCC25, NCC25 and NCC29 were 0.0070, 0.0090, 0.0007 and 0.0215 respectively. All of them are below the significance level of 0.05. In addition, by comparing the p-values between CC and NCC, which were 0.4722 for L = 21 mm, 0.0350 for L = 25 mm and 0.1430 for L = 29 mm, the average RTS of NCC was higher than that of CC while L was equal to 25 mm under the significance level of 0.05. As for the conditions of 21 and 29 mm, there were no actual differences between the average RTS of CC and NCC based on the statistical analysis. The average ultimate tensile strength σ of the specimen without MSD was 456.0 MPa, the average RTS of MSD specimens σ’ compared with that without MSD decreased 46.4% (CC21), 43.3% (CC25), 42.0% (CC29), 45.9% (NCC21), 42.1% (NCC25), and 41.0% (NCC29) respectively which were calculated by Equation (5). Moreover, the RTS decrease percentage (pct) of CC21 was larger than that of NCC21, similar decreasing trends were observed in other CC and NCC, which contain the following relationship: pctCC21 > pctNCC21 > pctCC25 > pctNCC25 > pctCC29 > pctNCC29.
p c t = σ σ σ × 100 %
In order to identify the influence of MSD on RTS, experiments were conducted to compare the RTS of specimens with different conditions of damage: (1) the specimen without MSD (no holes nor cracks); (2) the specimen with holes (no cracks); (3) CC25 (with holes and collinear cracks); (4) NCC25 (with holes and non-collinear cracks). Specimens with spacing between adjacent holes of 25 mm were taken as an example. The average RTS values for these four types were 456.0, 330.2, 258.4 and 264.2 MPa separately. It indicates that the existence of holes can decrease the RTS by 27.6%. On this basis, the existence of cracks decreased the RTS by 21.7% (CC25) and 20.0% (NCC25). In addition, the MSD specimens with only collinear cracks were the most dangerous compared with other types of specimens while L was equal to 25 mm.

3.4. Numerical Solution Based on the Net Section Yield Criterion

From the above results, it can be concluded that CCs are more dangerous than those with NCC under the hole spacing of 25 mm and that there is no actual difference for 21 and 29 mm. However, only considering the average RTS, the CC is lower than those of NCC. Therefore, in the subsequent computation, only CCs were taken into account. The calculated values of RTS of different specimens were 227.5 (CC21), 239.9 (CC25), and 248.9 MPa (CC29) based on the Net section yield criterion. Compared with the experimental values, the calculated values were smaller with the computation errors 6.9% (CC21), 7.2% (CC25), 5.9% (CC29) respectively, which were all under 10%, so that we believe this criterion can provide a conservative estimation of the RTS.
As the influence of the existence of holes and cracks on RTS which has been studied in the former part, the influence of crack configuration on RTS will be investigated in the following part. Based on the existing configuration (with 3 holes and 4 cracks), which is named “Config. 2”, other two configurations are proposed: “Config. 1” (with 3 holes and 2 cracks) and “Config. 3” (with 3 holes and 6 cracks), details of these three configurations are depicted in Figure 7a–c. RTS values of these types of crack configurations are calculated based on the Net section yield criterion, and the results are shown in Figure 7d, which indicate that RTS of different MSD specimens increased with the increase of L and the configuration 3 is more likely to fail than the others.

4. Conclusions

In this research, the strain calculation error of DIC analysis is optimized by the orthogonal experiment, then the RTS of 2024-T4 aluminum alloy sheet with multi-site damage was investigated through statistical and numerical methods. Based on the above study, the following conclusions could be formed:
(1)
The influential order of the relevant factors for the strain calculation error is: subset size > interpolation tap > calibration score > step size. The optimal factor combination for strain calculation within our parameters is: 0.018 of calibration score, 23 pixels of subset size, step size is 1/4 of subset size, and the filter size of interpolation calibration is 8 pixels, its strain error is 35 micro-strains, which is better than the other factor combinations.
(2)
The existence of holes can decrease the RTS by 27.6% while the existence of cracks decreases the RTS by 21.7% for CC25 and 20.0% for NCC25. With the increase of spacing between adjacent holes in CC or NCC, the RTS of MSD specimens increases. The average RTS of NCC was higher than that of CC while L equals to 25 mm under the significance level of 0.05. As for the conditions of 21 and 29 mm, there were no actual differences between the average RTS of CC and NCC based on the statistical analysis.
(3)
The RTS calculation method based on the Net section yield criterion can give a conservative prediction value while the maximum computation error is 7.2%, which can be further used in the RTS evaluation of structure with MSD.

Author Contributions

Methodology, S.S.; software, C.J.; validation, C.J. and C.Z.; formal analysis, Y.C. and C.J.; investigation, S.S. and C.Z.; writing—original draft preparation, C.J. and S.S.; writing—review and editing, Y.C. and C.J.; visualization, C.J.; supervision, S.S.; project administration, Y.C.; funding acquisition, Y.C.

Funding

This research was funded by Tianjin Science and Technology Support Project, grant number 18JCTPJC66800.

Acknowledgments

The Tianjin Science and Technology Support Project (Grant No. 18JCTPJC66800) is acknowledged for supporting this research.

Conflicts of Interest

The authors declare no conflict of interest. The funders had no role in the design of the study; in the collection, analyses, or interpretation of data; in the writing of the manuscript, or in the decision to publish the results.

Nomenclature

NomenclaturesExplanations
LThe spacing between adjacent holes
CCThe collinear cracked specimen
NCCThe non-collinear cracked specimen
CC21The collinear cracked specimen with spacing between adjacent holes of 21 mm
NCC21The non-collinear cracked specimen with spacing between adjacent holes of 21 mm
tThe static tension time
TThe total time until static tension failure
εyThe axial strain along the y direction

References

  1. Sun, S.Q.; Zheng, Q.F.; Li, D.F.; Hu, S.Q.; Wen, J.G. Exfoliation corrosion of extruded 2024-T4 in the coastal environments in China. Corros. Sci. 2011, 53, 2527–2538. [Google Scholar] [CrossRef]
  2. Zhao, N.; Yang, Y.Q.; Han, M.; Luo, X.; Feng, G.H.; Zhang, R.J. Finite element analysis of pressure on 2024 aluminum alloy created during restricting expansion-deformation heat-treatment. Trans. Nonferr. Met. Soc. 2012, 22, 2226–2232. [Google Scholar] [CrossRef]
  3. Xu, Y.C.; Li, F.; Liu, X.; Yuan, S.J. Effects of pre-bulging on 2024 aluminum alloy complex-shaped components. JOM 2011, 63, 39–41. [Google Scholar] [CrossRef]
  4. Skorupa, A.; Skorupa, M. Multiple-site damage in riveted lap joints-experimental observations. In Riveted Lap Joints in Aircraft Fuselage; Gladwell, G.M.L., Ed.; Springer: Dordrecht, The Netherlands, 2012; Volume 189, pp. 207–240. [Google Scholar]
  5. Wang, X.; Modarres, M.; Hoffman, P. Analysis of crack interactions at adjacent holes and onset of multi-site fatigue damage in aging airframes. Int. J. Fract. 2009, 156, 155–163. [Google Scholar] [CrossRef]
  6. Silva, L.F.M.; Gonçalves, J.P.M.; Oliveira, F.M.F.; de Castro, P.M.S.T. Multiple-site damage in riveted lap-joints: experimental simulation and finite element prediction. Int. J. Fatigue 2000, 22, 319–338. [Google Scholar] [CrossRef]
  7. Jeong, D.Y.; Tong, P. Onset of multiple site damage and widespread fatigue damage in aging airplanes. Int. J. Fract. 1997, 85, 185–200. [Google Scholar] [CrossRef]
  8. Terada, H. Structural fatigue and joint degradation. Int. J. Fatigue 2001, 23, S21–S30. [Google Scholar] [CrossRef]
  9. Liao, M.; Shi, G.; Xiong, Y. Analytical methodology for predicting fatigue life distribution of fuselage splices. Int. J. Fatigue 2001, 23, S177–S185. [Google Scholar] [CrossRef]
  10. Liu, Y.M.; Mahadevan, S. Probabilistic fatigue life prediction using an equivalent initial flaw size distribution. Int. J. Fatigue 2009, 31, 476–487. [Google Scholar] [CrossRef]
  11. Renaud, G.; Liao, M.; Bombardier, Y. Development of an efficient methodology and tool to determine stress intensity correction factors for complex aircraft structures. In ICAF 2011 Structural Integrity: Influence of Efficiency and Green Imperatives, Proceedings of the 26th Symposium of the International Committee on Aeronautical Fatigue, Montreal, Canada, 1–3 June 2011; Komorowski, J., Ed.; Springer: Montreal, QC, Canada, 2011; pp. 335–345. [Google Scholar]
  12. Pan, B.; Yu, L.; Wu, D. Thermo-mechanical response of superalloy honeycomb sandwich panels subjected to non-steady thermal loading. Mater. Des. 2015, 88, 528–536. [Google Scholar] [CrossRef]
  13. Zhao, G.; Zhang, L.; Tang, C.; Zhou, Y.; Hao, W.; Luo, Y. Experimental study on the torsion behavior of a 3D 4-directionally braided composite shaft using DIC and AE. Polymer Test. 2018, 72, 122–131. [Google Scholar] [CrossRef]
  14. Tian, J.; Li, J.; Xie, H.; Yang, Y.; Kan, Q.H. Finite element implementation of a temperature-dependent cyclic plastic model for SA508-3 steel. Metals 2018, 8, 955. [Google Scholar] [CrossRef]
  15. Pazmino, J.; Carvelli, V.; Lomov, S.V.; Mieghem, B.V.; Lava, P. 3D digital image correlation measurements during shaping of a non-crimp 3D orthogonal woven E-glass reinforcement. Int. J. Mater. Form. 2014, 7, 439–446. [Google Scholar] [CrossRef]
  16. Sutton, M.A.; McNeill, S.R.; Jang, J.; Babai, M. Effects of subpixel image restoration on digital correlation error estimates. Opt. Eng. 1988, 27, 870–877. [Google Scholar] [CrossRef]
  17. Gustafson, H.; Siegmund, G.; Cripton, P. Comparison of strain rosettes and digital image correlation for measuring vertebral body strain. J. Biomech. Eng. 2016, 138, 054501. [Google Scholar] [CrossRef] [PubMed]
  18. Yoneyama, S.; Kikuta, H.; Kitagawa, A.; Kitamura, K. Lens distortion correction for digital image correlation by measuring rigid body displacement. Opt. Eng. 2006, 45, 023602. [Google Scholar] [CrossRef]
  19. Robert, L.; Nazaret, F.; Cutard, T.; Orteu, J.-J. Use of 3-D digital image correlation to characterize the mechanical behavior of a fiber reinforced refractory castable. Exp. Mech. 2007, 47, 761–773. [Google Scholar] [CrossRef]
  20. Pataky, G.J.; Sehitoglu, H. Experimental methodology for studying strain heterogeneity with microstructural data from high temperature deformation. Exp. Mech. 2015, 55, 53–63. [Google Scholar] [CrossRef]
  21. Guo, X.; Liang, J.; Tang, Z.; Cao, B.; Yu, M. High-temperature digital image correlation method for full-field deformation measurement captured with filters at 2600 °C using spraying to form speckle patterns. Opt. Eng. 2014, 53, 063101. [Google Scholar] [CrossRef]
  22. Orteu, J.-J.; Cutard, T.; Garcia, D.; Cailleux, E.; Robert, L. Application of stereovision to the mechanical characterisation of ceramic refractories reinforced with metallic fibres. Strain 2007, 43, 96–108. [Google Scholar] [CrossRef]
  23. Rajan, V.P.; Rossol, M.N.; Zok, F.W. Optimization of digital image correlation for high-resolution strain mapping of ceramic composites. Exp. Mech. 2012, 52, 1407–1421. [Google Scholar] [CrossRef]
  24. Wang, W.C.; Chiang, Y.A.; Yu, K.J.; Ho, Y.C.; Shen, H.T.; Chang, T.Y.; Chang, Y.H.; Tsao, C.S. Three-dimensional digital image correlation measurement of mechanical properties of soft materials. Meccanica 2015, 50, 419–428. [Google Scholar] [CrossRef]
  25. Härtel, M.; Illgen, C.; Frint, P.; Wagner, M.F.-X. On the PLC effect in a particle reinforced AA2017 alloy. Metals 2018, 8, 88. [Google Scholar] [CrossRef]
  26. Wang, F.; Cui, W.C.; Paik, J.K. Residual ultimate strength of structural members with multiple crack damage. Thin Wall. Struct. 2009, 47, 1439–1446. [Google Scholar] [CrossRef]
  27. Cherry, M.C.; Mall, S. Residual strength of unstiffened aluminum panels with multiple site damage. Eng. Fract. Mech. 1997, 57, 701–713. [Google Scholar] [CrossRef]
  28. Xu, W.; Wang, H.; Wu, X.; Zhang, X.; Bai, G.; Huang, X. A novel method for residual strength prediction for sheets with multiple site damage: Methodology and experimental validation. Int. J. Solids Struct. 2014, 51, 551–565. [Google Scholar] [CrossRef]
  29. Smith, B.L.; Saville, P.A.; Mouak, A.; Myose, R.Y. Strength of 2024-T3 aluminum panels with multiple site damage. J. Aircraft 2000, 37, 325–331. [Google Scholar] [CrossRef]
  30. Sumi, Y.; Yamamoto, Y. A Combined Analytical and Finite Element Method for Non-Collinear Crack Growth in Brittle Solids. In Discretization Methods in Structural Mechanics; International Union of Theoretical and Applied Mechanics (International Association for Computational Mechanics); Kuhn, G., Mang, H., Eds.; Springer: Berlin/Heidelberg, Germany, 1990; pp. 243–252. [Google Scholar]
  31. Chen, Y.; Sun, S.; Ji, C. Analysis of aluminum sheets with multiple sites damage based on fatigue tests and DIC technique. Int. J. Fatigue 2018, 109, 37–48. [Google Scholar] [CrossRef]
  32. Jones, R.; Molent, L.; Pitt, S. Study of multi-site damage of fuselage lap joints. Theor. Appl. Fract. Mec. 1999, 32, 81–100. [Google Scholar] [CrossRef]
  33. Seifi, R.; Ghadimian, O.; Ranjbaran, M. Study on life and path of fatigue cracks in multiple site damage plates. Int. J. Fatigue 2015, 80, 449–458. [Google Scholar] [CrossRef]
  34. Zhang, T.; Bao, R.; Lu, S.; Fei, B. Investigation of fatigue crack propagation mechanisms of branching crack in 2324-T39 aluminum alloy thin plates under cyclic loading spectrum. Int. J. Fatigue 2016, 82, 602–615. [Google Scholar] [CrossRef]
  35. Roy, R.K. Experimental Design Using Orthogonal Arrays. In Design of Experiments Using the Taguchi Approach: 16 Steps to Product and Process Improvement; John Wiley & Sons: New York, NY, USA, 2001; pp. 98–102. [Google Scholar]
  36. Yuan, Z.; Chen, X.; Zeng, H.; Wang, K.; Qiu, J. Identification of the elastic constant values for numerical simulation of high velocity impact on dyneema® woven fabrics using orthogonal experiments. Compos. Struct. 2018, 204, 178–191. [Google Scholar] [CrossRef]
  37. Wu, X.; Leung, D.Y. Optimization of biodiesel production from camelina oil using orthogonal experiment. Appl. Energy 2011, 88, 3615–3624. [Google Scholar] [CrossRef]
  38. Sutton, M.A.; Orteu, J.-J.; Schreier, H.W. Image matching methods. In Image Correlation for Shape, Motion and Deformation Measurements; Springer: New York, NY, USA, 2009; pp. 103–113. [Google Scholar]
  39. He, Z.H.; Sutton, M.A.; Ranson, W.F.; Peters, W.H. Two-dimensional fluid-velocity measurements by use of digital-speckle correlation techniques. Exp. Mech. 1984, 24, 117–121. [Google Scholar] [CrossRef]
  40. Peuchot, B. Camera virtual equivalent model 0.01 pixel detectors. Comput. Med. Image Grap. 1993, 17, 289–294. [Google Scholar] [CrossRef]
  41. Pook, L. Fatigue life in the presence of a crack. In Metal Fatigue; Gladwell, G.M.L., Ed.; Springer: Dordrecht, The Netherlands, 2007; Volume 145, pp. 135–159. [Google Scholar]
  42. Ribeiro, R.L.; Hill, M.R. Residual stress from cold expansion of fastener holes: measurement, eigenstrain, and process finite element modeling. J. Eng. Mater. Technol. 2017, 139, 041012. [Google Scholar] [CrossRef]
Figure 1. The geometry and dimension of the hollow pre-notched specimen (mm): (a) the specimen with speckle pattern, (b) the dimensions of the specimen, (c) the partial dimensions of the collinear cracked specimens (CC), and (d) the partial dimensions of the non-collinear cracked specimens (NCC). C1-C4 represent the four cracks in the collinear cracked specimens while NC1-NC4 represent those in the non-collinear cracked specimens.
Metals 09 00118 g001
Figure 2. Experimental set-up.
Metals 09 00118 g002
Figure 3. Diagram between levels of factors and strain calculation error. The four lines represent calibration score, subset size, step size and interpolation tap respectively. The optimal level of the three subset levels was 23 pixels (about 5 times the speckle size), the bigger the subset size is, the more information is contained in a single subset and the correlation match is better between the subsets.
Metals 09 00118 g003
Figure 4. Evolution of εy of (a) CC25 and (b) NCC25. At t/T = 30%, the full field strain was little. The hollow pre-notched zones displayed an area of strain concentration which was larger than the other areas at t/T = 50%. When t/T gradually rose to 70%, obvious strain clusters firstly appeared at the tips of cracks and finally, the specimens failed in the form of instantaneous fracture.
Metals 09 00118 g004
Figure 5. Axial strain and tensile time evolution curve of (a) CC25, (b) NCC25, and (c) the points P0 in six types of specimen. The maximum εy was always distributed around the cracks. At P0, failure occurred first for CC25 and NCC25; the points of NCC25 spent more time in failure than those of CC25 respectively. For six samples, the tendencies are consistent.
Metals 09 00118 g005
Figure 6. Diagram between L and residual tensile strength (RTS) of specimens. With the increase of L, the RTS of specimens with multi-site damage (MSD) increase. The average RTS of NCC was higher than that of CC while L was equal to 25 mm.
Metals 09 00118 g006
Figure 7. (a) Detail of Config. 1, (b) detail of Config. 2, (c) detail of Config. 3, and (d) RTS of different configurations calculated based on the Net section yield criterion. RTS of different MSD specimens increase with the increase of L and configuration 3 is more likely to fail than the others.
Metals 09 00118 g007
Table 1. Four factors and three levels of each factor in the orthogonal experiment.
LevelCalibration ScoreSubset Size/PixelStep SizeInterpolation Tap/Pixel
10.106151/2 subset size4
20.018231/4 subset size6
30.012351/6 subset size8
Table 2. Orthogonal experimental results. The four factors and three levels are calibration score (level 1, 0.106; level 2, 0.018; level 3, 0.012), subset size (level 1, 15 pixels; level 2, 23 pixels; level 3, 35 pixels), step size (level 1, 1/2 subset size; level 2, 1/4 subset size; level 3, 1/6 subset size) and interpolation tap (level 1, 4; level 2, 6; level 3, 8) respectively.
Experiment NumberCalibration ScoreSubset Size/PixelStep SizeInterpolation Tap/PixelStrain Error/10−6
10.106151/2 subset size4133
20.106231/4 subset size682
30.106351/6 subset size860
40.018151/4 subset size899
50.018231/6 subset size449
60.018351/2 subset size686
70.012151/6 subset size6143
80.012231/2 subset size867
90.012351/4 subset size466
Table 3. Range analysis of strain calculation precision. The influential order of relevant factors for RTS was subset size > interpolation tap > calibration score > step size.
ItemsCalibration ScoreSubset Size/PixelStep SizeInterpolation Tap/Pixel
K1275375286248
K2233197246311
K3276212252225
k1921259583
k2786682104
k392718475
Δk14591329

