Acetic Acid Etching of Mg-xGd Alloys


 , , ,
, , , 
Abstract
:1. Introduction
2. Materials and Methods
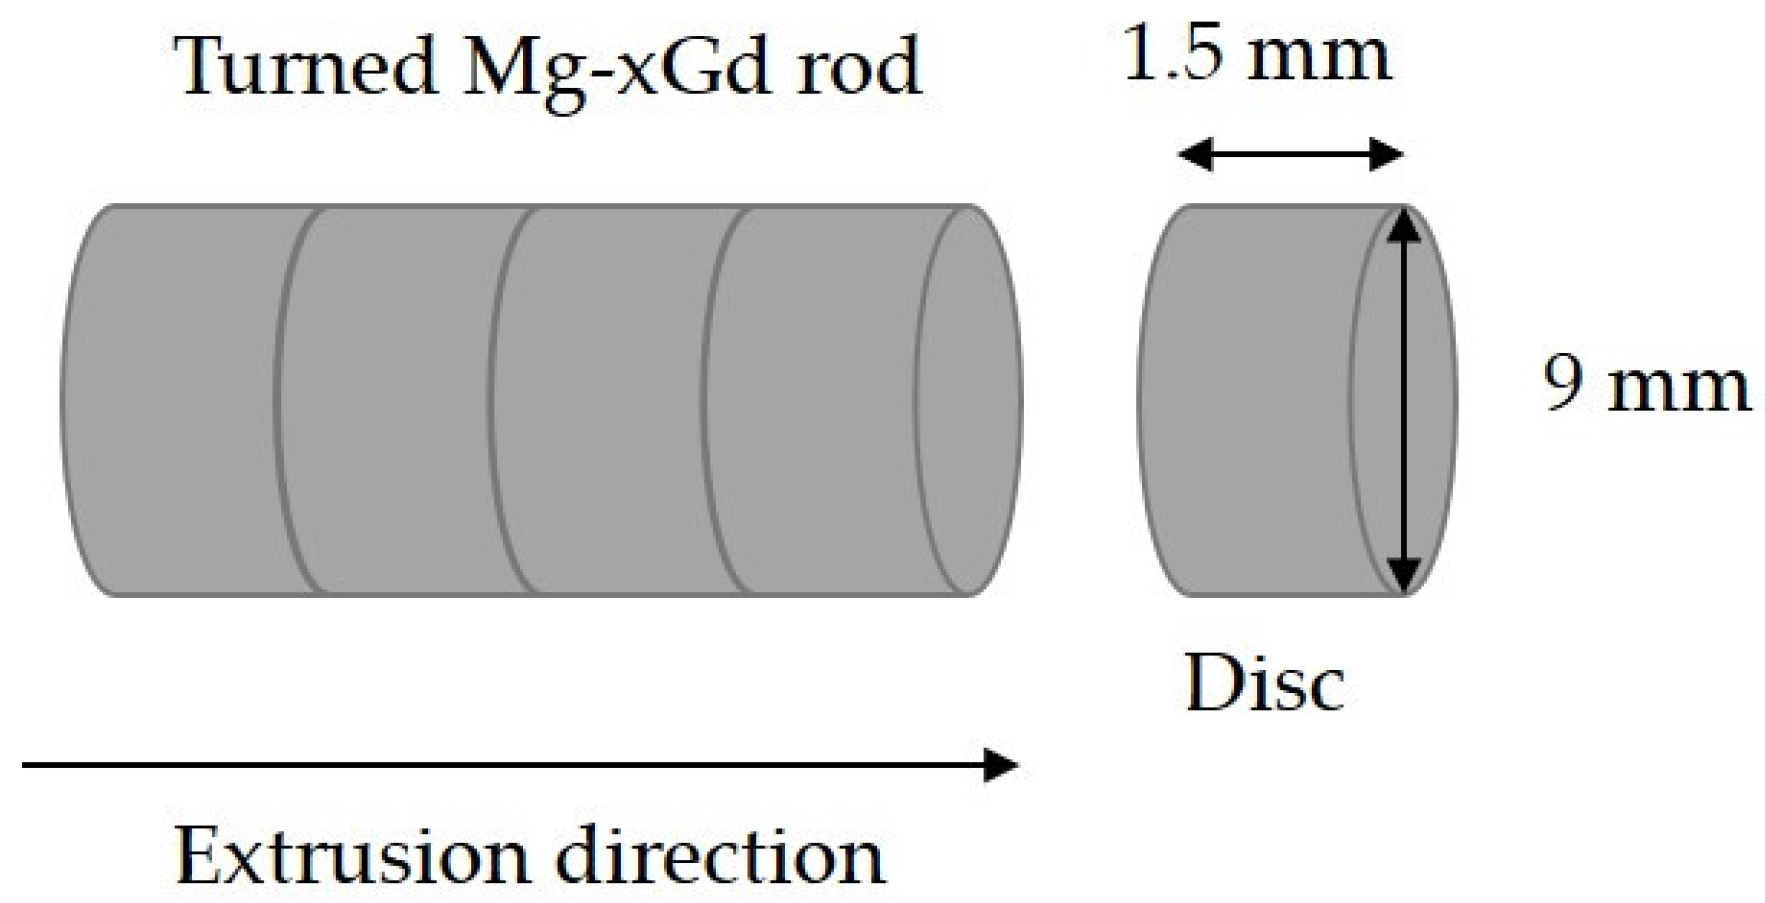
2.1 Material Casting and Processing
2.2. Etching Procedure
2.3. Determination of Material Removal
2.4 Determination of the Temperature and pH
2.5 Interferometry
2.6. Micrographs
2.7. SEM and EDS
2.8. ToF-SIMS
3. Results
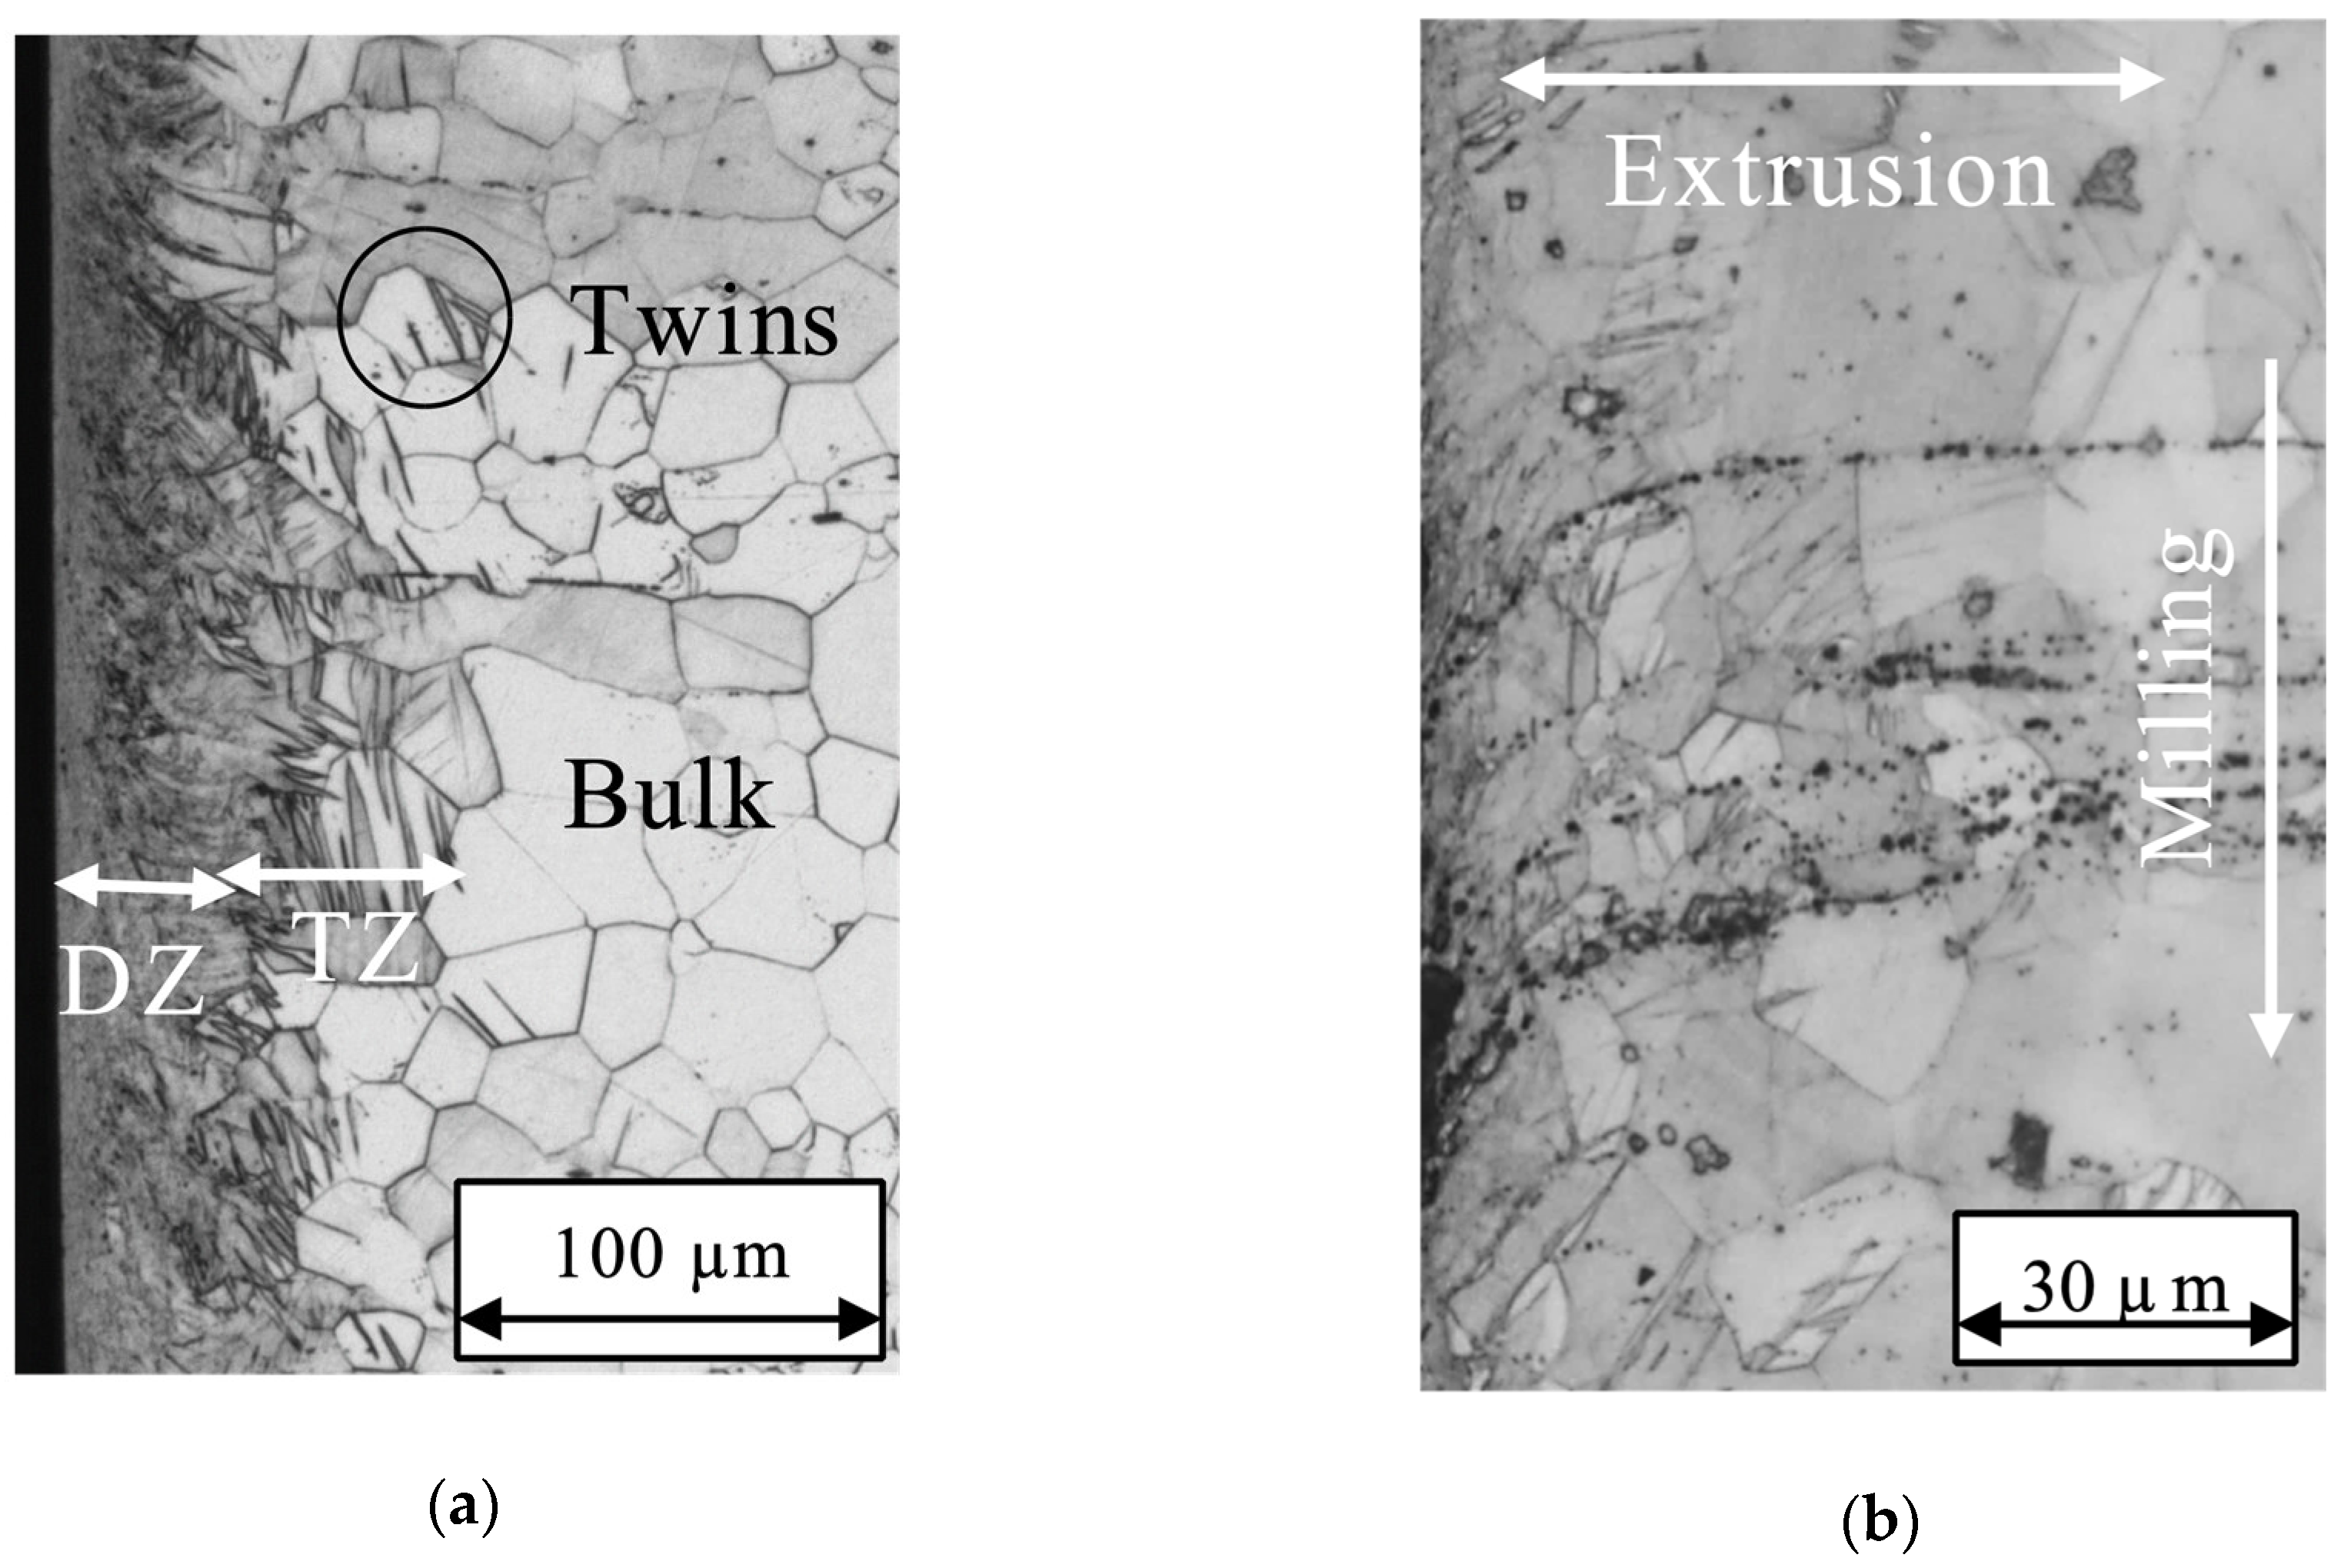
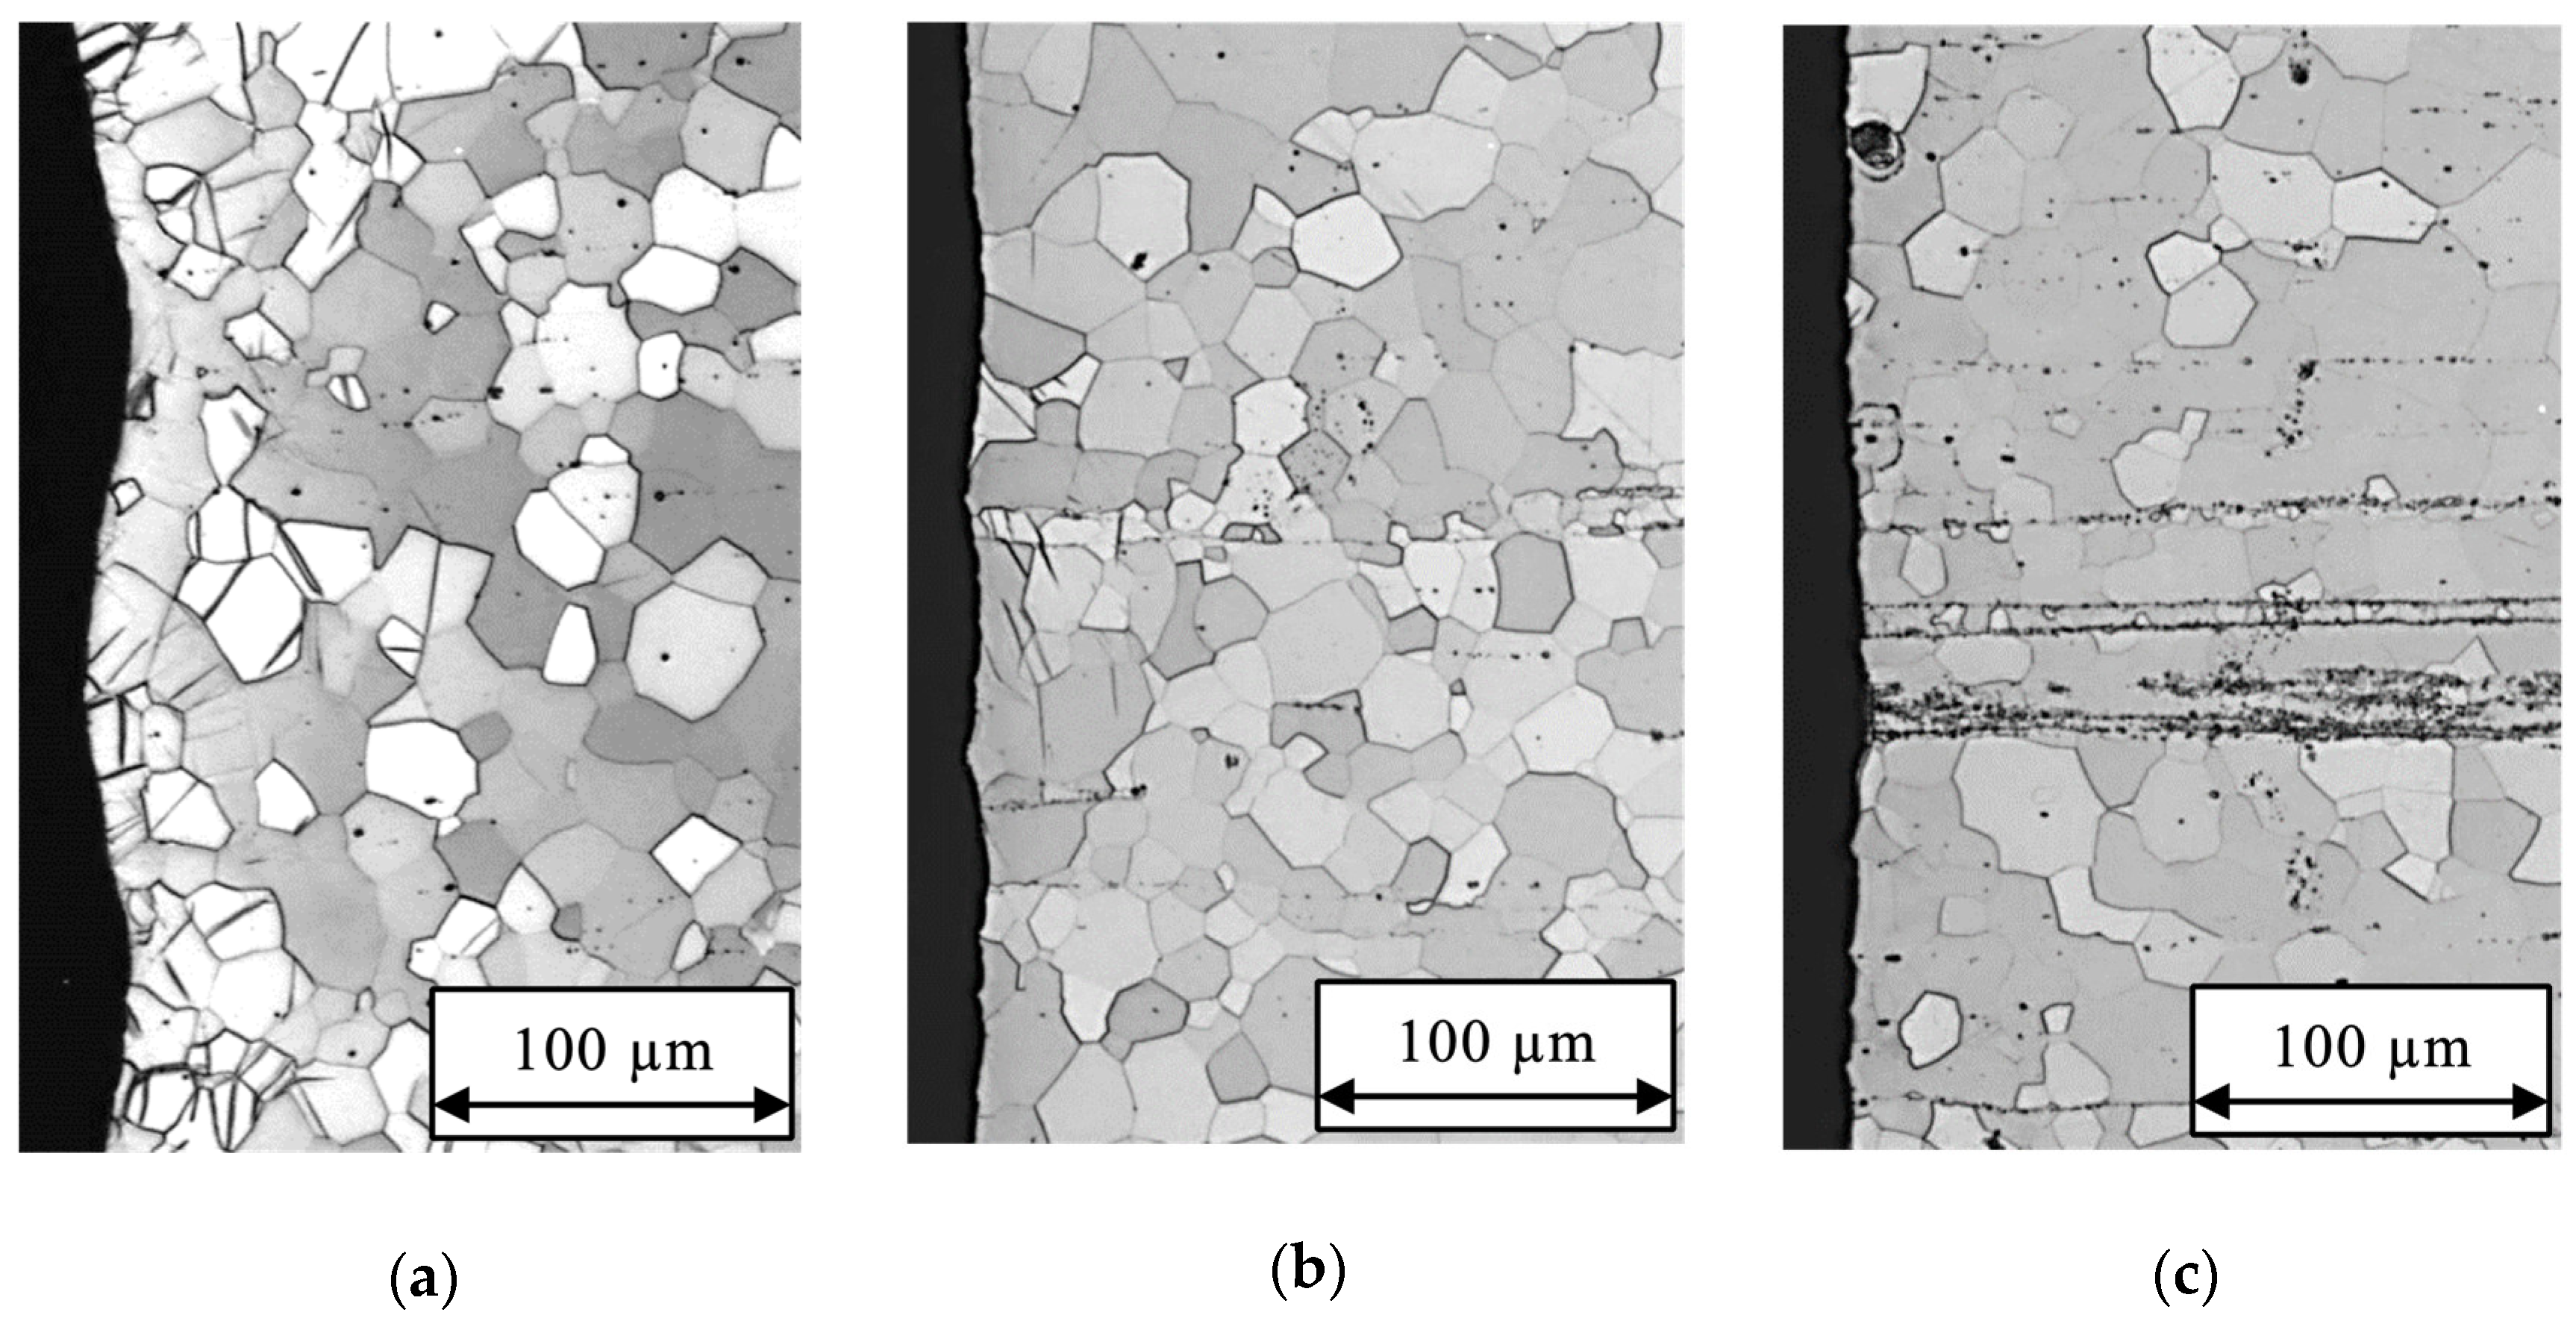
3.1. Micrographs
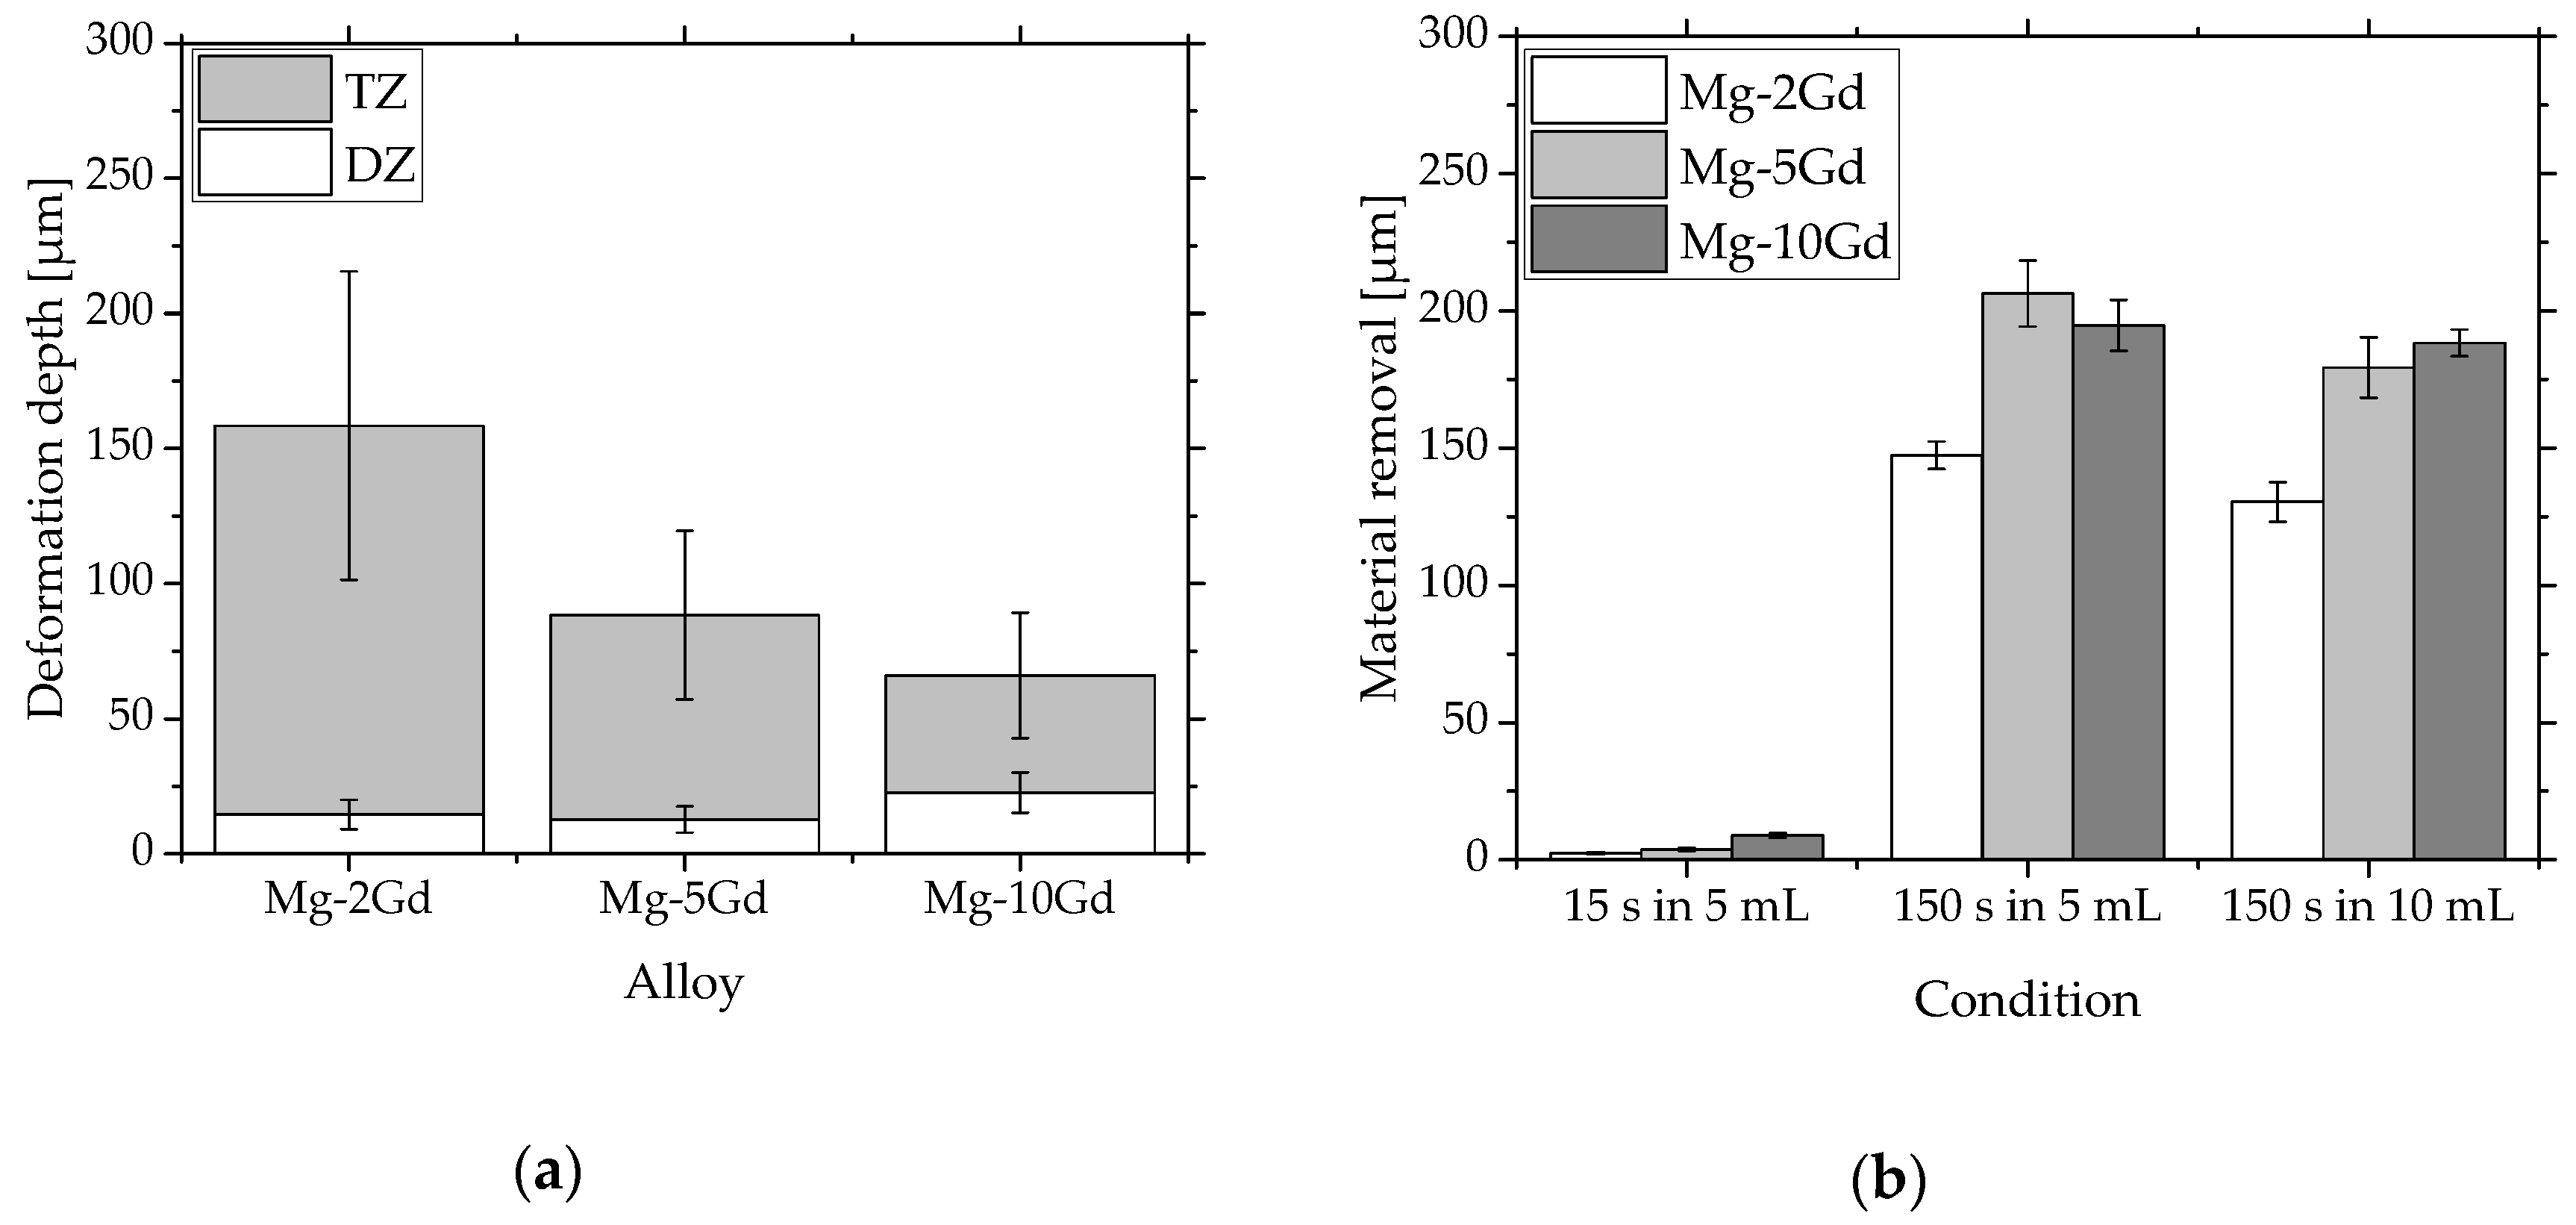
3.2. Material Removal
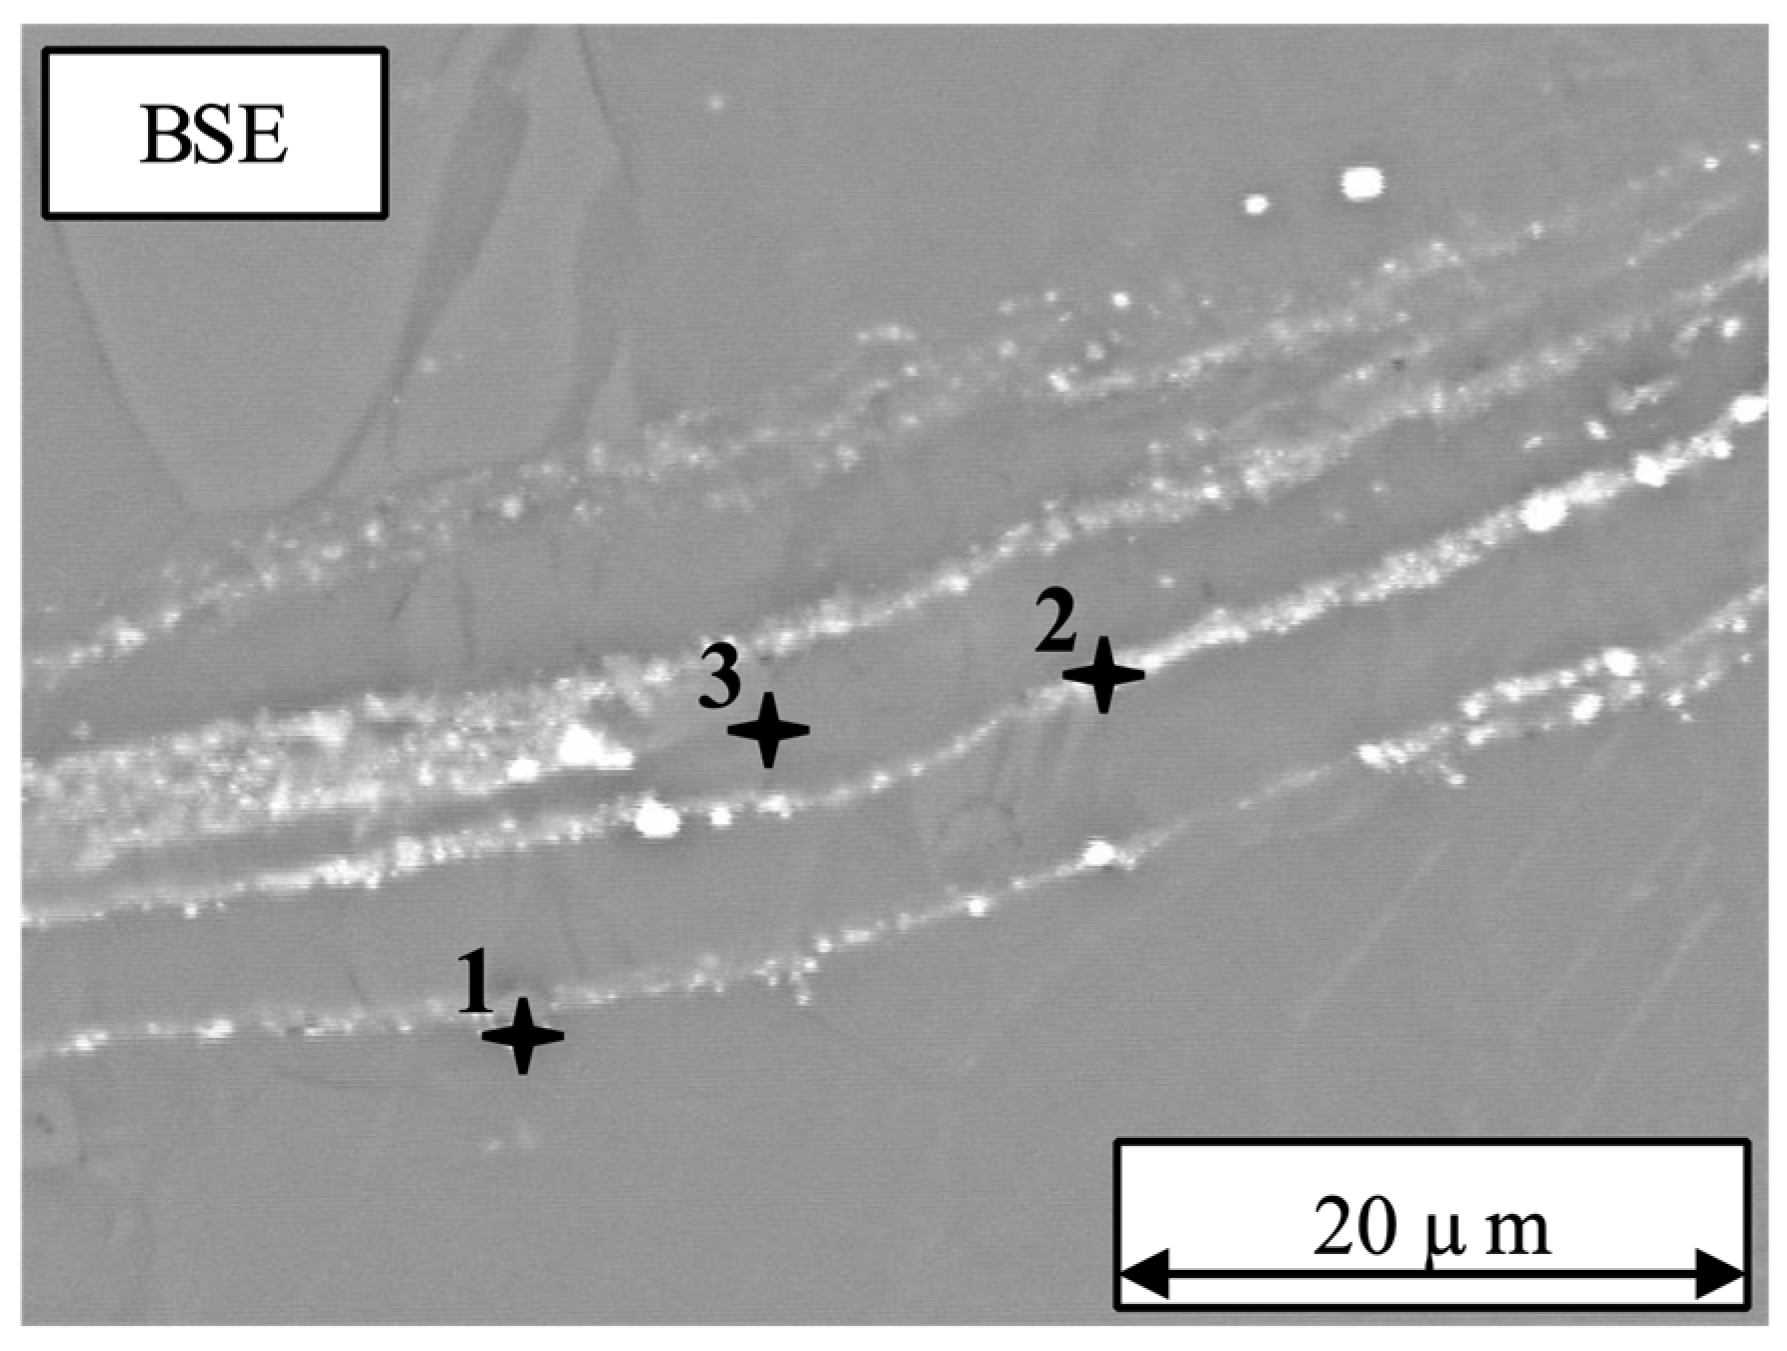
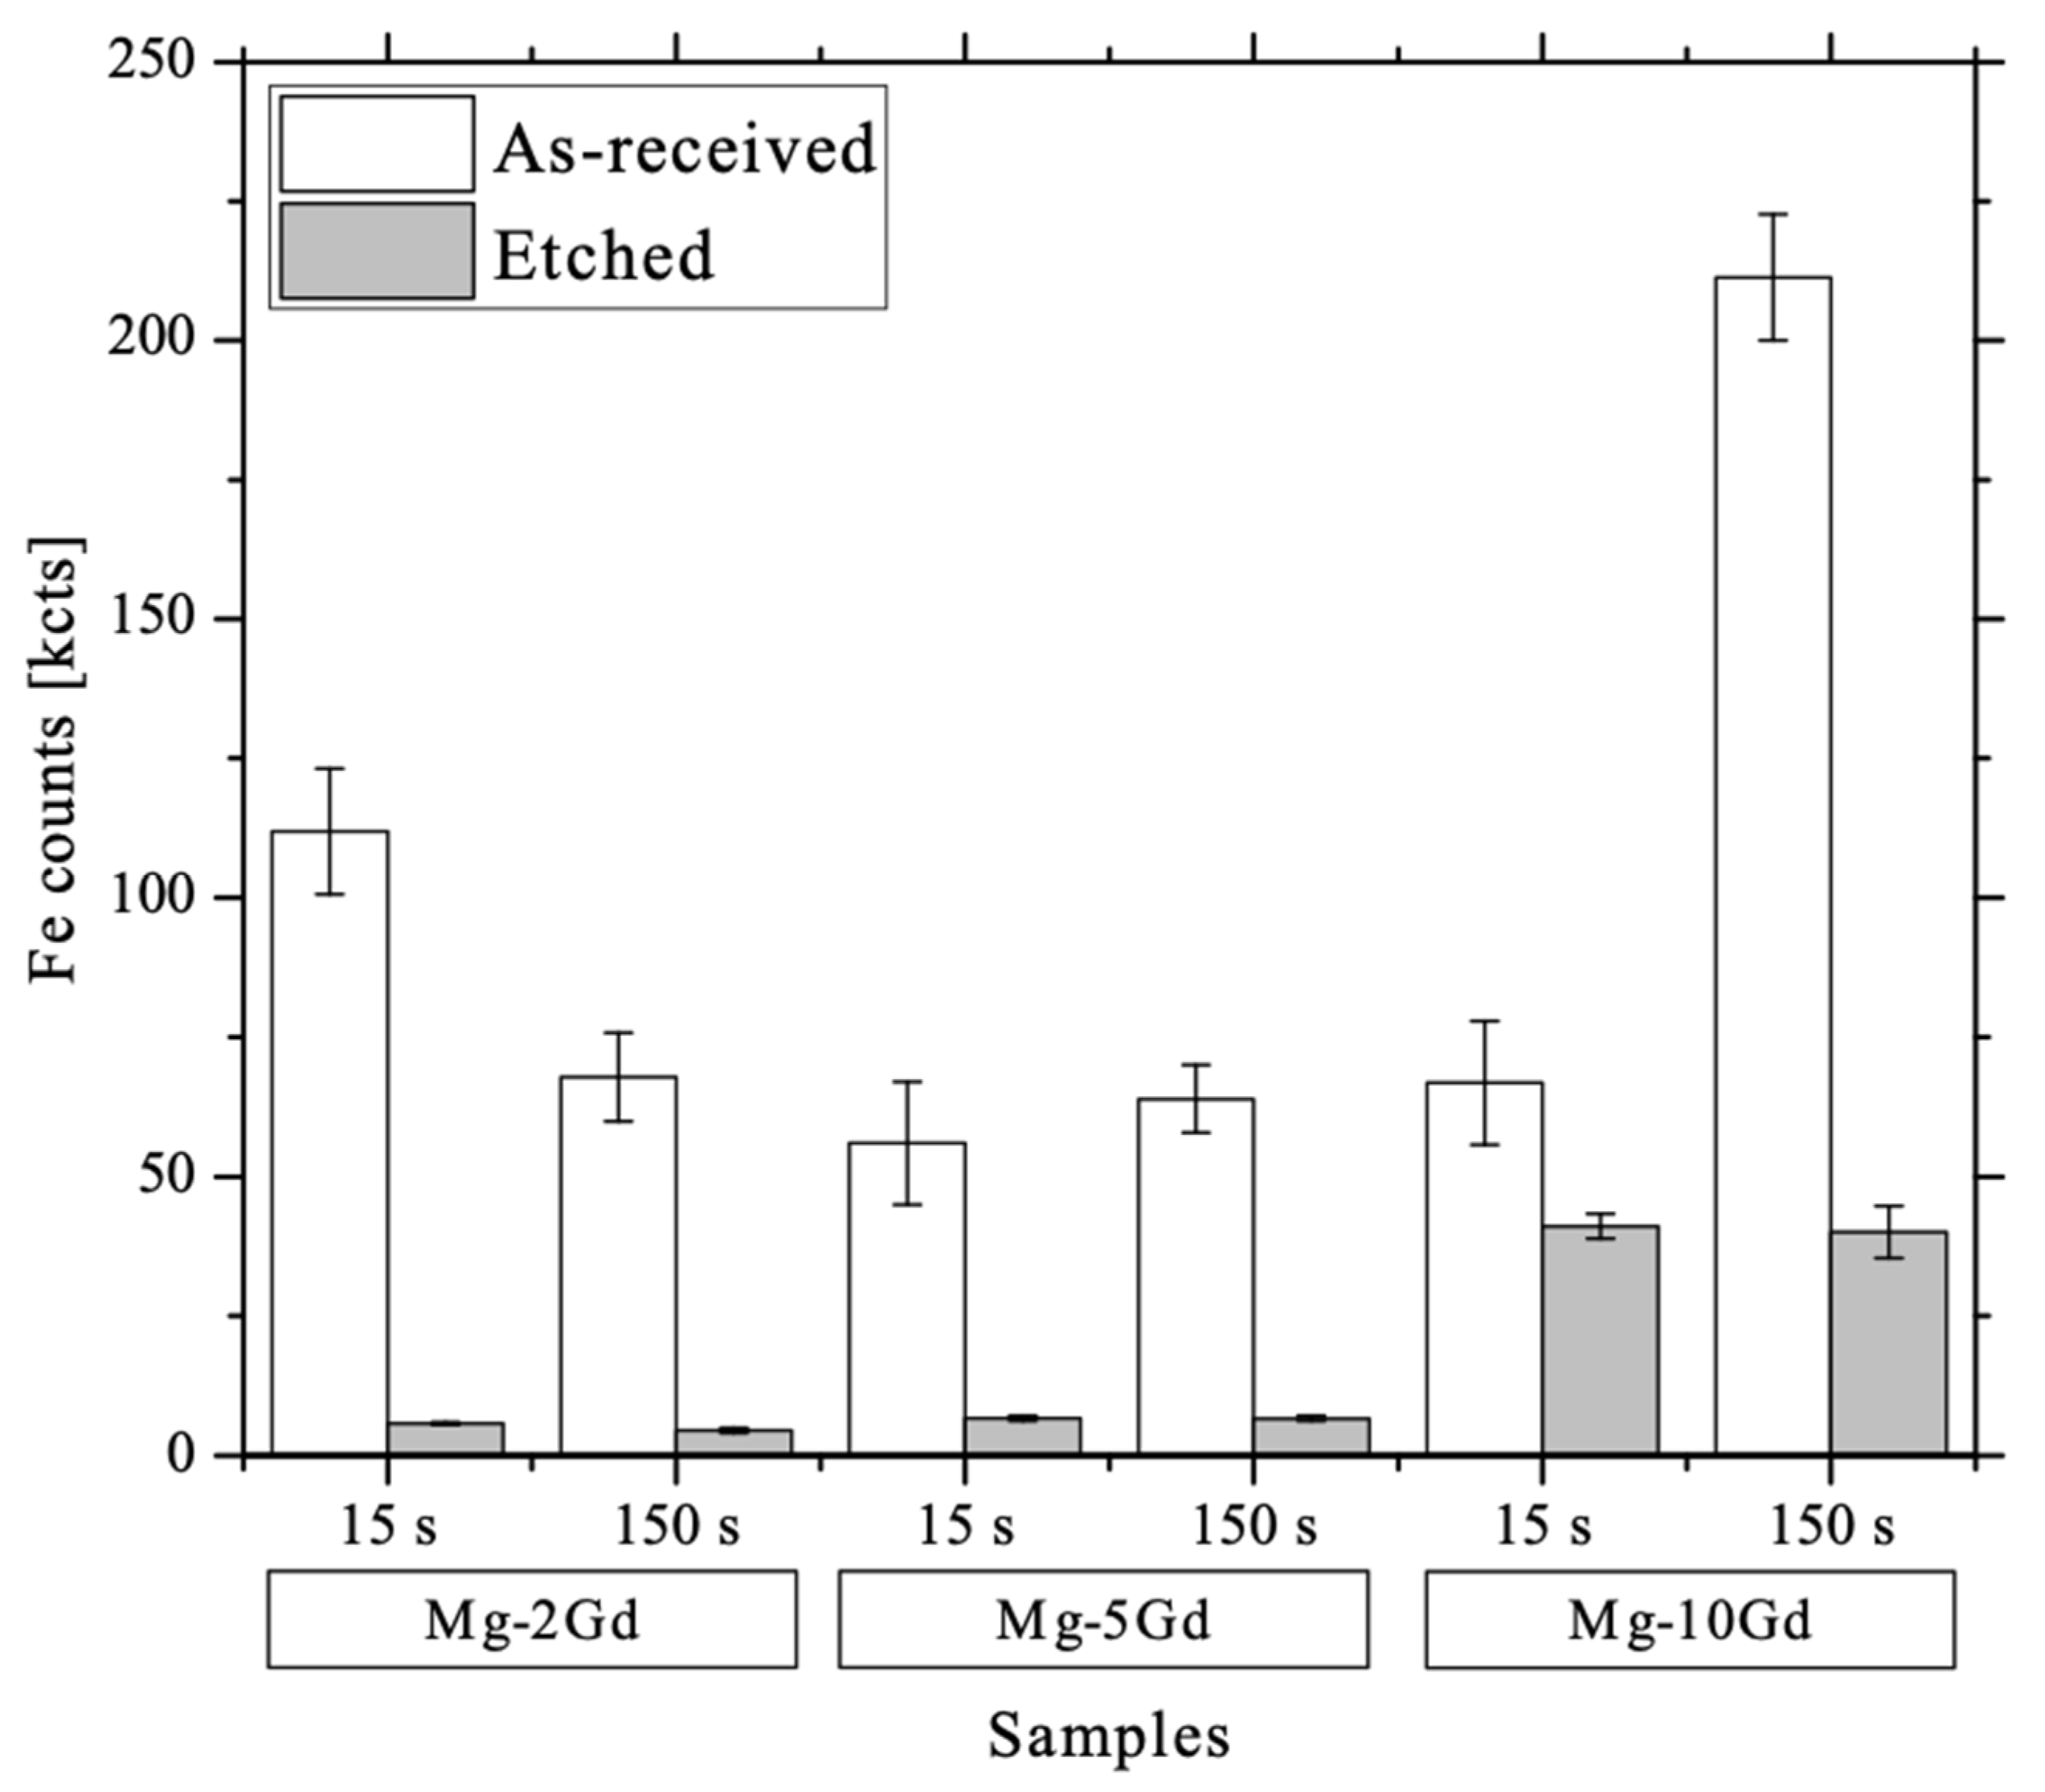
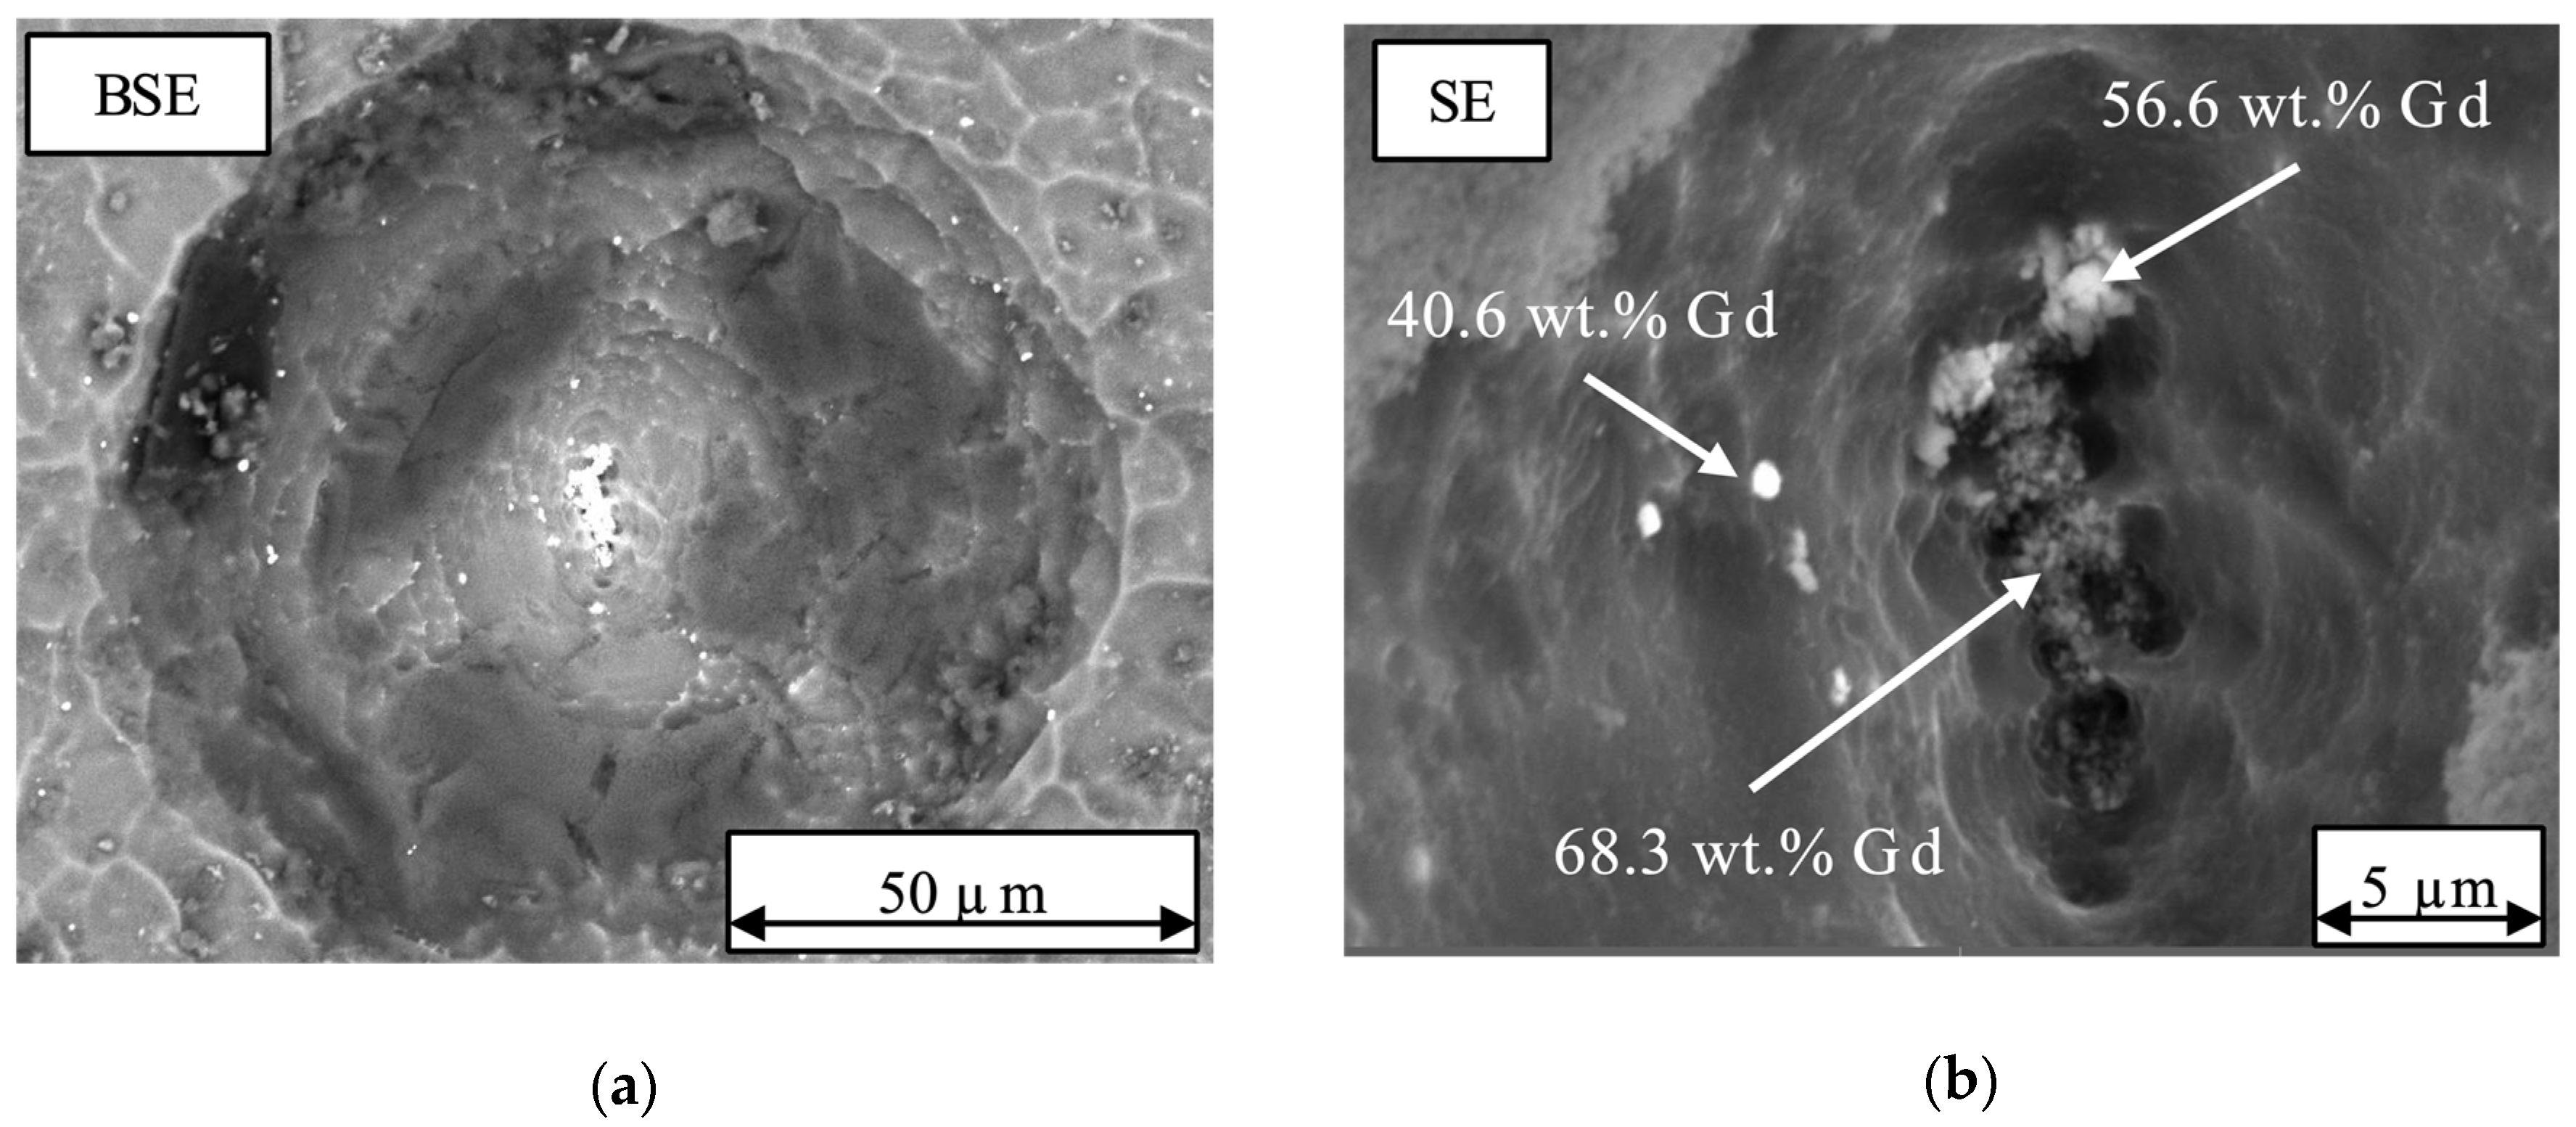
3.3. SEM and EDX
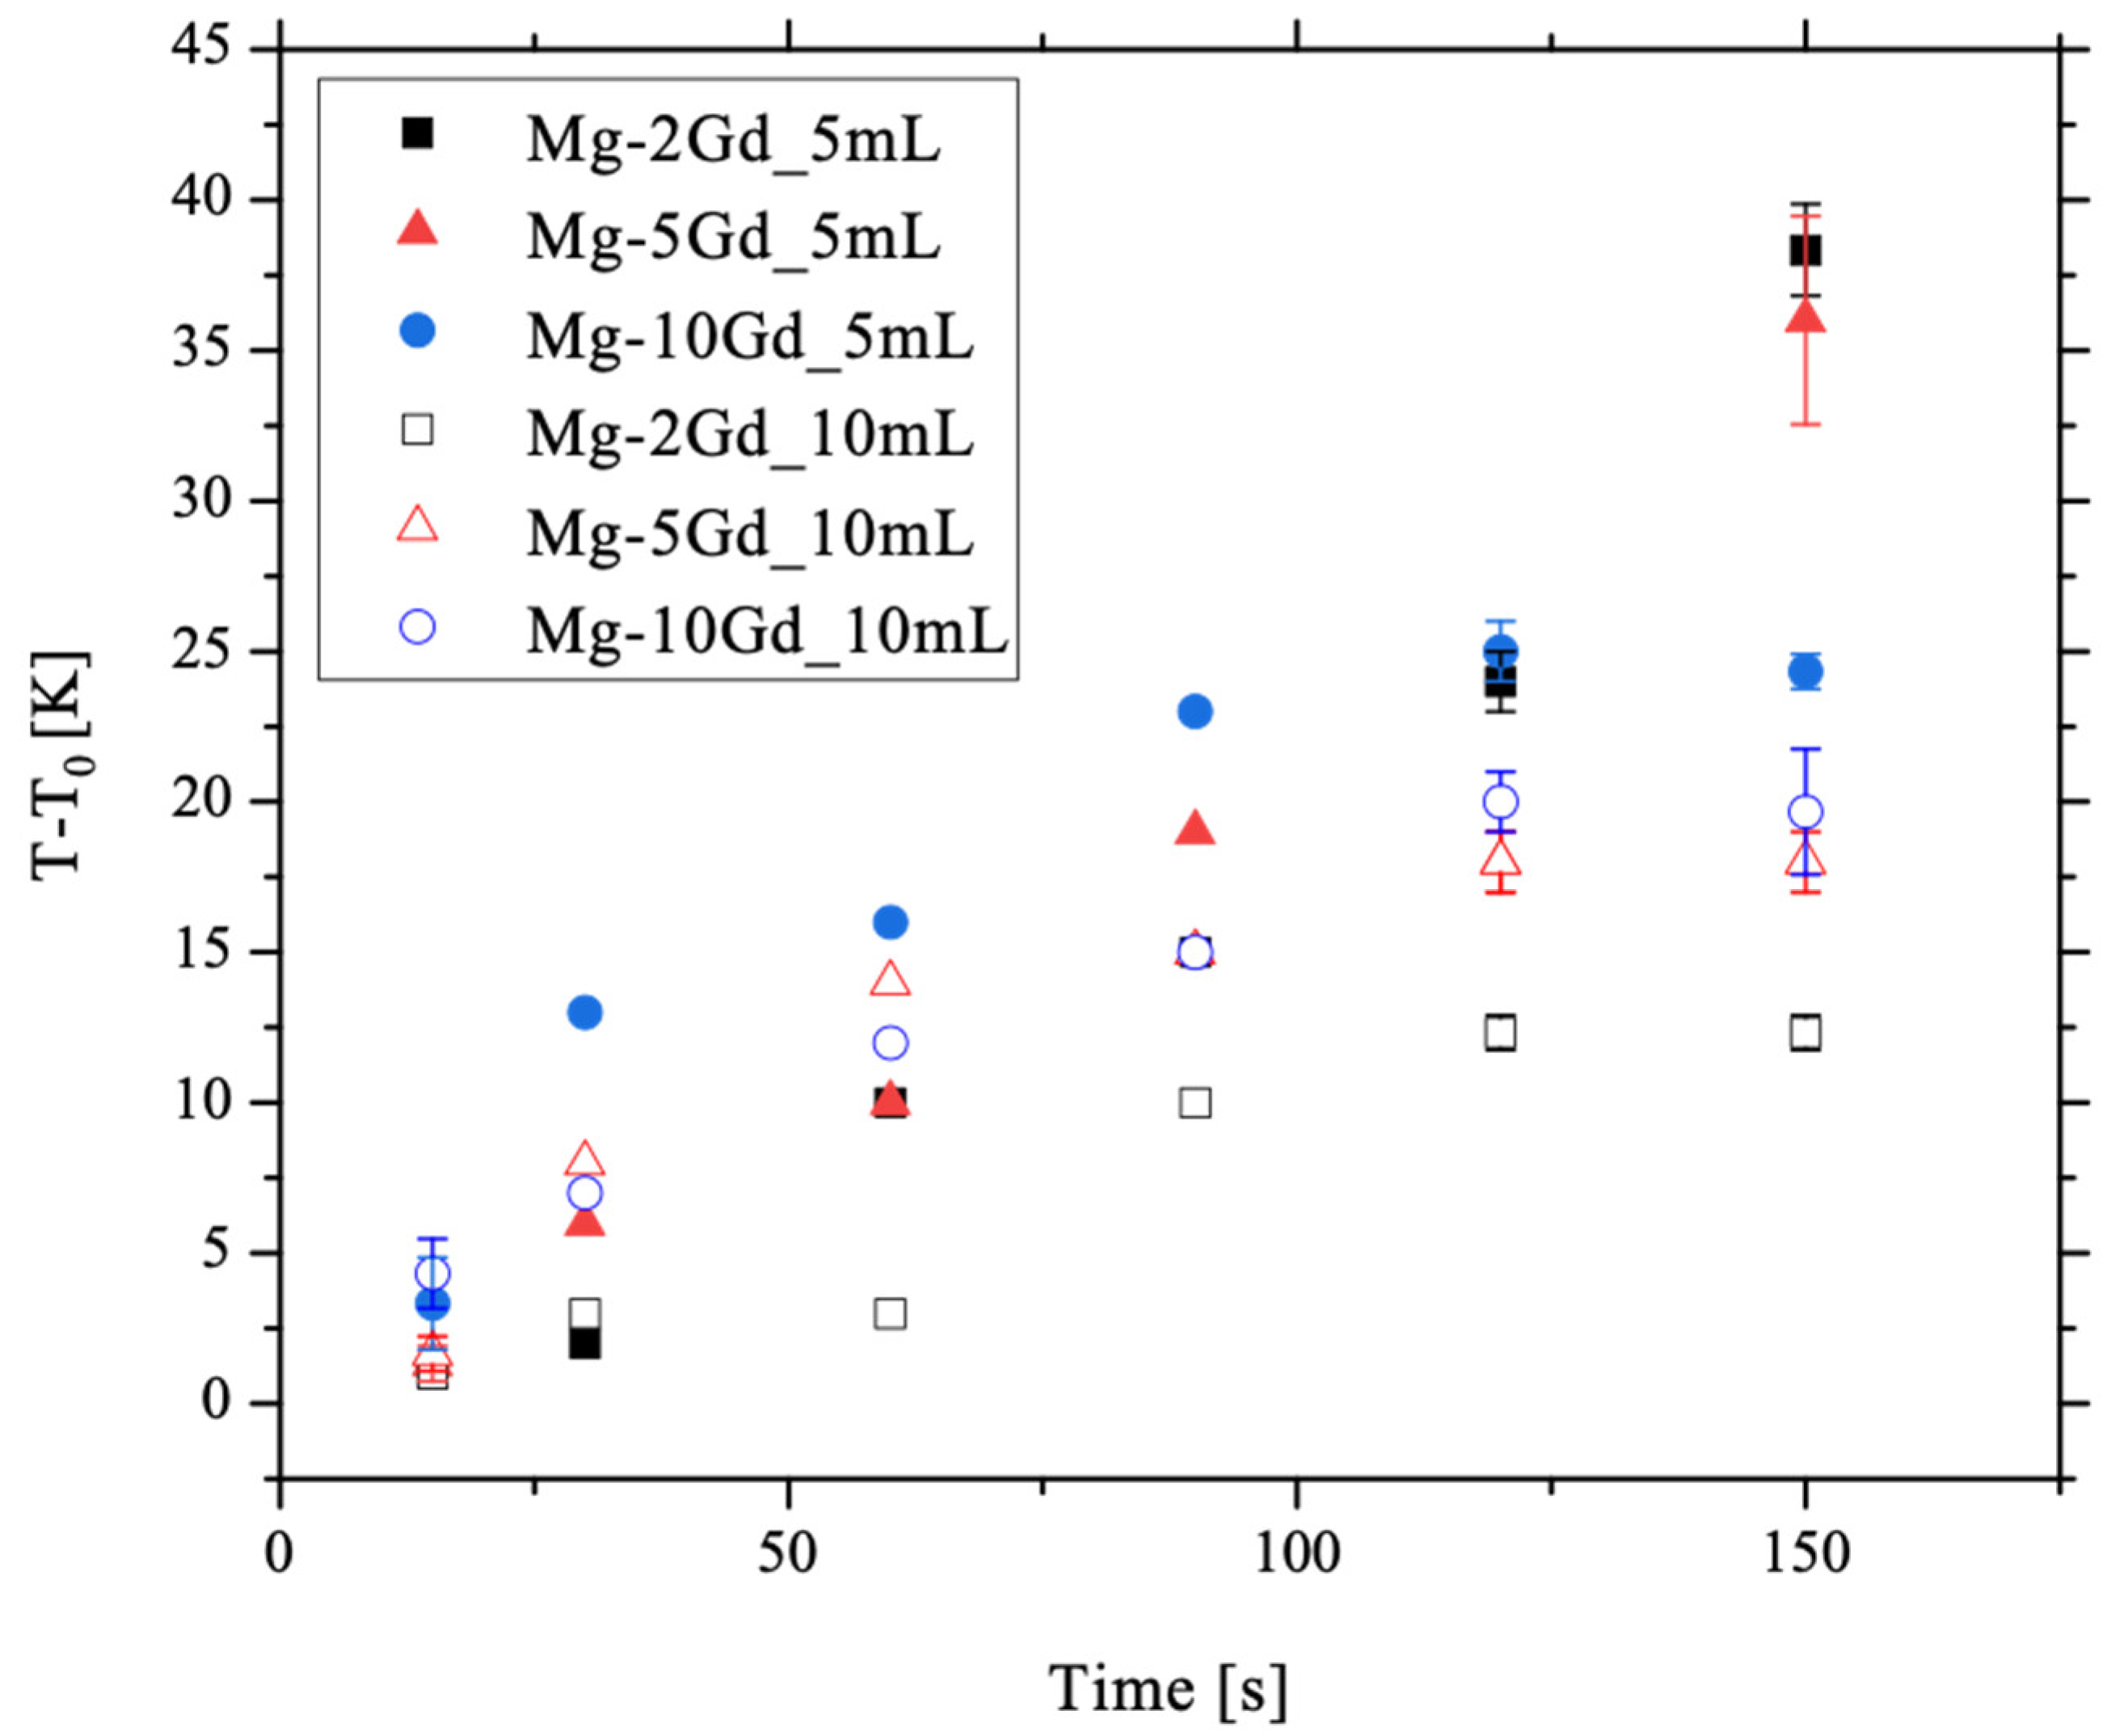
3.4. Temperature and pH
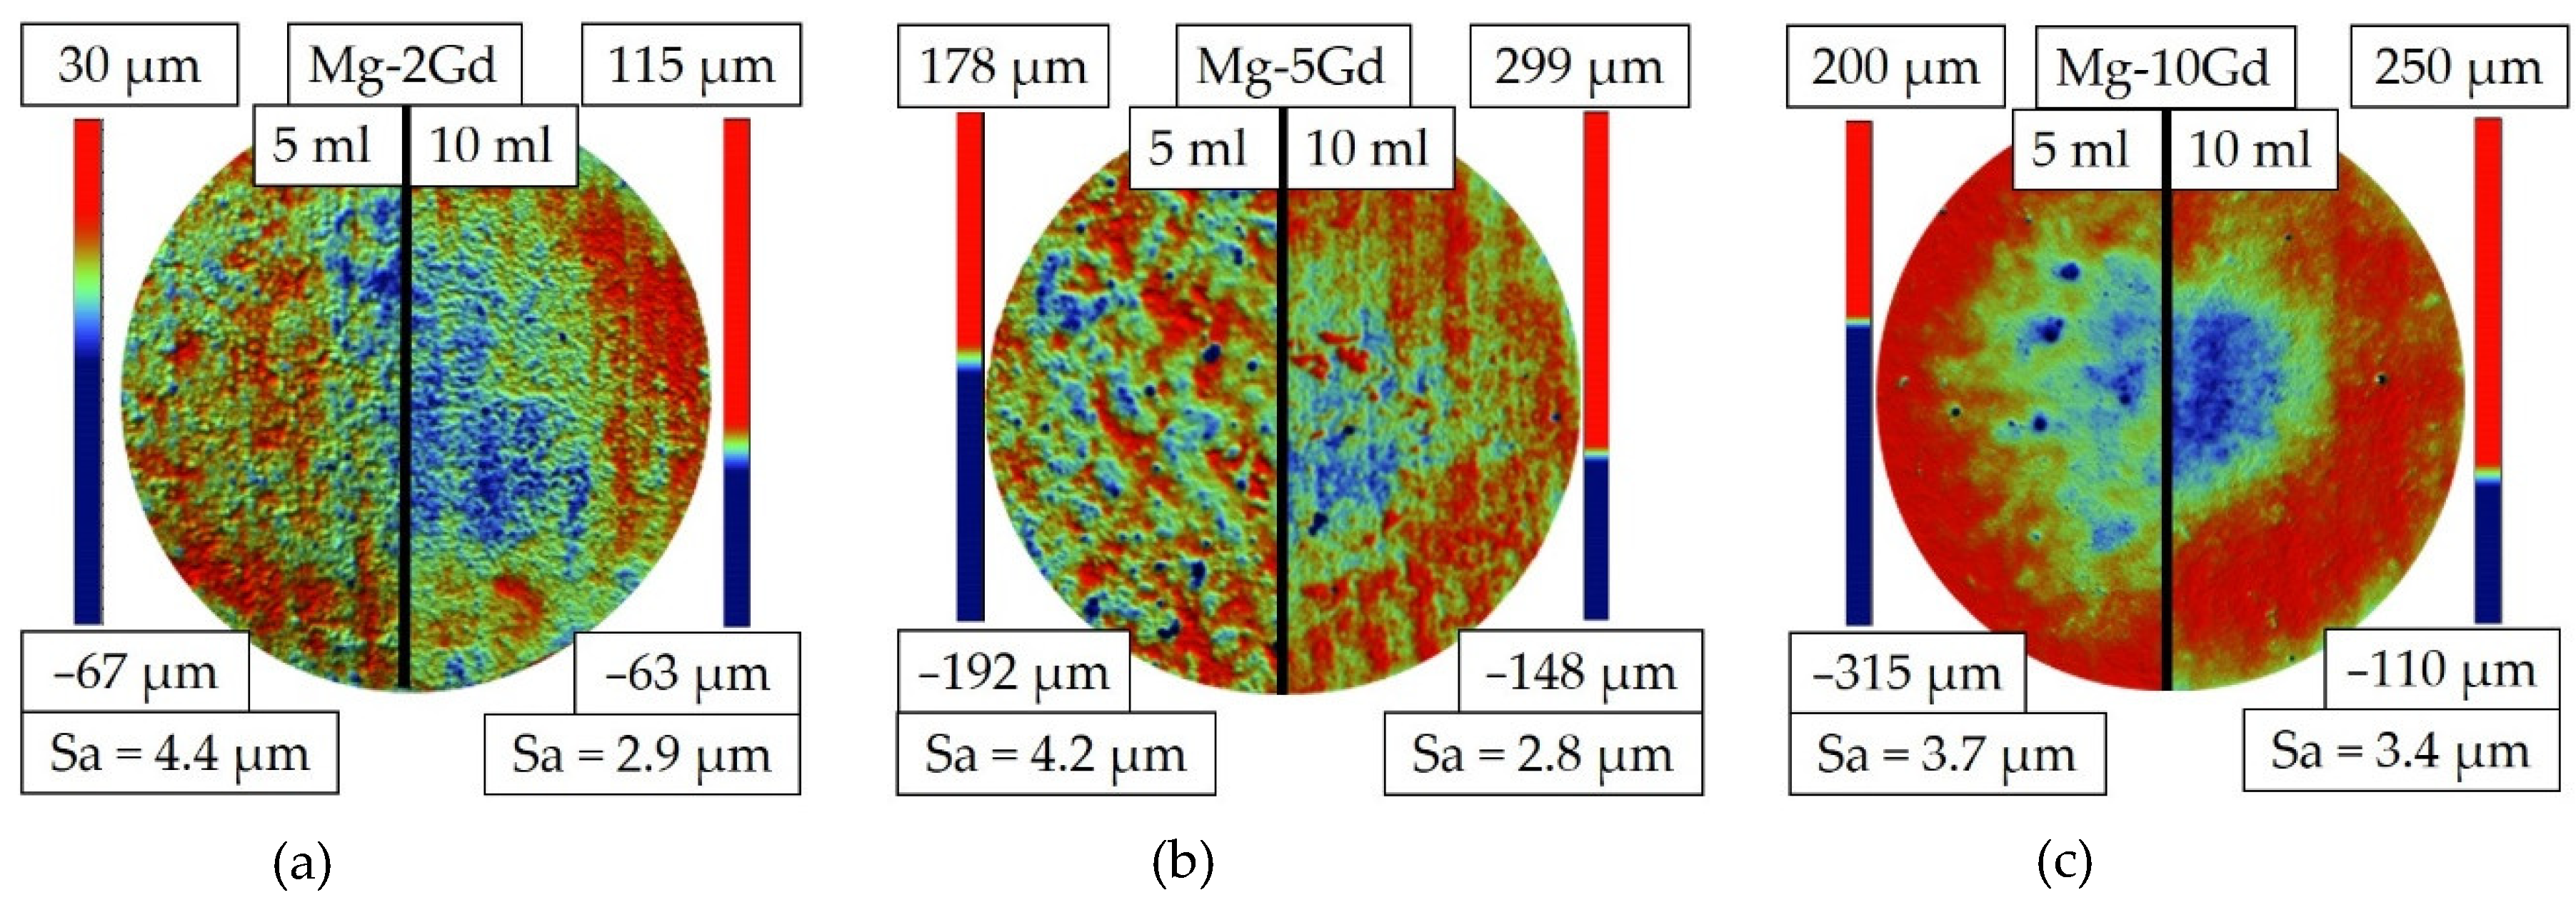
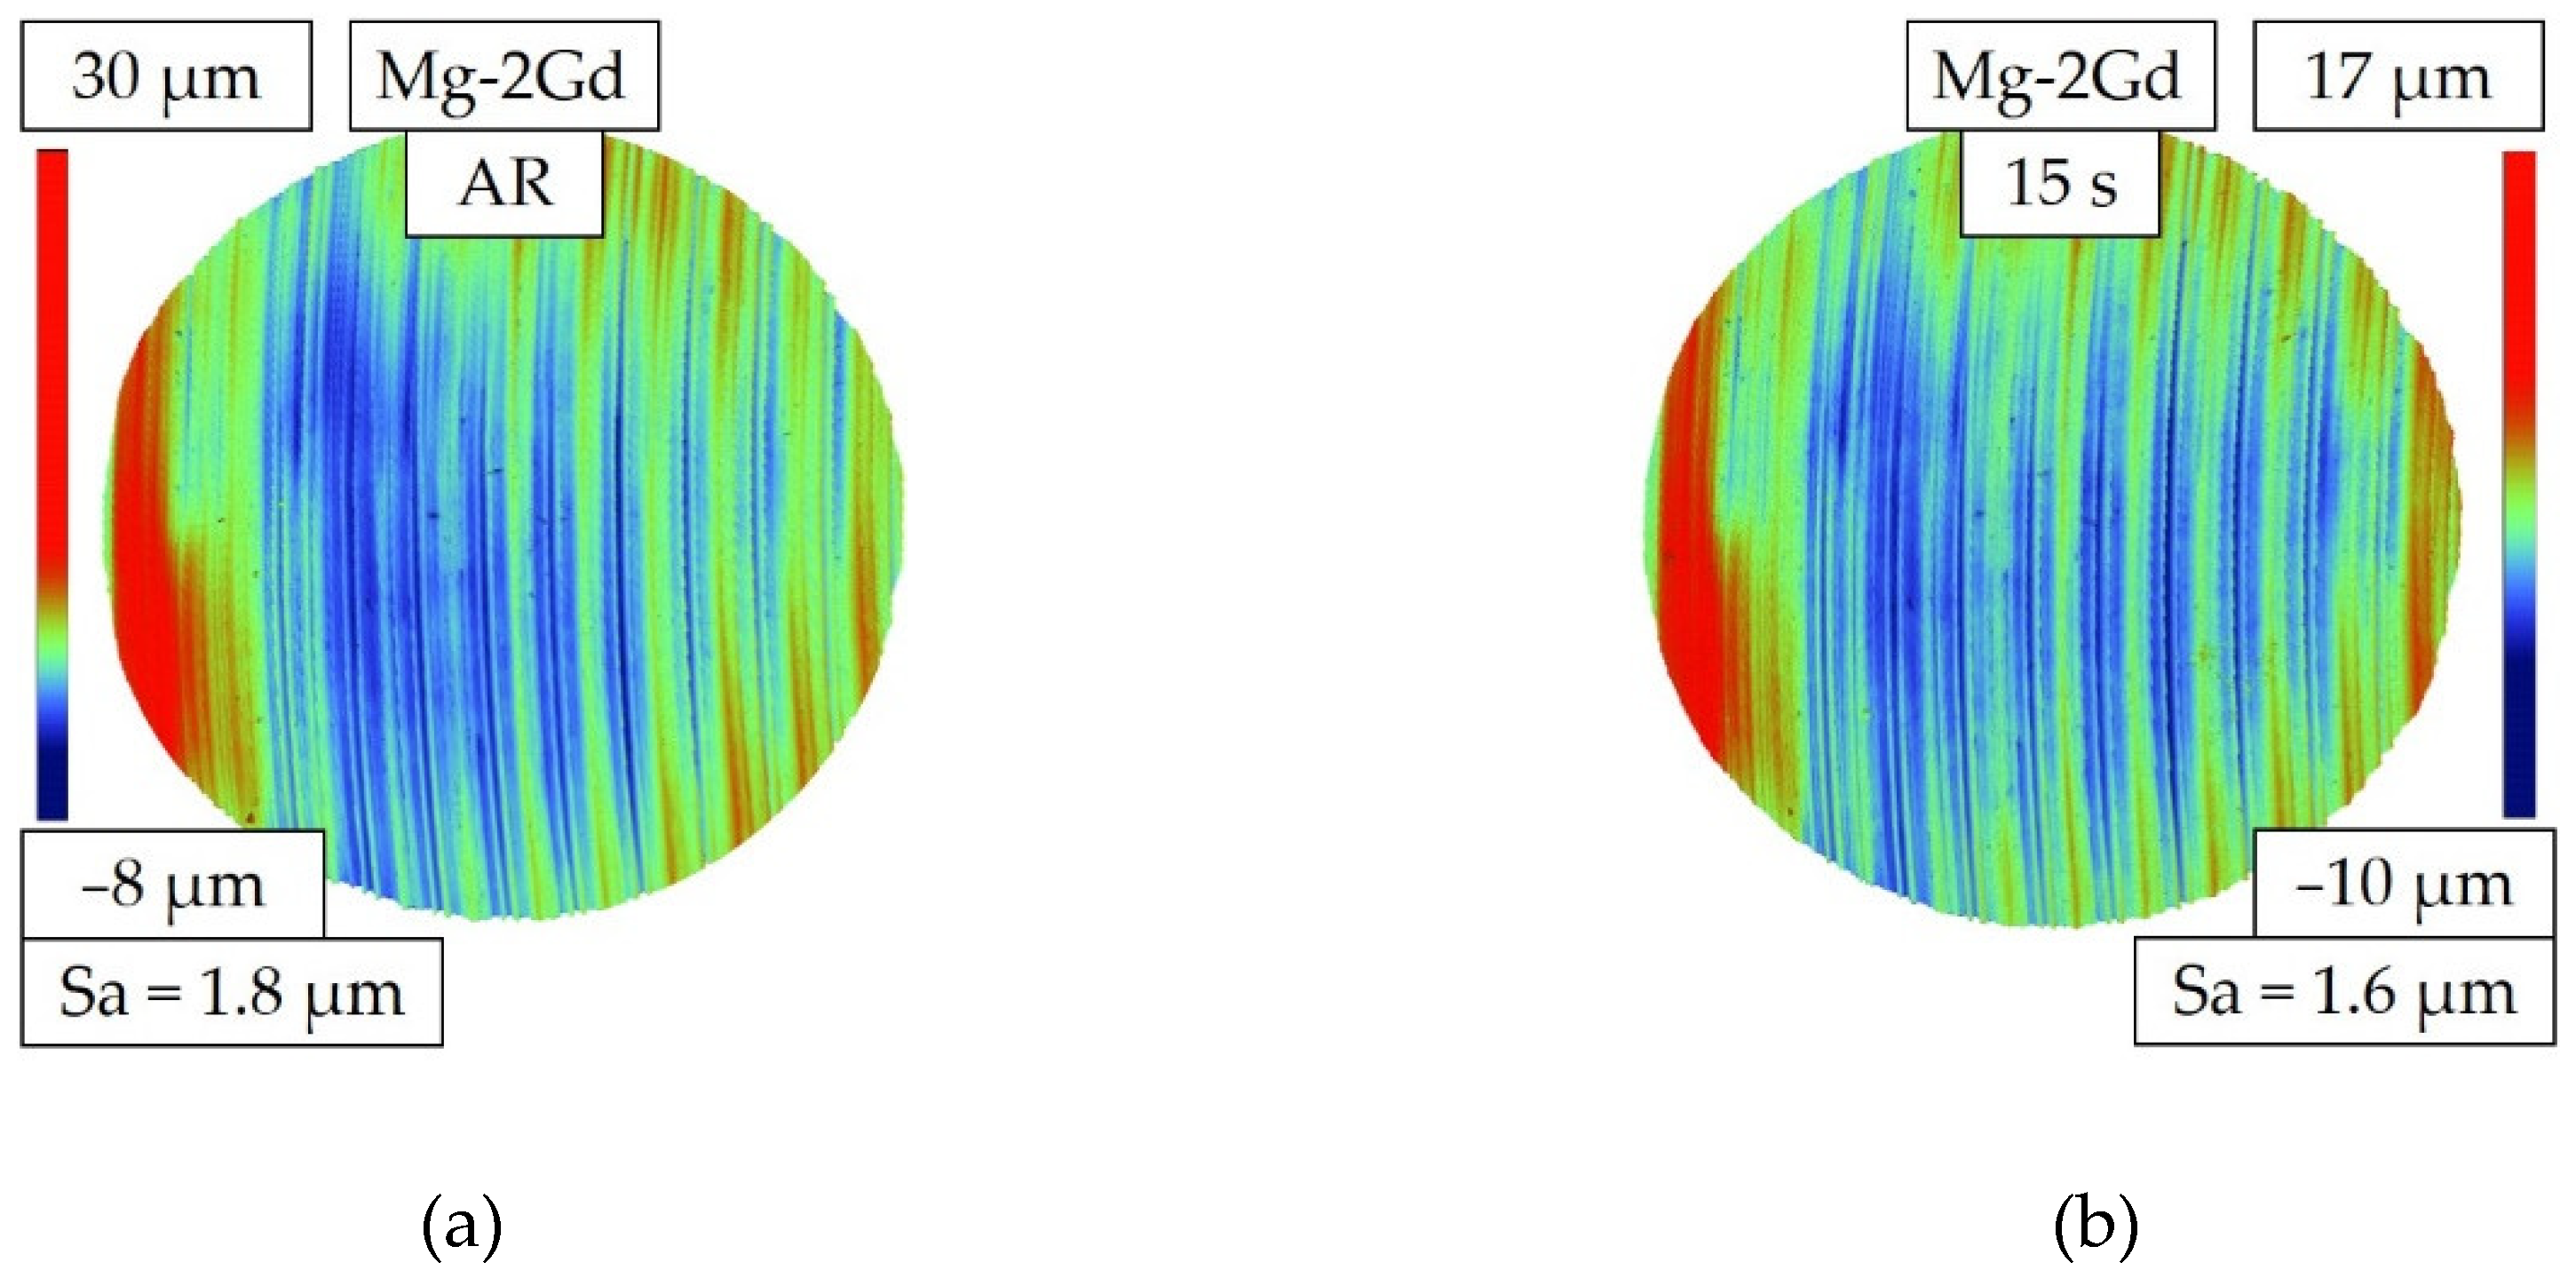
3.5. Interferometry
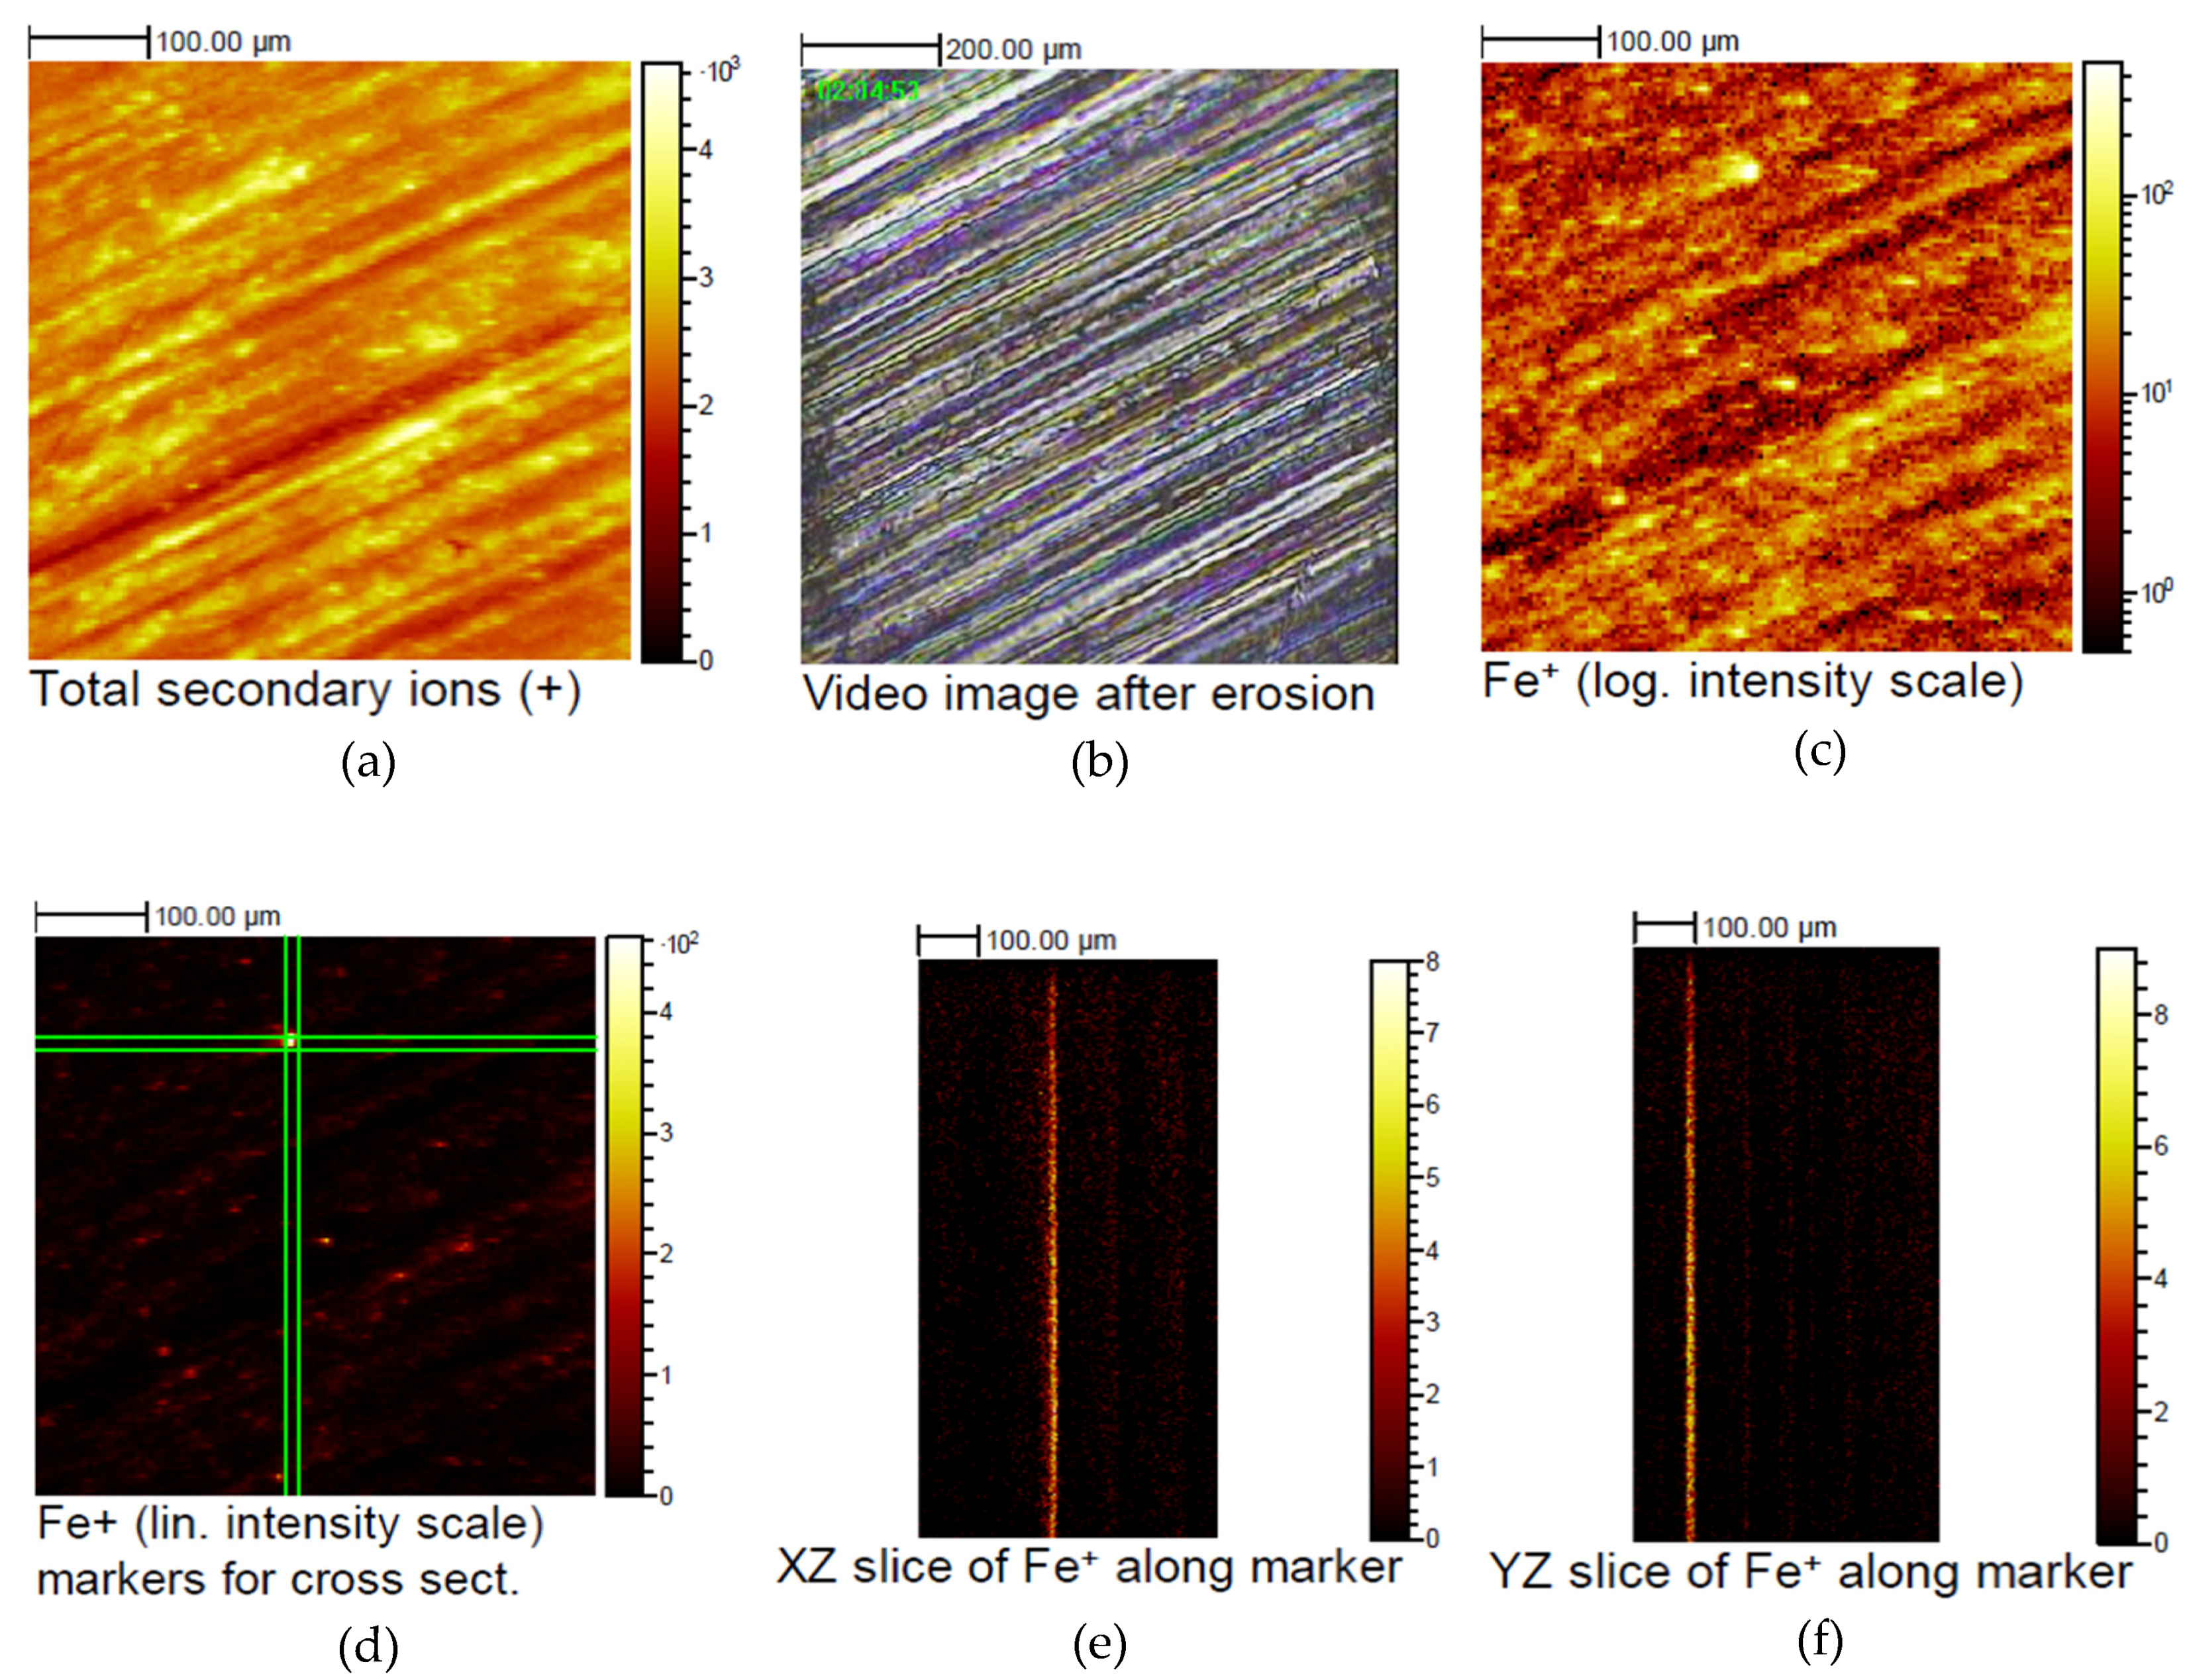
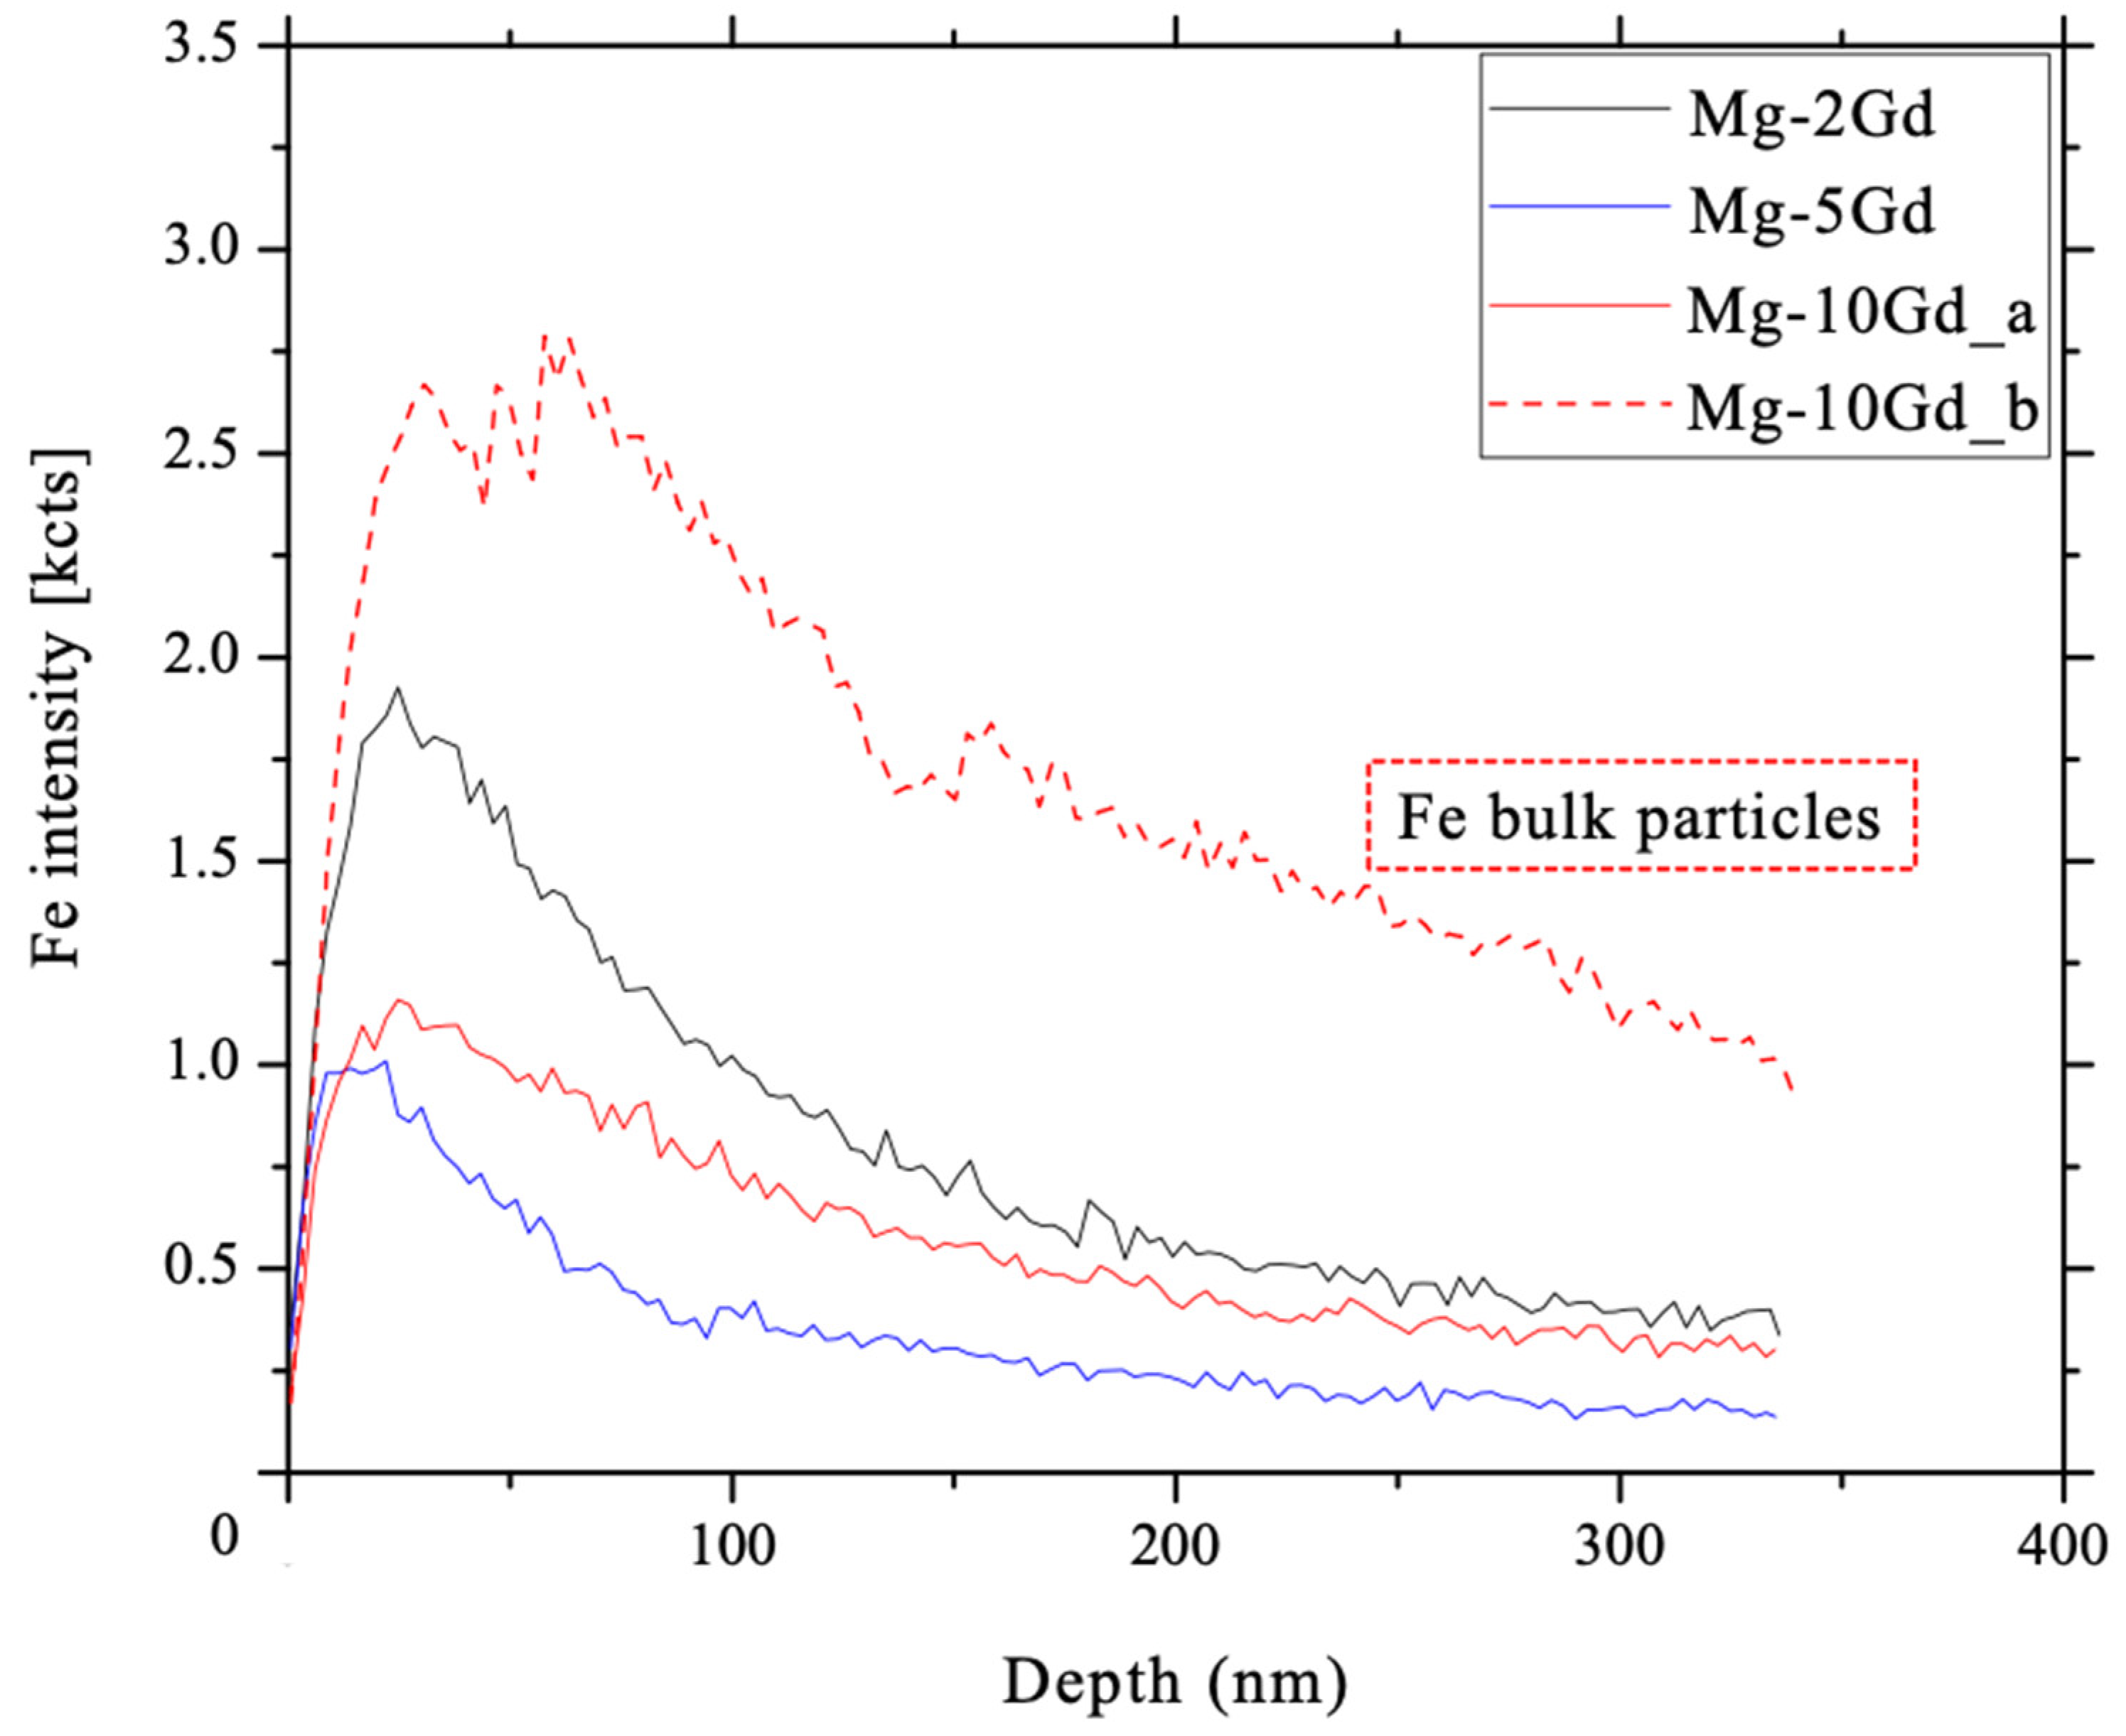
3.6. ToF-SIMS
4. Discussion
5. Conclusions
- Short etching durations like 15 s induce no pit formation and are suitable for smooth surfaces like rolled sheets.
- Rougher surfaces are generated by use of longer etching time of 150 s or an etching volume of 5 mL instead of 10 mL and can encourage cell adhesion.
- HAc is capable to reliably remove surface contaminations like Fe after 15 s and 150 s, which is why a minor material removal of 2–9 µm is sufficient. According to previous reported research, material removal can reduce the scatter of degradation results.
- The removal of deformed material from processing is enabled by use of higher etching time. The deformation depth depends on the amount of Gd.
- Different etching kinetics are expected from deformed to non-deformed microstructure, which are regulated by the heat dissipation into the environment.
- The number of Gd rich particles is not the leading reason for pitting, but Gd particles and twins act as an initiator for pit forming, caused by an increase in temperature. The temperature of the exothermic reaction has the highest impact on pit formation.
Author Contributions
Funding
Acknowledgments
Conflicts of Interest
References
- Mao, L.; Shen, L.; Chen, J.; Zhang, X.; Kwak, M.; Wu, Y.; Fan, R.; Zhang, L.; Pei, J.; Yuan, G.; et al. A promising biodegradable magnesium alloy suitable for clinical vascular stent application. Sci. Rep. 2017, 7, 46343. [Google Scholar] [CrossRef] [PubMed]
- Persaud-Sharma, D.; McGoron, A. Biodegradable Magnesium Alloys: A Review of Material Development and Applications. J. Biomim. Biomater. Tissue Eng. 2012, 12, 25–39. [Google Scholar] [CrossRef] [PubMed]
- Witte, F.; Hort, N.; Vogt, C.; Cohen, S.; Kainer, K.U.; Willumeit, R.; Feyerabend, F. Degradable biomaterials based on magnesium corrosion. Curr. Opin. Solid State Mater. Sci. 2008, 12, 63–72. [Google Scholar] [CrossRef]
- Witte, F.; Kaese, V.; Haferkamp, H.; Switzer, E.; Meyer-Lindenberg, A.; Wirth, C.J.; Windhagen, H. In vivo corrosion of four magnesium alloys and the associated bone response. Biomaterials 2005, 26, 3557–3563. [Google Scholar] [CrossRef] [PubMed]
- Galli, S.; Stocchero, M.; Andersson, M.; Karlsson, J.; He, W.; Lilin, T.; Wennerberg, A.; Jimbo, R. The effect of magnesium on early osseointegration in osteoporotic bone: A histological and gene expression investigation. Osteoporos. Int. 2017, 28, 2195–2205. [Google Scholar] [CrossRef] [PubMed]
- Castellani, C.; Lindtner, R.A.; Hausbrandt, P.; Tschegg, E.; Stanzl-Tschegg, S.E.; Zanoni, G.; Beck, S.; Weinberg, A.-M. Bone–implant interface strength and osseointegration: Biodegradable magnesium alloy versus standard titanium control. Acta Biomater. 2011, 7, 432–440. [Google Scholar] [CrossRef] [PubMed]
- Liu, C.; Ren, Z.; Xu, Y.; Pang, S.; Zhao, X.; Zhao, Y. Biodegradable Magnesium Alloys Developed as Bone Repair Materials: A Review. Scanning 2018, 2018, 15. [Google Scholar] [CrossRef] [PubMed]
- Feyerabend, F.; Wendel, H.-P.; Mihailova, B.; Heidrich, S.; Agha, N.A.; Bismayer, U.; Willumeit-Römer, R. Blood compatibility of magnesium and its alloys. Acta Biomater. 2015, 25, 384–394. [Google Scholar] [CrossRef]
- Feyerabend, F.; Fischer, J.; Holtz, J.; Witte, F.; Willumeit, R.; Drücker, H.; Vogt, C.; Hort, N. Evaluation of short-term effects of rare earth and other elements used in magnesium alloys on primary cells and cell lines. Acta Biomater. 2010, 6, 1834–1842. [Google Scholar] [CrossRef]
- Li, J.; Tan, L.; Wan, P.; Yu, X.; Yang, K. Study on microstructure and properties of extruded Mg–2Nd–0.2Zn alloy as potential biodegradable implant material. Mater. Sci. Eng. C 2015, 49, 422–429. [Google Scholar] [CrossRef]
- Hort, N.; Huang, Y.; Fechner, D.; Störmer, M.; Blawert, C.; Witte, F.; Vogt, C.; Drücker, H.; Willumeit, R.; Kainer, K.U. Magnesium alloys as implant materials—Principles of property design for Mg–RE alloys. Acta Biomater. 2010, 6, 1714–1725. [Google Scholar] [CrossRef] [PubMed]
- Rokhlin, L.L. Magnesium Alloys Containing Rare Earth Metals: Structure and Properties; Advances in Metallic Alloys; Taylor & Francis: London, UK; New York, NY, USA, 2003; ISBN 978-0-415-28414-1. [Google Scholar]
- Hamdy Makhlouf, A.S.; Hussien, H.M. Deposition, Characterization and Electrochemical Properties of Permanganate-Based Coating Treatments Over ZE41 Mg-Zn-Rare Earth Alloy. Int. J. Electrochem. Sci. 2013, 8, 11386–11402. [Google Scholar]
- Hamdy Makhlouf, A.S.; Hussien, H.M. The effect of solution pH of permanganate coating on the electrochemical characteristics of ZE41 magnesium alloy in chloride media. Int. J. Electrochem. Sci. 2014, 9, 2682–2695. [Google Scholar]
- Hamdy Makhlouf, A.S. Intelligent Stannate-Based Coatings of Self-Healing Functionality for Magnesium Alloys. In Intelligent Coatings for Corrosion Control; Tiwari, A., Rawlins, J., Hihara, L.H., Eds.; Butterworth-Heinemann: Boston, MA, USA, 2015; pp. 537–555. ISBN 978-0-12-411467-8. [Google Scholar]
- Hamdy, A.S.; Doench, I.; Möhwald, H. Vanadia-based coatings of self-repairing functionality for advanced magnesium Elektron ZE41 Mg–Zn–rare earth alloy. Surf. Coat. Technol. 2012, 206, 3686–3692. [Google Scholar] [CrossRef]
- Hamdy, A.S.; Doench, I.; Möhwald, H. Assessment of a one-step intelligent self-healing vanadia protective coatings for magnesium alloys in corrosive media. Electrochim. Acta 2011, 56, 2493–2502. [Google Scholar] [CrossRef]
- Hamdy, A.S.; Butt, D.P. Corrosion mitigation of rare-earth metals containing magnesium EV31A-T6 alloy via chrome-free conversion coating treatment. Electrochim. Acta 2013, 108, 852–859. [Google Scholar] [CrossRef]
- Peng, Q.; Huang, Y.; Meng, J.; Li, Y.; Kainer, K.U. Strain induced GdH2 precipitate in Mg–Gd based alloys. Intermetallics 2011, 19, 382–389. [Google Scholar] [CrossRef]
- Huang, Y.; Yang, L.; You, S.; Gan, W.; Kainer, K.U.; Hort, N. Unexpected formation of hydrides in heavy rare earth containing magnesium alloys. J. Magnes. Alloy. 2016, 4, 173–180. [Google Scholar] [CrossRef]
- Zhu, S.M.; Nie, J.F.; Gibson, M.A.; Easton, M.A. On the unexpected formation of rare earth hydrides in magnesium–rare earth casting alloys. Scr. Mater. 2014, 77, 21–24. [Google Scholar] [CrossRef]
- Yang, L.; Feyerabend, F.; Kainer, K.U.; Willumeit, R.; Hort, N. Corrosion Behavior of As-Cast Binary Mg-Dy Alloys. Mater. Sci. Forum 2011, 690, 417–421. [Google Scholar] [CrossRef]
- Yang, L.; Huang, Y.; Peng, Q.; Feyerabend, F.; Kainer, K.U.; Willumeit, R.; Hort, N. Mechanical and corrosion properties of binary Mg–Dy alloys for medical applications. Mater. Sci. Eng. B 2011, 176, 1827–1834. [Google Scholar] [CrossRef]
- Yang, L.; Huang, Y.; Feyerabend, F.; Willumeit, R.; Kainer, K.U.; Hort, N. Influence of ageing treatment on microstructure, mechanical and bio-corrosion properties of Mg–Dy alloys. J. Mech. Behav. Biomed. Mater. 2012, 13, 36–44. [Google Scholar] [CrossRef] [PubMed]
- Yang, L.; Hort, N.; Laipple, D.; Höche, D.; Huang, Y.; Kainer, K.U.; Willumeit, R.; Feyerabend, F. Element distribution in the corrosion layer and cytotoxicity of alloy Mg–10Dy during in vitro biodegradation. Acta Biomater. 2013, 9, 8475–8487. [Google Scholar] [CrossRef] [PubMed]
- Yang, L.; Huang, Y.; Feyerabend, F.; Willumeit, R.; Mendis, C.; Kainer, K.U.; Hort, N. Microstructure, mechanical and corrosion properties of Mg–Dy–Gd–Zr alloys for medical applications. Acta Biomater. 2013, 9, 8499–8508. [Google Scholar] [CrossRef] [PubMed]
- Willumeit-Römer, R.; Moosmann, J.; Zeller-Plumhoff, B.; Florian Wieland, D.C.; Krüger, D.; Wiese, B.; Wennerberg, A.; Peruzzi, N.; Galli, S.; Beckmann, F.; et al. Visualization of Implant Failure by Synchrotron Tomography. In TMS 2018 147th Annual Meeting & Exhibition Supplemental Proceedings; The Minerals, Metals & Materials Society, Ed.; Springer: Cham, Switzerland, 2018; pp. 275–284. ISBN 978-3-319-72525-3. [Google Scholar]
- Moosmann, J.; Zeller-Plumhoff, B.; Florian Wieland, D.C.; Galli, S.; Krüger, D.; Dose, T.; Burmester, H.; Wilde, F.; Bech, M.; Peruzzi, N.; et al. Biodegradable magnesium-based implants in bone studied by synchrotron radiation microtomography. In Proceedings of the Developments in X-Ray Tomography XI; Müller, B., Wang, G., Eds.; SPIE: San Diego, CA, USA, 2017. [Google Scholar]
- Galli, S.; Hammel, J.U.; Herzen, J.; Damm, T.; Jimbo, R.; Beckmann, F.; Wennerberg, A.; Willumeit-Römer, R. Evaluation of the degradation behavior of resorbable metal implants for in vivo osteosynthesis by synchrotron radiation based X-ray tomography and histology. In Developments in X-Ray Tomography X; Stock, S.R., Müller, B., Wang, G., Eds.; SPIE: San Diego, CA, USA, 2016. [Google Scholar]
- Song, G.-L.; Xu, Z. The surface, microstructure and corrosion of magnesium alloy AZ31 sheet. Electrochim. Acta 2010, 55, 4148–4161. [Google Scholar] [CrossRef]
- Nwaogu, U.C.; Blawert, C.; Scharnagl, N.; Dietzel, W.; Kainer, K.U. Effects of organic acid pickling on the corrosion resistance of magnesium alloy AZ31 sheet. Corros. Sci. 2010, 52, 2143–2154. [Google Scholar] [CrossRef]
- Nwaogu, U.C.; Blawert, C.; Scharnagl, N.; Dietzel, W.; Kainer, K.U. Influence of inorganic acid pickling on the corrosion resistance of magnesium alloy AZ31 sheet. Corros. Sci. 2009, 51, 2544–2556. [Google Scholar] [CrossRef]
- Gray-Munro, J.E.; Seguin, C.; Strong, M. Influence of surface modification on the in vitro corrosion rate of magnesium alloy AZ31. J. Biomed. Mater. Res. Part A 2009, 91A, 221–230. [Google Scholar] [CrossRef]
- Höche, D.; Blawert, C.; Lamaka, S.V.; Scharnagl, N.; Mendis, C.; Zheludkevich, M.L. The effect of iron re-deposition on the corrosion of impurity-containing magnesium. Phys. Chem. Chem. Phys. 2016, 18, 1279–1291. [Google Scholar] [CrossRef]
- Denkena, B.; Lucas, A. Biocompatible Magnesium Alloys as Absorbable Implant Materials—Adjusted Surface and Subsurface Properties by Machining Processes. CIRP Ann. Manuf. Technol. 2007, 56, 113–116. [Google Scholar] [CrossRef]
- Denkena, B.; Lucas, A.; Thorey, F.; Waizy, H.; Angrisani, N.; Meyer-Lindenberg, A. Biocompatible Magnesium Alloys as Degradable Implant Materials—Machining Induced Surface and Subsurface Properties and Implant Performance. In Special Issues on Magnesium Alloys; Monteiro, W.A., Ed.; InTech: London, UK, 2011; ISBN 978-953-307-391-0. [Google Scholar]
- Kaynak, Y.; Lu, T.; Jawahir, I.S. Cryogenic Machining-Induced Surface Integrity: A Review and Comparison with Dry, MQL, and Flood-Cooled Machining. Mach. Sci. Technol. 2014, 18, 149–198. [Google Scholar] [CrossRef]
- Liu, Y.; Liu, D.; You, C.; Chen, M. Effects of grain size on the corrosion resistance of pure magnesium by cooling rate-controlled solidification. Front. Mater. Sci. 2015, 9, 247–253. [Google Scholar] [CrossRef]
- Ahmadkhaniha, D.; Fedel, M.; Heydarzadeh Sohi, M.; Deflorian, F. Corrosion behavior of severely plastic deformed magnesium based alloys: A review. Surf. Eng. Appl. Electrochem. 2017, 53, 439–448. [Google Scholar] [CrossRef]
- Pu, Z.; Outeiro, J.C.; Batista, A.C.; Dillon, O.W.; Puleo, D.A.; Jawahir, I.S. Enhanced surface integrity of AZ31B Mg alloy by cryogenic machining towards improved functional performance of machined components. Int. J. Mach. Tools Manuf. 2012, 56, 17–27. [Google Scholar] [CrossRef]
- Marchkesbery, W.R.; Ehmann, W.D.; Hossain, T.I.M.; Alauddin, M.; Goodin, D.T. Instrumental neutron activation analysis of brain aluminum in Alzheimer’s disease and aging. Ann. Neurol. 1981, 10, 511–516. [Google Scholar] [CrossRef] [PubMed]
- Crapper, D.R.; Krishnan, S.S.; Quittkat, S. Aluminium, neurofibrillary degeneration and alzheimer’s disease. Brain 1976, 99, 67–80. [Google Scholar] [CrossRef]
- Mirza, A.; King, A.; Troakes, C.; Exley, C. Aluminium in brain tissue in familial Alzheimer’s’s disease. J. Trace Elem. Med. Biol. 2017, 40, 30–36. [Google Scholar] [CrossRef]
- Tomljenovic, L. Aluminum and Alzheimer’s Disease: After a Century of Controversy, Is there a Plausible Link? J. Alzheimers Dis. 2011, 23, 567–598. [Google Scholar] [CrossRef]
- Gawlik, M.M.; Steiner, M.; Wiese, B.; González, J.; Feyerabend, F.; Dahms, M.; Ebel, T.; Willumeit-Römer, R. The effects of HAc etching on the degradation behavior of Mg-5Gd. J. Med. Mater. Technol. 2017, 1, 22–25. [Google Scholar]
- Supplit, R.; Koch, T.; Schubert, U. Evaluation of the anti-corrosive effect of acid pickling and sol–gel coating on magnesium AZ31 alloy. Corros. Sci. 2007, 49, 3015–3023. [Google Scholar] [CrossRef]
- Harmuth, J.; Wiese, B.; Bohlen, J.; Ebel, T.; Willumeit-Römer, R. Tailoring of Material Properties of Mg-Gd Alloys for Biomedical Applications. In Magnesium 2018: Proceedings of the 11th International Conference on Magnesium Alloys and Their Applications; Brunel University: London, UK, 2018; ISBN 978-1-908549-37-2. [Google Scholar]
- Characterisation of Areal Surface Texture; Leach, R. (Ed.) Springer: Berlin/Heidelberg, Germany, 2013; ISBN 978-3-642-36457-0. [Google Scholar]
- Yamamura, Y.; Tawara, H. Energy dependence of ion-induced sputtering yields from monatomic solids at normal incidence. At. Data Nucl. Data Tables 1996, 62, 149–253. [Google Scholar] [CrossRef]
- Kubásek, J.; Vojtěch, D. Structural and corrosion characterization of biodegradable Mg–RE (RE = Gd, Y, Nd) alloys. Trans. Nonferrous Met. Soc. China 2013, 23, 1215–1225. [Google Scholar] [CrossRef]
- Askeland, D.R. Essentials of Materials Science and Engineering; Third Edition, SI.; Cengage Learning: Stamford, CT, USA, 2014; ISBN 978-1-111-57686-8. [Google Scholar]
- Lu, L.; Hu, S.; Liu, L.; Yin, Z. High speed cutting of AZ31 magnesium alloy. J. Magnes. Alloy. 2016, 4, 128–134. [Google Scholar] [CrossRef]
- Barnett, M.R. Twinning and the ductility of magnesium alloys. Mater. Sci. Eng. A 2007, 464, 1–7. [Google Scholar] [CrossRef]
- Aung, N.N.; Zhou, W. Effect of grain size and twins on corrosion behaviour of AZ31B magnesium alloy. Corros. Sci. 2010, 52, 589–594. [Google Scholar] [CrossRef]
- Alvarez-Lopez, M.; Pereda, M.D.; del Valle, J.A.; Fernandez-Lorenzo, M.; Garcia-Alonso, M.C.; Ruano, O.A.; Escudero, M.L. Corrosion behaviour of AZ31 magnesium alloy with different grain sizes in simulated biological fluids. Acta Biomater. 2010, 6, 1763–1771. [Google Scholar] [CrossRef] [PubMed]
- Birbilis, N.; Ralston, K.D.; Virtanen, S.; Fraser, H.L.; Davies, C.H.J. Grain character influences on corrosion of ECAPed pure magnesium. Corros. Eng. Sci. Technol. 2010, 45, 224–230. [Google Scholar] [CrossRef]
- Bergmann, W.; Leyens, C.; Fleck, C. Werkstofftechnik: Grundlagen und Anwendung. Teil 1: Grundlagen; Hanser: München, Germany, 2013; ISBN 978-3-446-43581-0. [Google Scholar]
- Merkel, M.; Thomas, K.-H. Taschenbuch der Werkstoffe; 7 Verbesserte Auflage; Fachbuchverlag Leipzig im Carl Hanser Verlag: München, Germany, 2008; ISBN 978-3-446-41194-4. [Google Scholar]
- Wang, B.J.; Xu, D.K.; Dong, J.H.; Ke, W. Effect of the crystallographic orientation and twinning on the corrosion resistance of an as-extruded Mg–3Al–1Zn (wt.%) bar. Scr. Mater. 2014, 88, 5–8. [Google Scholar] [CrossRef]
- Zou, G.; Peng, Q.; Wang, Y.; Liu, B. The effect of extension twinning on the electrochemical corrosion properties of Mg–Y alloys. J. Alloy. Compd. 2015, 618, 44–48. [Google Scholar] [CrossRef]
- Pawar, S.; Slater, T.J.A.; Burnett, T.L.; Zhou, X.; Scamans, G.M.; Fan, Z.; Thompson, G.E.; Withers, P.J. Crystallographic effects on the corrosion of twin roll cast AZ31 Mg alloy sheet. Acta Mater. 2017, 133, 90–99. [Google Scholar] [CrossRef]
- Frankel, G.S. Pitting Corrosion of Metals. J. Electrochem. Soc. 1998, 145, 2186. [Google Scholar] [CrossRef]
- Corrosion: Fundamentals, Testing and Prevention; ASM Handbook; ASM International; Cramer, S.D.; Covino, B.S., Jr. (Eds.) ASM International: Materials Park, OH, USA, 2003; ISBN 978-0-87170-705-5. [Google Scholar]
- Gawlik, M.; Wiese, B.; Desharnais, V.; Ebel, T.; Willumeit-Römer, R. The Effect of Surface Treatments on the Degradation of Biomedical Mg Alloys—A Review Paper. Materials 2018, 11, 2561. [Google Scholar] [CrossRef] [PubMed]
- Lorenz, C.; Brunner, J.G.; Kollmannsberger, P.; Jaafar, L.; Fabry, B.; Virtanen, S. Effect of surface pre-treatments on biocompatibility of magnesium. Acta Biomater. 2009, 5, 2783–2789. [Google Scholar] [CrossRef] [PubMed]
- Yoo, B.; Shin, K.R.; Hwang, D.Y.; Lee, D.H.; Shin, D.H. Effect of surface roughness on leakage current and corrosion resistance of oxide layer on AZ91 Mg alloy prepared by plasma electrolytic oxidation. Appl. Surf. Sci. 2010, 256, 6667–6672. [Google Scholar] [CrossRef]
- Walter, R.; Kannan, M.B.; He, Y.; Sandham, A. Effect of surface roughness on the in vitro degradation behaviour of a biodegradable magnesium-based alloy. Appl. Surf. Sci. 2013, 279, 343–348. [Google Scholar] [CrossRef]
- Hou, Y.; Li, Y.; Zhang, C.; Koizumi, Y.; Chiba, A. Effects of cold working on corrosion resistance of Co-modified Ni–16Cr–15Mo alloy in hydrofluoric acid solution. Corros. Sci. 2014, 89, 258–267. [Google Scholar] [CrossRef]
- McCafferty, E. Introduction to Corrosion Science; Springer: New York, NY, USA, 2010; ISBN 978-1-4419-0454-6. [Google Scholar]
- Chen, H.; Grassian, V.H. Iron Dissolution of Dust Source Materials during Simulated Acidic Processing: The Effect of Sulfuric, Acetic, and Oxalic Acids. Environ. Sci. Technol. 2013, 47, 10312–10321. [Google Scholar] [CrossRef] [PubMed]
- Allgemeines zur Pharmakologie der Metalle—Eisen—Mangan—Kobalt—Nickel; Heffter, A. (Ed.) Springer: Berlin/Heidelberg, Germany, 1934; ISBN 978-3-642-51955-0. [Google Scholar]


| Condition | Mg-2Gd | Mg-5Gd | Mg-10Gd |
|---|---|---|---|
| M after 15 s in 5 mL [µm] | 2.4 ± 0.4 | 3.6 ± 0.5 | 8.9 ± 0.9 |
| M after 150 s in 5 mL [µm] | 147.4 ± 5.0 | 206.3 ± 12.1 | 194.7 ± 9.4 |
| M after 150 s in 10 mL [µm] | 130.4 ± 7.2 | 179.3 ± 11.0 | 188.3 ± 4.9 |
| Element | 1 | 2 | 3 |
|---|---|---|---|
| Mg [wt.%] | 37.2 | 69.5 | 90.3 |
| Gd [wt.%] | 62.8 | 30.5 | 9.7 |
| Condition | Mg-2Gd | Mg-5Gd | Mg-10Gd |
|---|---|---|---|
| Δ pH after 15 s in 5 mL | 0.07 ± 0.06 | 0.00 ± 0.00 | 0.20 ± 0.10 |
| Δ pH after 150 s in 5 mL | 1.47 ± 0.12 | 1.40 ± 0.00 | 1.47 ± 0.06 |
| Δ pH after 150 s in 10 mL | 0.73 ± 0.12 | 0. 83 ± 0.06 | 1.00 ± 0.00 |
| Condition | Mg-2Gd | Mg-5Gd | Mg-10Gd |
|---|---|---|---|
| pits/mm2 for 5 mL | 2.66 ± 0.51 | 1.70 ± 1.11 | 0.99 ± 0.41 |
| pits/mm2 for 10 mL | 0.21 ± 0.30 | 0.20 ± 0.00 | 0.52 ± 0.46 |
© 2019 by the authors. Licensee MDPI, Basel, Switzerland. This article is an open access article distributed under the terms and conditions of the Creative Commons Attribution (CC BY) license (http://creativecommons.org/licenses/by/4.0/).
Share and Cite
Gawlik, M.M.; Wiese, B.; Welle, A.; González, J.; Desharnais, V.; Harmuth, J.; Ebel, T.; Willumeit-Römer, R. Acetic Acid Etching of Mg-xGd Alloys. Metals 2019, 9, 117. https://doi.org/10.3390/met9020117
Gawlik MM, Wiese B, Welle A, González J, Desharnais V, Harmuth J, Ebel T, Willumeit-Römer R. Acetic Acid Etching of Mg-xGd Alloys. Metals. 2019; 9(2):117. https://doi.org/10.3390/met9020117
Chicago/Turabian StyleGawlik, Marcjanna Maria, Björn Wiese, Alexander Welle, Jorge González, Valérie Desharnais, Jochen Harmuth, Thomas Ebel, and Regine Willumeit-Römer. 2019. "Acetic Acid Etching of Mg-xGd Alloys" Metals 9, no. 2: 117. https://doi.org/10.3390/met9020117
APA StyleGawlik, M. M., Wiese, B., Welle, A., González, J., Desharnais, V., Harmuth, J., Ebel, T., & Willumeit-Römer, R. (2019). Acetic Acid Etching of Mg-xGd Alloys. Metals, 9(2), 117. https://doi.org/10.3390/met9020117