Influence of Na2CO3 and K2CO3 Addition on Iron Grain Growth during Carbothermic Reduction of Red Mud

 ,
,  ,
, 
Abstract
1. Introduction
2. Materials and Methods
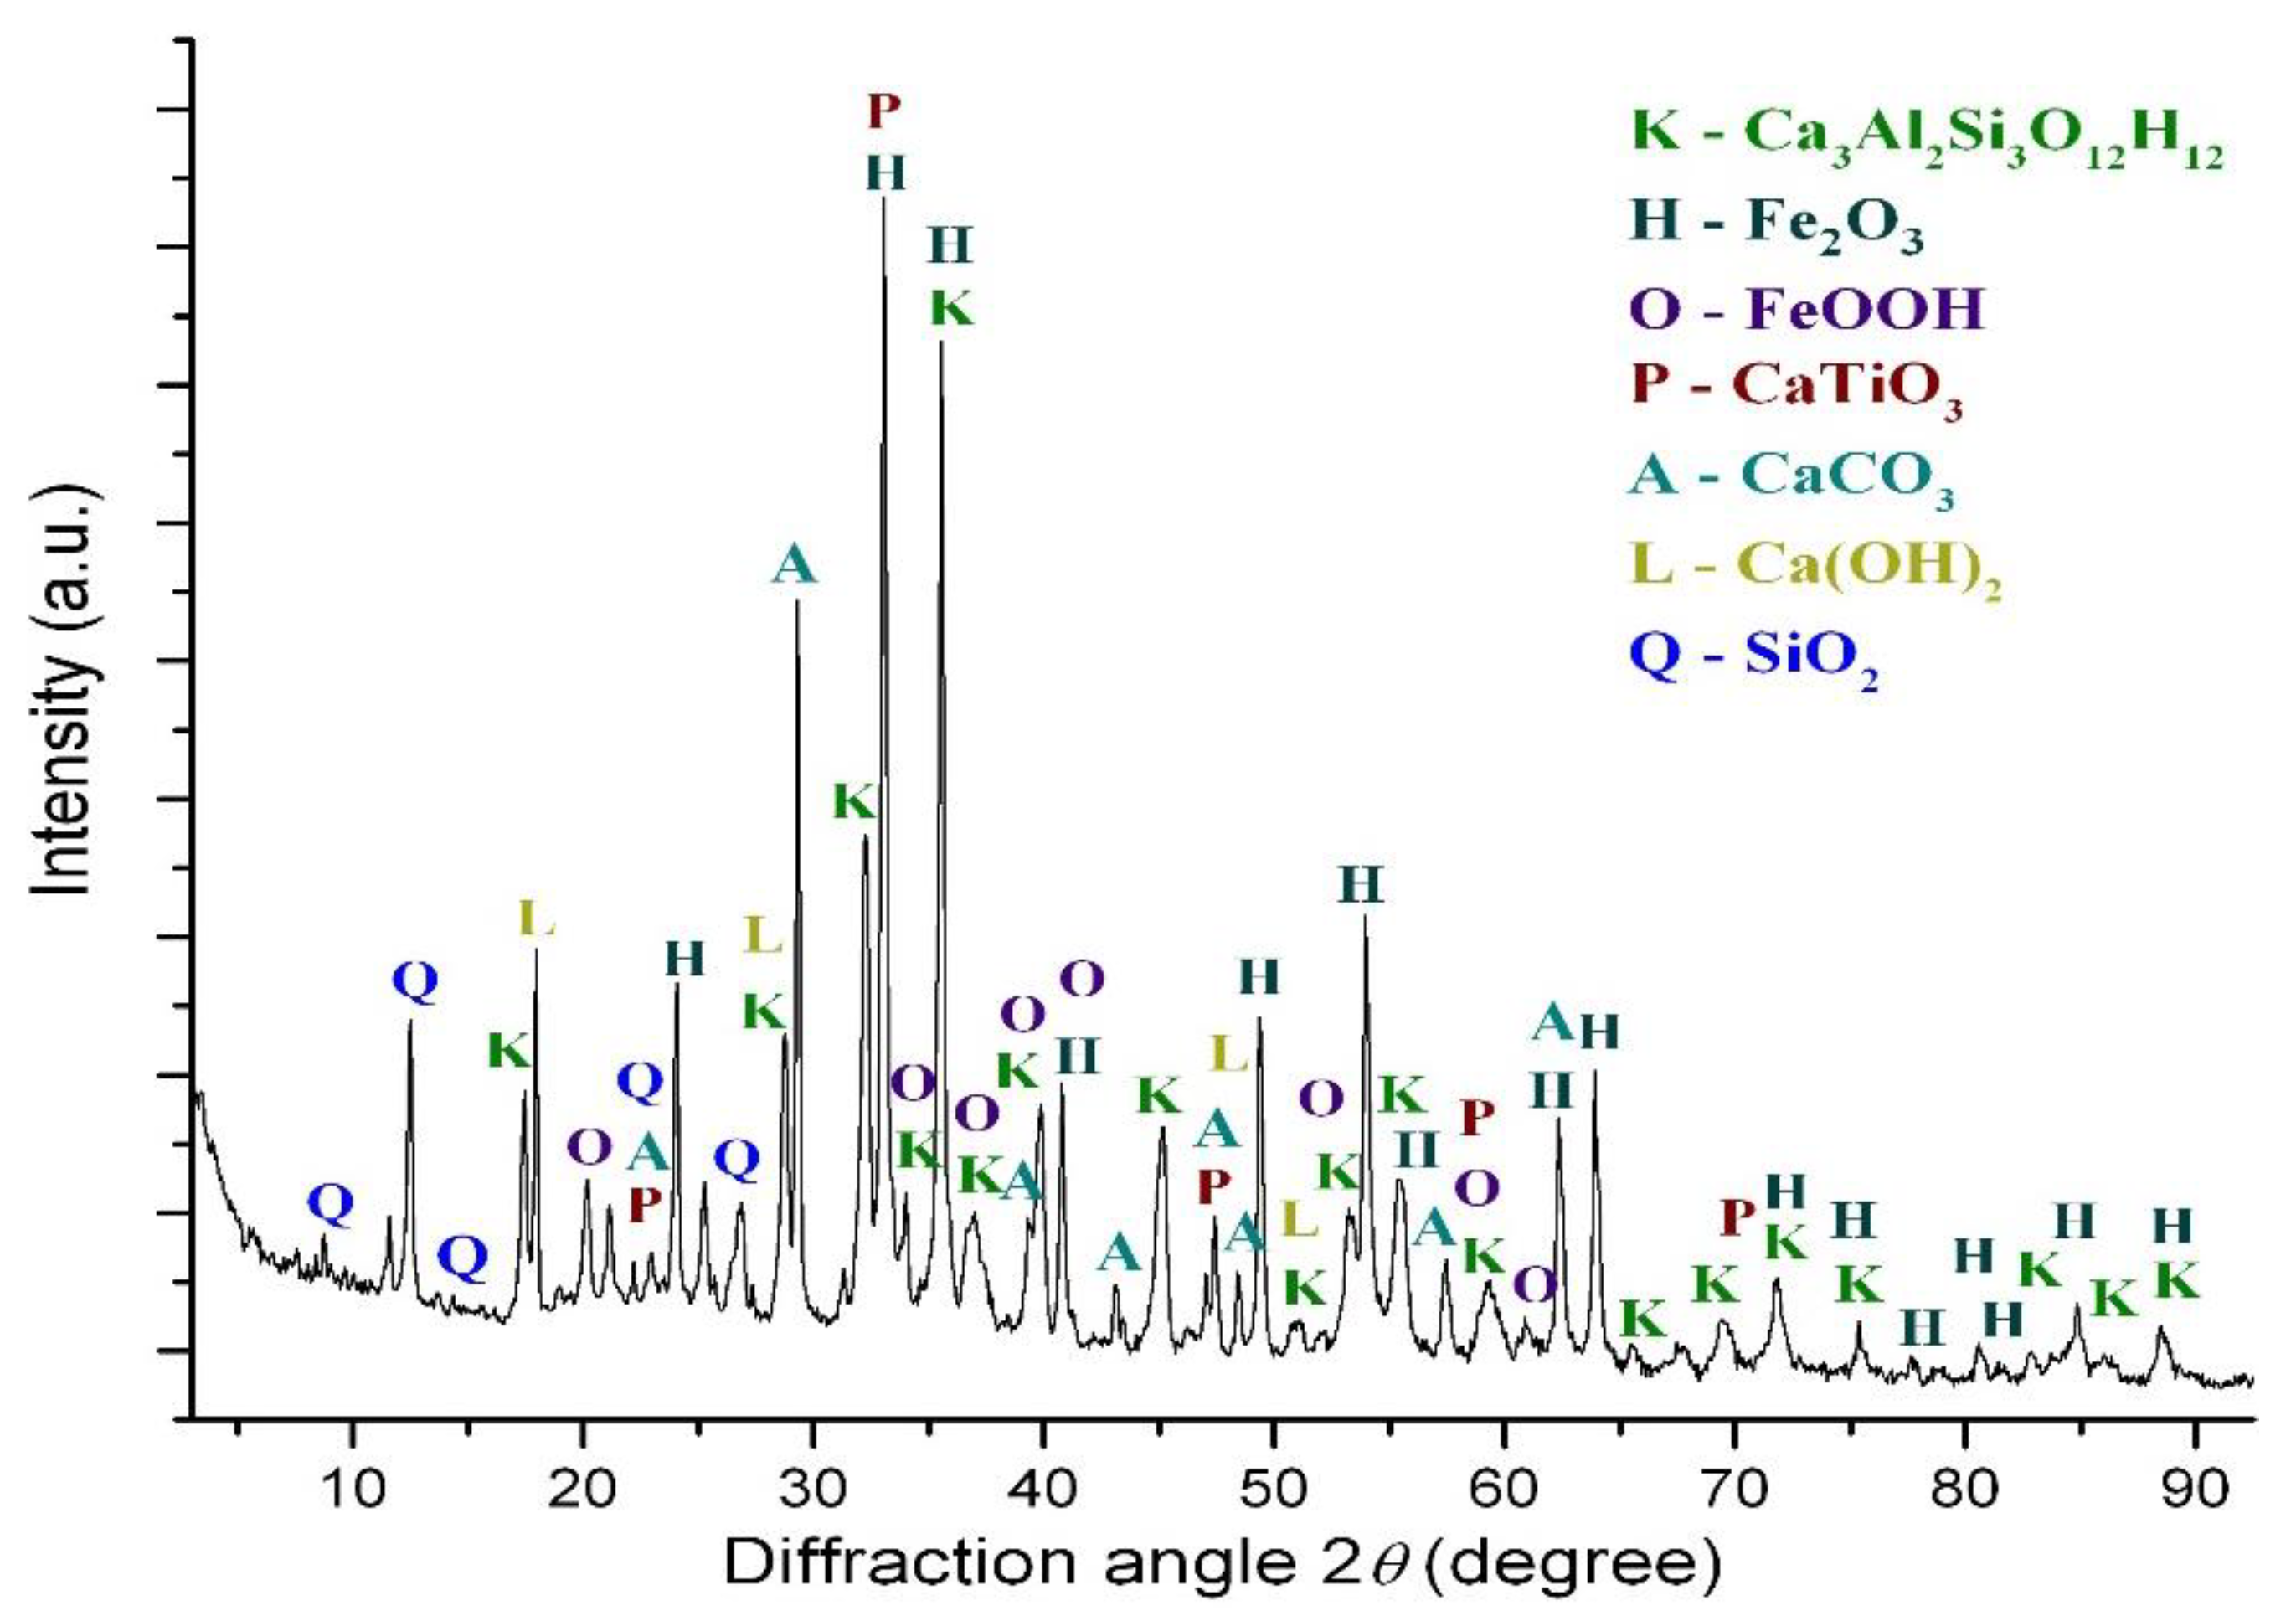
2.1. Raw Materials
2.2. Thermodynamic Calculation
2.3. Experimental Procedure
2.4. Iron Grain Size Calculation
2.5. Magnetic Separation
3. Results
3.1. Thermodynamic Calculations
3.1.1. Thermodynamic Analysis of the Carbothermic Reduction of Iron in Red Mud
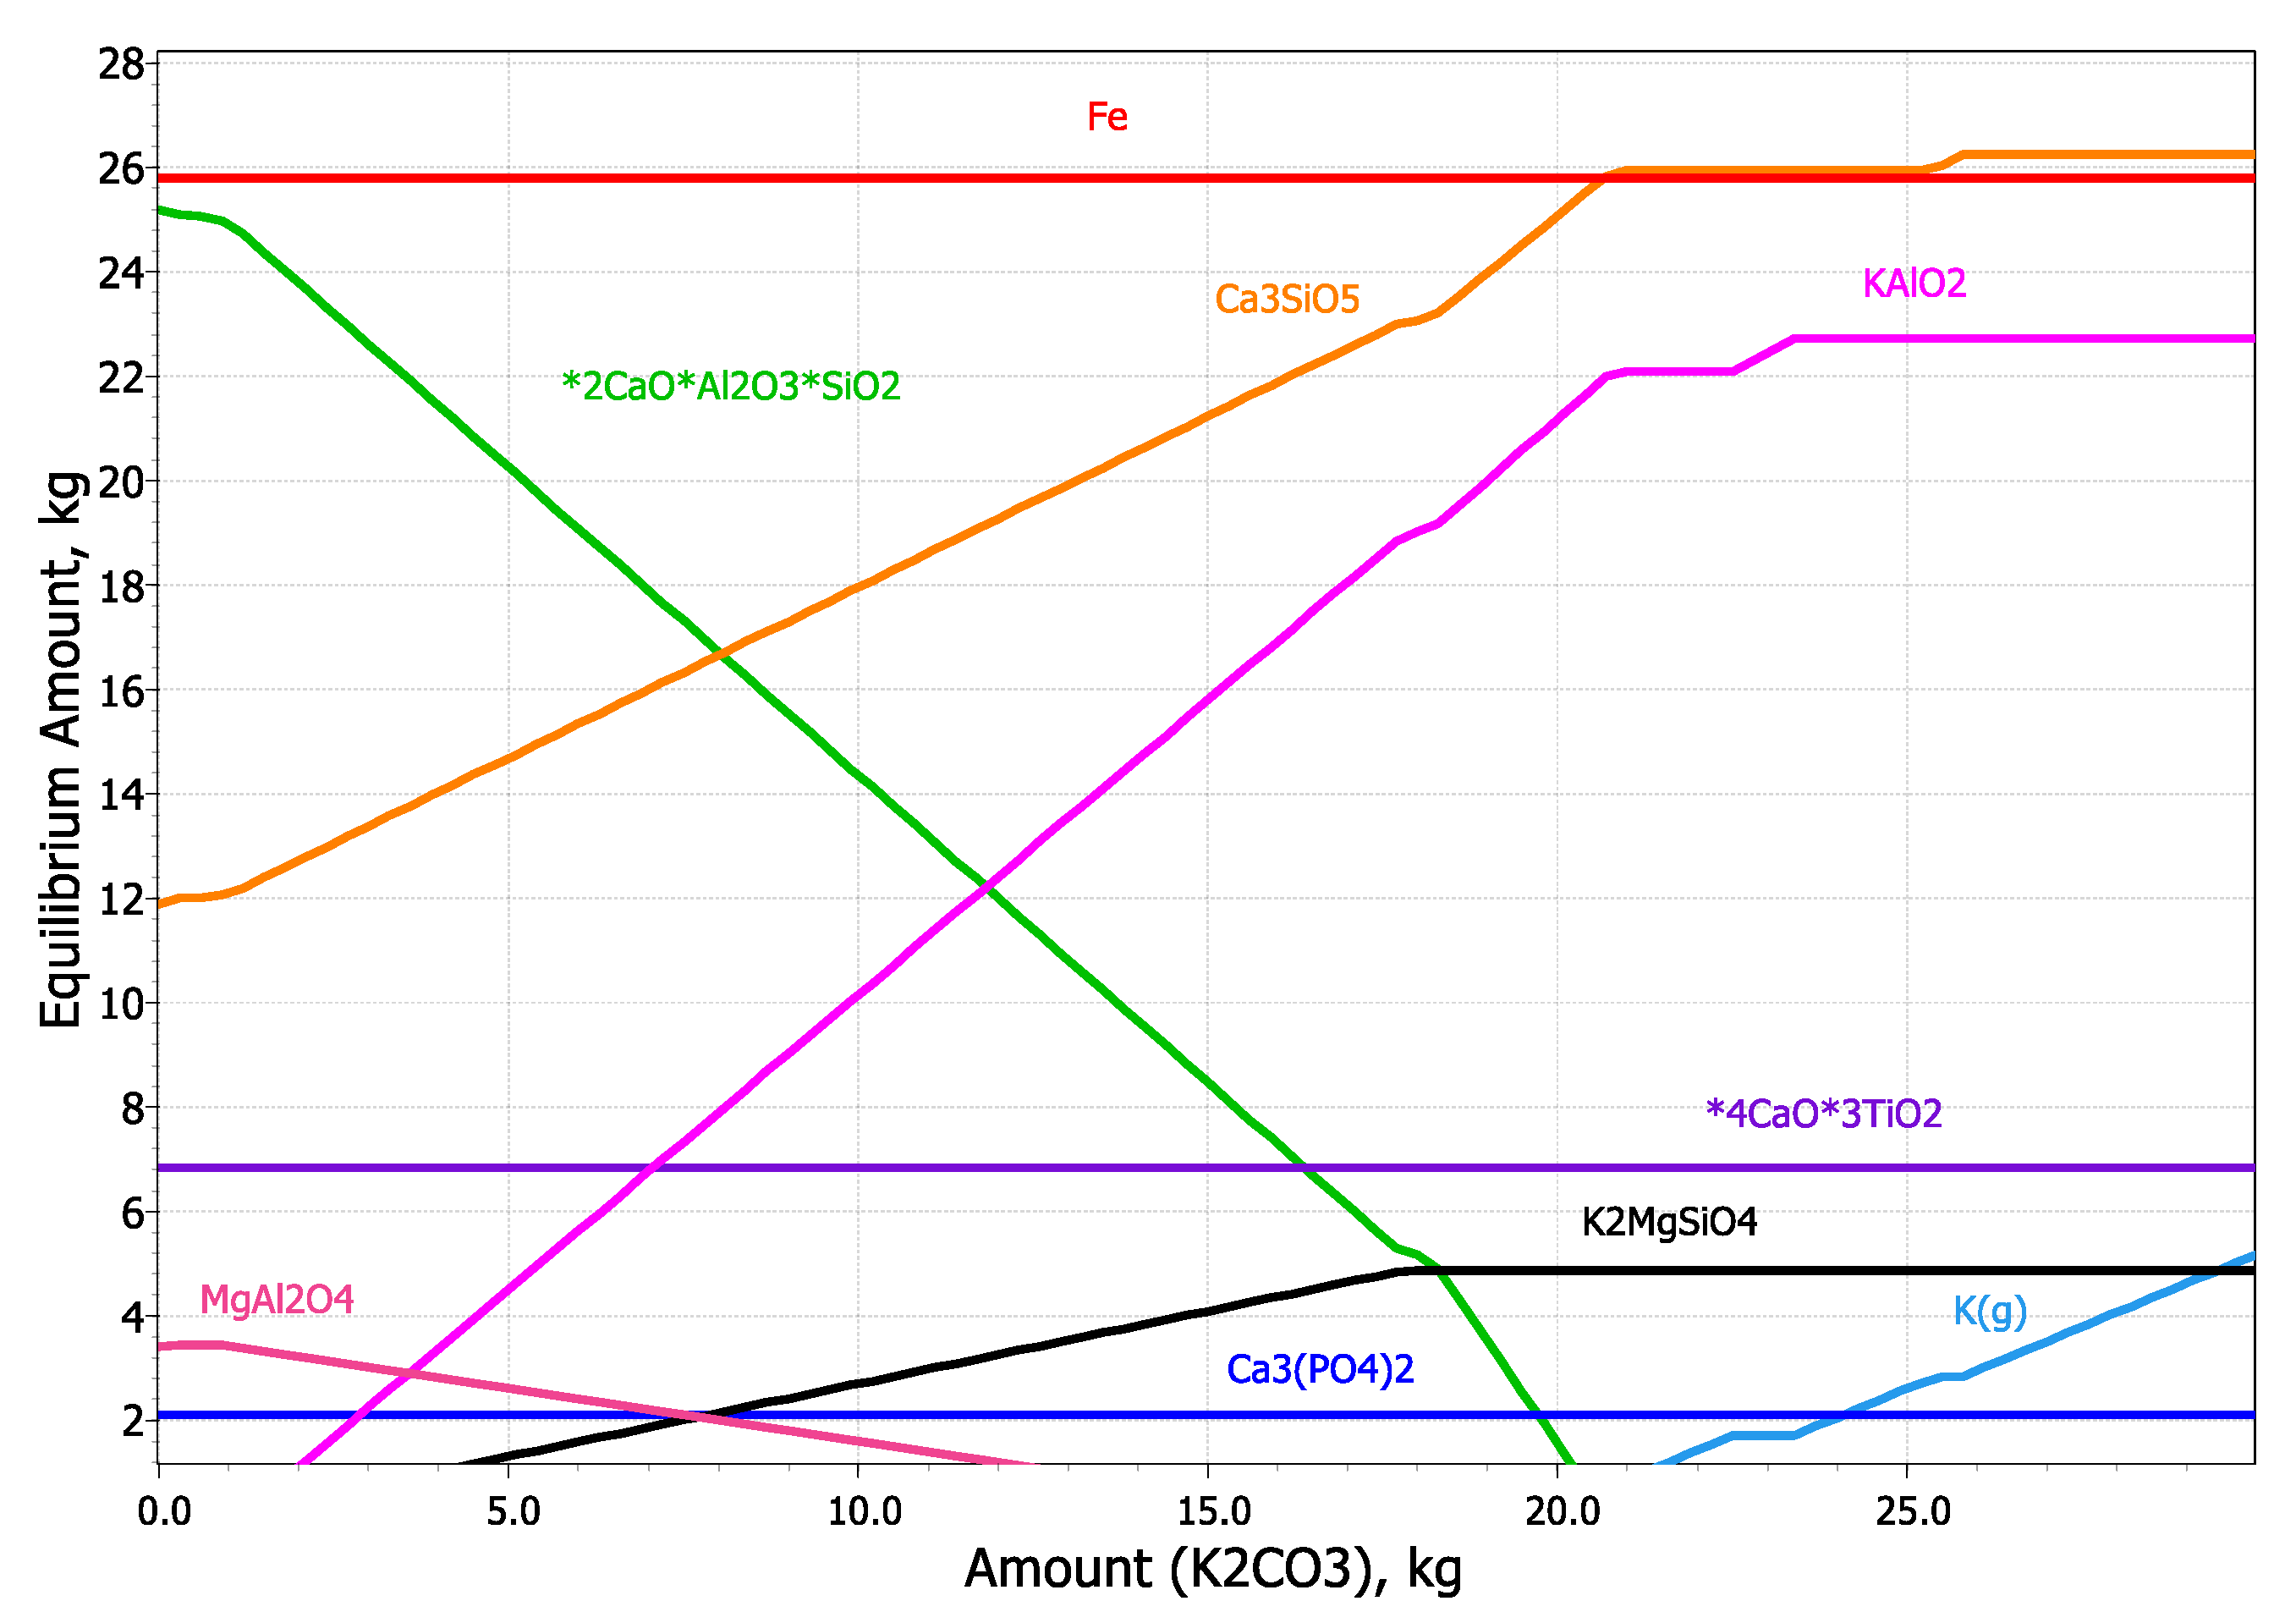
3.1.2. Thermodynamic Analysis of the Influence of K2CO3 and Na2CO3 on the Carbothermic Reduction Process
3.1.3. Thermodynamic Simulation of the Liquidus Temperatures in the Red Mud-Na2O and Red Mud-K2O Systems
3.2. Experimental Results of Iron Reduction
3.2.1. The Effects of the Roasting Temperature and Duration Time on the Iron Metallization Degree
3.2.2. The Effects of Na2CO3 and K2CO3 Additions on the Iron Metallization Degree
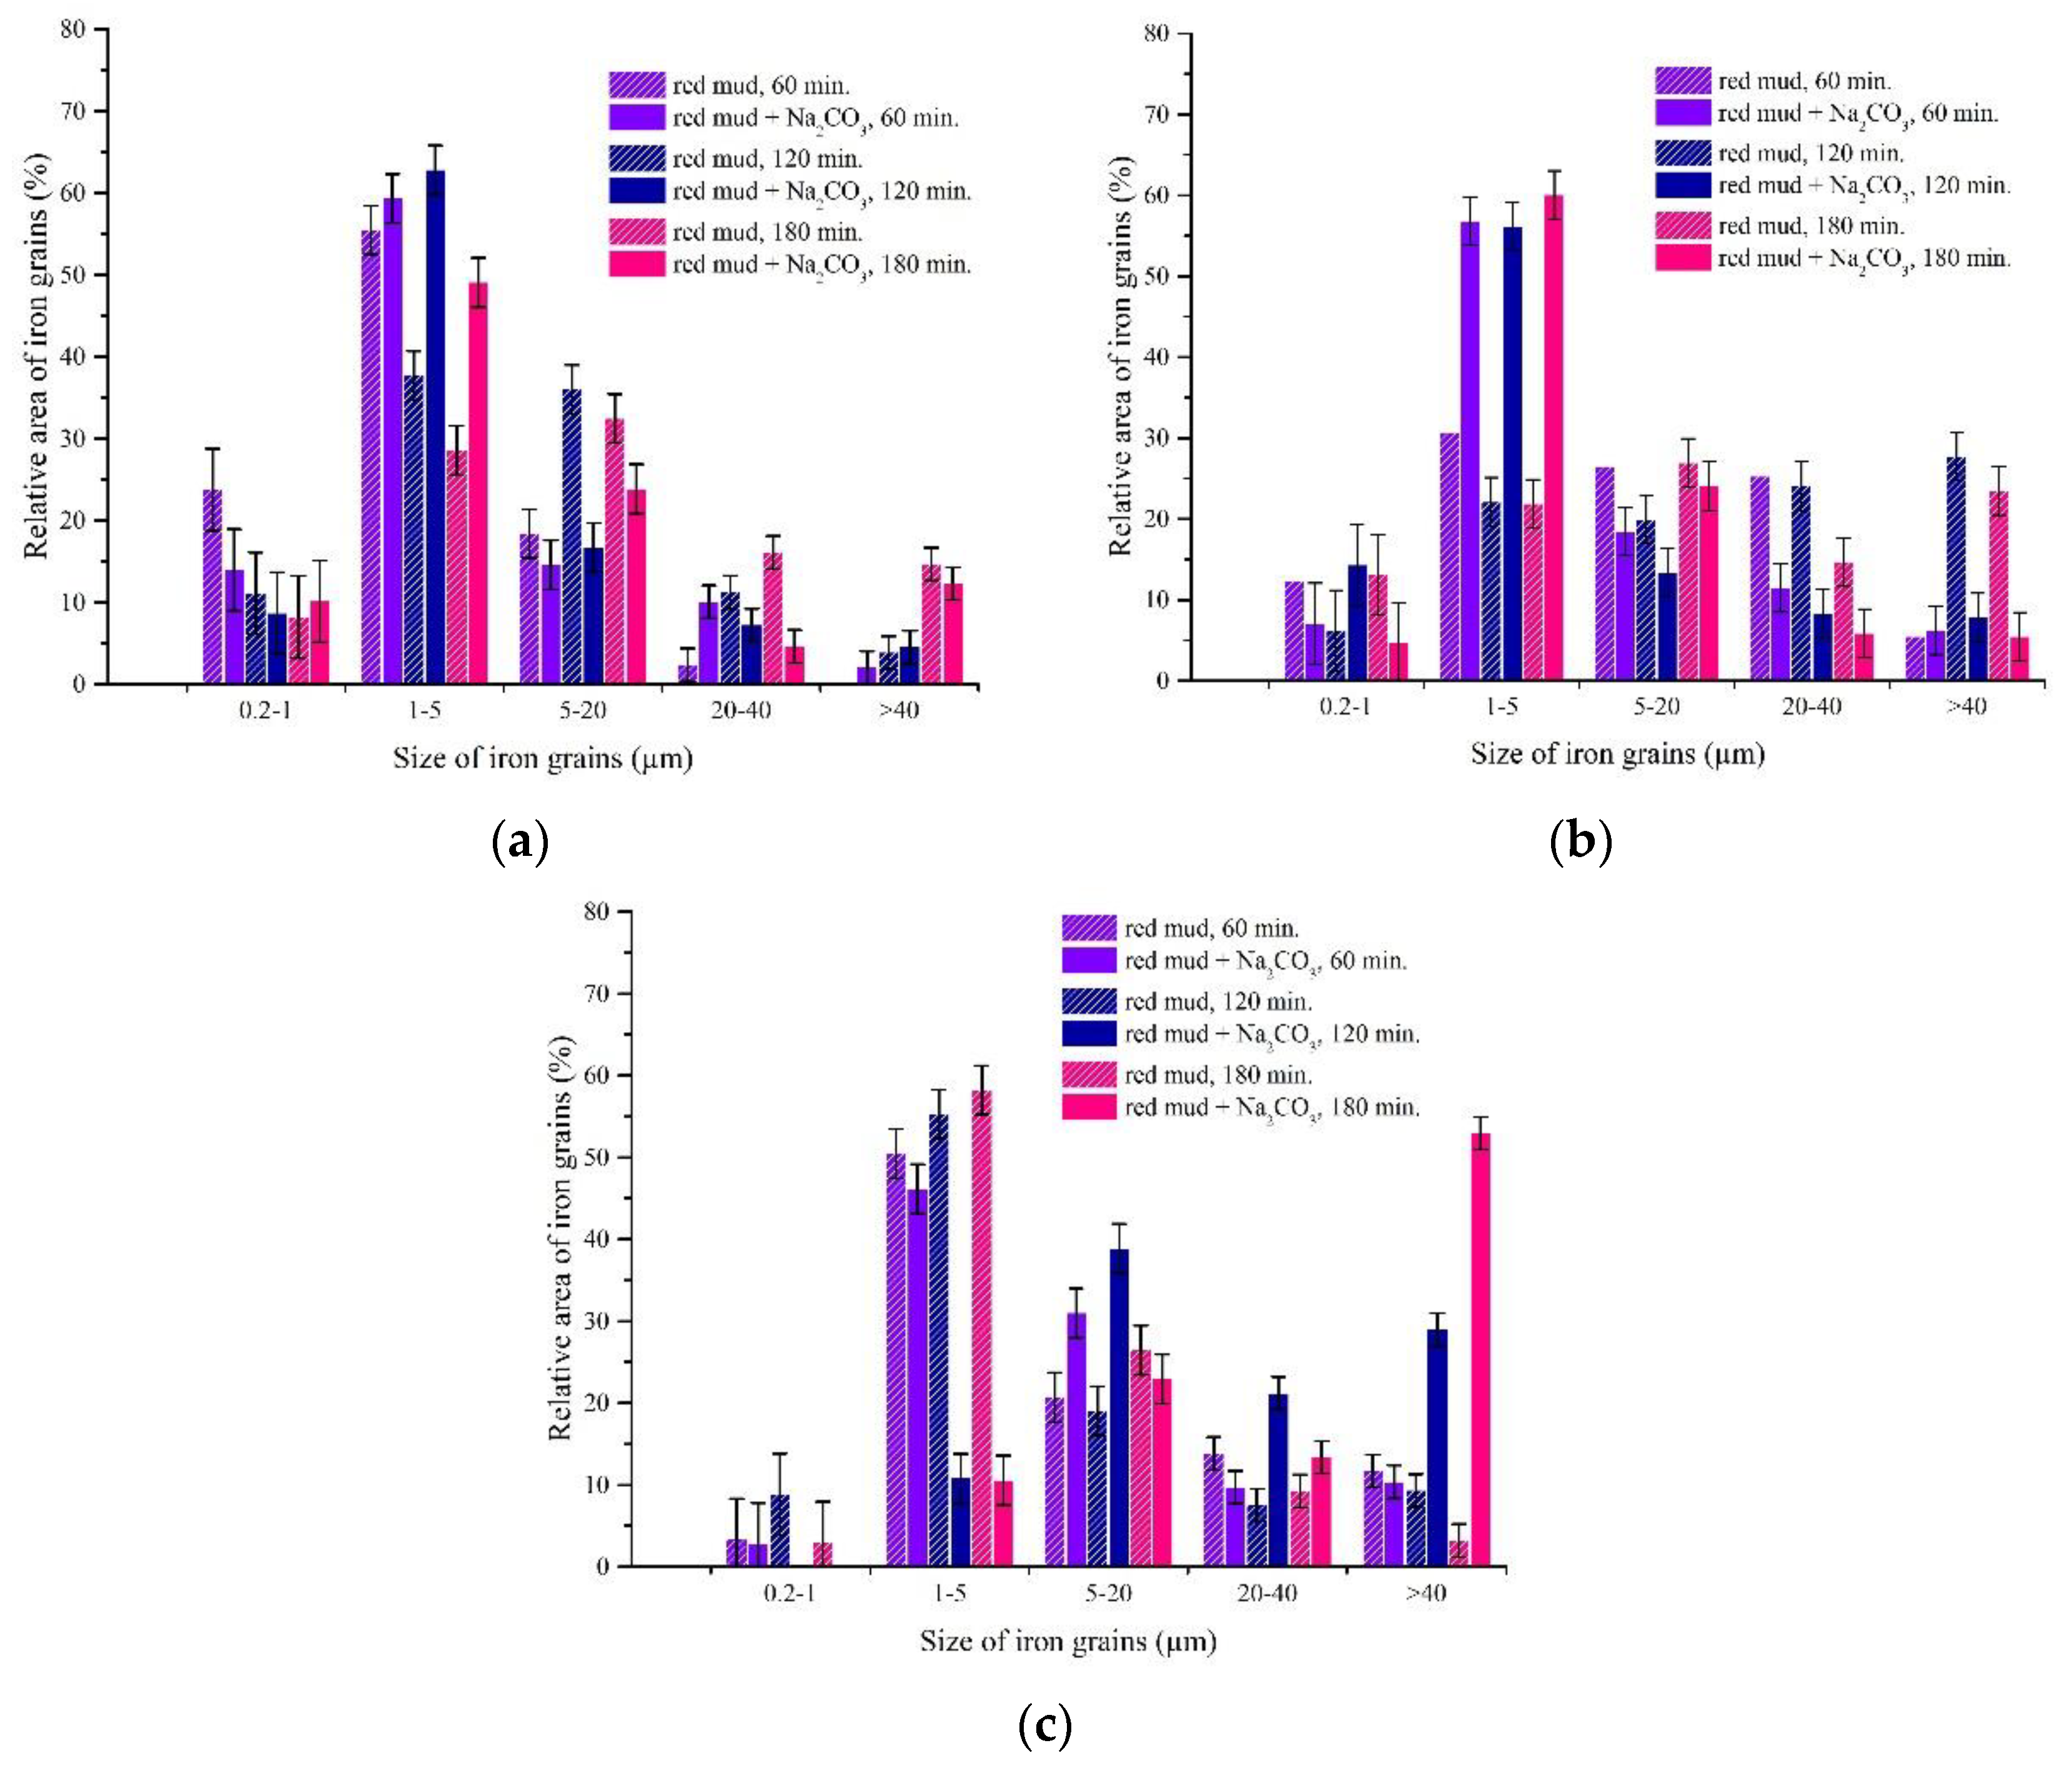
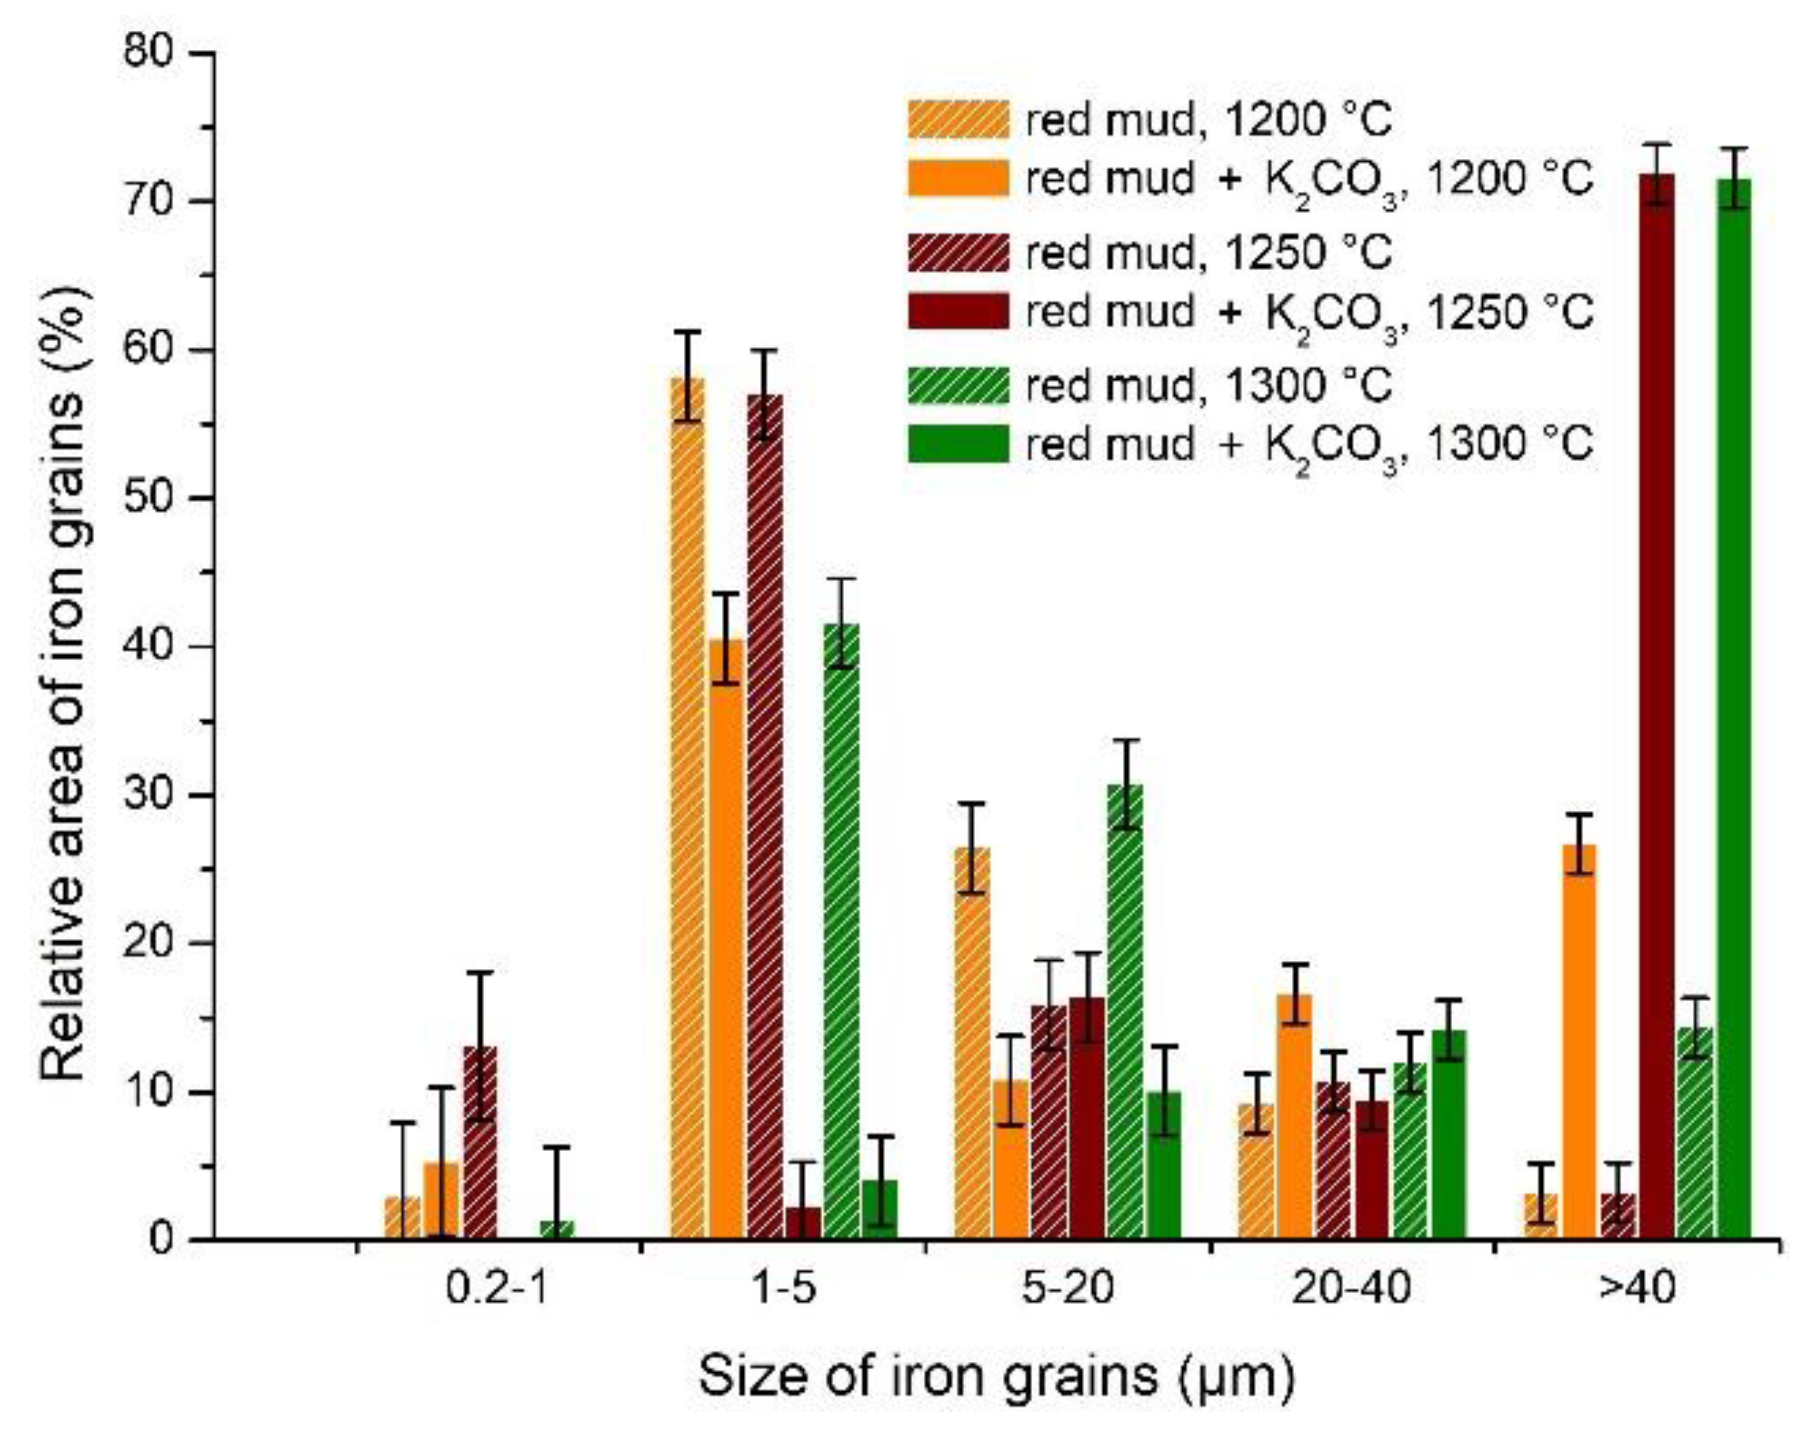
3.3. Experimental Results of Iron Grain Growth
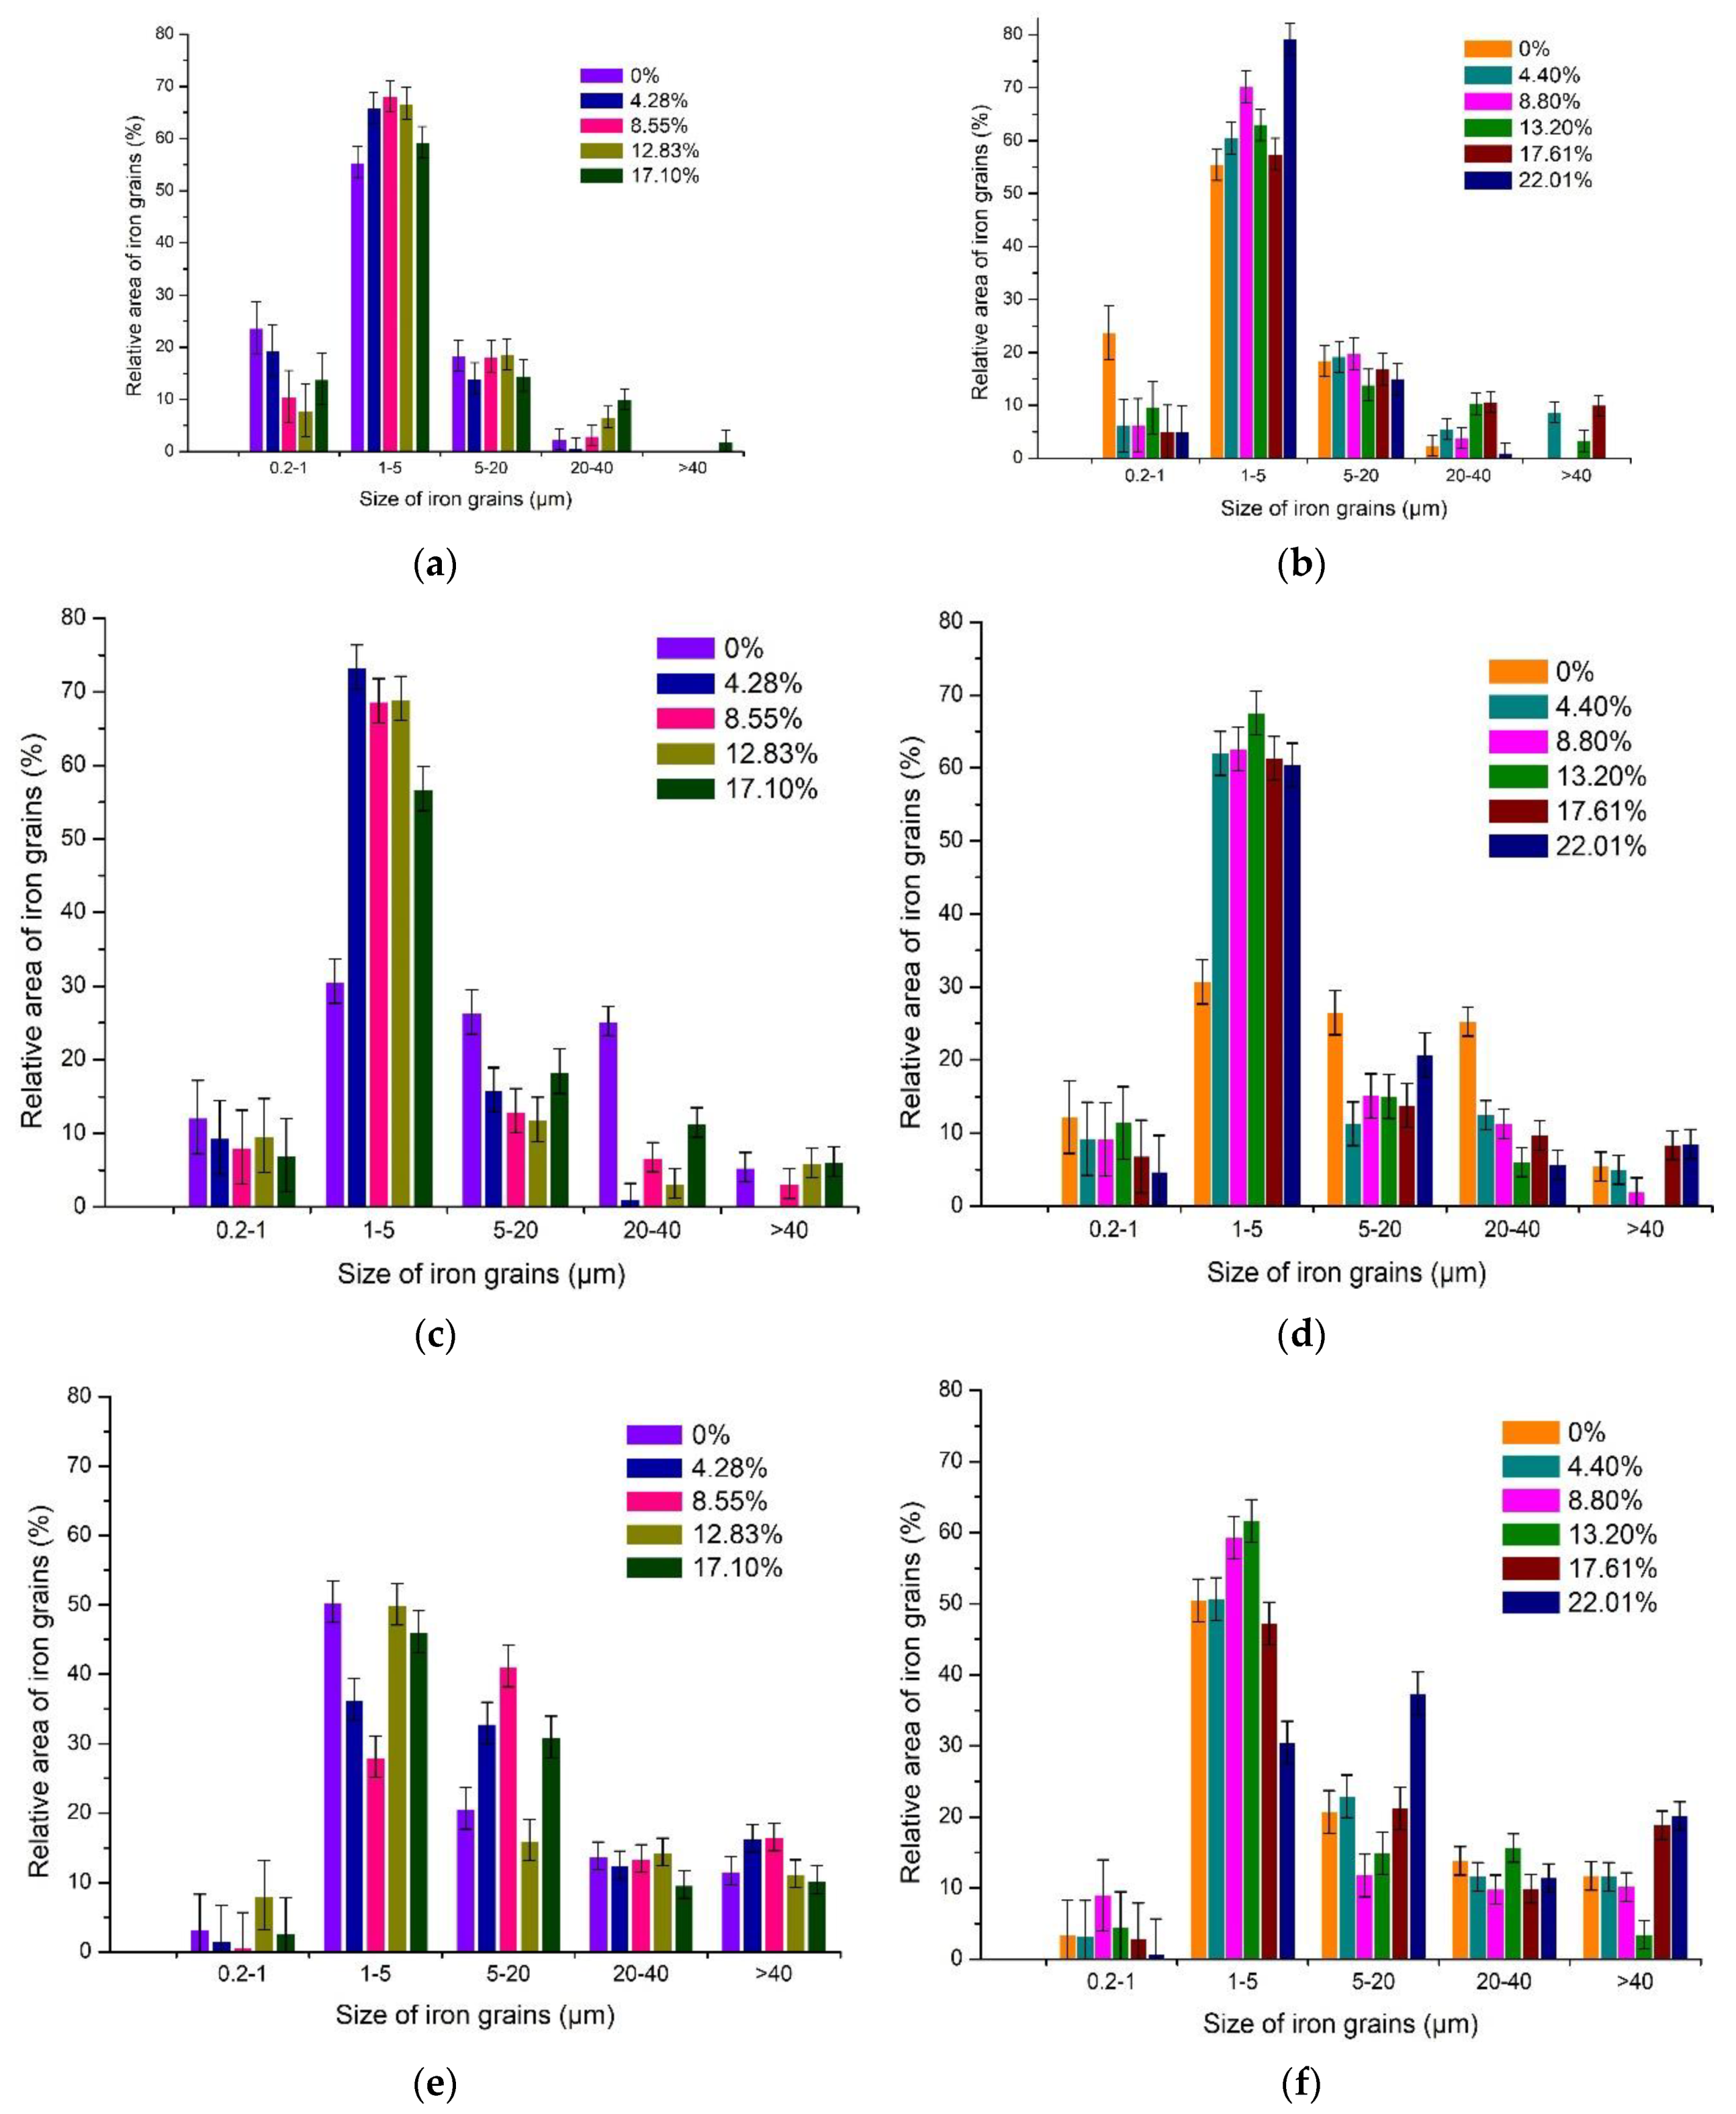
3.3.1. The Effects of Na2CO3 and K2CO3 Addition and Temperature on the Iron Grain Growth
3.3.2. The Effect of Roasting Time on the Iron Grain Growth
3.4. Magnetic Separation of Reduced Samples
4. Discussion
5. Conclusions
Author Contributions
Funding
Acknowledgments
Conflicts of Interest
References
- Khairul, M.A.; Zanganeh, J.; Moghtaderi, B. The composition, recycling and utilisation of Bayer red mud. Resour. Conserv. Recycl. 2019, 141, 483–498. [Google Scholar] [CrossRef]
- Evans, K. The History, Challenges, and New Developments in the Management and Use of Bauxite Residue. J. Sustain. Metall. 2016, 2, 316–331. [Google Scholar] [CrossRef]
- Xue, S.-G.; Wu, Y.-J.; Li, Y.-W.; Kong, X.-F.; Zhu, F.; William, H.; Li, X.-F.; Ye, Y.-Z. Industrial wastes applications for alkalinity regulation in bauxite residue: A comprehensive review. J. Cent. South Univ. 2019, 26, 268–288. [Google Scholar] [CrossRef]
- Dmitriev, A. The Comprehensive Utilisation of Red Mud Utilisation in Blast Furnace. In Recovery and Utilization of Metallurgical Solid Waste; Zhang, Y., Ed.; IntechOpen: London, UK, 2019; ISBN 978-1-78985-102-1. [Google Scholar]
- Power, G.; Gräfe, M.; Klauber, C. Bauxite residue issues: I. Current management, disposal and storage practices. Hydrometallurgy 2011, 108, 33–45. [Google Scholar] [CrossRef]
- Tóth, A.K.; Gonda, N.; Fekete, Z.; Tóth, M.; Székely, I.; Zákányi, B.; Móricz, F.; Kovács, B. Physical and chemical characterization of red mud in terms of its environmental effects. Geosci. Eng. 2014, 3, 129–137. [Google Scholar]
- Anton, A.; Rékási, M.; Uzinger, N.; Széplábi, G.; Makó, A. Modelling the potential effects of the hungarian red mud disaster on soil properties. Water. Air. Soil Pollut. 2012, 223, 5175–5188. [Google Scholar] [CrossRef]
- Mayes, W.M.; Burke, I.T.; Gomes, H.I.; Anton, D.; Molnár, M.; Feigl, V. Ujaczki Advances in Understanding Environmental Risks of Red Mud After the Ajka Spill, Hungary. J. Sustain. Metall. 2016, 2, 332–343. [Google Scholar] [CrossRef]
- Xue, S.; Kong, X.; Zhu, F.; Hartley, W.; Li, X.; Li, Y. Proposal for management and alkalinity transformation of bauxite residue in China. Environ. Sci. Pollut. Res. 2016, 23, 12822–12834. [Google Scholar] [CrossRef]
- Mukiza, E.; Zhang, L.L.; Liu, X.; Zhang, N. Utilization of red mud in road base and subgrade materials: A review. Resour. Conserv. Recycl. 2019, 141, 187–199. [Google Scholar] [CrossRef]
- Tsakiridis, P.E.; Agatzini-Leonardou, S.; Oustadakis, P. Red mud addition in the raw meal for the production of Portland cement clinker. J. Hazard. Mater. 2004, 116, 103–110. [Google Scholar] [CrossRef]
- Lima, M.S.S.; Thives, L.P.; Haritonovs, V.; Bajars, K. Red mud application in construction industry: Review of benefits and possibilities. IOP Conf. Ser. Mater. Sci. Eng. 2017, 251, 012033. [Google Scholar] [CrossRef]
- Ravat, D.; Shah, S.; Dave, S. Utilization of Red Mud in Geopolymer Concrete-A Review. Int. J. Adv. Eng. Res. Dev. 2017, 4, 738–741. [Google Scholar]
- Liu, X.; Zhang, N. Utilization of red mud in cement production: A review. Waste Manag. Res. 2011, 29, 1053–1063. [Google Scholar] [CrossRef] [PubMed]
- Das, B.; Mohanty, K. A review on advances in sustainable energy production through various catalytic processes by using catalysts derived from waste red mud. Renew. Energy 2019, 143, 1791–1811. [Google Scholar] [CrossRef]
- Hua, Y.; Heal, K.V.; Friesl-Hanl, W. The use of red mud as an immobiliser for metal/metalloid-contaminated soil: A review. J. Hazard. Mater. 2017, 325, 17–30. [Google Scholar] [CrossRef]
- Ahmed, M.J.K.; Ahmaruzzaman, M. A review on potential usage of industrial waste materials for binding heavy metal ions from aqueous solutions. J. Water Process Eng. 2016, 10, 39–47. [Google Scholar] [CrossRef]
- Borra, C.R.; Blanpain, B.; Pontikes, Y.; Binnemans, K.; Van Gerven, T. Recovery of Rare Earths and Other Valuable Metals From Bauxite Residue (Red Mud): A Review. J. Sustain. Metall. 2016, 2, 365–386. [Google Scholar] [CrossRef]
- Liu, Y.; Naidu, R. Hidden values in bauxite residue (red mud): Recovery of metals. Waste Manag. 2014, 34, 2662–2673. [Google Scholar] [CrossRef]
- Mishra, B.; Gostu, S. Materials sustainability for environment: Red-mud treatment. Front. Chem. Sci. Eng. 2017, 11, 483–496. [Google Scholar] [CrossRef]
- Gräfe, M.; Power, G.; Klauber, C. Bauxite residue issues: III. Alkalinity and associated chemistry. Hydrometallurgy 2011, 108, 60–79. [Google Scholar] [CrossRef]
- Zinoveev, D.V.; Grudinskii, P.I.; Dyubanov, V.G.; Kovalenko, L.V.; Leont’ev, L.I. Global recycling experience of red mud–A review. Part I: Pyrometallurgical methods. Izv. Ferr. Metall. 2018, 61, 843–858. [Google Scholar] [CrossRef]
- Cardenia, C.; Balomenos, E.; Panias, D. Iron Recovery from Bauxite Residue Through Reductive Roasting and Wet Magnetic Separation. J. Sustain. Metall. 2019, 5, 9–19. [Google Scholar] [CrossRef]
- Bai, S.; Wen, S.; Liu, D.; Zhang, W.; Cao, Q. Beneficiation of High Phosphorus Limonite Ore by Sodium-carbonate-added Carbothermic Reduction. ISIJ Int. 2012, 52, 1757–1763. [Google Scholar] [CrossRef]
- Gao, E.; Sun, T.; Liu, Z.; Geng, C.; Xu, C. Effect of Sodium Sulfate on Direct Reduction of Beach Titanomagnetite for Separation of Iron and Titanium. J. Iron. Steel Res. Int. 2016, 23, 428–433. [Google Scholar] [CrossRef]
- Bai, S.; Wen, S.; Liu, S.; Zhang, W.; Xian, Y. Catalyzing carbothermic reduction of siderite ore with high content of phosphorus by adding sodium carbonate. ISIJ Int. 2011, 51, 1601–1607. [Google Scholar] [CrossRef]
- Rao, M.; Li, G.; Zhang, X.; Luo, J.; Peng, Z.; Jiang, T. Reductive roasting of nickel laterite ore with sodium sulfate for Fe-Ni production. Part I: Reduction/sulfidation characteristics. Sep. Sci. Technol. 2016, 51, 1408–1420. [Google Scholar] [CrossRef]
- Chun, T.J.; Zhu, D.Q.; Pan, J.; He, Z. Preparation of metallic iron powder from red mud by sodium salt roasting and magnetic separation. Can. Metall. Q. 2014, 53, 183–189. [Google Scholar] [CrossRef]
- Loginova, I.V.; Kyrchikov, A.V. Complete processing of the high-iron content red mud. Mater. Sci. Forum 2019, 946 MSF, 569–574. [Google Scholar] [CrossRef]
- Rao, M.; Zhuang, J.; Li, G.; Zeng, J.; Jiang, T. Iron recovery from red mud by reduction roasting-magnetic separation. Miner. Met. Mater. Ser. 2016, 125–130. [Google Scholar] [CrossRef]
- Li, G.; Liu, M.; Rao, M.; Jiang, T.; Zhuang, J.; Zhang, Y. Stepwise extraction of valuable components from red mud based on reductive roasting with sodium salts. J. Hazard. Mater. 2014, 280, 774–780. [Google Scholar] [CrossRef]
- Huang, Z.C.; Cai, L.B.; Zhang, Y.B.; Yang, Y.B.; Jiang, T. Reduction of iron oxides of red mud reinforced by Na2CO3 and CaF2. Zhongnan Daxue Xuebao (Ziran Kexue Ban)/J. Cent. South Univ. (Sci. Technol.) 2010, 41, 838–844. [Google Scholar]
- Grudinskii, P.I.; Dyubanov, V.G.; Zinoveev, D.V.; Zheleznyi, M.V. Solid-Phase Reduction and Iron Grain Growth in Red Mud in the Presence of Alkali Metal Salts. Russ. Metall. 2018, 2018, 1020–1026. [Google Scholar] [CrossRef]
- Gao, F.; Zhang, J.; Deng, X.; Wang, K.; He, C.; Li, X.; Wei, Y. Comprehensive Recovery of Iron and Aluminum from Ordinary Bayer Red Mud by Reductive Sintering–Magnetic Separation–Digesting Process. JOM 2019, 71, 2936–2943. [Google Scholar] [CrossRef]
- Chun, T.; Li, D.; Di, Z.; Long, H.; Tang, L.; Li, F.; Li, Y. Recovery of iron from red mud by hightemperature reduction of carbonbearing briquettes. J. S. Afr. Inst. Min. Metall. 2017, 117, 361–364. [Google Scholar] [CrossRef]
- Deng, B.; Jiang, T.; Li, G.; Ye, Q.; Gu, F.; Rao, M.; Peng, Z. Effects of reductive roasting with sodium salts on leaching behavior of non-ferrous elements in bauxite ore residue. Miner. Met. Mater. Ser. 2018, Part F4, 157–164. [Google Scholar]
- Suprapto, S.; Istiqomah, Z.; Santoso, E.; Dawam, A.A.; Prasetyoko, D. Alumina Extraction from Red Mud by Magnetic Separation. Indones. J. Chem. 2018, 18, 331–336. [Google Scholar] [CrossRef]
- Yu, W.; Sun, T.; Cui, Q. Can sodium sulfate be used as an additive for the reduction roasting of high-phosphorus oolitic hematite ore? Int. J. Miner. Process. 2014, 133, 119–122. [Google Scholar] [CrossRef]
- Shiryaeva, E.V.; Podgorodetskiy, G.S.; Malyscheva, T.Y.; Gorbunov, V.B.; Zavodyaniy, A.V.; Schapovalov, A.N. Influence of low alkaline red mud on the properties and microstructure of the agglomerates from the charge materials JSC “Ural steel”. Izv. Ferr. Metall. 2014, 57, 14–19. [Google Scholar] [CrossRef][Green Version]
- Putz, H. Match!-Phase Identification from Powder Diffraction. Manual. Version 3.8. Available online: https://crystalimpact.com/download/match3/Manual.pdf (accessed on 3 December 2019).
- Roine, A. HSC Chemistry® [Software], Outotec, Pori 2018. Available online: www.outotec.com/HSC (accessed on 3 December 2019).
- Bale, C.W.; Bélisle, E.; Chartrand, P.; Decterov, S.A.; Eriksson, G.; Gheribi, A.E.; Hack, K.; Jung, I.H.; Kang, Y.B.; Melançon, J.; et al. Reprint of: FactSage thermochemical software and databases, 2010–2016. Calphad Comput. Coupling Phase Diagrams Thermochem. 2016, 54, 35–53. [Google Scholar] [CrossRef]
- Matsnev, M.E.; Rusakov, V.S. SpectrRelax: An application for Mössbauer spectra modeling and fitting. AIP Conf. Proc. 2012, 1489, 178–185. [Google Scholar]
- Song, S.; Jia, F.; Peng, C. Study on decomposition of goethite/siderite in thermal modification through XRD, SEM and TGA measurements. Surf. Rev. Lett. 2014, 21, 1–6. [Google Scholar] [CrossRef]
- Hunt, J.; Ferrari, A.; Lita, A.; Crosswhite, M.; Ashley, B.; Stiegman, A.E. Microwave-specific enhancement of the carbon-carbon dioxide (boudouard) reaction. J. Phys. Chem. C 2013, 117, 26871–26880. [Google Scholar] [CrossRef]
- Anisonyan, K.G.; Kopyev, D.Y.; Goncharov, K.V.; Sadykhov, G.B. An investigation of a single-stage red mud reducing roasting process with the cast iron and aluminate slag production. Non-ferrous Met. 2018, 1, 18–23. [Google Scholar] [CrossRef]
- Anisonyan, K.G.; Kopyev, D.Y.; Olyunina, T.V.; Sadykhov, G.B. Influence of Na2CO3 and CaCO3 additions on the aluminate slag formation during a single-stage reducing roasting of red mud. Non-ferrous Met. 2019, 1, 17–21. [Google Scholar] [CrossRef]
- Fionov, A.S.; Yurkov, G.Y.; Kolesov, V.V.; Pankratov, D.A.; Ovchenkov, E.A.; Koksharov, Y.A. Composite material based on iron containing nanoparticles for applications in the problems of electromagnetic compatibility. J. Commun. Technol. Electron. 2012, 57, 543–552. [Google Scholar] [CrossRef]
- Sauer, W.E.; Reynik, R.J. Electronic and magnetic structure of dilute iron-base alloys. J. Appl. Phys. 1971, 42, 1604–1605. [Google Scholar] [CrossRef]
- Vincze, I.; Campbell, I.A. Mossbauer measurements in iron based alloys with transition metals. J. Phys. F Met. Phys. 1973, 3, 647–663. [Google Scholar] [CrossRef]
- Haneda, K.; Zhou, Z.X.; Morrish, A.H.; Majima, T.; Miyahara, T. Low-temperature stable nanometer-size fcc-Fe particles with no magnetic ordering. Phys. Rev. B 1992, 46, 13832–13837. [Google Scholar] [CrossRef]
- Ding, J.; Huang, H.; Mccormick, P.G.; Street, R. Magnetic properties of martensite-austenite mixtures in mechanically milled 304 stainless steel. J. Magn. Magn. Mater. 1995, 139, 109–114. [Google Scholar] [CrossRef]
- Yurkov, G.Y.; Shashkeev, K.A.; Kondrashov, S.V.; Popkov, O.V.; Shcherbakova, G.I.; Zhigalov, D.V.; Pankratov, D.A.; Ovchenkov, E.A.; Koksharov, Y.A. Synthesis and magnetic properties of cobalt ferrite nanoparticles in polycarbosilane ceramic matrix. J. Alloys Compd. 2016, 686, 421–430. [Google Scholar] [CrossRef]
- Sajitha, E.P.; Prasad, V.; Subramanyam, S.V.; Mishra, A.K.; Sarkar, S.; Bansal, C. Size-dependent magnetic properties of iron carbide nanoparticles embedded in a carbon matrix. J. Phys. Condens. Matter 2007, 19, 046214. [Google Scholar] [CrossRef]
- Malina, O.; Jakubec, P.; Kašlík, J.; Tuček, J.; Zbořil, R. A simple high-yield synthesis of high-purity Hägg carbide (χ-Fe5C2) nanoparticles with extraordinary electrochemical properties. Nanoscale 2017, 9, 10440–10446. [Google Scholar] [CrossRef] [PubMed]
- Fruchart, R.; Roger, A.; Senateur, J.P. Crystallographic and magnetic properties of solid solutions of the phosphides M2P, M = Cr, Mn, Fe, Co, and Ni. J. Appl. Phys. 1969, 40, 1250–1257. [Google Scholar] [CrossRef]
- Kumar, R.; Sahoo, B. One-step pyrolytic synthesis and growth mechanism of core–shell type Fe/Fe 3 C-graphite nanoparticles-embedded carbon globules. Nano-Structures Nano-Objects 2018, 16, 77–85. [Google Scholar] [CrossRef]
- DeCristofaro, N.; Kaplow, R. Interstitial atom configurations in stable and metastable Fe-N and Fe-C solid solutions. Metall. Trans. A 1977, 8, 35–44. [Google Scholar] [CrossRef]
- Li, S.; Qin, S.; Kang, L.; Liu, J.; Wang, J.; Li, Y. An Efficient Approach for Lithium and Aluminum Recovery from Coal Fly Ash by Pre-Desilication and Intensified Acid Leaching Processes. Metals 2017, 7, 272. [Google Scholar] [CrossRef]
- Korovin, V.; Shestak, Y. Scandium extraction from hydrochloric acid media by Levextrel-type resins containing di-isooctyl methyl phosphonate. Hydrometallurgy 2009, 95, 346–349. [Google Scholar] [CrossRef]
- Xiao, J.; Liang, G.; Huang, W.; Ding, W.; Peng, Y.; Wu, Q. Separating scandium of complex scandium concentrate by alkali fusion roasting-hydrolysis-hydrochloric acid leaching process. Chongqing Daxue Xuebao/J. Chongqing Univ. 2018, 41, 66–74. [Google Scholar]
- Zhou, K.; Teng, C.; Zhang, X.; Peng, C.; Chen, W. Enhanced selective leaching of scandium from red mud. Hydrometallurgy 2018, 182, 57–63. [Google Scholar] [CrossRef]
- Yuan, M.; Qiao, X.; Yu, J. Phase equilibria of AlCl3 + FeCl3 + H2O, AlCl3 + CaCl2 + H2O, and FeCl3 + CaCl2 + H2O at 298.15 K. J. Chem. Eng. Data 2016, 61, 1749–1755. [Google Scholar] [CrossRef]
- Wang, J.; Petit, C.; Zhang, X.; Cui, S. Phase Equilibrium Study of the AlCl3-CaCl2-H2O System for the Production of Aluminum Chloride Hexahydrate from Ca-Rich Flue Ash. J. Chem. Eng. Data 2016, 61, 359–369. [Google Scholar] [CrossRef]
- Zhang, N.; Yang, Y.; Wang, Z.; Shi, Z.; Gao, B.; Hu, X.; Tao, W.; Liu, F.; Yu, J. Study on the thermal decomposition of aluminium chloride hexahydrate. Can. Metall. Q. 2018, 57, 235–244. [Google Scholar] [CrossRef]
- Suss, A.; Senyuta, A.; Kravchenya, M.; Smirnov, A.; Panov, A. The quality of alumina produced by the hydrochloric acid process and potential for improvement. In Proceedings of the International Committee for Study of Bauxite, Alumina & Aluminium (ICSOBA), Dubai, UAE, 29 November–1 December 2015; Volume 44, pp. 1–8. [Google Scholar]


| Fe2O3 | SiO2 | Al2O3 | TiO2 | CaO | MgO | MnO | Na2O | P2O5 | S | Sc | LOI |
|---|---|---|---|---|---|---|---|---|---|---|---|
| 36.9 | 8.71 | 11.8 | 3.54 | 23.8 | 1.01 | 0.95 | 0.27 | 0.42 | 0.14 | 0.008 | 12.46 |
| Roasting Charge | Phase | δ, (mm/s) | ε, (mm/s) | Γexp, (mm/s) | Heff, (kOe) | S, (at. %) |
|---|---|---|---|---|---|---|
| Red mud without additions | α-Fe | 0.01 | −0.01 | 0.37 | 331.4 | 63.1 |
| α-Fe1-xAx (1) | 0.03 | 304.6 | 9.6 | |||
| α-Fe1-xAx (2) | 0.05 | 277.7 | 4 | |||
| α-Fe1-xAx (3) | 0.06 | 250.9 | 1.9 | |||
| α-Fe1-xAx (4) | 0.08 | 224.1 | 0.8 | |||
| θ-Fe3C | 0.01 | −0.08 | 0.31 | 190.3 | 4.5 | |
| FeC | 0.02 | 0.30 | 0.22 | - | 2.9 | |
| γ-Fe-C | −0.08 | - | 0.31 | - | 9.6 | |
| FeP2 | 0.00 | 0.85 | 0.22 | - | 1.9 | |
| Red mud + 12.83% Na2CO3 | α-Fe | 0.00 | 0.01 | 0.36 | 332.0 | 42.1 |
| α-Fe1-xAx (5) | 0.02 | 308.2 | 6.9 | |||
| α-Fe1-xAx (6) | 0.03 | 284.5 | 3.1 | |||
| α-Fe1-xAx (7) | 0.04 | 260.8 | 2.4 | |||
| θ-Fe3C | 0.19 | 0.01 | 0.57 | 187.8 | 37.9 | |
| χ-Fe5C2 | 0.14 | −0.01 | 0.57 | 109.0 | 2.8 | |
| FeC | 0.01 | 0.35 | 0.30 | - | 1.2 | |
| γ-Fe-C | −0.14 | - | 0.30 | - | 3.2 | |
| FeP2 | −0.01 | 0.85 | 0.30 | - | 0.4 | |
| Red mud + 17.1% Na2CO3 | α-Fe | 0.01 | 0.00 | 0.35 | 331.2 | 63.8 |
| α-Fe1-xAx (8) | 0.04 | 306.7 | 8.7 | |||
| α-Fe1-xAx (9) | 0.07 | 282.1 | 4.1 | |||
| α-Fe1-xAx (10) | 0.10 | 257.5 | 3.3 | |||
| θ-Fe3C | 0.13 | −0.04 | 0.43 | 194.4 | 11.4 | |
| FeC | 0.02 | 0.27 | 0.24 | - | 2.6 | |
| γ-Fe-C | −0.08 | - | 0.24 | - | 3.7 | |
| FeP2 | 0.01 | 0.84 | 0.24 | - | 2.3 | |
| Red mud + 8.8% K2CO3 | α-Fe | 0.01 | −0.01 | 0.37 | 332.0 | 42.5 |
| α-Fe1-xAx (11) | 0.04 | 304.9 | 7.1 | |||
| α-Fe1-xAx (12) | 0.07 | 277.8 | 4.0 | |||
| α-Fe1-xAx (13) | 0.10 | 250.7 | 2.1 | |||
| θ-Fe3C | 0.17 | 0.00 | 0.60 | 188.1 | 24.7 | |
| χ-Fe5C2 | 0.15 | −0.05 | 0.60 | 113.4 | 2.0 | |
| FeC | 0.01 | 0.32 | 0.25 | - | 5.7 | |
| γ-Fe-C | −0.08 | - | 0.31 | - | 10.9 | |
| FeP2 | −0.00 | 0.83 | 0.25 | - | 1.0 | |
| Red mud + 22.01% K2CO3 | α-Fe | 0.00 | 0.00 | 0.29 | 330.1 | 82.8 |
| α-Fe1-xAx (14) | 0.02 | 302.6 | 5.4 | |||
| α-Fe1-xAx (15) | 0.04 | 274.1 | 1.9 | |||
| α-Fe1-xAx (16) | 0.05 | 245.5 | 0.9 | |||
| α-Fe1-xAx (17) | 0.07 | 217.0 | 0.4 | |||
| θ-Fe3C | 0.07 | −0.07 | 0.26 | 191.6 | 5.2 | |
| Fe-C | 0.01 | 0.32 | 0.26 | - | 0.5 | |
| γ-Fe-C | −0.1 | - | 0.26 | - | 1.3 | |
| FeP2 | 0.01 | 0.85 | 0.26 | - | 2.4 |
| Roasting Conditions | Addition | Iron Concentrate Yield (γ), % | Tailings Yield, % | Iron Recovery (ε), % | Iron Grade (λ), % | Iron Metallization (η), % | Iron in Tailings, % |
|---|---|---|---|---|---|---|---|
| 1200 °C, 180 min | Without addition | n/s * | n/s | - | - | - | - |
| 17.1% Na2CO3 | n/s | n/s | - | - | - | - | |
| 22.01% K2CO3 | n/s | n/s | - | - | - | - | |
| 1250 °C, 180 min | Without addition | n/s | n/s | - | - | - | - |
| 17.1% Na2CO3 | 15.89 | 84.11 | 25.37 | 55.65 | 81.88 | 8.23 | |
| 22.01% K2CO3 | 50.2 | 49.8 | 92.39 | 70.77 | 88.87 | 8.74 | |
| 1300 °C, 180 min | Without addition | n/s | n/s | - | - | - | - |
| 17.1% Na2CO3 | 40.59 | 59.41 | 77.27 | 72.05 | 88.84 | 6.76 | |
| 22.01% K2CO3 | 44.1 | 55.9 | 85.54 | 72.5 | 90.47 | 8.1 | |
| 1350 °C, 180 min | Without addition | n/s | n/s | - | - | - | - |
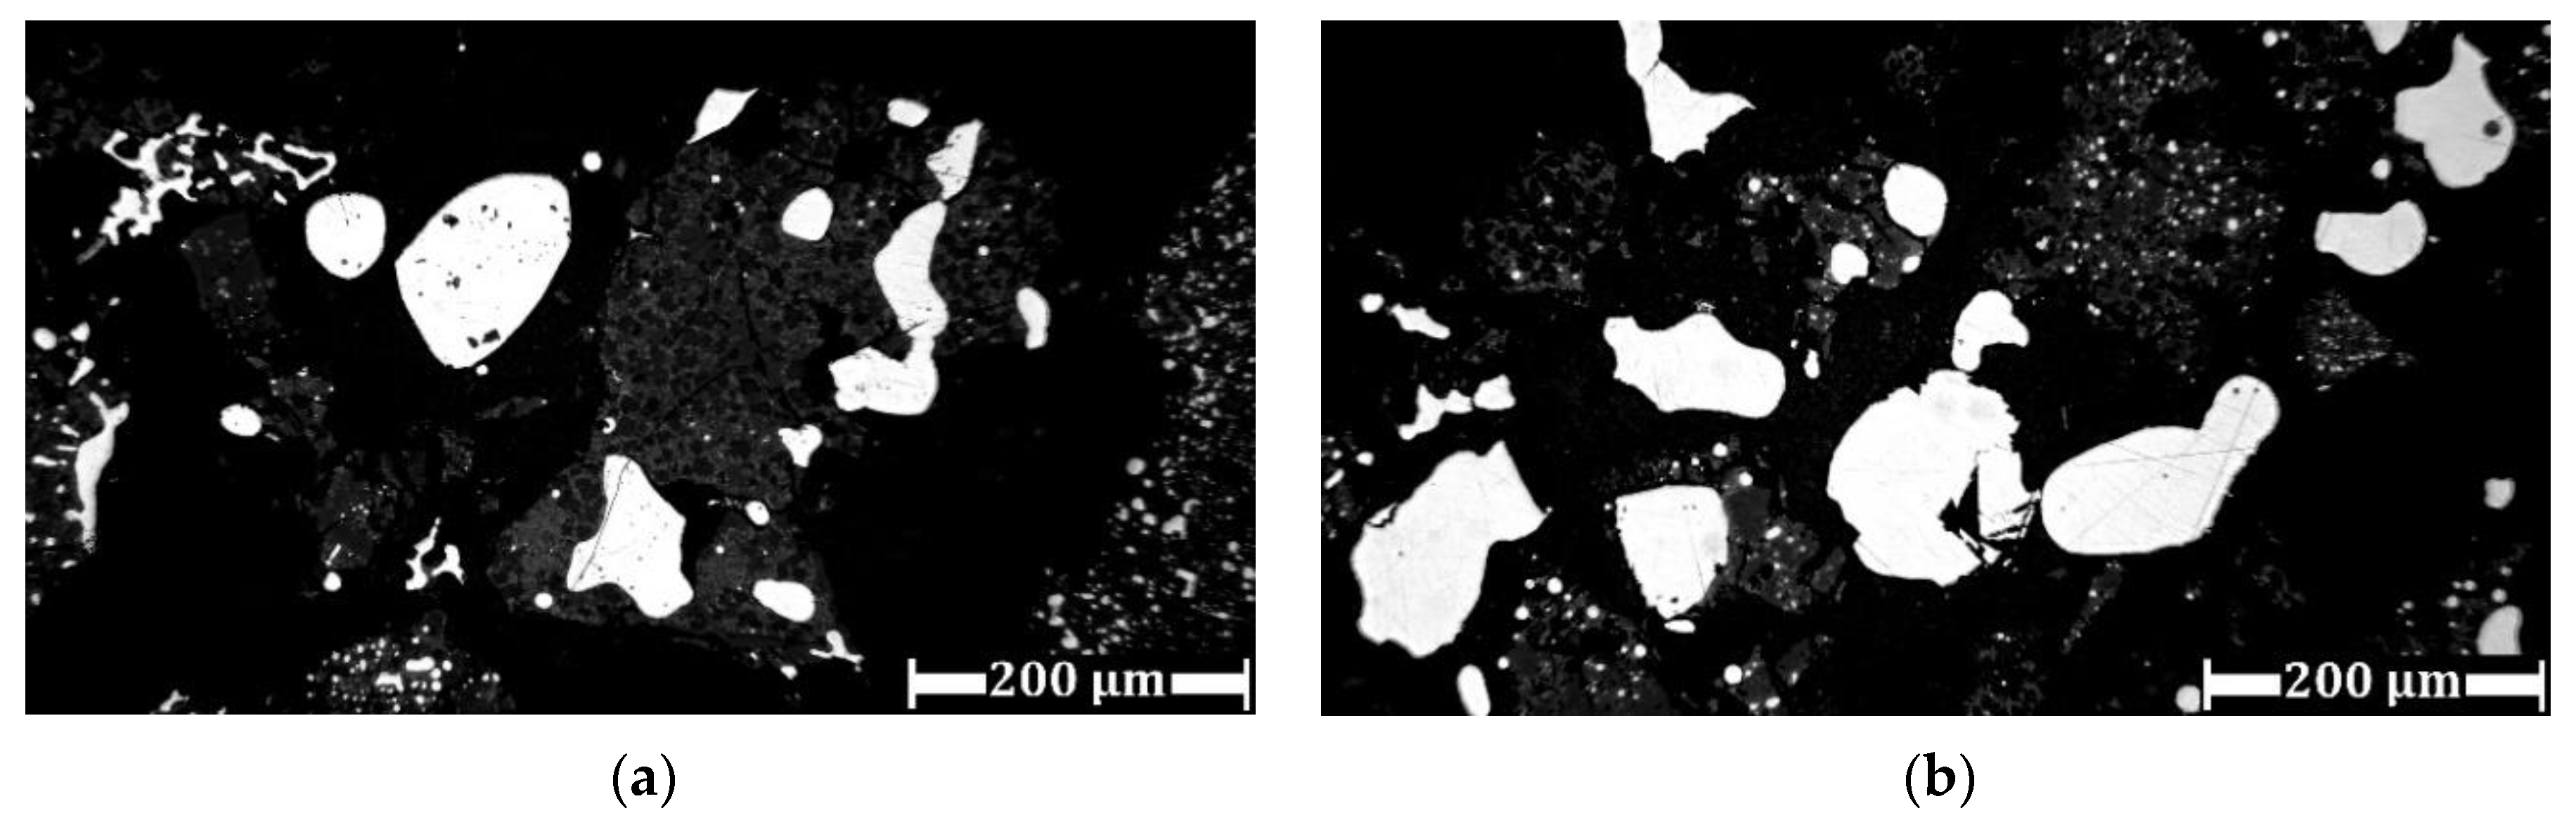
| Sample | Fe | Si | Al | Ti | Ca | P | Sc |
|---|---|---|---|---|---|---|---|
| (a) | 6.76 | 7.52 | 10.65 | 3.86 | 32.01 | 0.13 | 0.015 |
| (b) | 8.1 | 7.64 | 9.9 | 3.81 | 31.04 | 0.053 | 0.014 |
© 2019 by the authors. Licensee MDPI, Basel, Switzerland. This article is an open access article distributed under the terms and conditions of the Creative Commons Attribution (CC BY) license (http://creativecommons.org/licenses/by/4.0/).
Share and Cite
Zinoveev, D.; Grudinsky, P.; Zakunov, A.; Semenov, A.; Panova, M.; Valeev, D.; Kondratiev, A.; Dyubanov, V.; Petelin, A. Influence of Na2CO3 and K2CO3 Addition on Iron Grain Growth during Carbothermic Reduction of Red Mud. Metals 2019, 9, 1313. https://doi.org/10.3390/met9121313
Zinoveev D, Grudinsky P, Zakunov A, Semenov A, Panova M, Valeev D, Kondratiev A, Dyubanov V, Petelin A. Influence of Na2CO3 and K2CO3 Addition on Iron Grain Growth during Carbothermic Reduction of Red Mud. Metals. 2019; 9(12):1313. https://doi.org/10.3390/met9121313
Chicago/Turabian StyleZinoveev, Dmitry, Pavel Grudinsky, Andrey Zakunov, Artem Semenov, Maria Panova, Dmitry Valeev, Alex Kondratiev, Valery Dyubanov, and Alexander Petelin. 2019. "Influence of Na2CO3 and K2CO3 Addition on Iron Grain Growth during Carbothermic Reduction of Red Mud" Metals 9, no. 12: 1313. https://doi.org/10.3390/met9121313
APA StyleZinoveev, D., Grudinsky, P., Zakunov, A., Semenov, A., Panova, M., Valeev, D., Kondratiev, A., Dyubanov, V., & Petelin, A. (2019). Influence of Na2CO3 and K2CO3 Addition on Iron Grain Growth during Carbothermic Reduction of Red Mud. Metals, 9(12), 1313. https://doi.org/10.3390/met9121313