Influence of EMS on Asymmetric Flow with Different SEN Clogging Rates in a Slab Continuous Casting Mold

Abstract
1. Introduction
2. Mathematical Model
- (1)
- Molten steel was considered as a steady and incompressible Newtonian flow. The solidification process was neglected [25].
- (2)
- All material properties were constant.
- (3)
- The mold curvature was not taken into consideration [25].
- (4)
- The level fluctuation of the steel–slag interface was ignored.
- (5)
- The influence of molten steel on the electromagnetic field was neglected due to the very small magnetic Reynolds number [26].
2.1. Electromagnetic Model
2.2. Fluid Flow Model
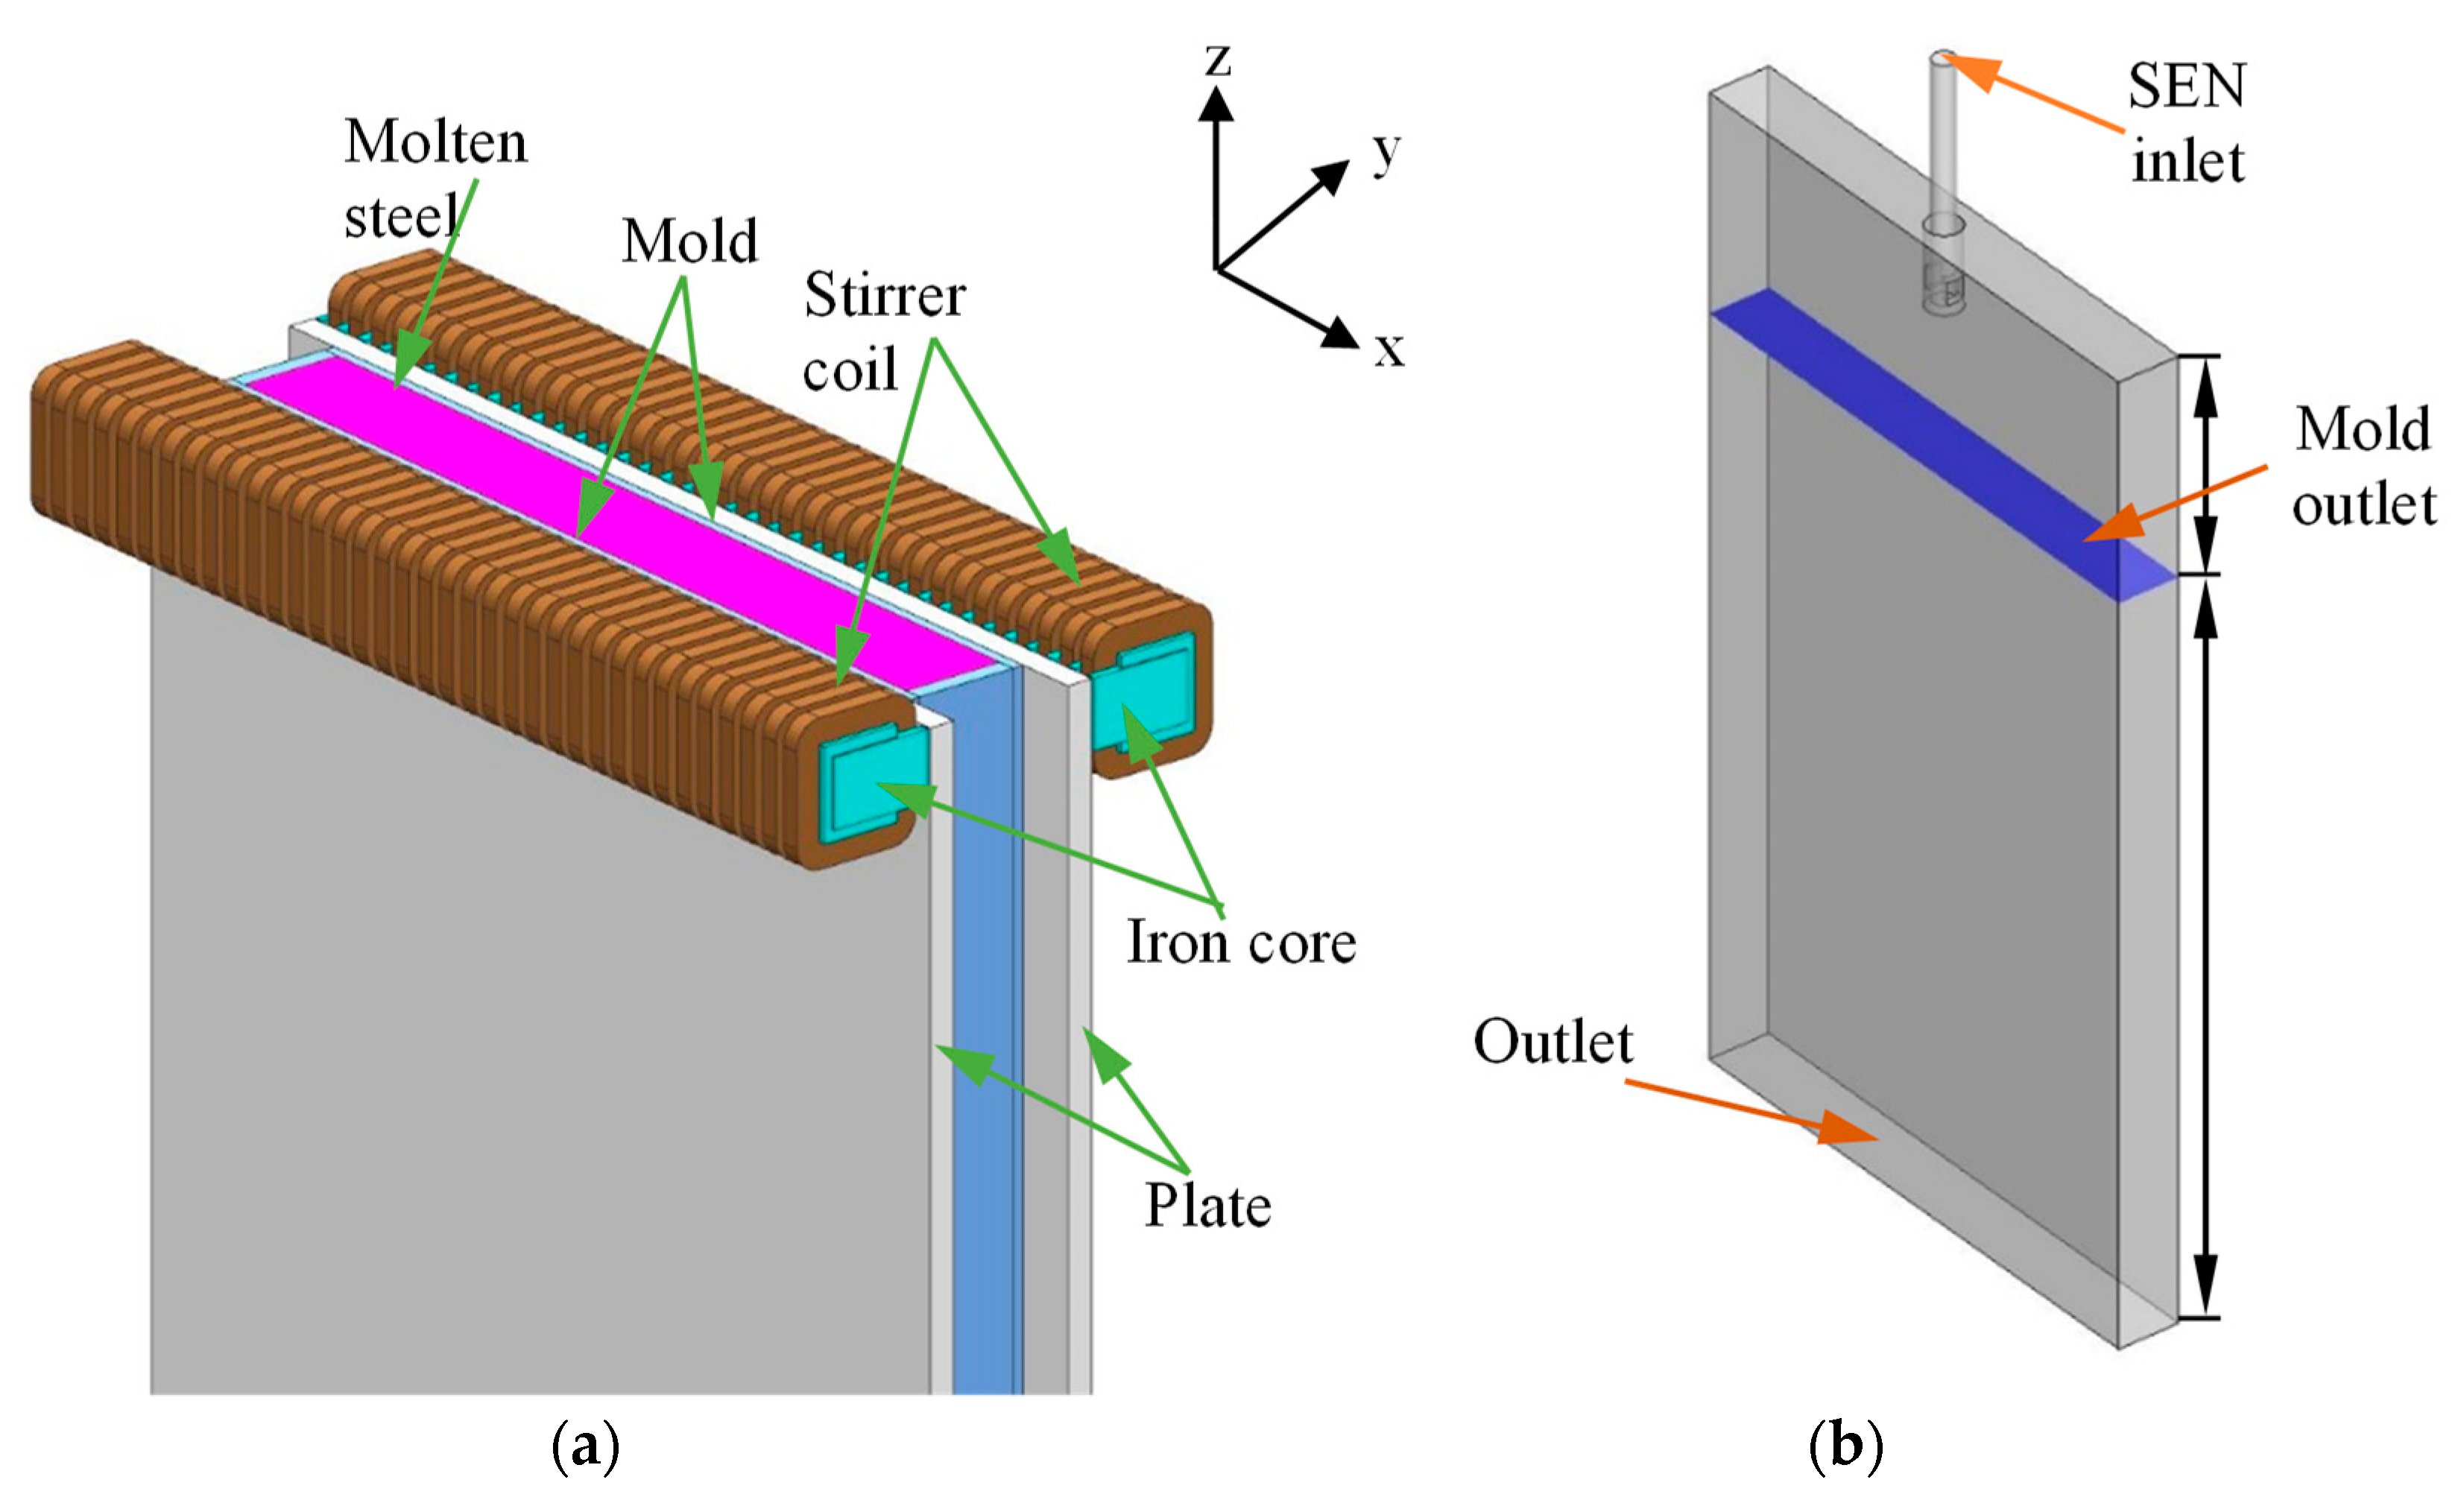
2.3. Geometrical Model and Boundary Conditions
2.3.1. Geometry Model
2.3.2. Boundary Conditions for Electromagnetic Simulation
2.3.3. Boundary Conditions for Flow Simulation
3. Results and Discussion
3.1. Validation of Electromagnetic Model
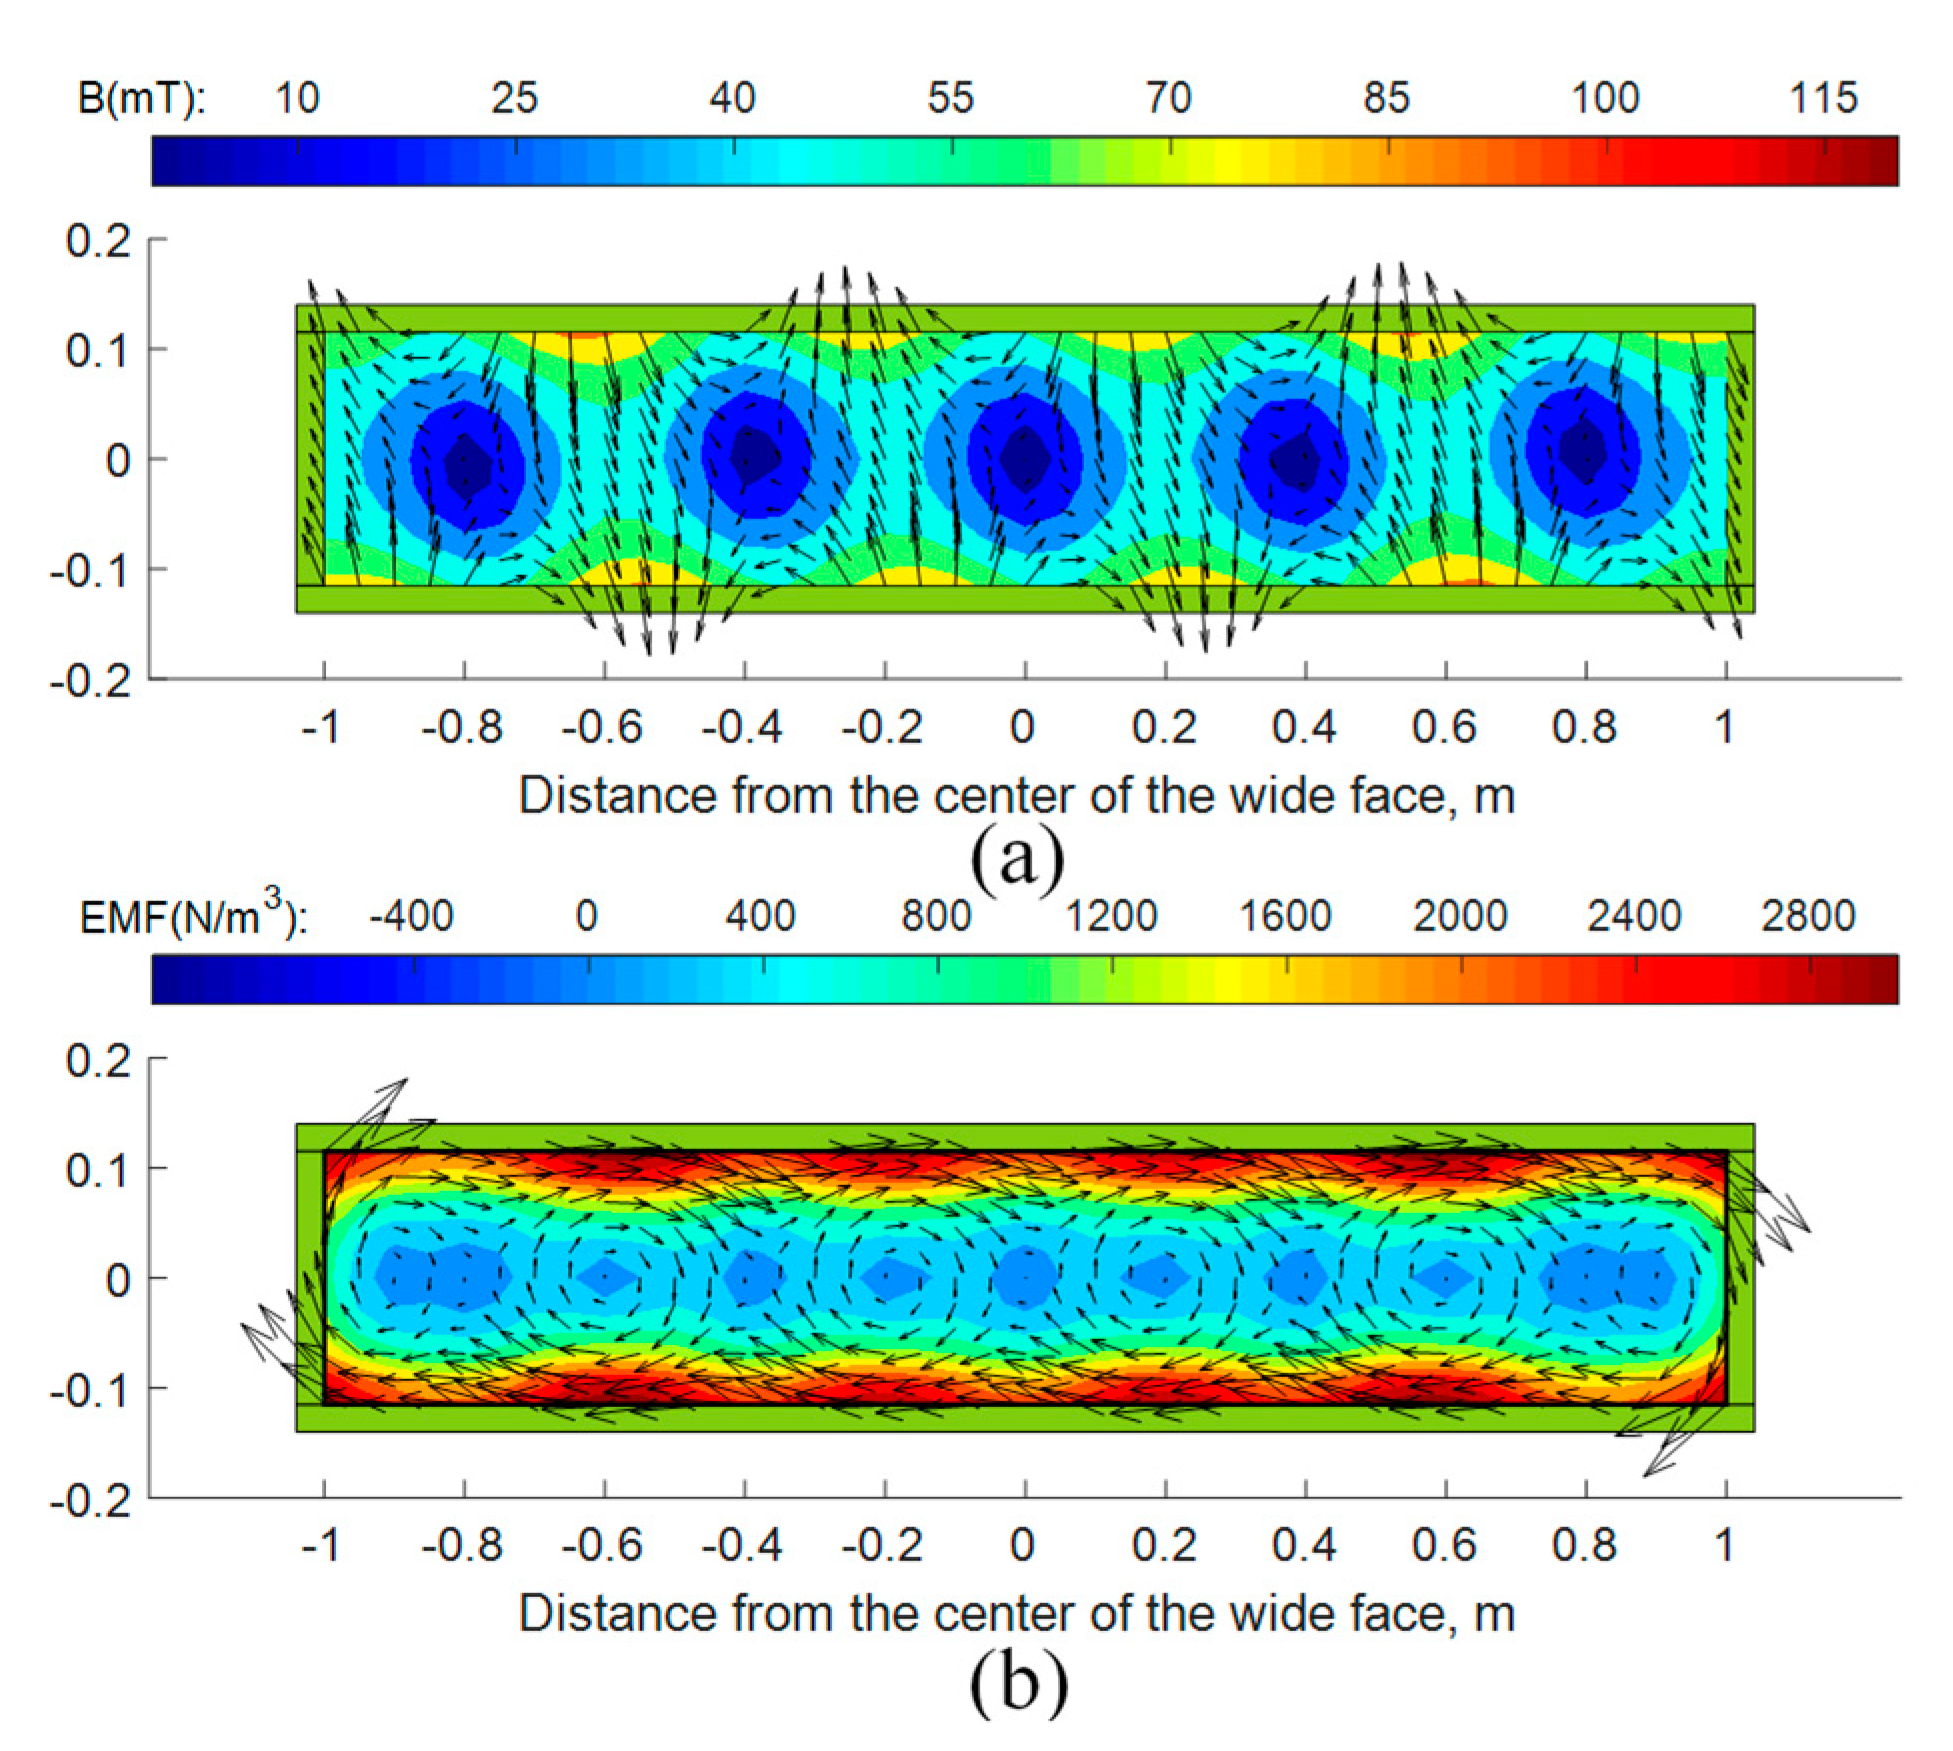
3.2. Effect of EMS Current on Electromagnetic Field
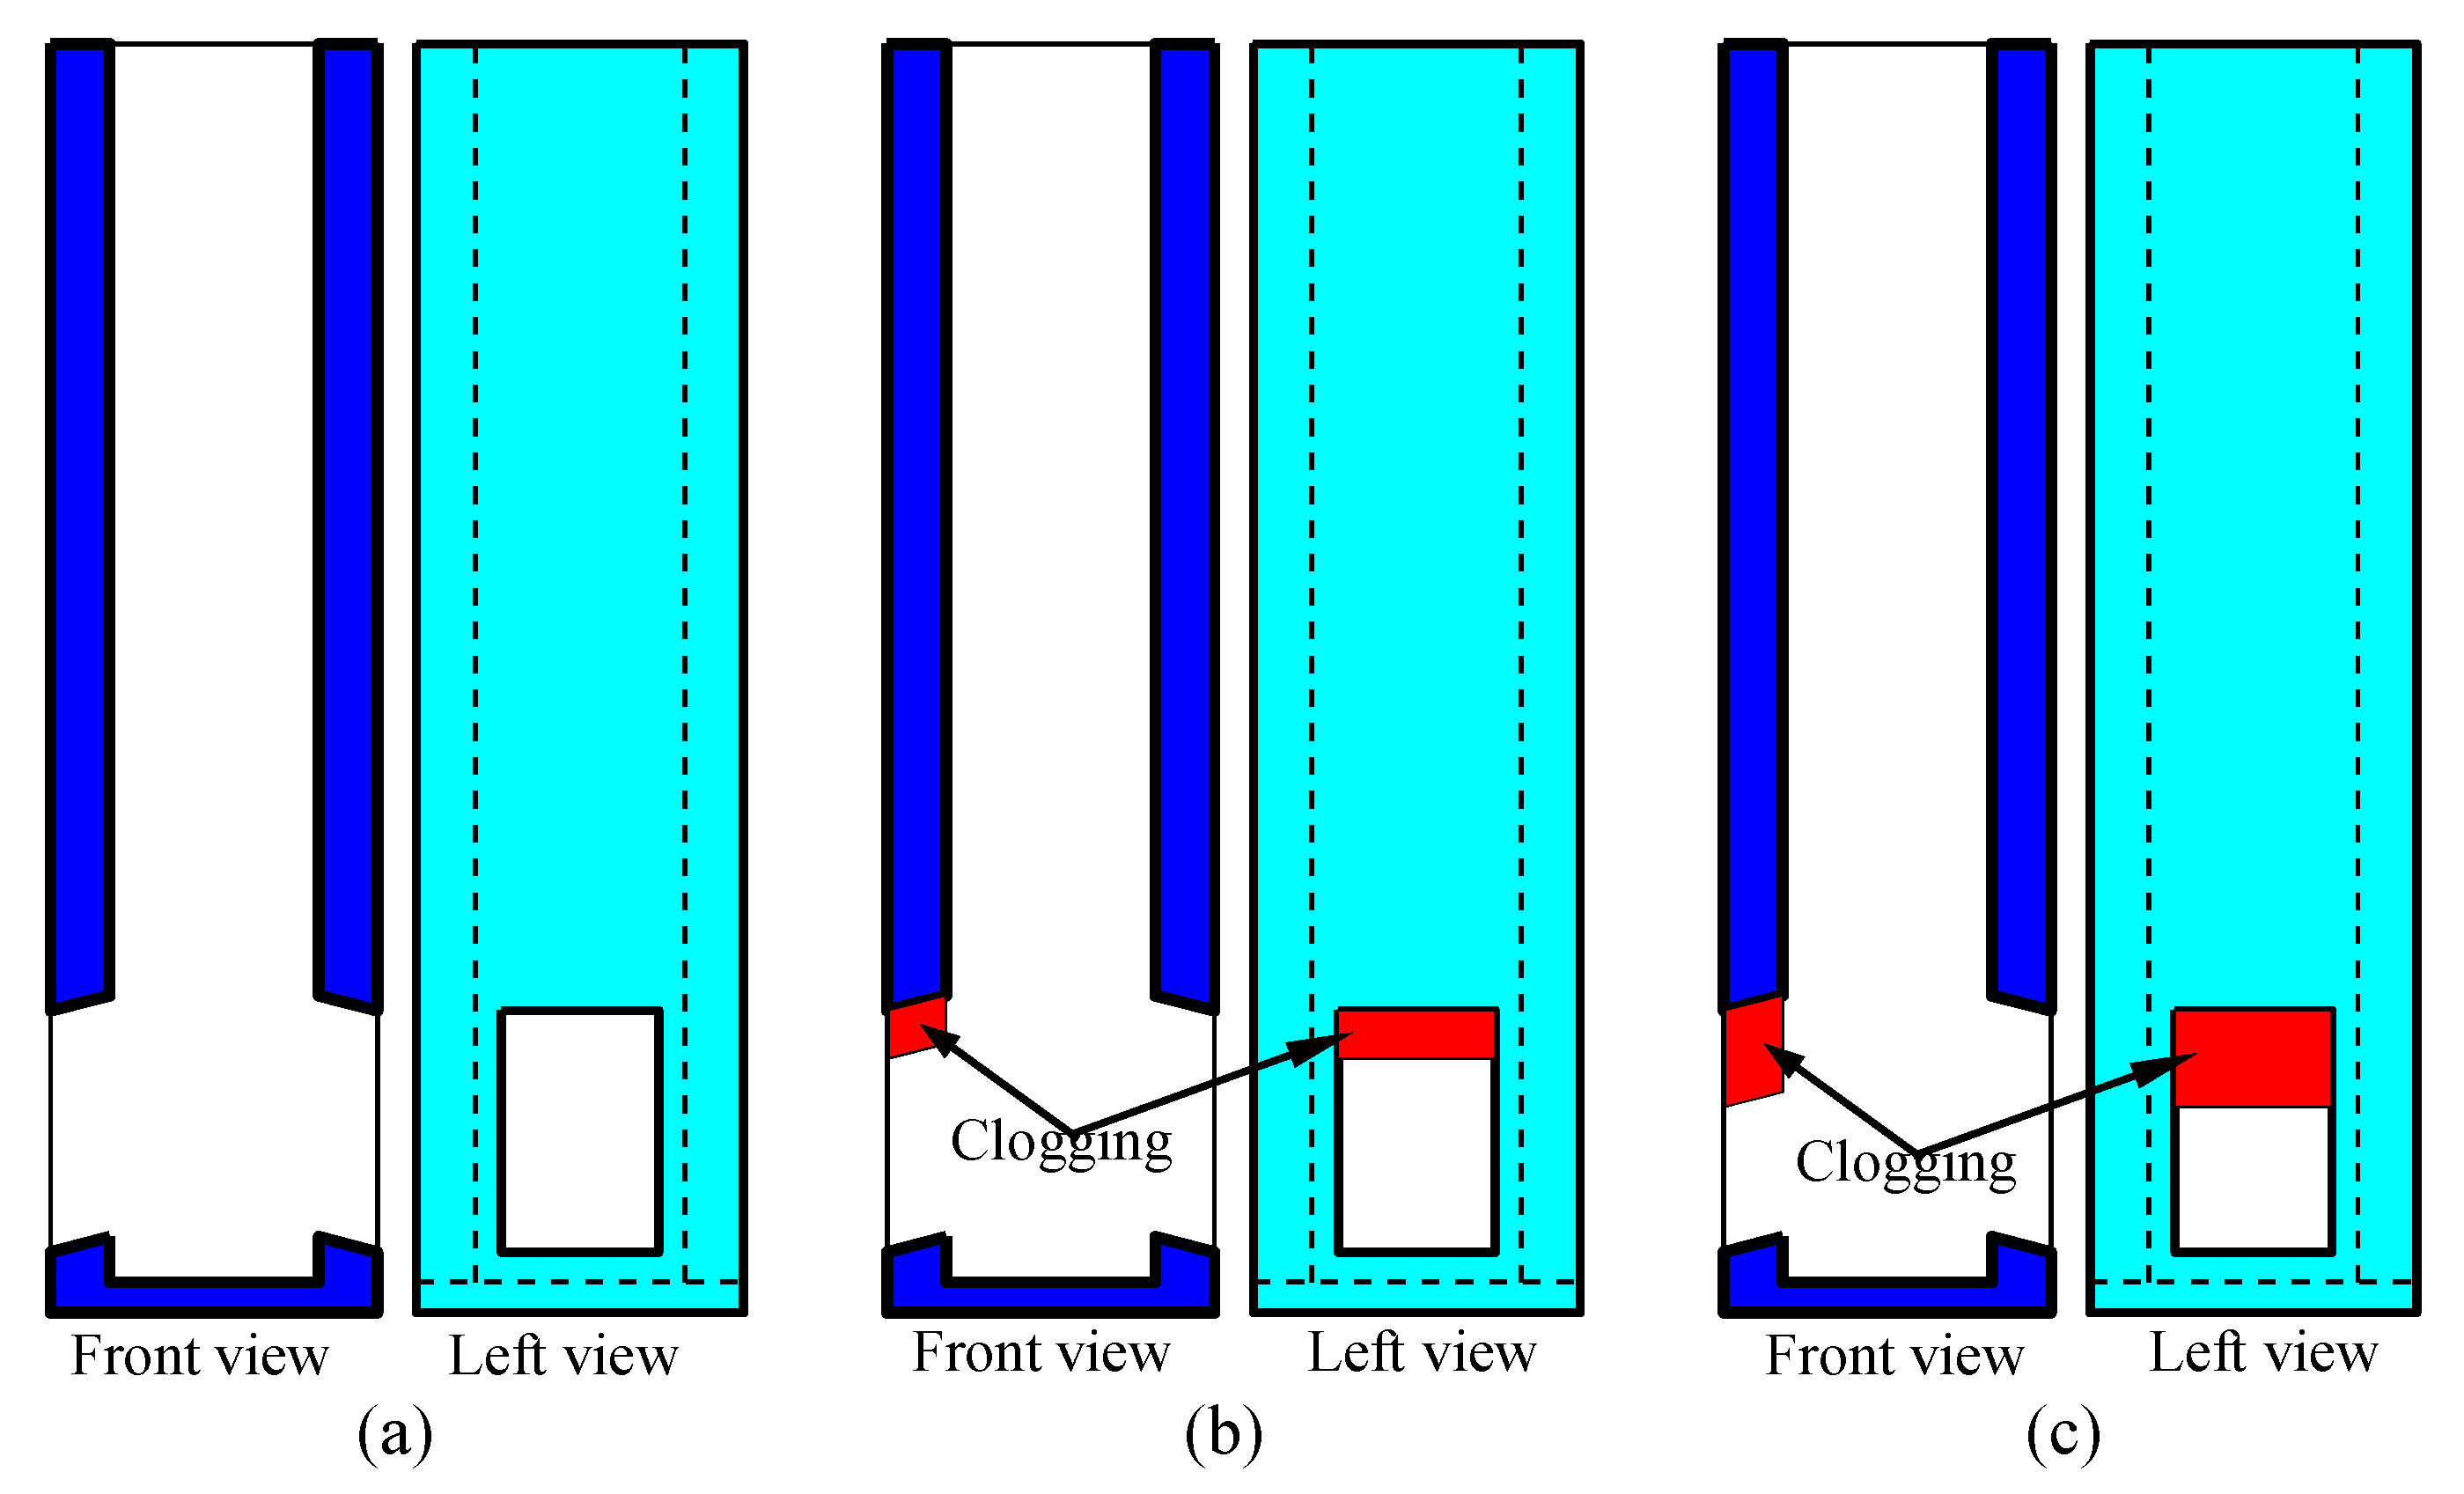
3.3. Effect of SEN Clogging Rate on Mold Flow
3.3.1. Effect of SEN Clogging Rate on Free Surface Flow
3.3.2. Effect of SEN Clogging Rate on the Symmetry of Flow Field
3.4. Effect of EMS on the Asymmetric Mold Flow
3.4.1. Effect of EMS on Free Surface Flow with SEN Clogging
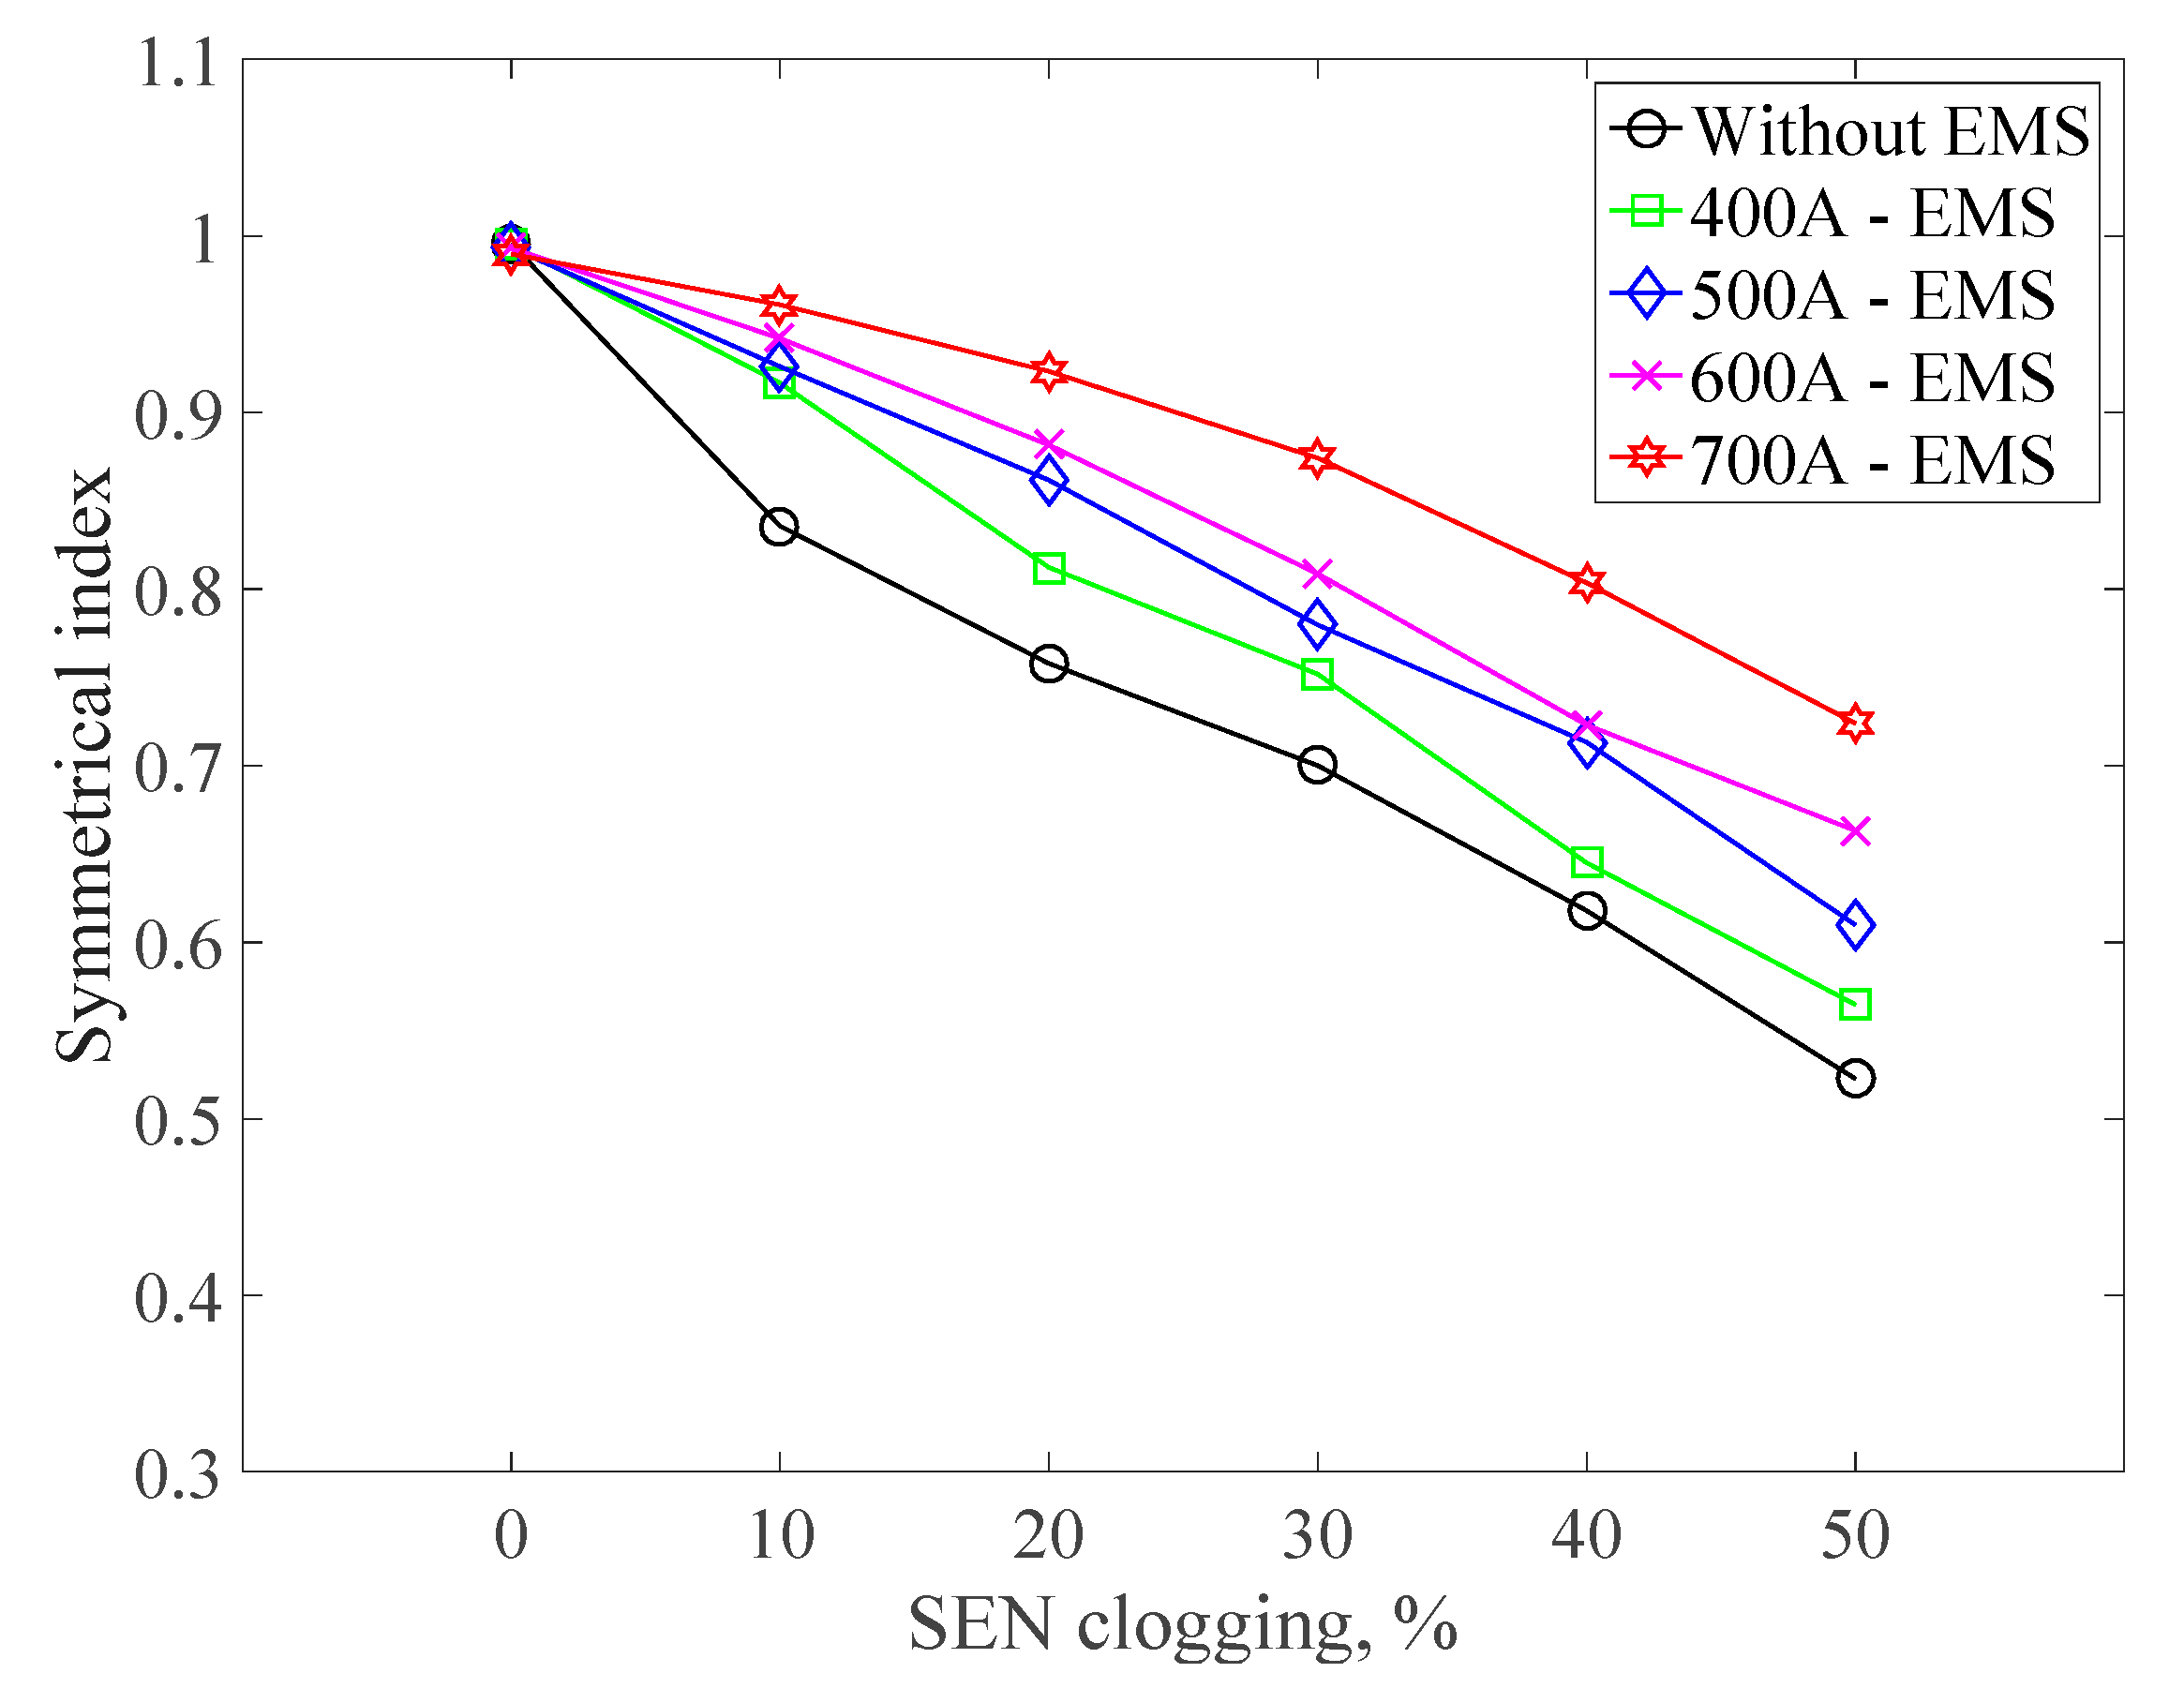
3.4.2. Effect of EMS on the Symmetry of Flow Field with SEN Clogging
4. Conclusions
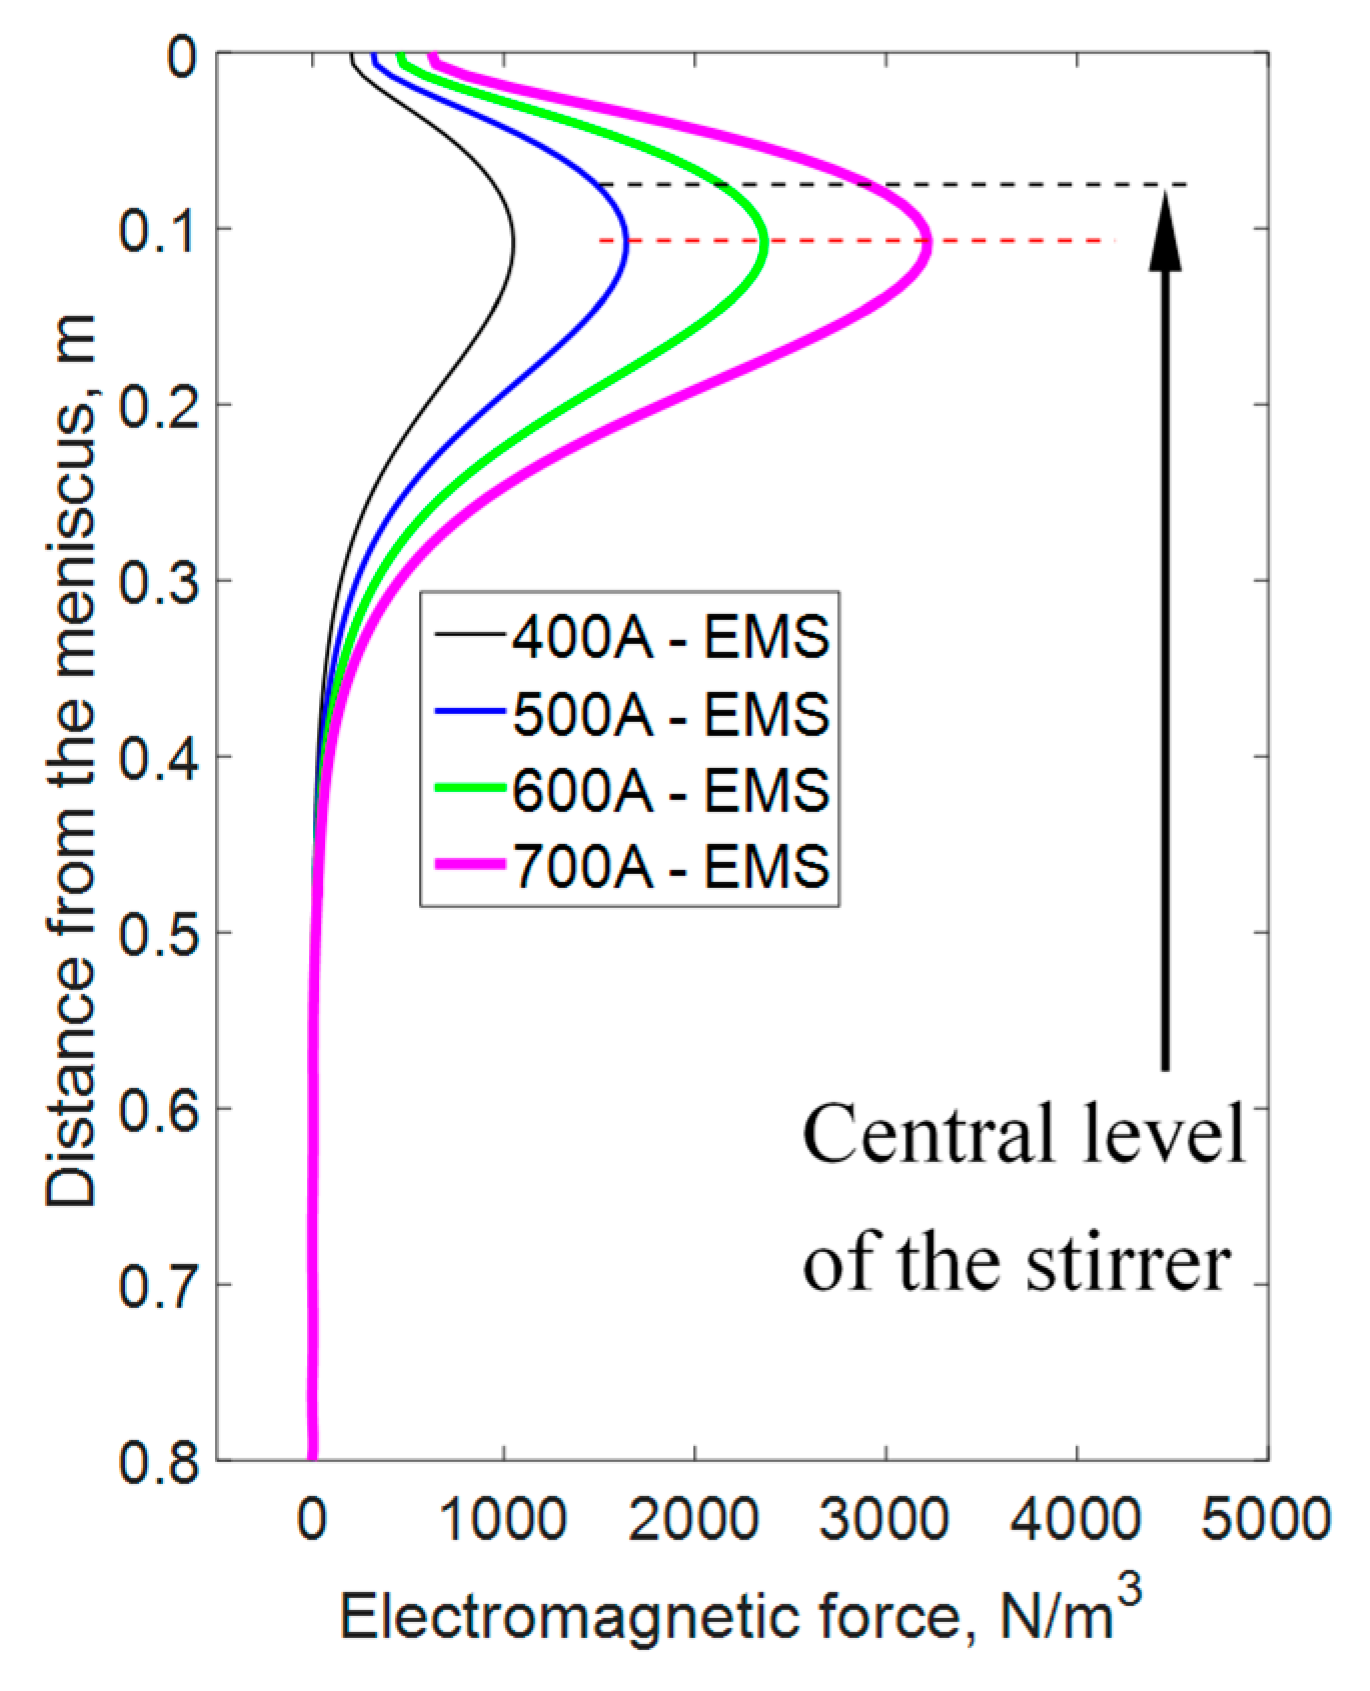
- (1)
- With the increase of distance from the meniscus, the electromagnetic force first increased and then decreased, and the maximum electromagnetic force occurred 0.032 m below the central level of the stirrer.
- (2)
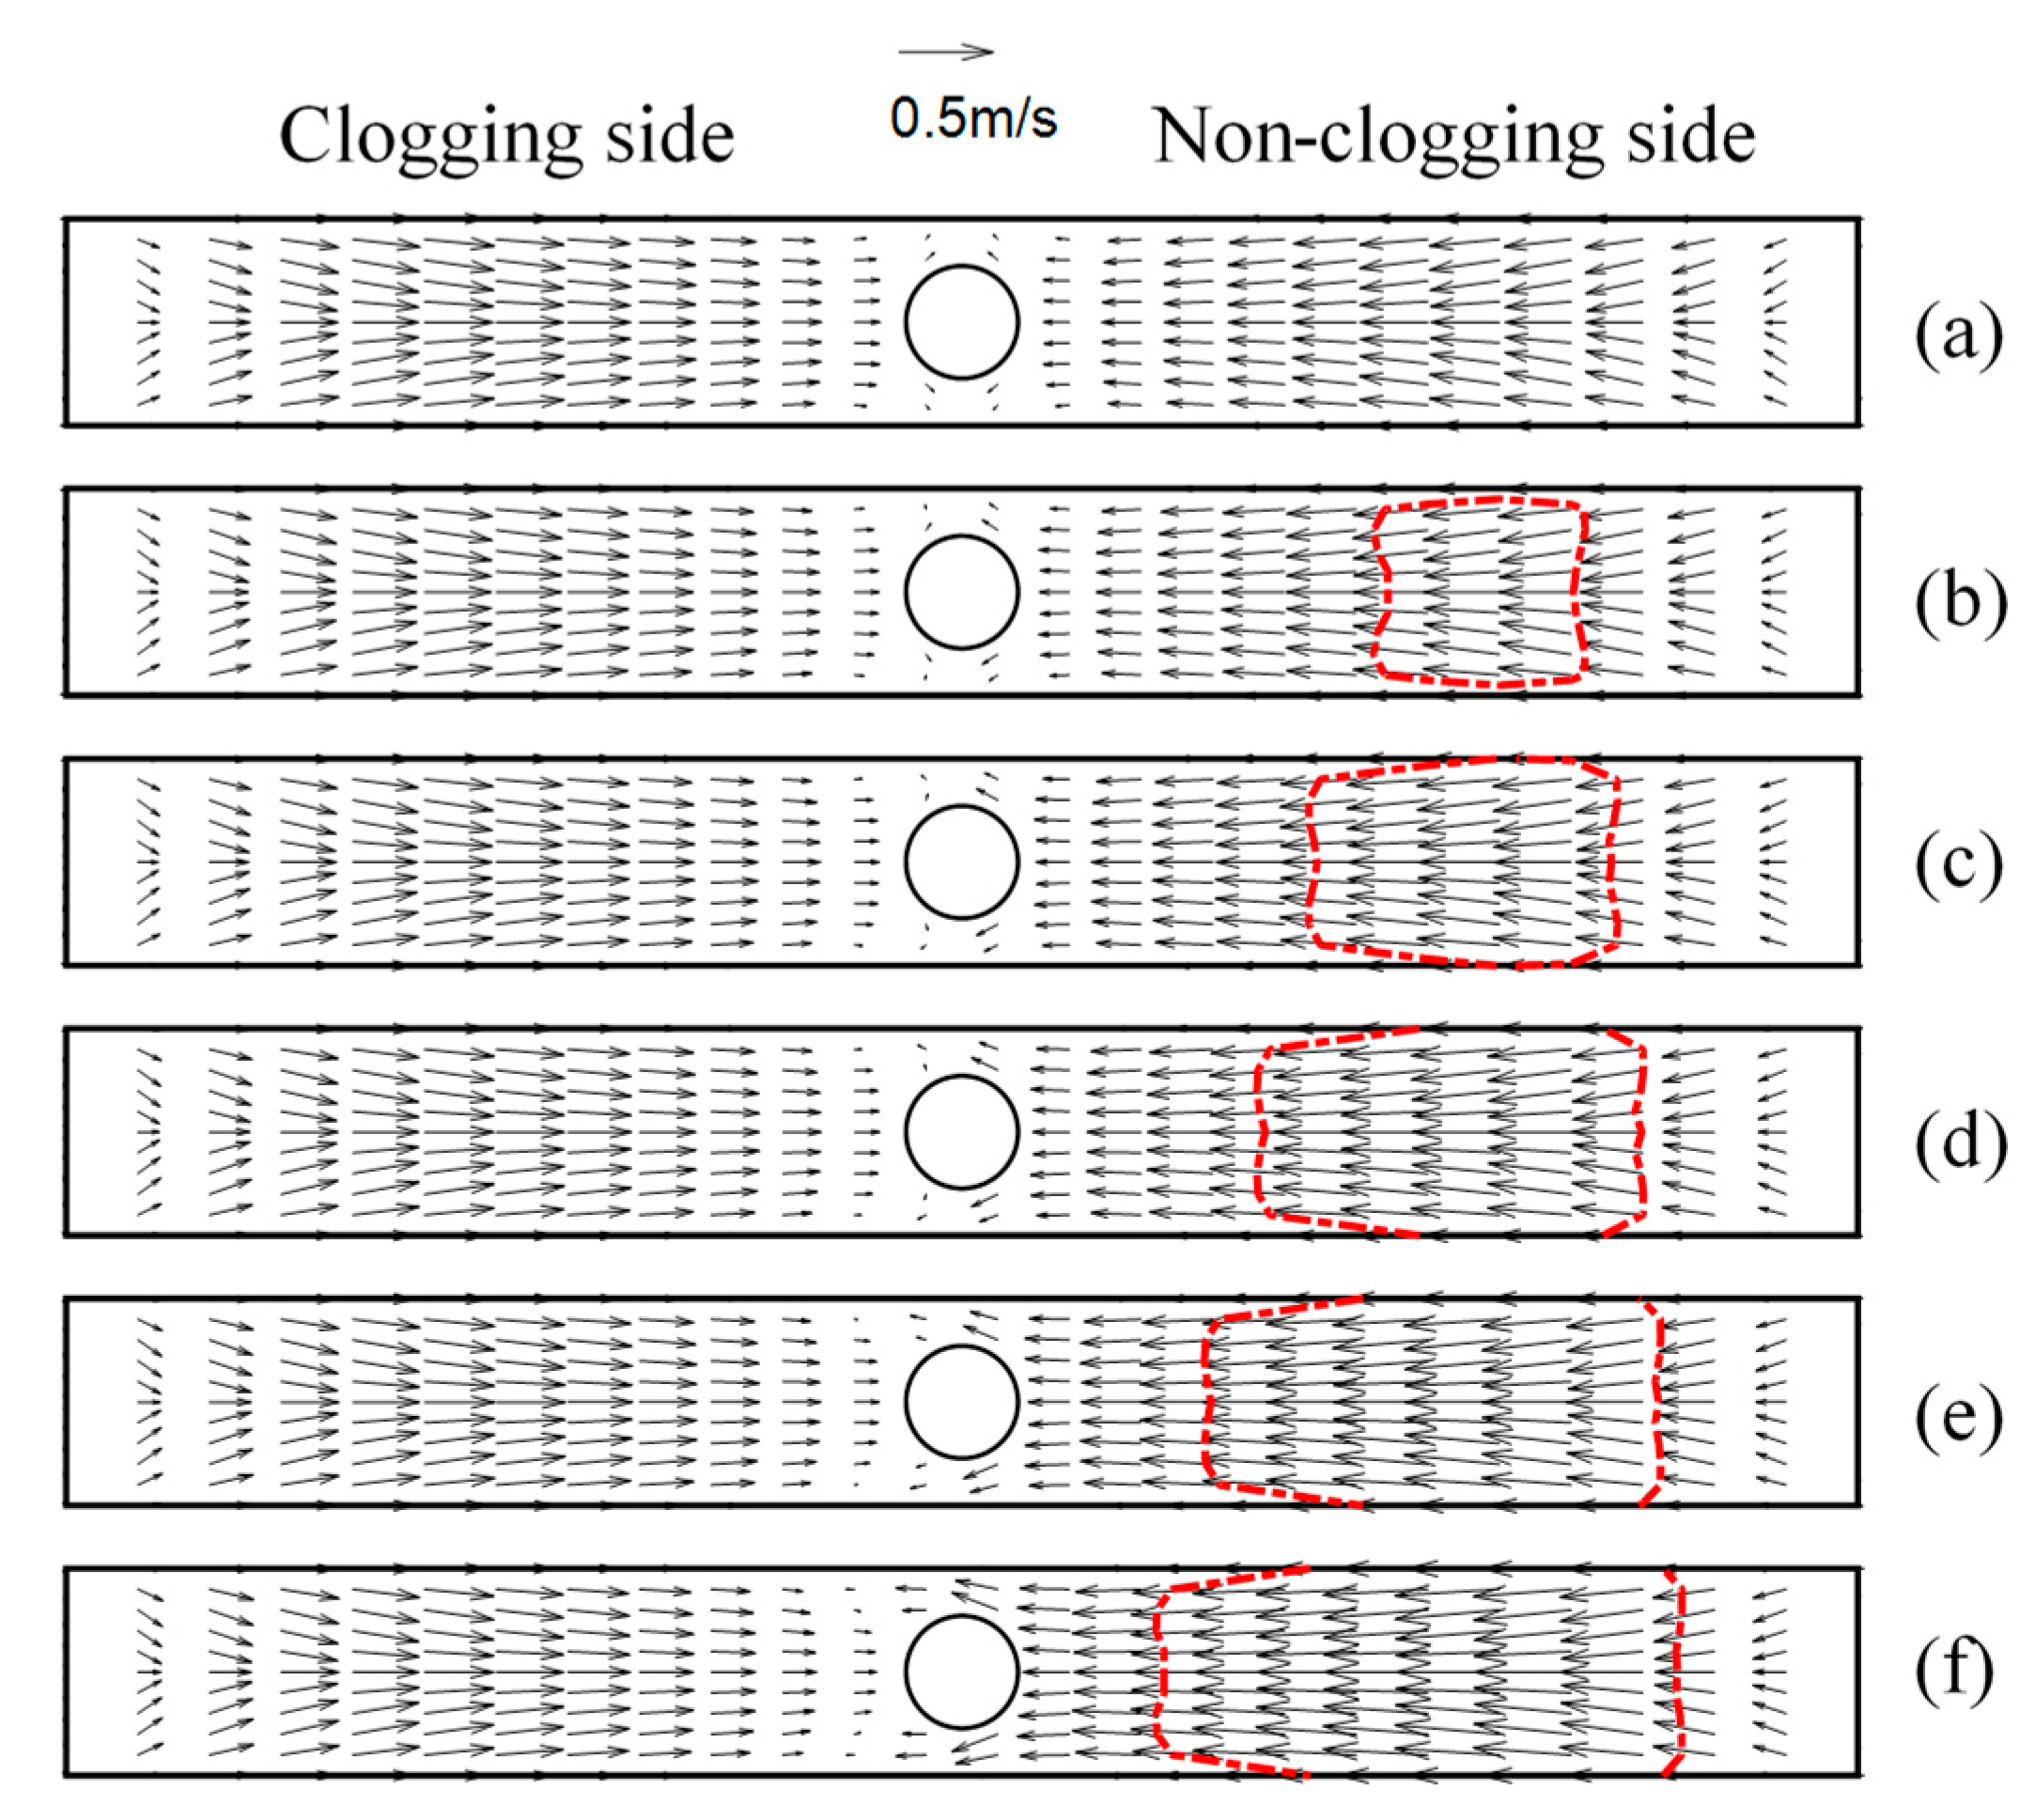
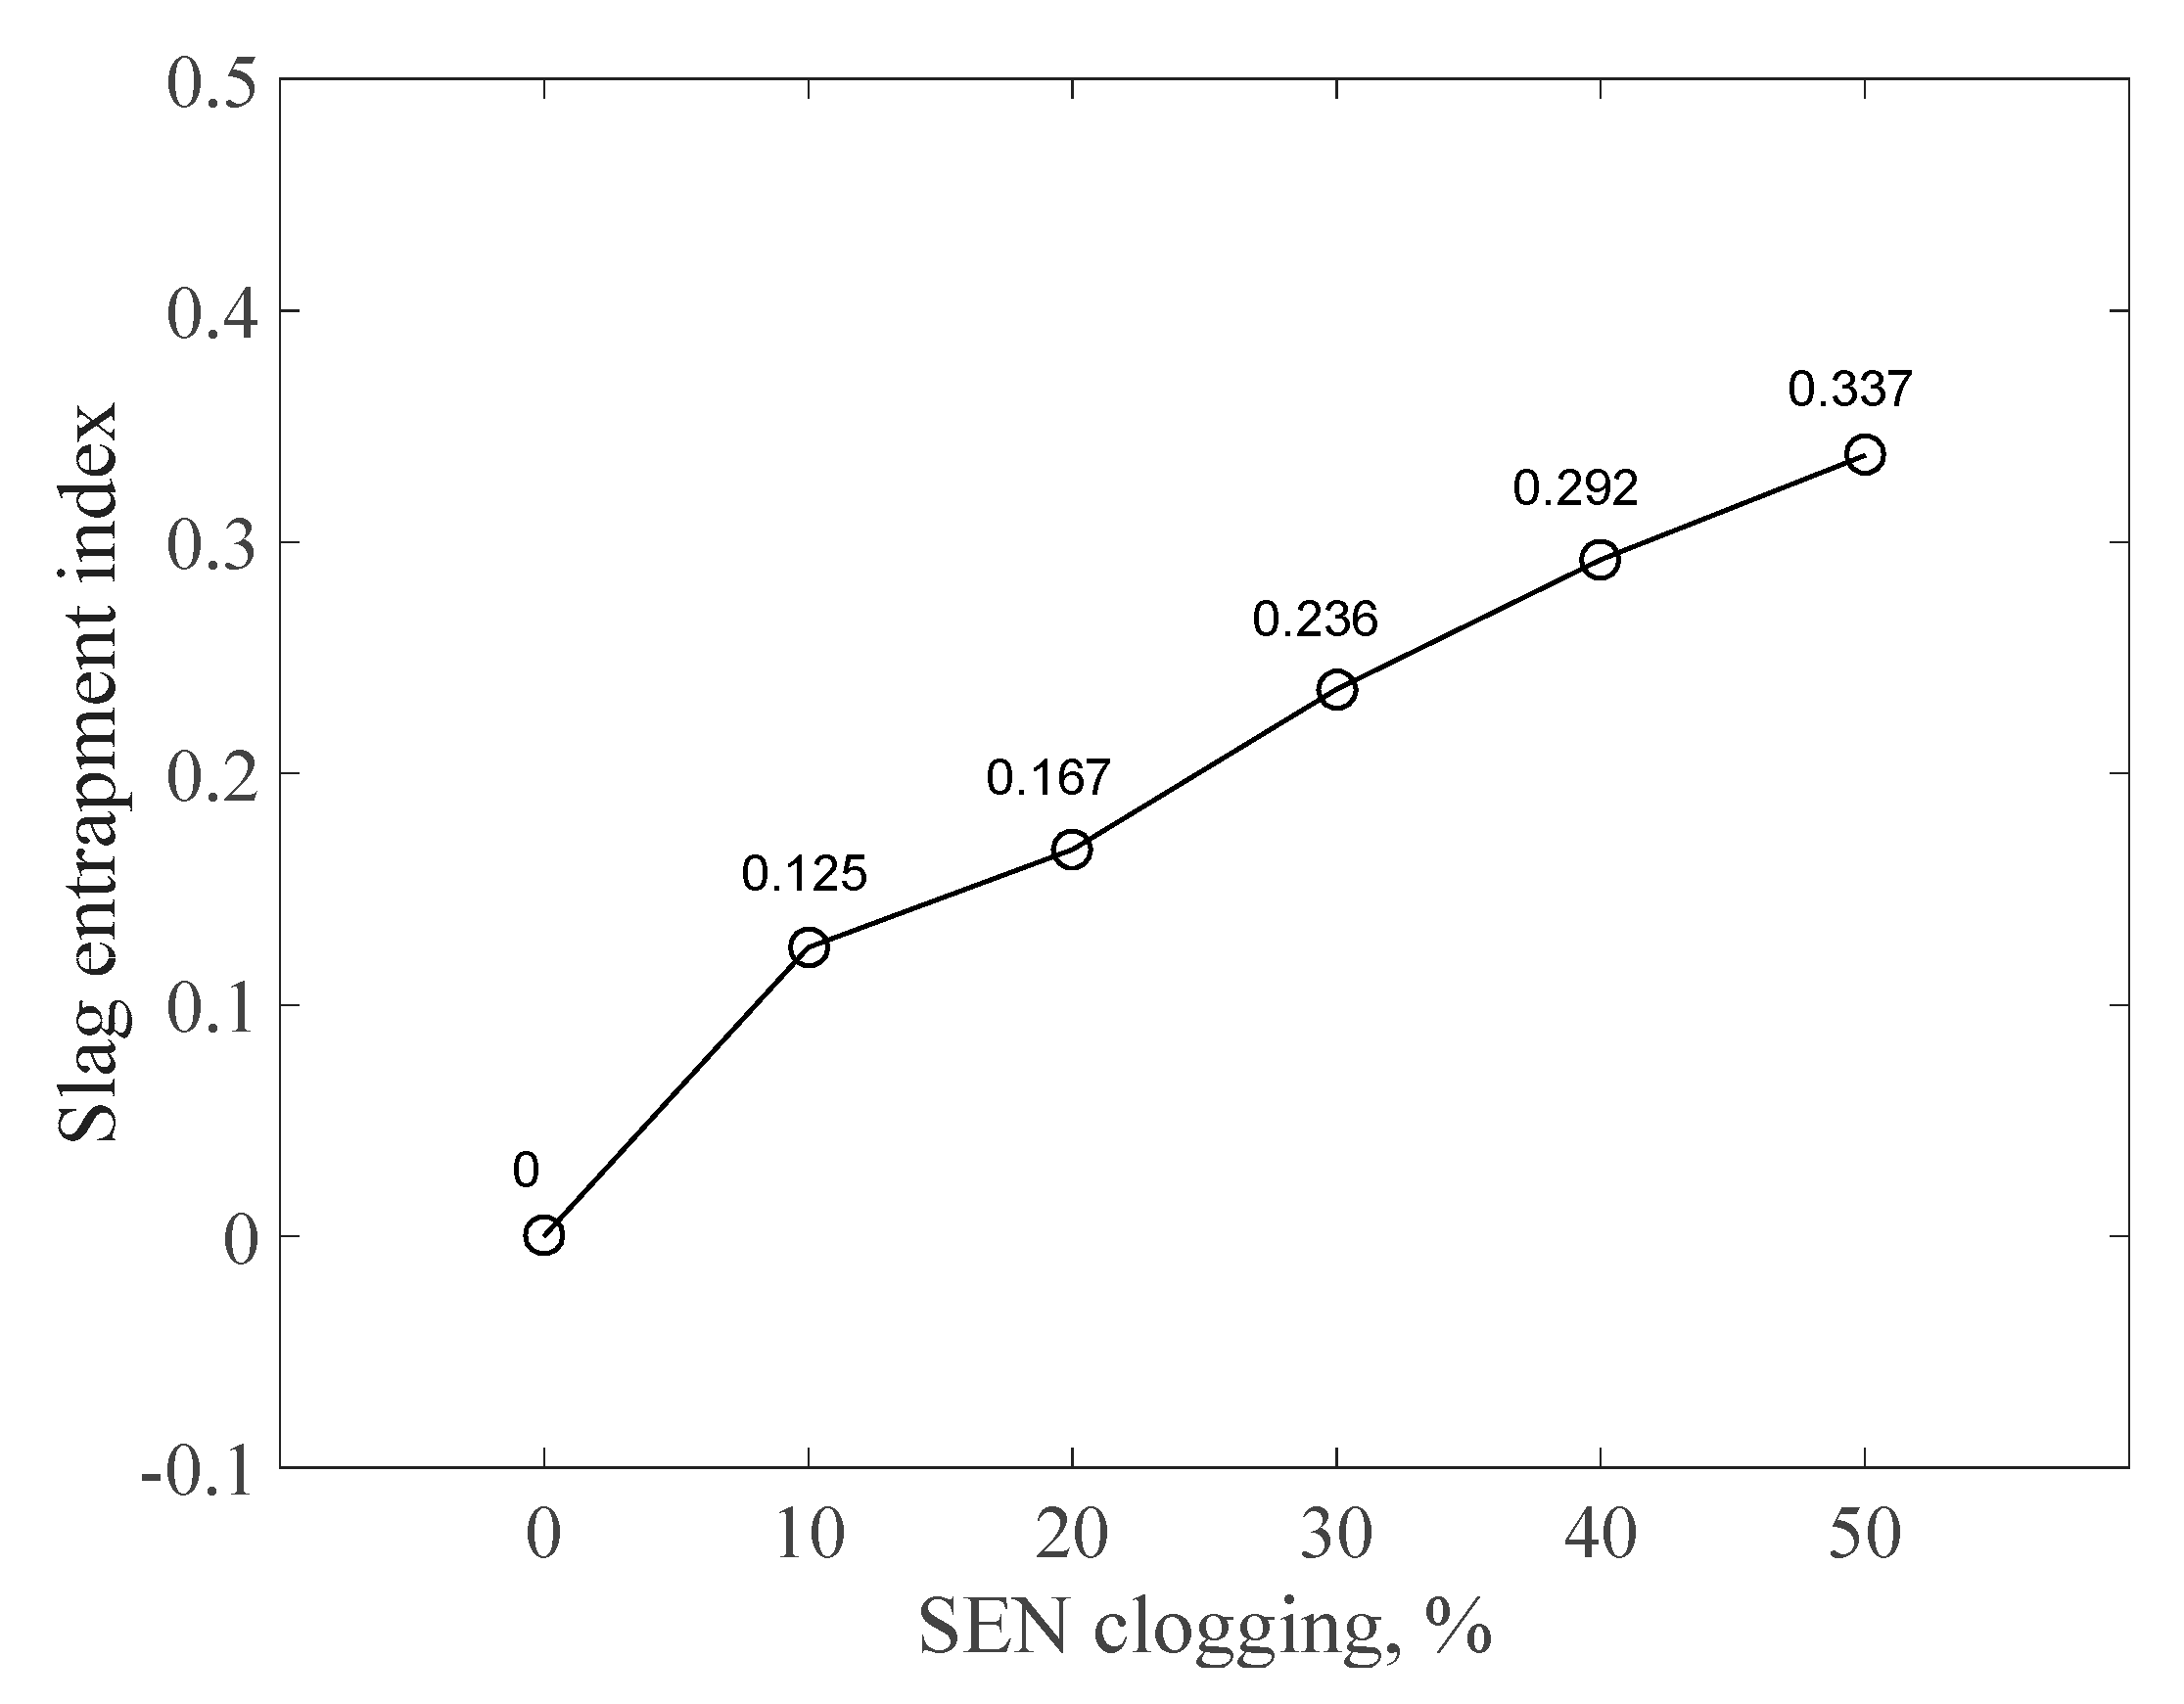
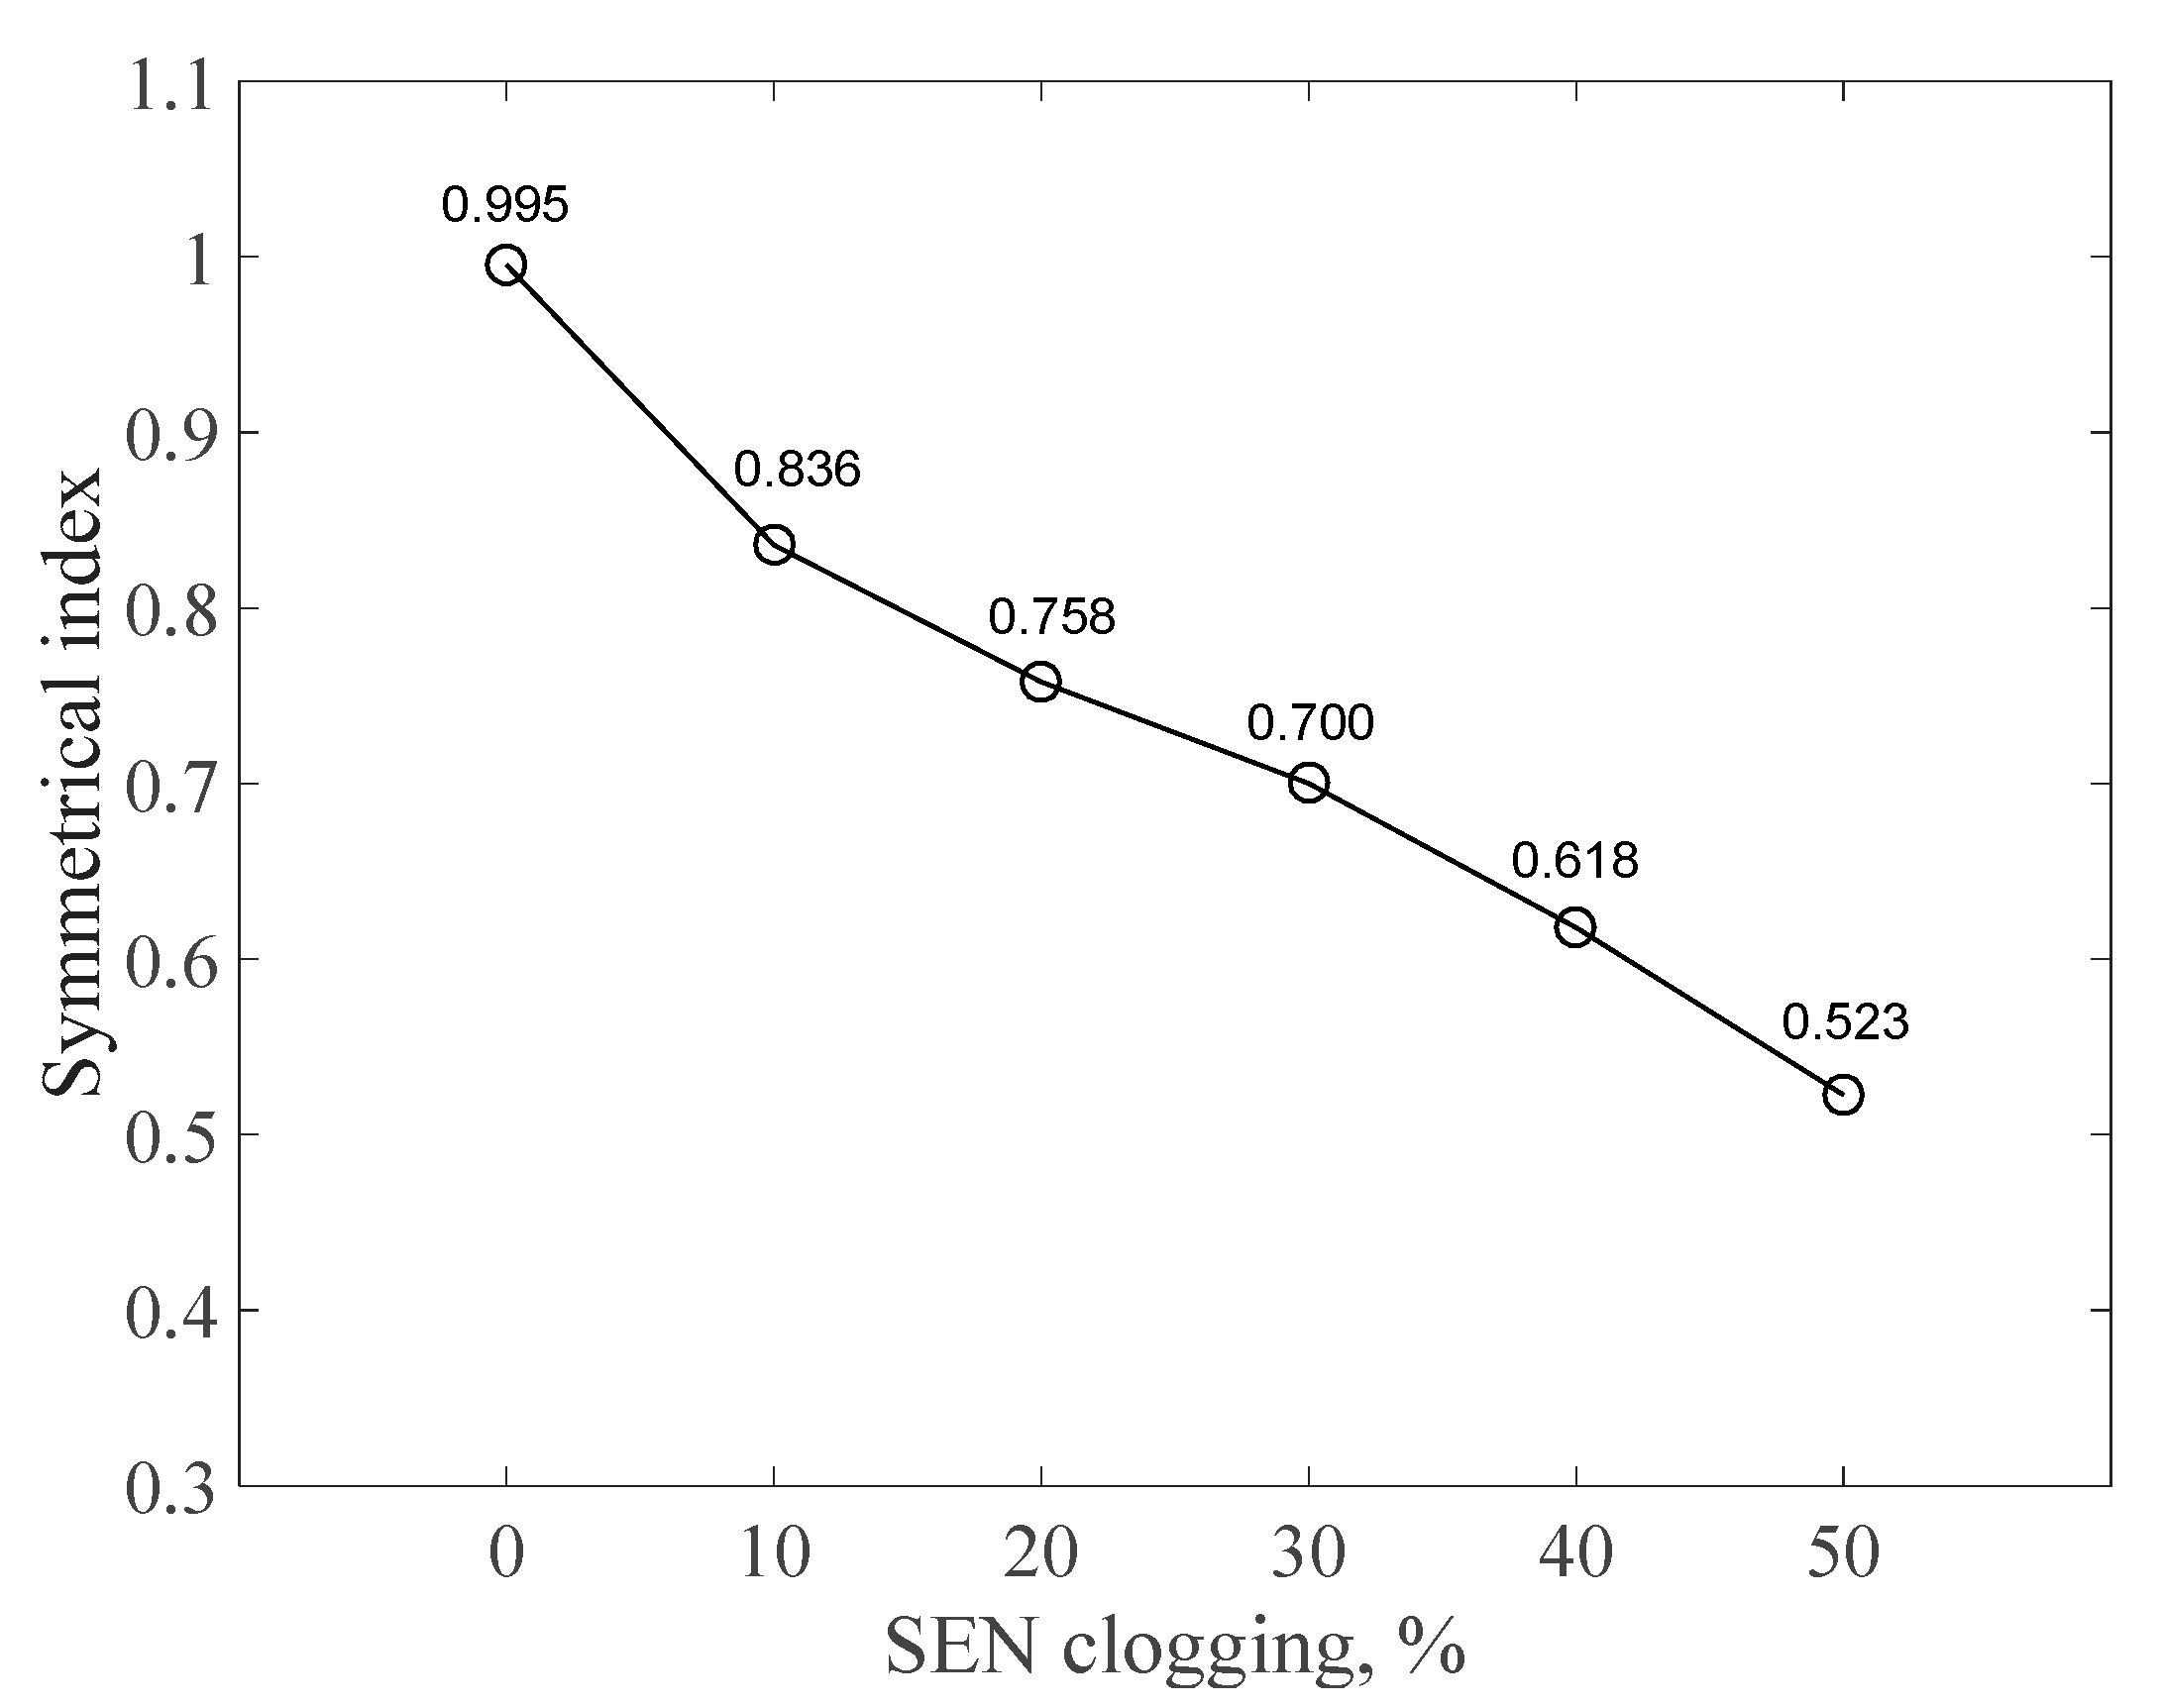
- When the SEN port was clogging, more molten steel tended to escape from the non-clogging side rather than the clogging side, inducing the asymmetric flow pattern in the mold. When EMS was not applied, as the SEN clogging rate increased, the slag entrapment index Rc increased, but the symmetric index S decreased.
- (3)
- EMS can significantly optimize the adverse free-surface flow and improve the symmetry of the flow field. With the increase of the EMS current, the slag entrapment index Rc first decreased and then increased, while the symmetric index S increased.
- (4)
- Synthetically considering the free-surface flow and the symmetry of the flow field, it can be concluded that when the SEN clogging rate is low, EMS can optimize the asymmetric flow in the mold, but when the SEN clogging rate is high (50%), the asymmetric phenomenon cannot be removed completely because the stirring intensity should be controlled below a safe level to avoid slag entrapment.
Author Contributions
Funding
Conflicts of Interest
References
- Zhang, L.; Wang, Y.; Zuo, X. Flow Transport and Inclusion Motion in Steel Continuous-Casting Mold under Submerged Entry Nozzle Clogging Condition. J. Metall. Mater. Trans. B. 2008, 39, 534–550. [Google Scholar] [CrossRef]
- Gutiérrez, E.; Garcia-Hernandez, S.; Barreto, J.D.J. Mathematical Modeling of Inclusions Deposition at the Upper Tundish Nozzle and the Submerged Entry Nozzle. J. Steel Res. Int. 2016, 87, 1406–1416. [Google Scholar] [CrossRef]
- Bai, H.; Thomas, B.G. Effects of clogging, argon injection, and continuous casting conditions on flow and air aspiration in submerged entry nozzles. J. Metall. Mater. Trans. B. 2001, 32, 707–722. [Google Scholar] [CrossRef]
- Bai, H.; Thomas, B.G. Turbulent flow of liquid steel and argon bubbles in slide-gate tundish nozzles: Part, I. model development and validation. J. Metall. Mater. Trans. B. 2001, 32, 253–267. [Google Scholar] [CrossRef]
- Aksel’rod, L.M.; Baranovskii, M.R.; Mel’nikova, G.G. Clogging of graphite-containing submerged nozzles in casting of steel on a continuous casting machine. J. Refractories. 1991, 32, 661–668. [Google Scholar]
- Fix, W.; Jacobi, H.; Wünnenberg, K. Collision-controlled growth of composites in casting nozzles. J. Steel Res. Int. 1993, 64, 71–76. [Google Scholar] [CrossRef]
- Uemura, K.-I.; Takahashi, M.; Koyama, S. Filtration Mechanism of Non-metallic Inclusions in Steel by Ceramic Loop Filter. J. ISIJ Int. 1992, 32, 150–156. [Google Scholar] [CrossRef]
- Taniguchi, S.; Brimacombe, J.K. Application of Pinch Force to the Separation of Inclusion Particles from Liquid Steel. J. ISIJ Int. 1994, 34, 722–731. [Google Scholar] [CrossRef]
- Jin, K.; Vanka, S.P.; Thomas, B.G. Large Eddy Simulations of Electromagnetic Braking Effects on Argon Bubble Transport and Capture in a Steel Continuous Casting Mold. J. Metall. Mater. Trans. B. 2018, 49, 1360–1377. [Google Scholar] [CrossRef]
- Vermeulen, Y.; Coletti, B.; Blanpain, B. Material Evaluation to Prevent Nozzle Clogging during Continuous Casting of Al Killed Steels. J. ISIJ Int. 2002, 42, 1234–1240. [Google Scholar] [CrossRef]
- Vermeulen, Y.; Coletti, B.; Wollants, P.; Blanpain, B.; Haers, F. Clogging in submerged entry nozzles. J. Steel Res. Int. 2000, 71, 391–395. [Google Scholar] [CrossRef]
- Memarpour, A.; Brabie, V.; Jönsson, P. Studies of effect of glass/silicon powder coatings on clogging behaviour of submerged entry nozzles when using REM alloyed stainless steels. J. Ironmak. Steelmak. 2013, 38, 229–239. [Google Scholar] [CrossRef]
- Machado-Lopez, M.M.; Ramos-Banderas, J.A.; Torres-Alonso, E. Multiphase modelling of liquid steel transfer from tundish to curved billet mould by open stream and equipped with SEN. J. Iron Steel Res. Int. 2013, 40, 326–334. [Google Scholar] [CrossRef]
- Sambasivam, R. Clogging resistant submerged entry nozzle design through mathematical modelling. J. Iron Steel Res. Int. 2006, 33, 439–453. [Google Scholar] [CrossRef]
- Cho, S.M.; Kim, S.H.; Chaudhary, R. Effect of nozzle clogging on surface flow and vortex formation in the continuous casting mold. J. Iron Steel Technology. 2012, 9, 85–95. [Google Scholar]
- Srinivas, P.S.; Singh, A.; Korath, J.M. A water-model experimental study of vortex characteristics due to nozzle clogging in slab caster mould. J. Iron Steel Res. Int. 2017, 44, 473–485. [Google Scholar] [CrossRef]
- Qin, X.; Cheng, C.; Li, Y. A Simulation Study on the Flow Behavior of Liquid Steel in Tundish with Annular Argon Blowing in the Upper Nozzle. J. Metals. 2019, 9, 225. [Google Scholar] [CrossRef]
- Li, Y.; Cheng, C.; Yang, M. Behavior Characteristics of Argon Bubbles on Inner Surface of Upper Tundish Nozzle during Argon Blowing Process. J. Metals. 2018, 8, 590. [Google Scholar] [CrossRef]
- Zhang, L.; Aoki, J.; Thomas, B.G. Inclusion removal by bubble flotation in a continuous casting mold. J. Metall. Mater. Trans. B. 2006, 37, 361–379. [Google Scholar] [CrossRef]
- Yang, H.L.; He, P.; Zhai, Y.C. Removal Behavior of Inclusions in Molten Steel by Bubble Wake Flow Based on Water Model Experiment. J. ISIJ. 2014, 54, 578–581. [Google Scholar] [CrossRef][Green Version]
- Launder, B.E.; Spalding, D.B. The numerical computation of turbulent flows. J. Comput. Method. Appl. M. 1974, 3, 269–289. [Google Scholar] [CrossRef]
- Zhang, L.; Yu, J.; Wang, W. The Effect of Electromagnetic Stirring on the Microstructure Evolution of Cu-15%Co Alloy. J. Metals. 2018, 8, 869. [Google Scholar] [CrossRef]
- He, M.; Zhang, Z.; Mao, W. Numerical and Experimental Study on Melt Treatment for Large-Volume 7075 Alloy by a Modified Annular Electromagnetic Stirring. J. Mater. 2019, 12, 820. [Google Scholar] [CrossRef] [PubMed]
- Li, S.; Xiao, H.; Wang, P. Analysis on Electromagnetic Field of Continuous Casting Mold Including a New Integral Method for Calculating Electromagnetic Torque. J. Metals. 2019, 9, 946. [Google Scholar] [CrossRef]
- Lei, S.; Zhang, J.; Zhao, X. Numerical Simulation of Molten Steel Flow and Inclusions Motion Behavior in the Solidification Processes for Continuous Casting Slab. J. ISIJ Int. 2014, 54, 94–102. [Google Scholar] [CrossRef]
- Moffatt, H.K. Electromagnetic stirring. J. Phys. Fluids A: Fluid Dyn. 1991, 3, 1336–1343. [Google Scholar] [CrossRef]
- Zhang, W.; Luo, S.; Chen, Y. Numerical Simulation of Fluid Flow, Heat Transfer, Species Transfer, and Solidification in Billet Continuous Casting Mold with M-EMS. J. Metals. 2019, 9, 66. [Google Scholar] [CrossRef]
- Yin, Y.; Zhang, J.; Lei, S. Numerical Study on the Capture of Large Inclusion in Slab Continuous Casting with the Effect of In-mold Electromagnetic Stirring. J. ISIJ Int. 2017, 57, 2165–2174. [Google Scholar] [CrossRef]
- Cukierski, K.; Thomas, B.G. Flow Control with Local Electromagnetic Braking in Continuous Casting of Steel Slabs. J. Metall. Mater. Trans. B. 2007, 39, 94–107. [Google Scholar] [CrossRef]
- Chaudhary, R.; Lee, G.-G.; Thomas, B.G. Transient Mold Fluid Flow with Well- and Mountain-Bottom Nozzles in Continuous Casting of Steel. J. Metall. Mater. Trans. B. 2008, 39, 870–884. [Google Scholar] [CrossRef]
- Li, B.; Lu, H.B.; Shen, Z. Physical Modeling of Asymmetrical Flow in Slab Continuous Casting Mold due to Submerged Entry Nozzle Clogging with the Effect of Electromagnetic Stirring. J. ISIJ Int. 2019, 59, 2264–2271. [Google Scholar]


| Parameters | Value |
|---|---|
| Mold section (mm) | 2000 × 230 |
| Mold height (mm) | 800 |
| Spray zone (mm) | 2700 |
| Inner diameter of SEN (mm) | 80 |
| External diameter of SEN (mm) | 125 |
| Submerged depth of SEN (mm) | 170 |
| SEN port (mm) | 80 × 60 |
| Port angle of SEN (°) | –15 |
| SEN clogging rate (%) | 0, 10, 20, 30, 40, 50 |
| Casting speed (m/min) | 1.5 |
| EMS frequency (Hz) | 3 |
| EMS current (A) | 0, 400, 500, 600, 700 |
| Coil number of each stirrer | 36 |
| Turn number of every coil | 20 |
| Density of molten steel (kg/m3) | 7200 |
| Viscosity of molten steel (Pa·s) | 0.0056 |
© 2019 by the authors. Licensee MDPI, Basel, Switzerland. This article is an open access article distributed under the terms and conditions of the Creative Commons Attribution (CC BY) license (http://creativecommons.org/licenses/by/4.0/).
Share and Cite
Li, B.; Lu, H.; Zhong, Y.; Ren, Z.; Lei, Z. Influence of EMS on Asymmetric Flow with Different SEN Clogging Rates in a Slab Continuous Casting Mold. Metals 2019, 9, 1288. https://doi.org/10.3390/met9121288
Li B, Lu H, Zhong Y, Ren Z, Lei Z. Influence of EMS on Asymmetric Flow with Different SEN Clogging Rates in a Slab Continuous Casting Mold. Metals. 2019; 9(12):1288. https://doi.org/10.3390/met9121288
Chicago/Turabian StyleLi, Bin, Haibiao Lu, Yunbo Zhong, Zhongming Ren, and Zuosheng Lei. 2019. "Influence of EMS on Asymmetric Flow with Different SEN Clogging Rates in a Slab Continuous Casting Mold" Metals 9, no. 12: 1288. https://doi.org/10.3390/met9121288
APA StyleLi, B., Lu, H., Zhong, Y., Ren, Z., & Lei, Z. (2019). Influence of EMS on Asymmetric Flow with Different SEN Clogging Rates in a Slab Continuous Casting Mold. Metals, 9(12), 1288. https://doi.org/10.3390/met9121288