Article

Friction and Wear of Pd-Rich Amorphous Alloy (Pd43Cu27Ni10P20) with Ionic Liquid (IL) as Lubricant at High Temperatures

1
Department of Mechanical Engineering, Texas Tech University, Box 41021, Lubbock, TX 79409, USA
2
Department of Chemistry & Biochemistry, Texas Tech University, Lubbock, TX 79409, USA
3
Department of Mechanical Engineering, University of Texas at Dallas, Richardson, TX 75080, USA
4
Department of Chemical Engineering, Texas Tech University, Lubbock, TX 79409, USA
*
Author to whom correspondence should be addressed.
Metals 2019, 9(11), 1180; https://doi.org/10.3390/met9111180
Submission received: 14 October 2019 / Revised: 29 October 2019 / Accepted: 30 October 2019 / Published: 1 November 2019

Abstract

:
The friction and wear behavior of palladium (Pd)-rich amorphous alloy (Pd43Cu27Ni10P20) against 440C stainless steel under ionic liquids as lubricants, i.e., 1-nonyl-3-methylimidazolium bis[(trifluoromethane)sulfonyl]amide ([C9C1im][NTf2]), were investigated using a ball-on-disc reciprocating tribometer at ambient, 100 and 200 °C with different sliding speeds of 3 and 7 mm/s, whose results were compared to those from crystalline Pd samples. The measured coefficient of friction (COF) and wear were affected by both temperature and sliding speed. The COF of crystalline Pd samples dramatically increased when the temperature increased, whereas the COF of the amorphous Pd alloy samples remained low. As the sliding speed increased, the COF of both Pd samples showed decreasing trends. From the analysis of a 3D surface profilometer and scanning electron microscopy (SEM) with electron dispersive spectroscopy (EDS) data, three types of wear (i.e., delamination, adhesive, and abrasive wear) were observed on the crystalline Pd surfaces, whereas the amorphous Pd alloy surfaces produced abrasive wear only. In addition, X-ray photoelectron spectroscopy (XPS) measurements were performed to study the formation of tribofilm. It was found that the chemical reactivity at the contacting interface increased with temperature and sliding contact speed. The ionic liquids (ILs) were effective as lubricants when the applied temperature and sliding speed were 200 °C and 7 mm/s, respectively.

1. Introduction

High friction and excessive wear due to sliding contact in mechanical components such as bearings and gears can cause undesirable energy loss and early system failures [1]. Lubricants have been playing a critical role in improving the energy efficiency and lifespan of machinery by minimizing friction and wear, and they also contribute to sustaining environments by reducing heat, contaminants, and CO2 emissions [1,2,3,4,5]. Accordingly, the development of advanced lubrication techniques has become increasingly important in mechanical components. Ionic liquids (ILs) have attracted significant attention as effective lubricants because of their unique properties such as high thermal stability, non-flammability, high viscosity, miscibility with organic compounds, and negligible vapor pressure [2,3,4,5,6]. These special properties of ILs make them potential lubricants under extreme conditions experienced in applications, such as internal combustion engines, turbines, hydraulic systems, compressors, transmissions, bearings, and aerospace applications [2,3,4,5,6,7,8,9].
ILs are room-temperature molten salts that consist of cations and anions [4,5,6,7,8,9,10]. It has been established that when ILs are applied to metal surfaces as lubricants, the inorganic anions make strong bonds with an exposed contact surface, and the cations form a layer over the anions, thereby forming an ordered layer structure [8,9,10,11,12]. These ordered layers separate interacting surfaces and prevent direct solid to solid contacts. Under higher contact load conditions, the ordered layers of ILs can be broken down and cause tribochemical reactions to occur with the contact surface by sliding contact [12,13,14,15,16,17]. The decomposition products of the anions tend to create a protective tribofilm on the sliding contact surface, which can reduce friction and wear during the subsequent contacts [14,15,16]. The X-ray photoelectron spectroscopy (XPS) and scanning electron microscopy (SEM) with electron dispersive spectroscopy (EDS) analysis have been widely used to examine the formation of tribofilm and the morphology of worn surfaces.
The tribological performance of ILs as lubricants has been widely investigated since 2001 [7]. As a potential lubricant for engineering applications in extreme conditions, the previous studies of ILs have been conducted at high temperatures using conventional materials such as ceramic, steel, aluminum alloys, and titanium [6]. Recently, bulk metallic glasses (BMGs) have attracted increasing attention as potential materials in surface engineering because of high strength, hardness, excellent corrosion and wear resistance, and durability [17,18]. BMGs have been used for dry bearings in space, surface coating materials, cutting tools, sport and medical instruments [17,18,19]. Despite extensive research on ILs as high-temperature lubricants, few studies have investigated the tribological performance of ILs with BMGs. Since both ILs and BMGs have the potential to solve tribological failures and improve the reliability of engineering applications, our aim is to examine their synergetic effectiveness on the tribological performance.
In this study, the IL [C9C1im][NTf2] was synthesized and applied as a lubricant to two metal specimens, Pd-rich amorphous alloy (Pd43Cu27Ni10P20) and crystalline Pd. The tribological performances of the amorphous and crystalline Pd samples against 440C stainless steel balls under the IL-lubricated conditions were investigated using reciprocating ball-on-disc friction tests at various temperatures and speed conditions. The samples were analyzed using an optical profilometer, SEM, EDS, and XPS to understand the friction and wear mechanisms, and the formation of the tribofilm.

2. Sample Preparation and Instrumentation
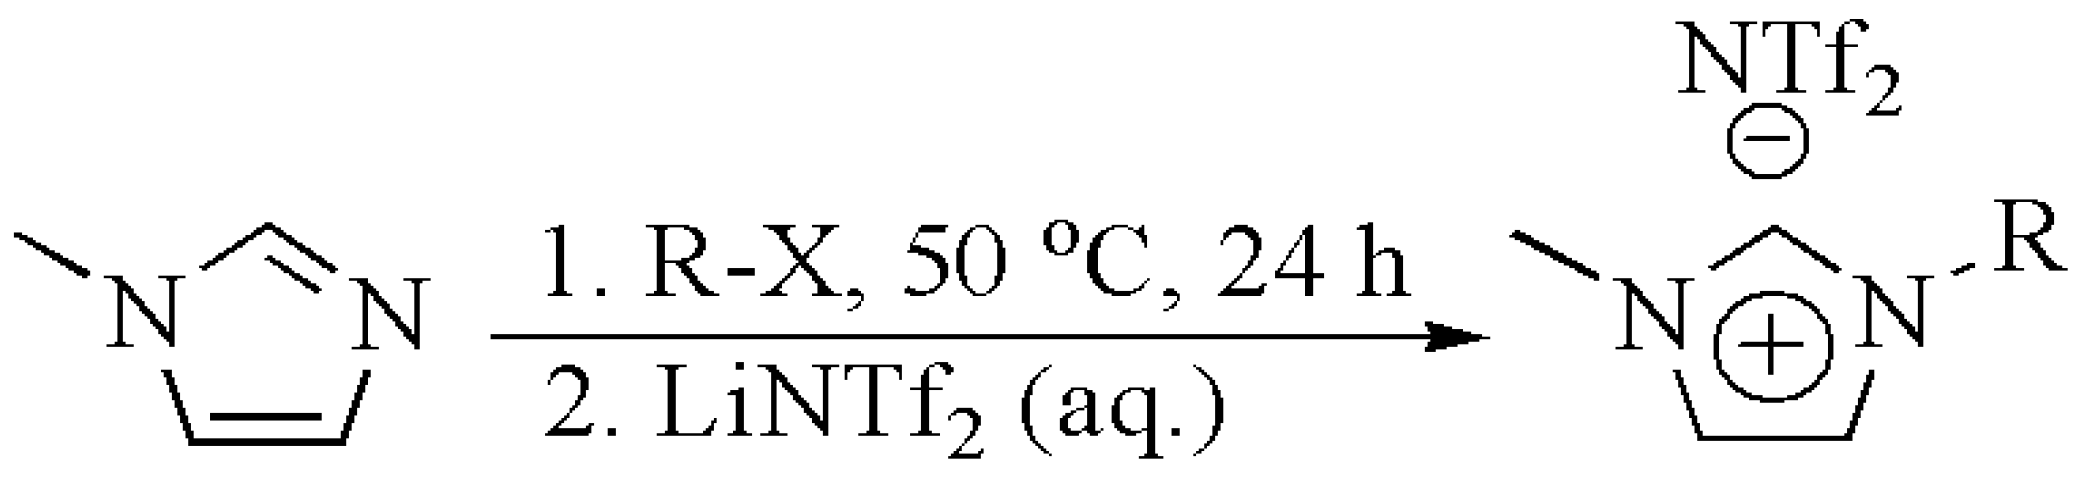
2.1. Ionic Liquid

The ionic liquid, 1-nonyl-3-methylimidazolium bis[(trifluoromethane)sulfonyl]amide ([C9C1im][NTf2]), was synthesized and used as a lubricant in this study. The synthesis and purification details of the IL was given in a previous publication [20]. Figure 1 shows the general synthesis procedure for [C9C1im][NTf2] [21,22].

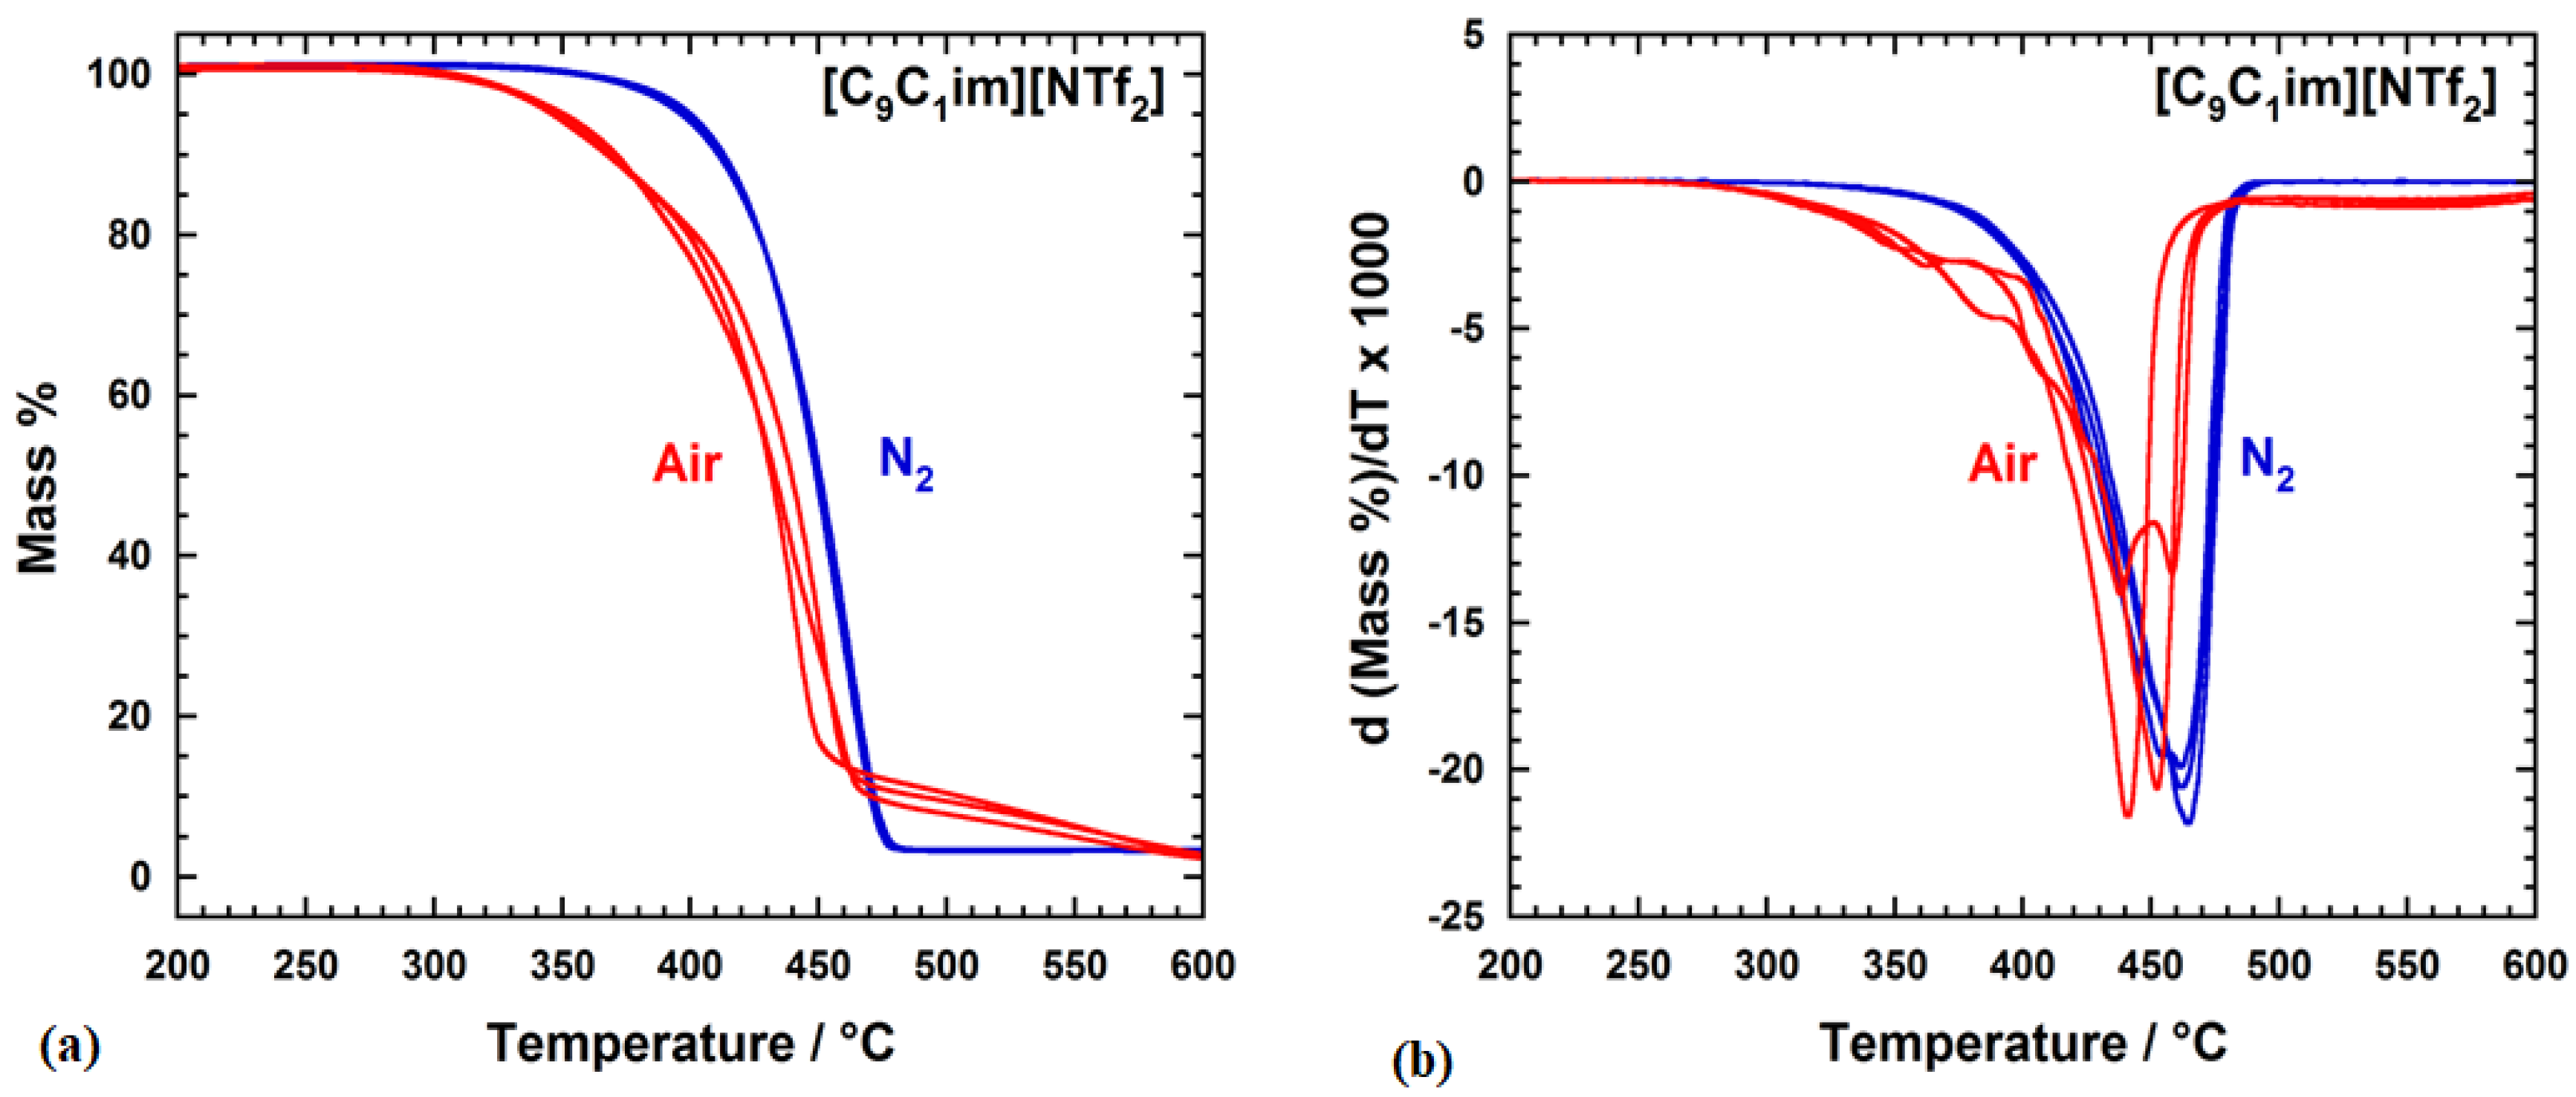
2.2. Thermal Stability of IL [C9C1im][NTf2]

A Mettler Toledo TGA2 (Mettler Toledo, Greifensee, Switzerland) was used to characterize the thermal stability of the ionic liquid under both nitrogen and air atmospheres. Prior to the TGA measurements, the [C9C1im][NTf2] sample was purified in the following way. The sample was dissolved in dichloromethane. Activated charcoal was then added and the mixture stirred for 48 h. Afterwards, the mixture using acetonitrile was passed through a column packed with neutral activated alumina. After removal of the solvent, the IL was dried under vacuum at 70 °C for 48 h. The measured water content of the resulting colorless IL was less than 50 ppm, as measured by Karl–Fisher titration (Mettler Toledo C20 coulometric KF titrator, Mettler Toledo, Greifensee, Switzerland). The purity of the IL was confirmed by using 1H NMR. The sample mass for the TGA measurements ranged from 10 to 15 mg in a 70 μL alumina pan. Three dynamic runs from 30 to 600 °C at 10 K/min were performed for each atmospheric condition (N2 and air) to verify reproducibility. It is noted that the reproducibility in air is typically lower than that in N2 due to additional reactions with oxygen during thermal decomposition.
Figure 2 shows the measured TGA curves, i.e., the dynamic TGA curves in Figure 2a and the TGA derivative curves in Figure 2b. The onset temperature, Tonset, was determined at the intersection of the zero-mass loss baseline and a tangent line through the inflection point. The peak temperature, Tpeak, is the temperature at the peak in the temperature derivative of the mass loss curve, and the endset temperature, Tendset, was determined at the intersection of the maximum mass loss baseline and a tangent line through the inflection point.
In addition, the decomposition temperatures at 25%, 50%, 70%, 80%, and 90% mass loss are reported according to ASTM D3850. Table 1 summarizes the resulting thermal stability in terms of decomposition temperatures. As observed in Figure 2 and Table 1, [C9C1im][NTf2] had higher thermal stability in nitrogen than in air with a 20 K increase in Tonset. Based on previous TGA measurements of on the ILs [CNC1im][NTf2] for N = 3–7 [23], the thermal stability in N2 showed no significant dependence on the carbon number N, with the average value of Tonset being equal to 437.1 ± 1.4 °C, which is slightly higher than the value of 428 ± 3 °C obtained for [C9C1im][NTf2] in this study. The important point, however, is that the IL [C9C1im][NTf2] is stable and does not degrade under the conditions at which the COF and wear measurements were made.

2.3. Palladium-Rich Amorphous Alloy and Pure Crystalline Palladium

The Palladium-rich amorphous alloy (Pd43Cu27Ni10P20) was fabricated by vacuum melting and water quenching [24] and reshaped into a disc by thermoplastic forming at 355 °C. The glass transition and the crystallization temperatures were measured to be 305 and 430 °C, respectively. Crystalline Pd (99.999%) was prepared by cold rolling and recrystallization. Both amorphous and crystalline Pd discs were polished with 4000 grit sandpapers to have the desired surface roughness for tribological tests. Figure 3 shows X-ray diffraction (XRD) pattern for the Pd-rich alloy [25], which did not show crystalline peaks verifying its amorphous state. The XRD patterns were measured using Rigaku Ultima III PXRD with Cu-Kα radiation.

2.4. Experimental Procedure

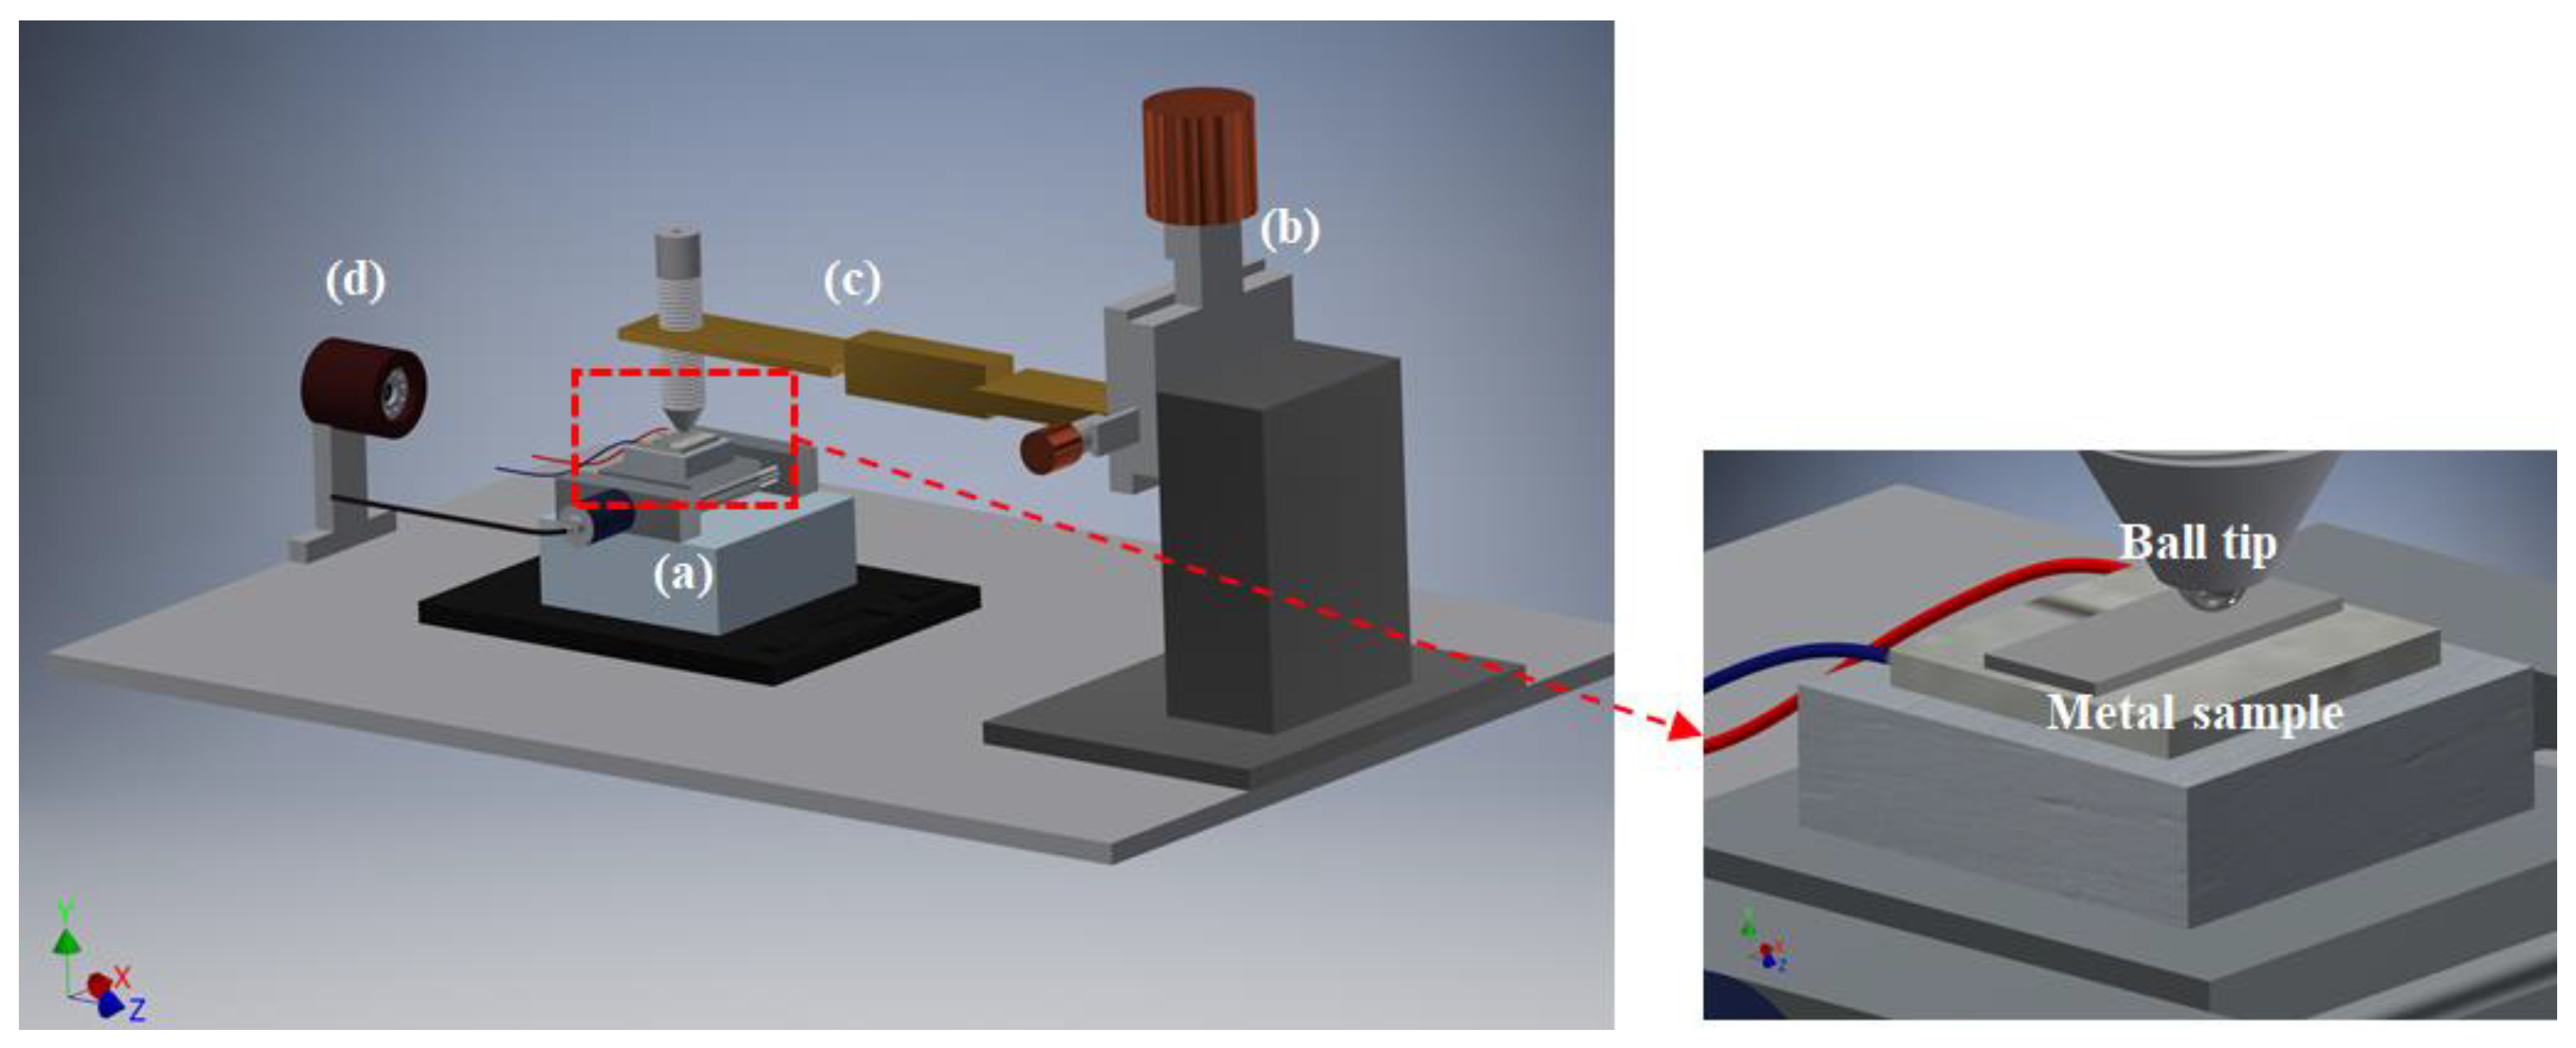
2.4.1. Reciprocating Ball-on-Disc Test: In-Situ Friction Coefficient Measurement

A reciprocating ball-on-disk tribometer was newly developed to enable tribological tests at high temperatures, by which we could measure in-situ friction coefficients during sliding contact. The ball-on-disk tribometer is composed of four main parts as shown in Figure 4: (a) A temperature-controlled sample holder connected to a linear stage (i.e., ZaberTM High Precision Motorized Stage) that enables horizontal reciprocating movement, (b) a micro-stage to control the vertical movement of a cantilever to adjust the contact load, (c) a ball-tip holder connected to a cantilever that has two strain gauges to measure the in-situ normal and tangential forces, and (d) a high resolution digital microscope (220×) to observe the contacting interface during reciprocating sliding contact tests.
With this newly developed tribometer, the 440C stainless steel ball (5 mm diameter with a hardness of 285 HB) made sliding contact over the Pd-rich amorphous alloy and crystalline Pd samples at the controlled speed and temperature under IL-lubricated conditions. Three different temperatures were applied to the samples, i.e., ambient temperature, 100 and 200 °C. The linear speed of sliding contact was set to be 3 to 7 mm/s with the test duration time of 60 min, which provides the total sliding distances of 10 and 23 m, respectively. In this experiment, all tests were conducted under the constant normal load of 100 gf, the stroke length of 5 mm, and humidity of RH < 30%. Based on the calculated Stribeck curve factor (ΗV/W), all tests fall in boundary lubrication conditions [26]. In order to apply the consistent test conditions, a new steel ball was installed for each test configuration. Each test configuration was tested five times to obtain reliable statistics.

2.4.2. Characterization of Wear Behavior: Wear Mechanism, Wear Coefficient, and Tribofilm Formation

Prior to the characterization of the wear scar and tribofilm, both stainless steel balls and metal specimens (amorphous and crystalline) were cleaned with ethanol using ultrasonic bath for 1 min and dried in air. The morphology of wear tracks and wear coefficients of the metal samples were determined using the Contour GT surface profilometer (Bruker, San Jose, USA). Scanning electron microscopy (SEM) and energy dispersive spectroscopy (EDS) analysis were carried out to investigate the wear mechanism and material transfer behavior. The formation of tribofilm and the chemical reactions at the contacting interface were examined using PHI 5000 VersaProbe X-ray photoelectron spectroscopy (XPS, Physical Electronics, Chanhassen, USA). In order to analyze the thickness of tribofilm layer, a depth profiling technique with an argon ion gun sputtering was employed, where the estimated sputtering depth was 2.16 nm with a beam voltage of 500 V and sputtering time of 0.5 min. The XPS spectra were obtained using monochromatic Al Kα X-rays. The binding energy of adventitious carbon was used as a reference, and its value was 284.6 eV. The MultiPak software (v9.3, Physical Electronics, Chanhassen, MN, USA) was used to analyze the composition of sample surfaces.

3. Results and Discussion

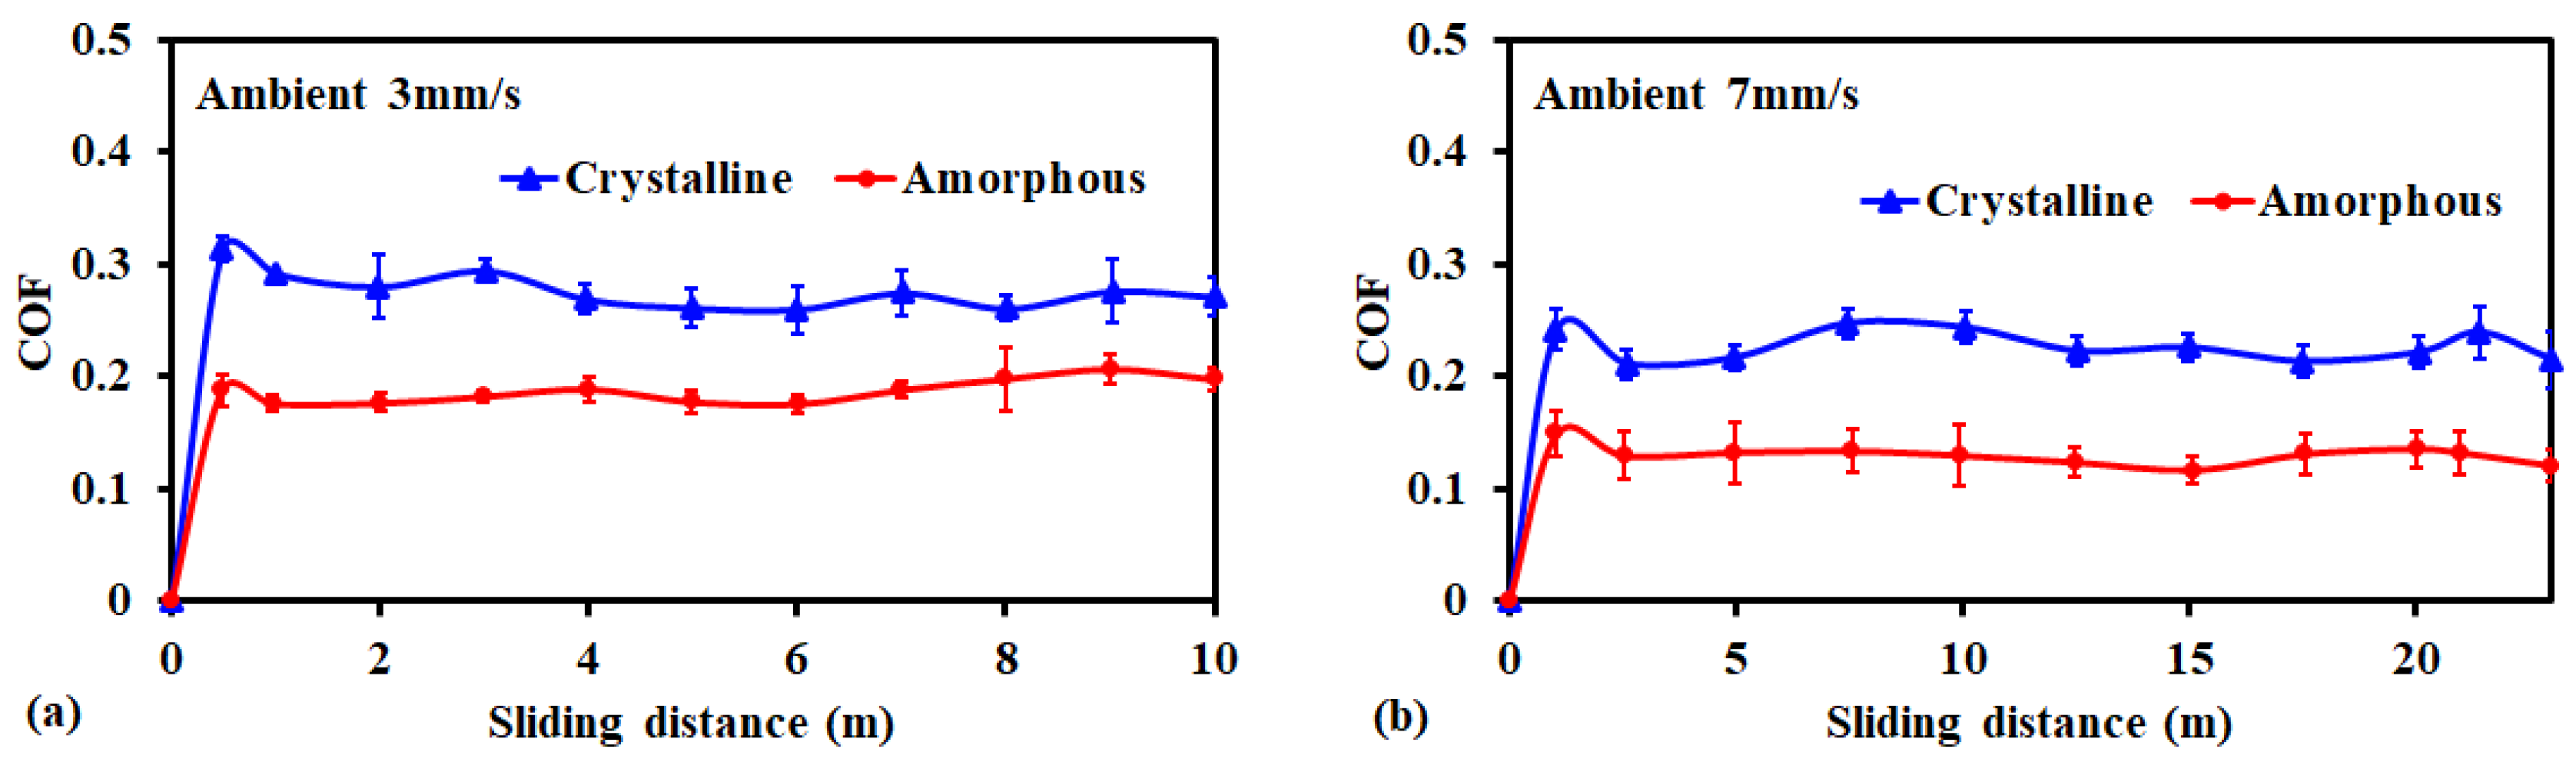
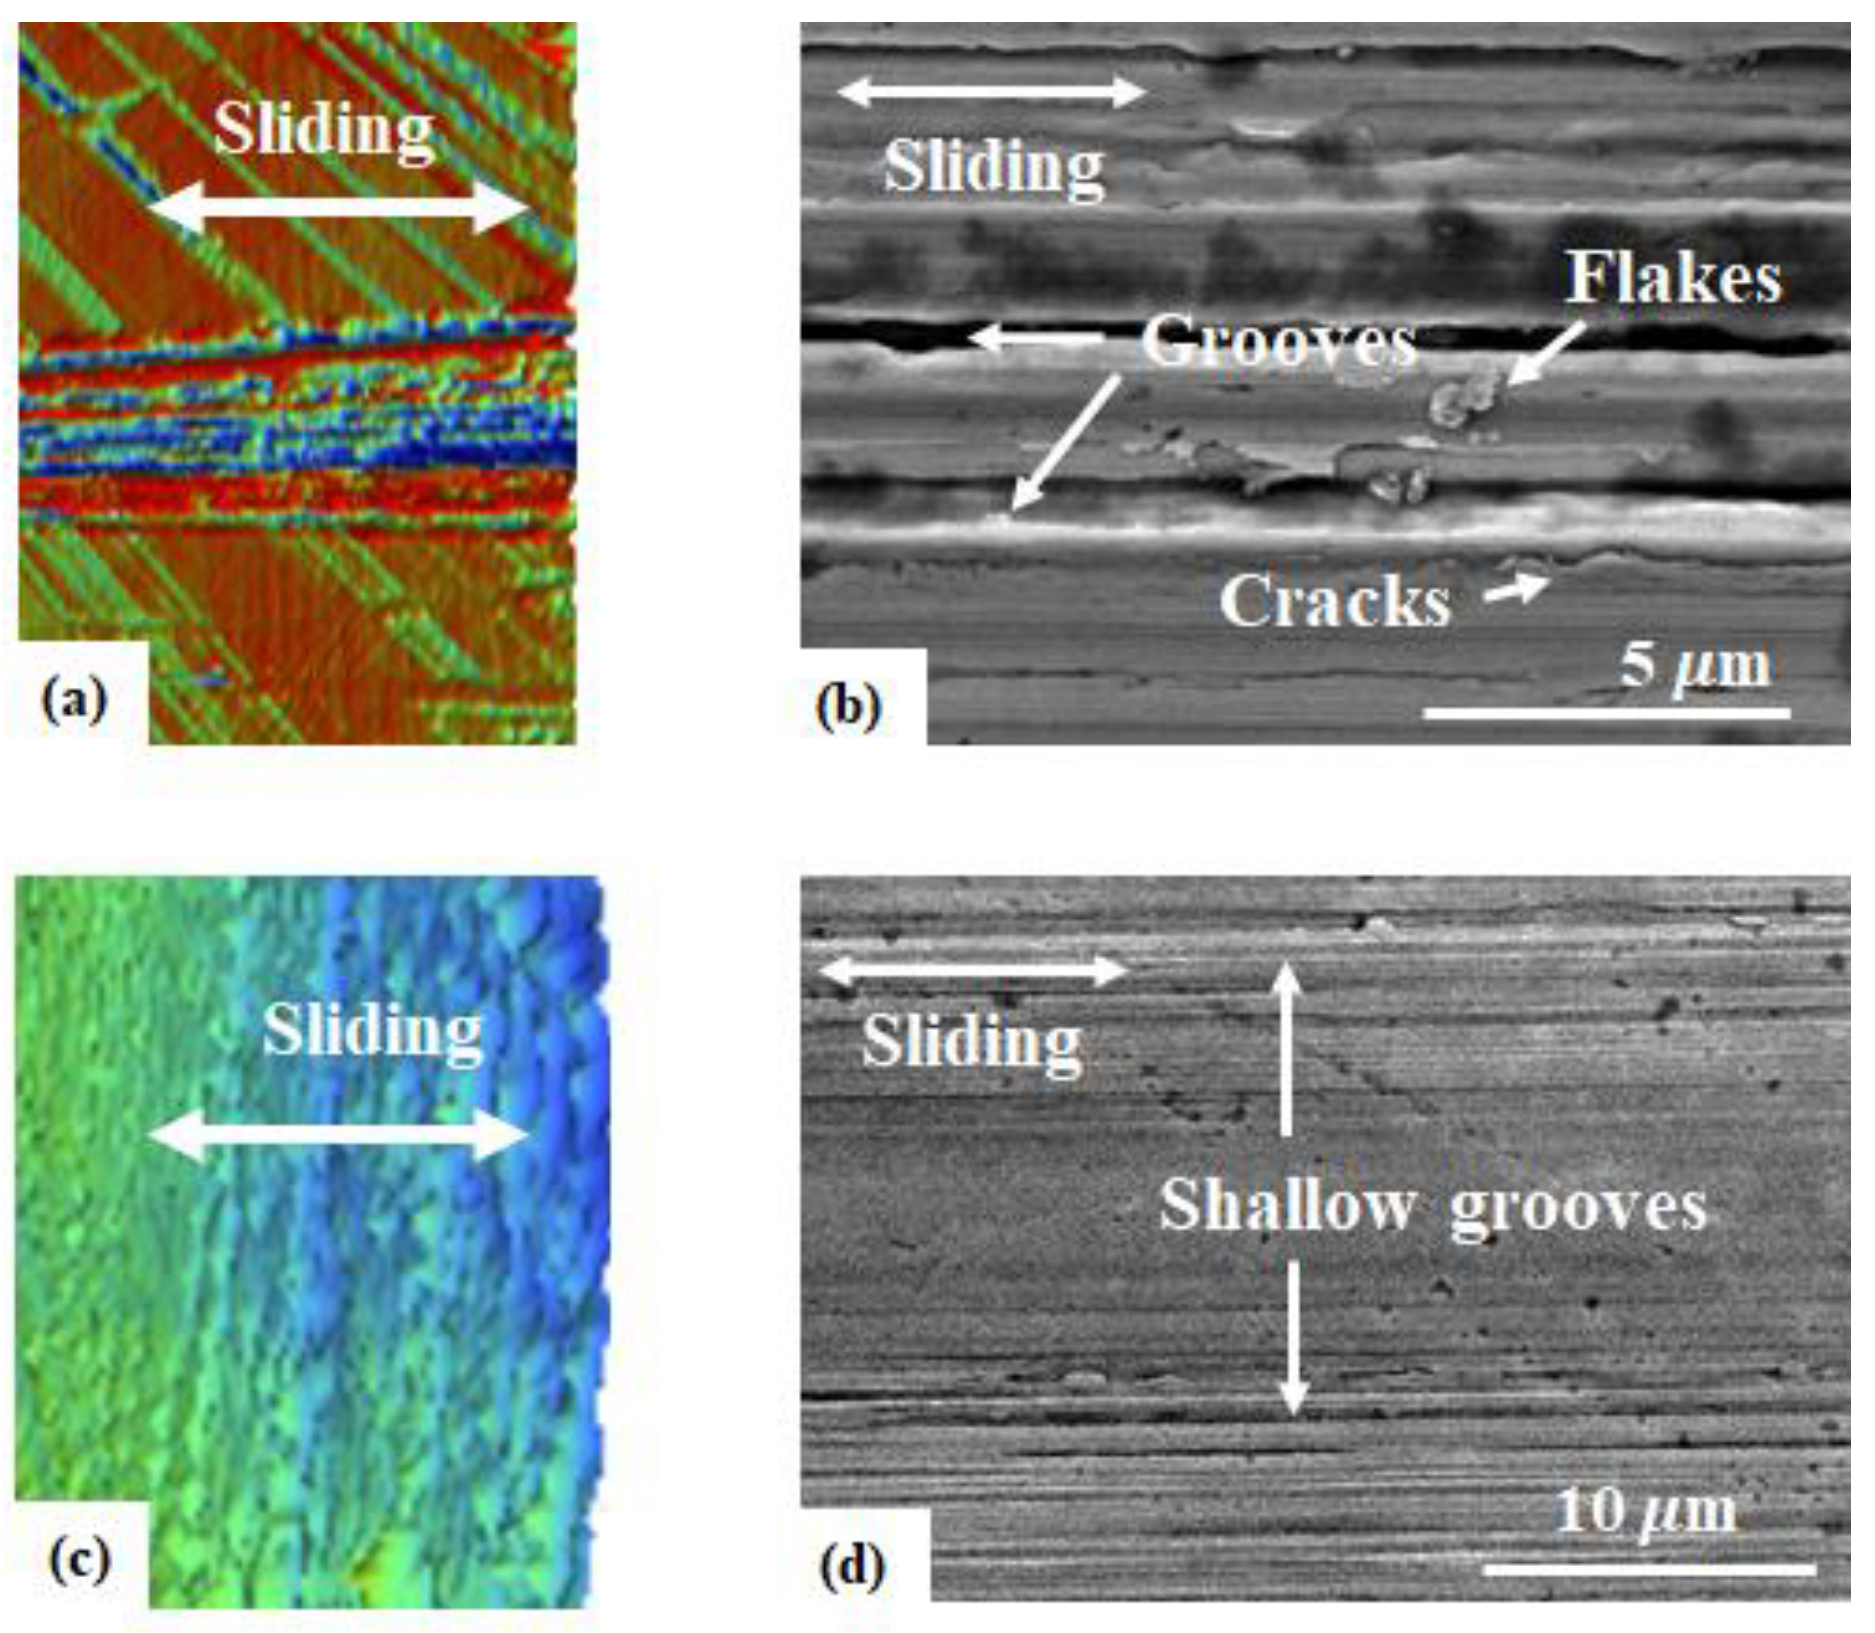
3.1. Friction and Wear Behavior at Ambient Temperature: Amorphous Pd Alloy vs. Crystalline Pd with IL Lubrication

Figure 5 shows the measured coefficient of friction (COF) for the crystalline Pd and amorphous Pd alloy samples with respect to the sliding distance under the IL-lubricated conditions at ambient temperature with the constant normal load of 0.98 N and two different sliding speeds of 3 mm/s (Figure 5a) and 7 mm/s (Figure 5b). The amorphous Pd alloy showed a lower COF than the crystalline Pd at the tested range of sliding distance and speed, which is in good agreement with our previous work [25]. In Figure 5, both Pd samples showed a sharp increase in the COF value at the onset of sliding contact because of the initial contact with the oxide layer and foreign contaminants on the surface. After completing the running-in behavior, the COF reached the steady-state value. Table 2 summarizes the resulting steady-state COF values at each test configuration in terms of temperature and speed. It was observed that the measured steady-state COF for the amorphous Pd alloy sample was 0.19 and 0.12 at the sliding speeds of 3 and 7 mm/s, respectively, whereas the measured steady-state COF for the crystalline Pd sample was 0.28 and 0.24 at the sliding speeds of 3 and 7 mm/s, respectively. Examining the COF with respect to the sliding speed, it was found that the faster sliding of 7 mm/s showed lower COF than the slower sliding of 3 mm/s.
After the sliding contact tests, the morphologies of the worn surfaces of crystalline and amorphous samples were analyzed through a 3D surface profilometer and SEM (Figure 6). Comparing Figure 6a (crystalline Pd sample) and Figure 6c (amorphous Pd alloy sample), it can be observed that the size of wear track on the amorphous Pd alloy surface was much smaller than that on the crystalline Pd surface. Furthermore, the SEM images revealed abrasive wear (i.e., clear groove lines in the direction of sliding contact) as a dominant wear mechanism for both the crystalline and amorphous Pd samples. However, for the case of the crystalline sample in Figure 6b, the worn surface also produced another type of wear such as delamination, i.e., flakes and a step or edge like plastic deformation on the wedge of the grooves. This delamination wear could be attributed to its lower yield strength, which can cause considerable local plastic deformation and crack propagation during the repeated sliding contact.
The wear coefficient K was also calculated based on Archard equation, i.e., K = VH/WL (V = wear volume, H = hardness, W = contact load, L = sliding distance). The wear volume was estimated using the cross-section profile of wear track, while the hardness values were obtained from the micro-hardness measurements. The measured Brinell hardness values were 118 and 240 HB for the crystalline Pd and amorphous Pd alloy samples, respectively. As shown in Figure 7, the wear coefficient of the crystalline Pd (Figure 7a, blue bar) was on the order of 10−2, whereas the amorphous Pd alloy (Figure 7b, blue bar) showed much lower value on the order of 10−5. It was also observed that the faster sliding of 7 mm/s showed a lower wear coefficient than the slower sliding of 3 mm/s at all test configurations in ambient temperature.

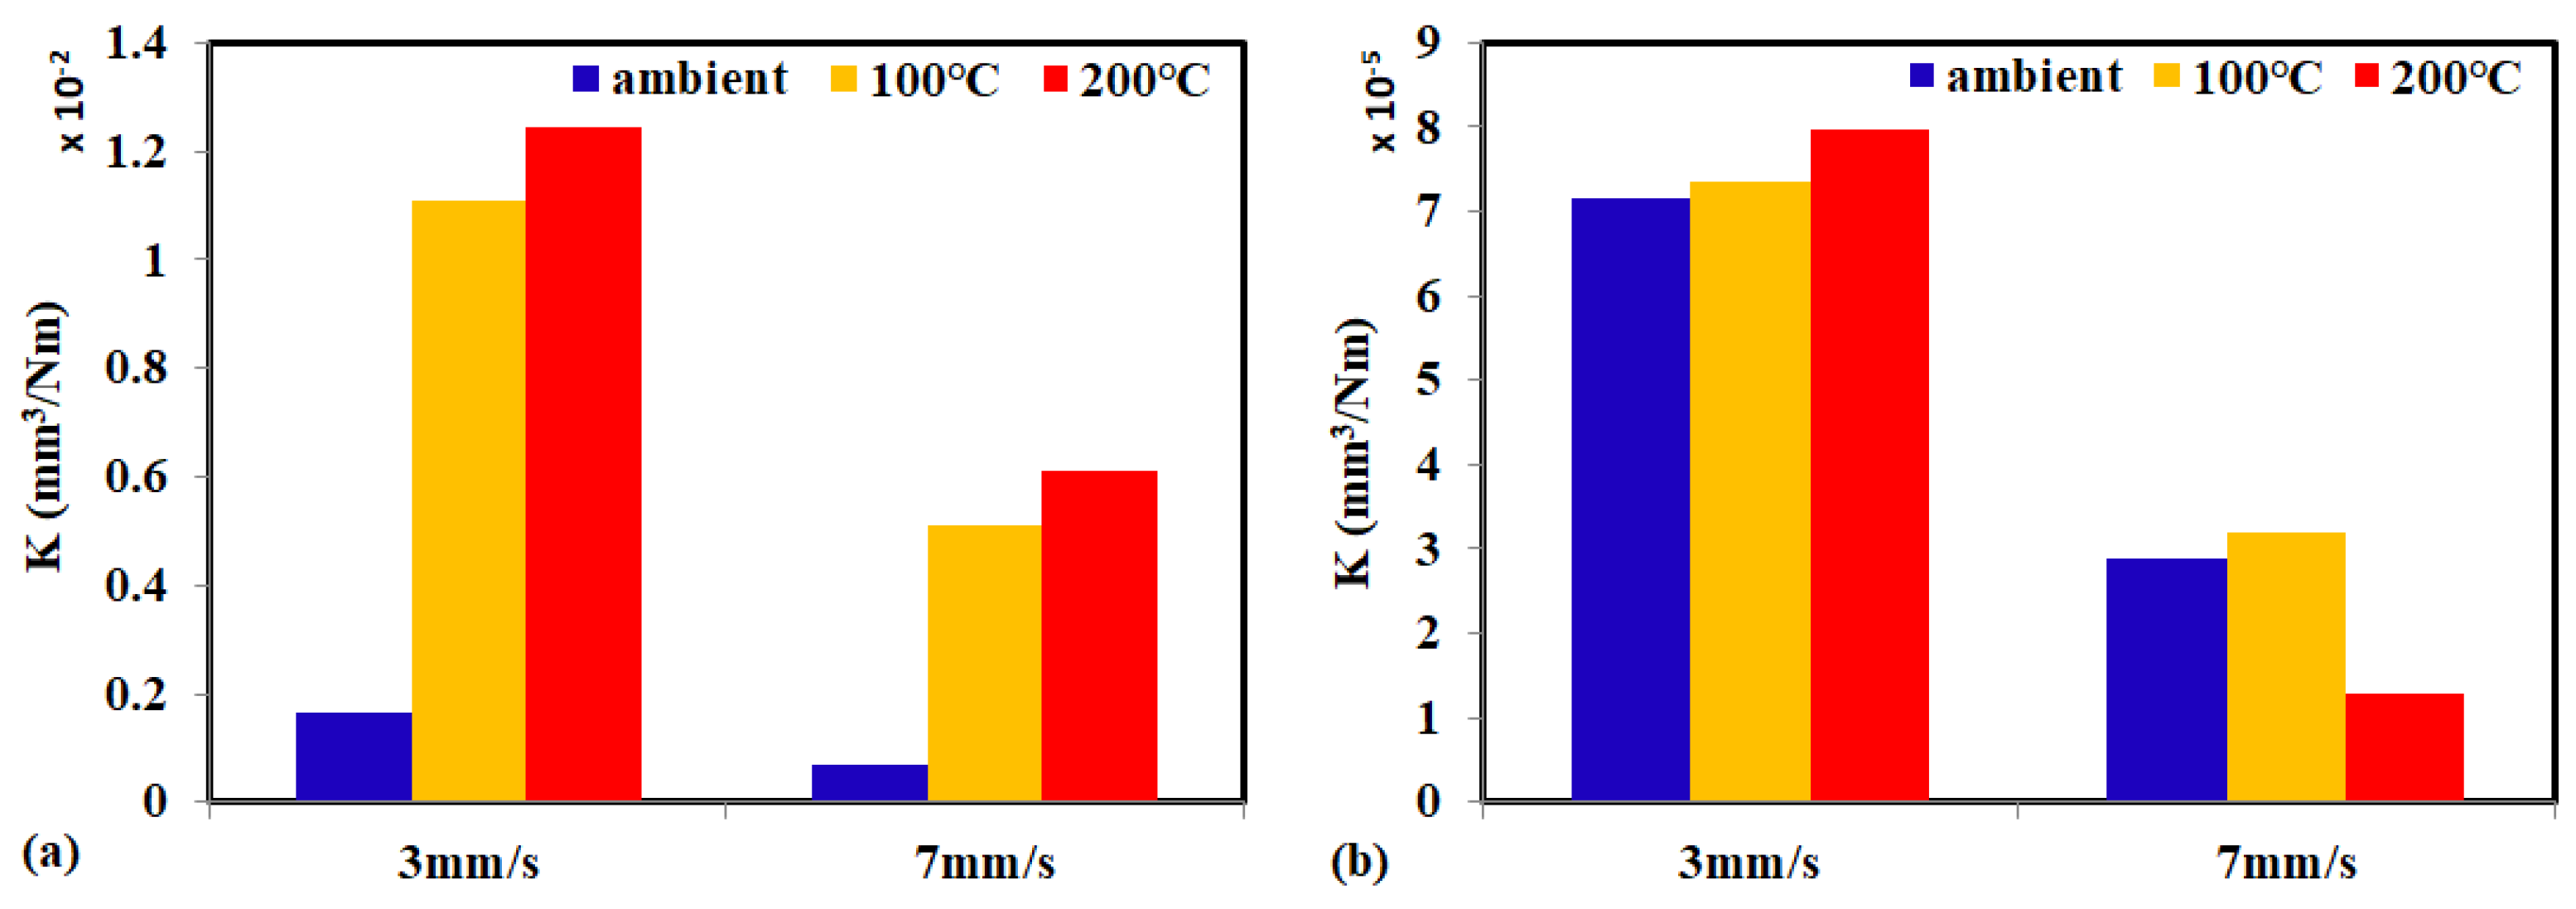
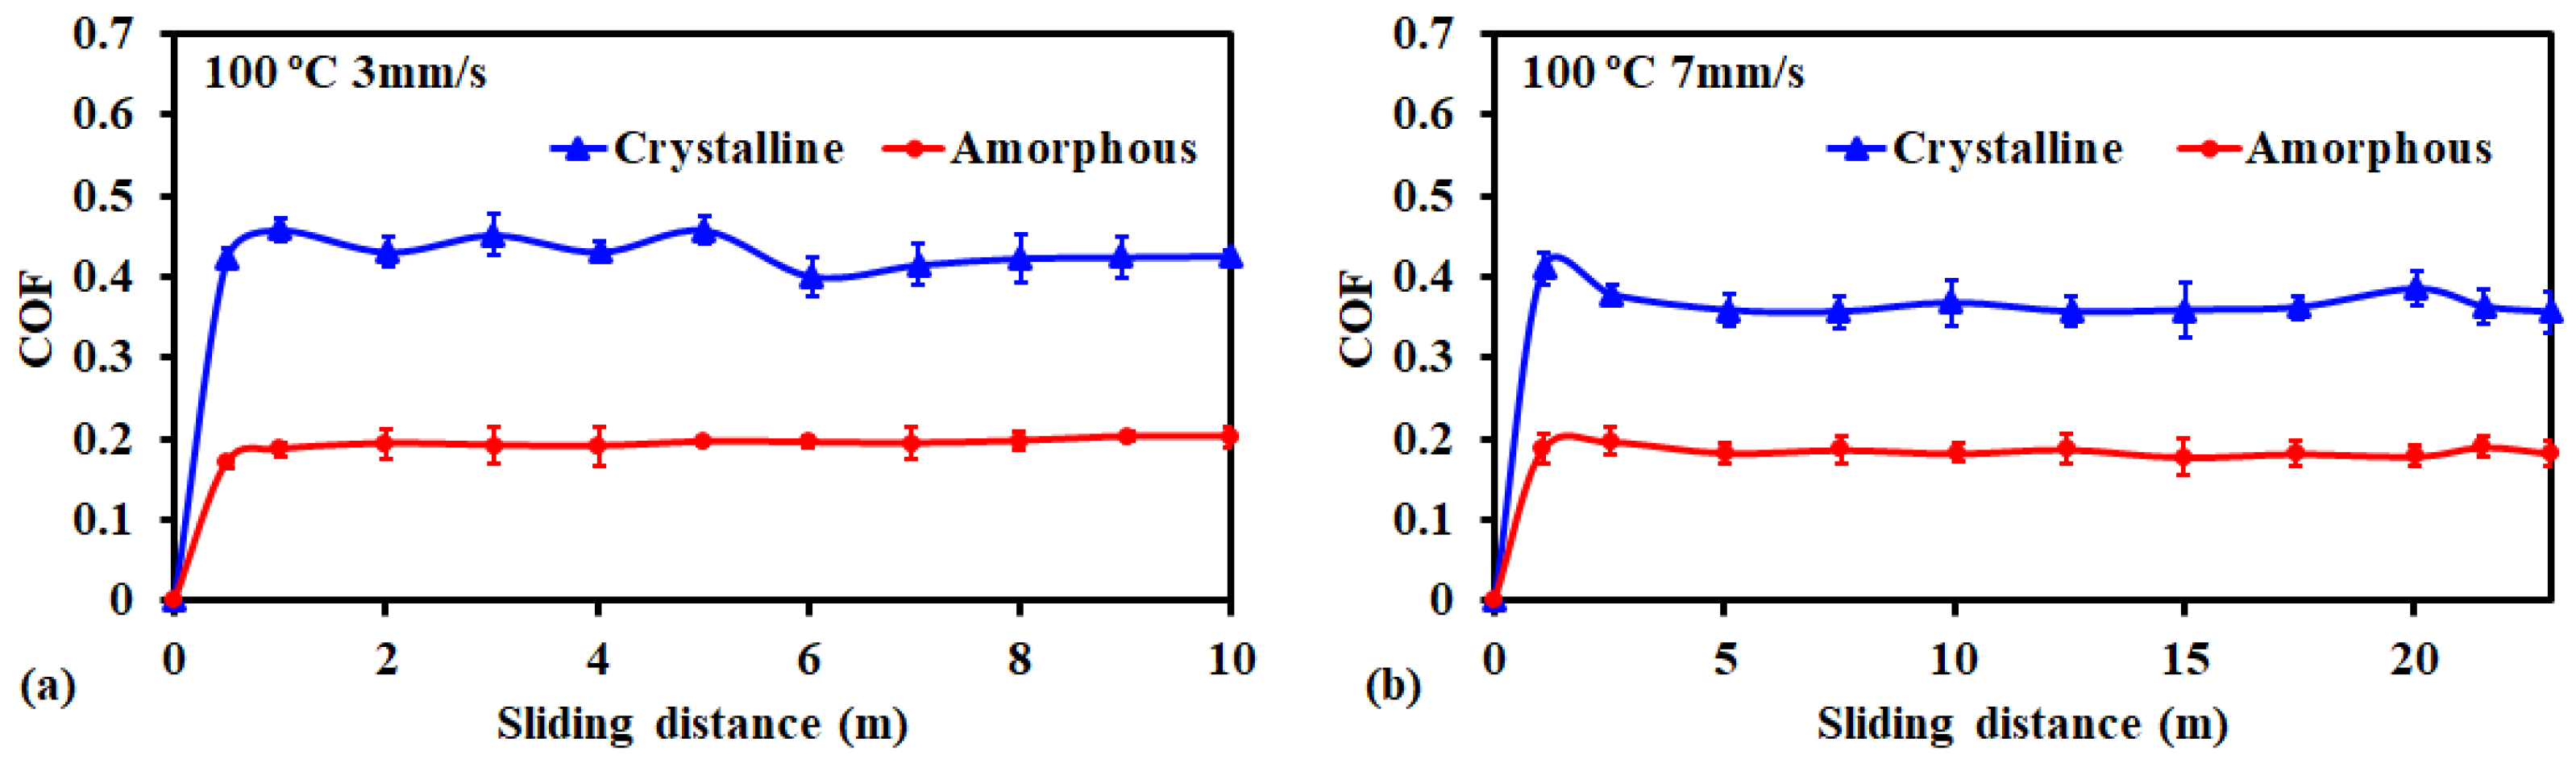
3.2. Friction and Wear Behavior at 100 °C: Amorphous Pd Alloy vs. Crystalline Pd under IL Lubrication

Figure 8 shows the measured COF for the crystalline Pd and amorphous Pd alloy samples with respect to the sliding distance under IL-lubricated conditions at 100 °C with a constant normal load of 100 gf and two different sliding speeds of 3 mm/s (Figure 8a) and 7 mm/s (Figure 8b). Compared to the results from the ambient temperature in Section 3.1 (as summarized in Table 2), when the applied temperature increased to 100 °C, the COF of the crystalline Pd samples dramatically increased and reached values of 0.36–0.42. Interestingly, the COF of the amorphous Pd sample increased slightly to 0.18–0.20 but still showed low and stable values at the tested sliding-distance range at 100 °C. It was also observed that the faster sliding of 7 mm/s showed the lower COF than the slower sliding of 3 mm/s. First, the higher COF values at 100 °C could be attributed to the lower viscosity of ILs at higher temperatures, which accordingly could make more solid contacts between the ball tip and Pd samples under boundary lubrication thus causing more friction force. Next, the lower COF at faster sliding speed would be obtained by less solid contacts at the interface due to a thicker lube film thickness, which could result in a lower COF value.
Figure 9 shows the morphology of the worn surface for crystalline Pd (Figure 9a,b) and amorphous Pd alloy (Figure 9c,d) samples under the IL lubrication tested at 100 °C. Both Pd samples at 100 °C showed wider and deeper wear tracks than those at ambient in Figure 6. This is consistent with the results of COF measurements in Figure 5 and Figure 8, where the COF measured at 100 °C was higher than the values at ambient. First, comparing the wear tracks between the crystalline (Figure 9a) and amorphous Pd alloy (Figure 9c) samples at 100 °C, it could be observed that the crystalline Pd sample showed a much deeper wear track than the amorphous Pd alloy sample. Next, compared to the results at ambient, the wear mechanism at 100 °C seemed to be changed. Examining the SEM image of wear track on the crystalline Pd sample in Figure 9b, it clearly shows the three wear mechanisms, i.e., (a) delamination (subsurface crack and flakes), (b) abrasion (groove line in the direction of sliding contact), and (c) adhesion (material smearing marks). Due to the increased direct solid contacts at lower viscosity at 100 °C, the higher contact stress would have developed more material smearing behaviors and subsurface crack generations, thereby causing more delamination and adhesive types of wear on the crystalline Pd sample. For the case of the amorphous Pd alloy sample in Figure 9d, the abrasive wear was still dominant, but the grooves were deeper than those from the ambient test.
The wear coefficient of the Pd samples after tests at 100 °C was also obtained by using the sample method in Section 3.1. Comparing the measured wear coefficients of crystalline Pd sample between ambient and 100 °C in Figure 7a, it could be found that its wear coefficient dramatically increased at 100 °C by ~1 order higher than the value at ambient. As described in Section 3.2, the crystalline Pd sample showed a wider and deeper wear track through abrasion, delamination, and adhesive wear, which could result in a higher wear coefficient at 100 °C. However, for the case of the amorphous Pd alloy sample in Figure 7b, its wear coefficient did not show much difference between the ambient and 100 °C. Due to its higher strength and amorphous structure, delamination and adhesive wear would be limited in the amorphous Pd alloy sample, which could result in similar wear behavior at both testing temperatures. The crystallization temperature for amorphous Pd alloy is about 430 °C. Therefore, it is unlikely that the crystallization will occur during wear testing at room temperature or 100 °C.

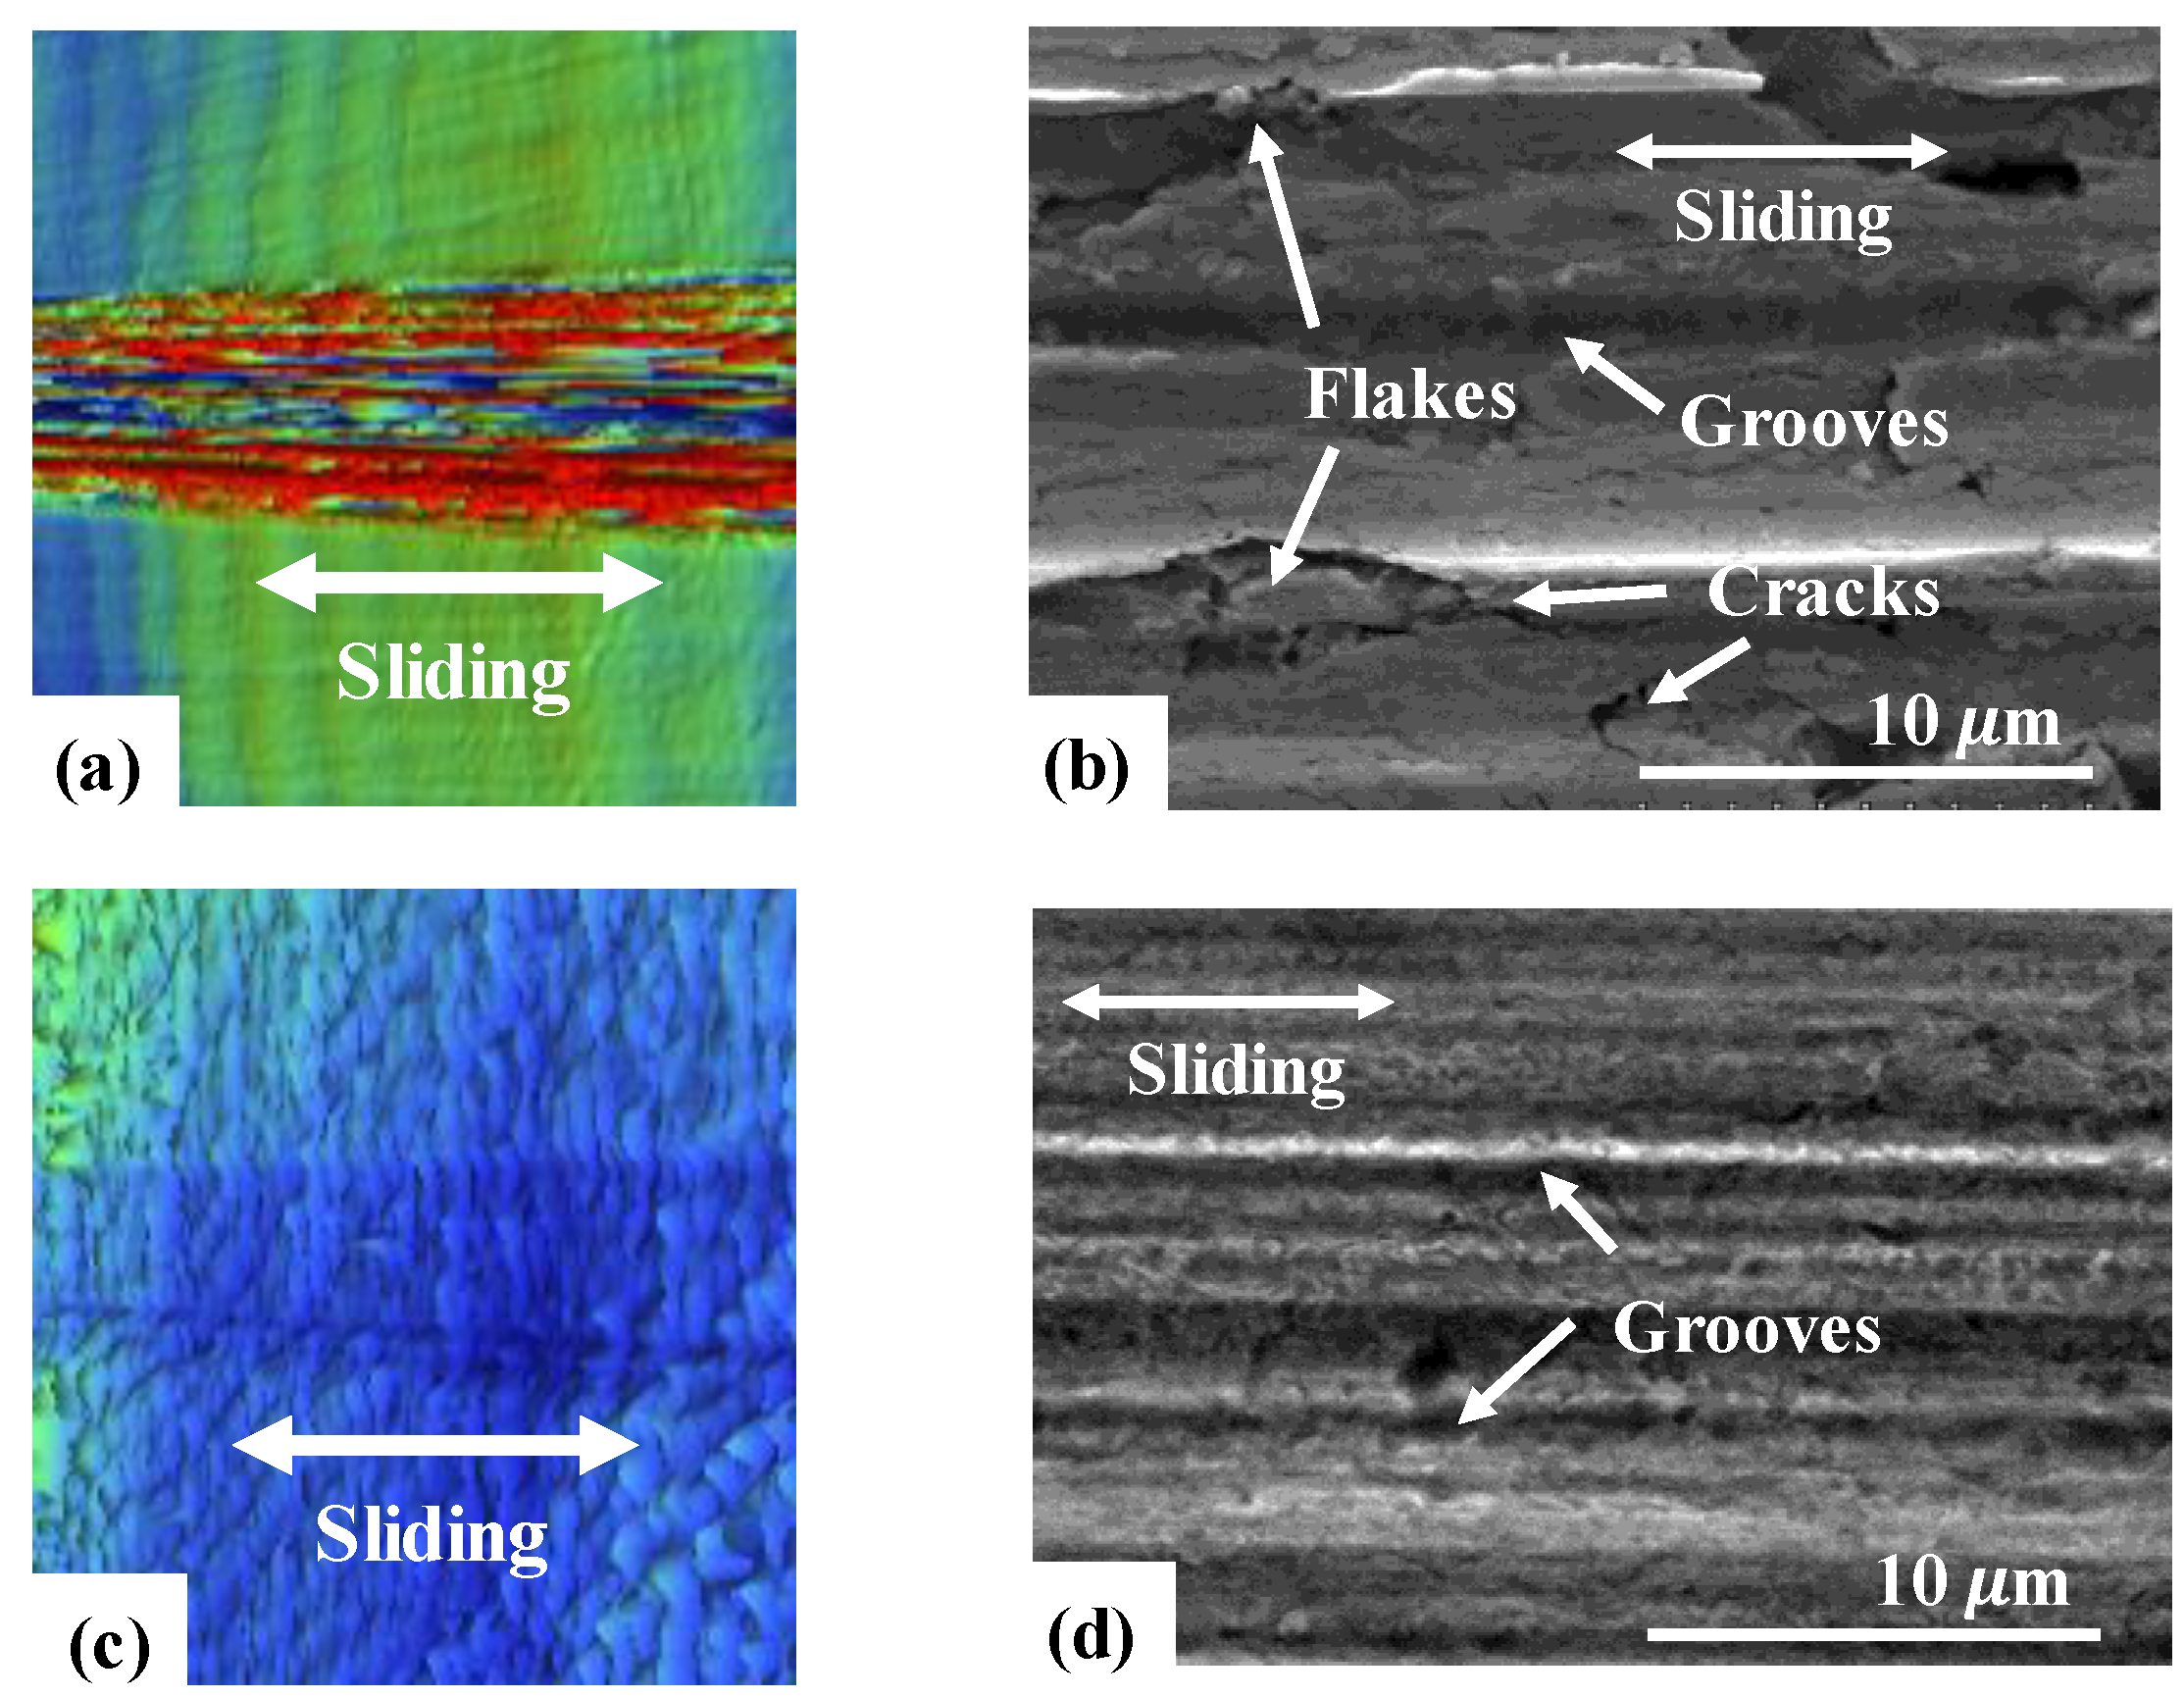
3.3. Friction and Wear Behavior at 200 °C: Amorphous Pd Alloy vs. Crystalline Pd with IL Lubrication

Figure 10 shows the measured COF values for both Pd samples under the IL lubrication at 200 °C with a constant normal load of 100 gf and two different sliding speeds of 3 mm/s (Figure 10a) and 7 mm/s (Figure 10b). First, compared to the results from ambient (Figure 5) and 100 °C (Figure 8), the crystalline Pd sample at 200 °C with the contact speed of 3 mm/s showed higher peak COF values but more fluctuations with the sliding distance. Considering more wear behaviors on the crystalline Pd sample at 200 °C, the fluctuations of COF values could be caused by rougher and deeper wear track generation during the repeated sliding contact. On the other hand, the COF of the amorphous Pd alloy sample showed low and stable values similar to the values at ambient and 100 °C. Next, when the sliding speed increased from 3 to 7 mm/s, the trend of COF for the crystalline Pd sample was significantly changed. Its COF value increased until the sliding distance reached ~2 m, but thereafter, continuously decreased. Interestingly, in spite of the lower viscosity of IL lubricants at 200 °C, their terminal COF value became lower than that from the 100 °C test. This dramatic improvement of friction could be attributed to the thicker tribofilm formation on the crystalline Pd sample at 200 °C, more details of which will be described in the following section.
The morphologies of the wear tracks on both Pd samples at 200 °C were also analyzed through a 3D surface profilometer and SEM measurements. The crystalline Pd sample (Figure 11a) showed greater and deeper wear than the amorphous Pd alloy (Figure 11c). Next, examining the SEM images of the crystalline Pd sample (Figure 11b), it showed more subsurface cracks and flakes than those from tests at ambient and 100 °C, which implies that the crystalline Pd sample at 200 °C would have experienced dominant delamination wear during the sliding contact. For the case of amorphous Pd alloy sample in Figure 11d, it still showed the dominant abrasive wear but had some smearing marks (adhesive wear) due to more solid contacts at the higher temperature of 200 °C.
When the sliding speed increased to 7 mm/s, the crystalline Pd sample (Figure 12a) showed more abrasive wear scars and wear particles than those at lower sliding of 3 mm/s, whereas the amorphous Pd alloy sample (Figure 12b) showed similar wear morphologies but less wear. Such severe contact on the crystalline Pd sample at faster sliding of 7 mm/s and the higher temperature of 200 °C could make more chemical/mechanical interactions on its surface, which accordingly could develop more tribofilm formation. This active tribofilm formation on the crystalline Pd sample could have led to dramatic friction improvement in Figure 10b.
The adhesive type of wear found on the amorphous Pd alloy sample could be verified through SEM/EDS measurement on the tested 440C stainless steel balls as shown in Figure 13. Based on the EDS data, most material components were Fe and Cr that are the main components of stainless steel, but Pd was also detected on the ball tip surface, which supports adhesive wear on the contact surface. The measured wear coefficient at 200 °C is shown in Figure 7 (red bar). The wear coefficient of the crystalline Pd sample slightly increased at the faster sliding and higher temperatures. However, the amorphous Pd alloy showed the lowest wear coefficient at the sliding speed of 7 mm/s and the temperature of 200 °C.
As shown in Figure 2 and Table 1, the IL [C9C1im][NTf2] in this study does not degrade at the testing temperature of 100 °C and 200 °C. Therefore, the results and discussion for the measured friction and wear in Section 3.2 and Section 3.3 would not be related with the thermal degradation of IL lubricants.

3.4. Formation of Tribofilm with Respect to Temperature

Compared to the experiments under dry contact conditions, the IL lubrication significantly reduced the friction and wear on Pd samples, which could be attributed to the formation of a tribofilm during the sliding contact. In this study, we investigated the thickness of the tribofilm on the Pd sample surfaces with respect to temperature using XPS. Depth profiling using ion gun sputtering was used to analyze the surface chemical reactions and the composition of tribofilm. The sputtering depth was estimated as 2.16 nm using argon ion gun with a beam voltage of 500 V and the sputtering time of 0.5 min.
For comparison, the analysis of the XPS spectra was conducted on the non-contact area for the crystalline (Table 3a) and amorphous Pd (Table 3b) alloy samples in relation to fluorine (F) and sulfur (S) peaks that are the elements of [NTf2] anion as a reference. In spite of the cleaning process after the sliding contact test, F and S peaks were still detected on the non-contact surface area for both crystalline and amorphous Pd alloy surfaces. After the first sputtering, the F and S peaks were eliminated completely from the surface of the amorphous Pd alloy samples at all temperature tests. On the other hand, the crystalline Pd sample tested at 200 °C still showed the F and S peaks until the third sputtering for the crystalline Pd sample at 200 °C. This implies that the IL lubricant (especially its anions) might have diffused more at the elevated temperature of 200 °C.
Next, the analysis of XPS spectra on the crystalline Pd samples was conducted on the contact area in Table 4 (Table 4a for 3 mm/s and Table 4b for 7 mm/s). Compared to the results of the non-contact area in Table 3, significant chemical reactions occurred in the contact area of the wear track, and the magnitude of chemical changes was proportional to the applied temperature increasing with both temperature and sliding speed. Interestingly, a significant amount of F was also detected at the faster sliding of 7 mm/s and the elevated temperature of 200 °C. This XPS data indicate that the faster sliding contact at higher temperatures results in thicker tribofilm on the crystalline Pd sample, which could then be responsible for the decreasing trend COF observed in Figure 10b. Table 5 shows the analysis of XPS spectra for the amorphous Pd alloy samples on the contact area with a sliding speed of 3 mm/s (Table 5a) and 7 mm/s (Table 5b). Due to its amorphous structure and higher strength, it showed less chemo/mechanical reaction than the crystalline Pd sample, thereby having thinner tribofilm formation and less sensitivity to temperature. After the 2nd sputtering, no F and S peaks were detected on the contacting surfaces.

4. Conclusions

The tribological behavior of crystalline Pd and amorphous Pd alloy samples against 440C stainless steel ball under the IL ([C9C1im][NTf2]) lubrication was investigated in relation to temperature (i.e., ambient, 100, and 200 °C) and contact speed (3 and 7 mm/s), where constant normal load of 100 gf was applied. The COF was measured using the newly developed ball-on-disc tribo-tester in Reference [25]. The wear coefficient was obtained using a 3D surface profilometer, while the wear mechanism was analyzed through SEM-EDS measurement. The formation of a tribofilm on the contact surface was verified using the XPS depth profiling technique. First, the amorphous Pd alloy sample showed much lower and stable COF values than the crystalline Pd sample at all speed and temperature conditions. The COF of crystalline Pd sample showed relatively large fluctuations with the sliding distance, but it significantly decreased at the faster sliding of 7 mm/s and the elevated temperature of 200 °C due to the tribofilm formation. Second, abrasion was identified as the dominant wear process on the amorphous Pd alloy sample, but the crystalline Pd sample included three types of wear, i.e., abrasion, delamination, and adhesion. The delamination wear became more dominant on the crystalline Pd sample at the faster sliding and higher temperature conditions because of severe contact deformation and crack propagation during the sliding contact. Third, chemical reactions tended to occur on the crystalline Pd sample thus resulting in thicker tribofilm formation at the faster sliding and higher temperature conditions, which could be beneficial to preventing further increases in friction and wear during the sliding contact. In contrast, the amorphous Pd alloy sample showed limited occurrence of chemical reactions with much thinner tribofilm formation than the crystalline Pd sample. Lastly, from those tribotests and material characterizations, it could be concluded that the IL [C9C1im][NTf2] can serve as an effective lubricant for both crystalline and amorphous Pd alloy samples. In particular, its lubricating performance seems to be more beneficial at higher temperatures and faster contact conditions.

Author Contributions

J.L. and C.-D.Y. led the project and designed the experiments. J.L. conducted the tribology experiments and analyzed the results with C.-D.Y. Both J.L. and C.-D.Y. wrote the sections of tribology experiments and data analysis, while C.-D.Y. as a corresponding author reviewed and managed the contents and outline of the whole manuscript. V.D.T.-A., J.K., and E.Q. synthesized the ionic liquids including the analysis of its fundamental chemical properties. They also contributed to writing the manuscript in the parts of chemical analysis of ILs as well as XPS data. Z.H. and G.K. prepared the metallic samples of crystalline and amorphous Pd alloy samples. They contributed to writing the manuscript in the parts of XRD and SEM measurement and data analysis. S.S. and Y.K. were in charge of thermal stability of ILs through the TGA measurements. They contribute to writing the manuscript in the parts of the TGA data analysis and discussion of thermal stability of ILs in relate to tribology experiments.

Funding

CMMI- 1919445 and CAREER award CMMI-1921435.

Acknowledgments

Z.H. and G.K. were partially supported by the National Science Foundation (NSF) through award CMMI-1919445 and CAREER award CMMI-1921435.

Conflicts of Interest

The authors declare no conflict of interest.

References

  1. Cai, M.; Guo, R.; Zhou, F.; Liu, W. Lubricating a bright future: Lubrication contribution to energy saving and low carbon emission. Sci. China Technol. Sci. 2013, 56, 2888–2913. [Google Scholar] [CrossRef]
  2. Holmberg, K.; Erdemir, A. Influence of tribology on global energy consumption, costs and emissions. Friction 2017, 5, 263–284. [Google Scholar] [CrossRef]
  3. Battez, A.H.; Blanco, D.; Fernández-González, A.; Mallada, M.T.; González, R.; Viesca, J.L. Friction, wear and tribofilm formation with a [NTf2] anion-based ionic liquid as neat lubricant. Tribol. Int. 2016, 103, 73–86. [Google Scholar] [CrossRef]
  4. Zhou, Y.; Qu, J. Ionic liquids as lubricant additives: A review. ACS Appl. Mater. Interfaces 2017, 9, 3209–3222. [Google Scholar] [CrossRef]
  5. Reeves, C.J.; Menezes, P.L. Advancements in eco-friendly lubricants for tribological applications: Past, present, and future. Ecotribology 2016, 41–61. [Google Scholar] [CrossRef]
  6. Jiménez, A.E.; Bermúdez, M.D. Ionic liquids as lubricants of titanium–steel contact. Part 2: friction, wear and surface interactions at high temperature. Tribol. Lett. 2010, 37, 431–443. [Google Scholar] [CrossRef]
  7. Ye, C.; Liu, W.; Chen, Y.; Yu, L. Room-temperature ionic liquids: a novel versatile lubricant. Chem. Commun. 2001, 21, 2244–2245. [Google Scholar] [CrossRef]
  8. Wu, J.; Lu, X.; Feng, X.; Shi, Y. Halogen-free ionic liquids as excellent lubricants for PEEK-stainless steel contacts at elevated temperatures. Tribol. Int. 2016, 104, 1–9. [Google Scholar] [CrossRef]
  9. Nancarrow, P.; Mohammed, H. Ionic liquids in space technology–current and future trends. ChemBioEng Rev. 2017, 4, 106–119. [Google Scholar] [CrossRef]
  10. Palacio, M.; Bhushan, B. A review of ionic liquids for green molecular lubrication in nanotechnology. Tribol. Lett. 2010, 40, 247–268. [Google Scholar] [CrossRef]
  11. Bermúdez, M.D.; Jiménez, A.E.; Sanes, J.; Carrión, F.J. Ionic liquids as advanced lubricant fluids. Molecules 2009, 14, 2888–2908. [Google Scholar] [CrossRef] [PubMed]
  12. Minami, I. Ionic liquids in tribology. Molecules 2009, 14, 2286–2305. [Google Scholar] [CrossRef] [PubMed]
  13. Mohammad, A. Green Solvents II: Properties and Applications of Ionic Liquids; Springer Science & Business Media: Berlin/Heidelberg, Germany, 2012; Volume 2, ISBN 978-94-007-2891-2. [Google Scholar]
  14. Somers, A.E.; Biddulph, S.M.; Howlett, P.C.; Sun, J.; MacFarlane, D.R.; Forsyth, M. A comparison of phosphorus and fluorine containing IL lubricants for steel on aluminium. Phys. Chem. Chem. Phys. 2012, 14, 8224–8231. [Google Scholar] [CrossRef] [PubMed]
  15. Somers, A.; Howlett, P.; MacFarlane, D.; Forsyth, M. A review of ionic liquid lubricants. Lubricants 2013, 1, 3–21. [Google Scholar] [CrossRef]
  16. Lhermerout, R.; Diederichs, C.; Perkin, S. Are ionic liquids good boundary lubricants? A molecular perspective. Lubricants 2018, 6, 9. [Google Scholar] [CrossRef]
  17. Tao, P.; Yang, Y.; Xie, Z.; He, Y. Research on friction and wear behavior of a bulk metallic glass under different sliding velocity. Mater. Lett. 2015, 156, 177–179. [Google Scholar] [CrossRef]
  18. Watanabe, L.Y.; Roberts, S.N.; Baca, N.; Wiest, A.; Garrett, S.J.; Conner, R.D. Fatigue and corrosion of a Pd-based bulk metallic glass in various environments. Mater. Sci. Eng. C 2013, 33, 4021–4025. [Google Scholar] [CrossRef]
  19. Maddala, D.R.; Hebert, R.J. Sliding wear behavior of Fe50−xCr15Mo14C15B6Erx (x = 0, 1, 2 at%) bulk metallic glass. Wear 2012, 294, 246–256. [Google Scholar] [CrossRef]
  20. Thakurathi, M.; Gurung, E.; Cetin, M.M.; Thalangama-Arachchige, V.D.; Mayer, M.F.; Korzeniewski, C.; Quitevis, E.L. The Stokes-Einstein equation and the diffusion of ferrocene in imidazolium-based ionic liquids studied by cyclic voltammetry: Effects of cation ion symmetry and alkyl chain length. Electrochim. Acta 2018, 259, 245–252. [Google Scholar] [CrossRef]
  21. Dzyuba, S.V.; Bartsch, R.A. Efficient synthesis of 1-alkyl (aralkyl)-3-methyl (ethyl) imidazolium halides: precursors for room-temperature ionic liquids. J. Heterocycl. Chem. 2001, 38, 265–268. [Google Scholar] [CrossRef]
  22. Dzyuba, S.V.; Bartsch, R.A. Influence of structural variations in 1-alkyl (aralkyl)-3-methylimidazolium hexafluorophosphates and bis (trifluoromethylsulfonyl) imides on physical properties of the ionic liquids. ChemPhysChem 2002, 3, 161–166. [Google Scholar] [CrossRef]
  23. Xue, L.; Tamas, G.; Koh, Y.P.; Shadeck, M.; Gurung, E.; Simon, S.L.; Maroncelli, M.; Quitevis, E.L. Effect of Alkyl chain branching on physicochemical properties of imidazolium-based ionic liquids. J. Chem. Eng. Data 2016, 61, 1078–1091. [Google Scholar] [CrossRef]
  24. Hasan, M.; Kahler, N.; Kumar, G. Shape-controlled metal–metal and metal–polymer Janus structures by thermoplastic embossing. ACS Appl. Mater. Interfaces 2016, 8, 11084–11090. [Google Scholar] [CrossRef] [PubMed]
  25. Lee, J.; He, M.; Yeo, C.D.; Kumar, G.; Hu, Z.; Quitevis, E.L.; Thalangama-Arachchige, V.D. Friction and wear of Pd-rich amorphous alloy (Pd43Cu27Ni10P20) under dry and ionic liquid (IL) lubricated conditions. Wear 2018, 408, 190–199. [Google Scholar] [CrossRef]
  26. Khonsari, M.M.; Booser, E.R. Applied Tribology: Bearing Design and Lubrication, 2nd ed.; John Wiley & Sons: Hoboken, NJ, USA, 2017; ISBN 978-0-470-05711-7. [Google Scholar]
Figure 1. Generic synthesis of [C9C1im][NTf2] with R = C9H19.
Metals 09 01180 g001
Figure 2. TGA measurement for [C9C1im][NTf2]: (a) Dynamic TGA curves at a heating rate of 10 K/min under nitrogen and air and (b) TGA derivative curves obtained from Figure 2a.
Metals 09 01180 g002
Figure 3. XRD patterns of Pd amorphous alloy in the as-prepared state and after polishing [25], reproduced with permission from Elsevier, 2019.
Metals 09 01180 g003
Figure 4. Reciprocating ball on disk tribometer for high temperatures: (a) Temperature controllable sample stage, (b) micro stage to adjust the normal load, (c) tip holder and cantilever with two strain gauges, and (d) high-resolution digital camera.
Metals 09 01180 g004
Figure 5. The measured coefficient of friction (COF) for crystalline Pd and amorphous Pd alloy samples with respect to sliding distance with the ionic liquid at room temperature: (a) Sliding speed of 3 mm/s, (b) sliding speed of 7 mm/s.
Metals 09 01180 g005
Figure 6. The morphologies of the worn surfaces: (a) 3D topography and (b) SEM image of crystalline Pd with sliding speed of 3 mm/s and (c) 3D topography and (d) SEM image of amorphous Pd alloy with sliding speed of 3 mm/s under the IL lubrication at ambient temperature.
Metals 09 01180 g006
Figure 7. Wear coefficient of (a) crystalline Pd and (b) amorphous Pd alloy samples at different temperatures.
Metals 09 01180 g007
Figure 8. The measured coefficient of friction (COF) for crystalline Pd and amorphous Pd alloy samples with respect to sliding distance with the ionic liquid at 100 °C: (a) Sliding speed of 3 mm/s, (b) sliding speed of 7 mm/s.
Metals 09 01180 g008
Figure 9. The morphologies of the worn surfaces: (a) 3D topography and (b) SEM image of crystalline Pd with sliding speed of 3 mm/s and (c) 3D topography and (d) SEM image of amorphous Pd alloy with sliding speed of 3 mm/s under the IL lubrication at 100 °C.
Metals 09 01180 g009
Figure 10. The measured coefficient of friction (COF) for crystalline Pd and amorphous Pd alloy samples with respect to sliding distance with the ionic liquid at 200 °C: (a) Sliding speed of 3 mm/s, (b) sliding speed of 7 mm/s.
Metals 09 01180 g010
Figure 11. The morphologies of the worn surfaces: (a) 3D topography and (b) SEM image of crystalline Pd with sliding speed of 3 mm/s and (c) 3D topography and (d) SEM image of amorphous Pd alloy with sliding speed of 3 mm/s under the IL lubrication at 200 °C.
Metals 09 01180 g011
Figure 12. The SEM images of the worn surface of (a) crystalline Pd and (b) amorphous Pd alloy samples with the ionic liquid at 200 °C and the sliding speed of 7 mm/s.
Metals 09 01180 g012
Figure 13. The SEM images of the stainless-steel ball with the test conditions: Amorphous Pd at 200 °C and sliding speed of 7 mm/s.
Metals 09 01180 g013
Table 1. Thermal stability of [C9C1im][NTf2] in terms of decomposition temperatures.
Tonset (°C)Tpeak (°C)Tendset (°C)ASTM D3850
T25% (°C)T50% (°C)T70% (°C)T80% (°C)T90% (°C)
N2428 ± 3463 ± 2474 ± 1434 ± 2451 ± 2461 ± 2466 ± 2472 ± 2
Air408 ± 10444 ± 7457 ± 7408 ± 4435 ± 4447 ± 5454 ± 5489 ± 17
Table 2. Summary of steady-state COF values for each test configuration.
TemperatureCrystalline PdAmorphous Pd
3 mm/s7 mm/s3 mm/s7 mm/s
Ambient0.28 ± 0.010.24 ± 0.010.19 ± 0.010.12 ± 0.01
100 °C0.42 ± 0.020.36 ± 0.010.20 ± 0.010.18 ± 0.01
200 °C0.44 ± 0.030.33 ± 0.070.19 ± 0.020.17 ± 0.01
Table 3. The XPS data on the non-contact area: (a) Crystalline Pd and (b) amorphous Pd alloy.
(a)Ambient100 °C200 °C
# of SputteringF (at%)S (at%)F (at%)S (at%)F (at%)S (at%)
004.10.10.12.71.8
1000021.4
200000.91.4
300002.61.5
4000000
(b)Ambient100 °C200 °C
# of SputteringF (at%)S (at%)F (at%)S (at%)F (at%)S (at%)
04.64.711.23.90.62.7
1000000
Table 4. The XPS data for crystalline Pd samples on the contact area: (a) 3 mm/s and (b) 7 mm/s.
(a)Ambient100 °C200 °C
# of SputteringF (at%)S (at%)F (at%)S (at%)F (at%)S (at%)
004.901.36.53.7
10301.71.73.4
20001.30.12
30001.503.2
40000.303.2
5000002.4
6000002.1
7000002.6
8000003
9000000
(b)Ambient100 °C200 °C
# of SputteringF (at%)S (at%)F (at%)S (at%)F (at%)S (at%)
004.60.11.16.73.3
103.201.95.32.9
20001.14.63
300013.32.5
40000.33.52
50000.13.62.4
600003.52.3
7000032.3
800002.31.5
9000000
Table 5. The XPS data for amorphous Pd alloy samples on the contact area: (a) 3 mm/s and (b) 7 mm/s.
(a)Ambient100 °C200 °C
# of SputteringF (at%)S (at%)F (at%)S (at%)F (at%)S (at%)
011.55.54.60.700.8
1000000
2000000
(b)Ambient100 °C200 °C
# of SputteringF (at%)S (at%)F (at%)S (at%)F (at%)S (at%)
016.95.70002.3
101.50001.5
2000000

