Article

Separation of Ag and Cu from Their Aqueous Thiosulfate Complexes by UV-C Irradiation

Research Center for High Purity Materials, School of Materials Science and Engineering, Henan University of Science and Technology, No. 263 Kaiyuan Avenue, Luoyang 471023, China
*
Author to whom correspondence should be addressed.
Metals 2019, 9(11), 1178; https://doi.org/10.3390/met9111178
Submission received: 8 October 2019 / Revised: 28 October 2019 / Accepted: 29 October 2019 / Published: 31 October 2019

Abstract

:
In recent years, there has been renewed interest in the use of thiosulfate as a substitute for cyanide in silver leaching. Copper thiosulfate leaching without ammonia was applied to extract silver from silver sulfide, resulting in the production of Ag–Cu polymetallic thiosulfate complexes in solutions. It is necessary to separate Ag–Cu polymetallic thiosulfate complexes with the purposes of silver recovery and copper recycling. In this paper, the feasibility study on the use of UV-C irradiation to separate Ag–Cu polymetallic thiosulfate complexes was investigated based on the different photosensitivity of silver and copper. First, a kinetic study on the photolysis of silver and copper thiosulfate complexes by UV-C was investigated, indicating that the reactions follow first-order kinetics. The rate constant reactions were calculated, and it decreased with solution concentrations. On the other hand, the photoproducts of the silver and copper thiosulfate complexes were characterized by XRD and XPS in order to confirm the phase and chemical composition. It indicated that the silver photoproducts are Ag2S, S, Ag and the copper photoproducts are Cu2S, CuS, CuO, Cu, S. Finally, the four-step continuous separation of Ag–Cu polymetallic thiosulfate complexes by UV-C irradiation was investigated. The silver component was recovered with the accumulated recovery ratio of 97%, and the copper component was recycled with the accumulated recycle ratio of 51%, which made it possible for silver recovery and copper recycling.

1. Introduction

Thiosulfate leaching technology has been successfully applied on precious metal extraction [1,2], and has gradually become a substitute to cyanidation leaching due to its lower toxicity. Feng [3] studied gold leaching in a more comprehensive way with calcium, sodium, and ammonium thiosulfate salts from pure gold, gold ores, and sulphide ore. It indicated that in the leaching of pure gold, calcium thiosulphate has a significantly higher gold extraction rate than ammonium and sodium thiosulphates at the same reagent concentrations; in the leaching of the pyrite concentrate, ammonium thiosulphate gives a marginally higher gold extraction than calcium thiosulphate; and in the leaching of sulphide ore, calcium thiosulphate is the highest method among the ammonium and sodium thiosulphate. However, the use of thiosulfate alone will make the leaching system unstable. In order to solve this problem, a catalytic system for thiosulfate leaching was investigated. According to the different catalytic oxidants in the leaching process with thiosulfate, the leaching system with thiosulfate was divided into a copper ammonia system and a non-copper ammonia system. The gold leaching system of copper ammonia is a standard system for gold leaching with thiosulfate, which has been studied by scholars at home and abroad for a long time. In 1900, Von Patera proposed the treatment of precious metals by the Von Patera process (chlorination roasting–thiosulfate leaching of gold and silver from gold and silver ores). Later, the method was applied to silver-rich sulfide ores in South America and La Colorado mines in Mexico. During the 1970s, the former Soviet Union made a great deal of research on ammonia thiosulfate. It was found that copper ion could accelerate gold leaching in an ammonia thiosulfate system. The gold leaching system of copper ammonia was initially formed, and it has been extensively studied further. Aylmore and Muir [4,5] discussed the gold leaching system of thiosulfate from the aspects of the leaching mechanism and thermodynamics. Because of the disadvantages of the copper ammonia thiosulfate leaching system, such as the large consumption and instability of thiosulfate, the complex components of leaching solution, environmental problems of ammonia, and difficulties in gold recovery, there is no industrial application of this system in China. Although scholars have improved the system in response to these problems, it is still unsatisfactory. In order to find a new way, scholars have formed a new thiosulfate system by studying a new catalytic oxidant instead of copper ammonia oxidant. The leaching system of pure gold or sulfide ores mainly includes Cl-NH3-S2O32−, Ni2+-NH3-S2O32−, Cu2+-en-S2O32−, Fe3+-(C2O4)2−-S2O32−, and Fe-EDTA [6,7,8]. With the in-depth research, new problems of thiosulfate leaching are gradually emerging. There are three problems: First, it will produce thiosulfate leaching complex solutions that need to be treated. Second, the problem of a soluble metal thiosulfate complex in nature also needs to be solved. Thirdly, due to the diversity of the components in ore and the non-selectivity of the thiosulfate leaching agent, there will be a variety of metal components in the leaching solution, resulting in the presence of a polymetallic thiosulfate complex. For example, thiosulfate leaching without ammonia was investigated in silver sulfide leaching. Cui et al. [9] investigated the silver sulfide leaching with a copper–thiosulfate solution in the absence of ammonia. The copper–thiosulfate complex can be produced by the mixture of copper sulfate and sodium thiosulfate. A redox reaction happens in the process, and the chemical equations are shown below:
2 Cu 2 + + 4 S 2 O 3 2 2 C u S 2 O 3 + S 4 O 6 2
2 C u 2 + + 6 S 2 O 3 2 2 C u ( S 2 O 3 ) 2 3 + S 4 O 6 2
2 C u 2 + + 8 S 2 O 3 2 2 ( C u S 2 O 3 ) 3 5 + S 4 O 6 2
The silver sulfide can be substituted by copper–thiosulfate to form a cuprous sulfide and silver thiosulfate complex. The related chemical equations are shown below:
A g 2 S + 2 C u S 2 O 3 C u 2 S + 2 A g S 2 O 3
A g 2 S + 2 C u ( S 2 O 3 ) 2 3 C u 2 S + 2 A g ( S 2 O 3 ) 2 3
A g 2 S + 2 C u ( S 2 O 3 ) 3 5 C u 2 S + 2 A g ( S 2 O 3 ) 3 5
During the process, a new problem arises on how to separate Ag and Cu from their aqueous thiosulfate complexes. Several traditional technologies towards the separation of Ag and Cu from their cationic solution or anion complex solutions [10], such as solvent extraction with electrowinning, ion exchange, and emulsion liquid membranes. The advantages and disadvantages of different traditional methods are summarized in Table 1 [11,12,13]. In a previous study, the UV photolysis of a metal thiosulfate complex (Hg/Pb/Cd) was investigated [14,15,16]. The photolysis mechanism of the metal thiosulfate complex by UV was elaborated, and the M–sulfide was precipitated from the solution. The related equations of the Hg–thiosulfate complex are shown below:
Hg S 2 O 3 + hv Hg S 2 O 3 *
Hg S 2 O 3 * + H 2 O hv HgS + S O 4 2 + 2 H +
2 Hg S 2 O 3 * + 2 H 2 O hv H g 2 S + S 0 + 2 S O 4 2 + 4 H +
The metal thiosulfate complex has the common characteristics of UV photolysis due to the thiosulfate ions, but it also has specific attributes due to the cation ions. Different metal thiosulfate complexes have different precipitation rates, and it introduces the possibility of separation of the polymetallic thiosulfate complexes. In this work, the Ag and Cu thiosulfate complexes have different precipitation rates due to the different cation ions, and a kinetic study on photolysis of Ag thiosulfate and Cu thiosulfate complexes by UV-C were investigated, respectively. Based on the rate reaction, the feasibility of separation of Ag and Cu from their thiosulfate aqueous complexes was studied. The separation law will be summarized, and the separation mechanism will be illustrated based on the separation experiment results. This work proposes to carry out the separation research of the thiosulfate complex system by solving the key technical problems, such as the recovery of silver thiosulfate complexes and the recycling of copper thiosulfate complexes, which has gradually become a common technical problem in various fields. It realizes the purpose finally by providing a theoretical basis for silver recovery and copper recycling.

2. Experimental

2.1. Materials

Cui et al. [9] has indicated that for 0.1 g of silver sulfide leached in the solution of 0.1 L (0.10 mol/L of thiosulfate and 0.005–0.01 mol/L of copper sulfate) for 3 h, an average silver extraction of 50% was achieved, and mixture solutions of Ag–Cu thiosulfate complexes (CAg: 100–500 mg/L, CCu: 50–100 mg/L) were produced. In this work, a silver concentration with 100–500 mg/L and a copper concentration with 50–100 mg/L were prepared by reagent grade of sodium thiosulfate, silver nitrate, and copper sulfate. Deionized water produced from a high-purity water system with typical resistivity of 18.24 MΩ cm was used in all experiments. Standard silver and copper solutions were prepared by stepwise dilution of a standard stock solution (1000 mg/L Ag as AgNO3, 1000 mg/L Cu as CuNO3).

2.2. Procedure

The silver–thiosulfate complex and copper–thiosulfate complex was made by mixing silver nitrate and copper sulfate with sodium thiosulfate solution stoichiometrically. For each test, the silver–thiosulfate complex and the copper–thiosulfate complex (250 mL) were put into an Erlenmeyer flask and a small portion of solution (20 mL) was taken out for sampling at one-hour intervals. Temperature was controlled through a water bath until 240 min. The operating parameters of the UV lamp are shown below: type: GP287T5L; mode of connection: single-ended four wire; power: 14 W; wavelength: 254 nm; voltage: 41 V; current: 425 mA; length/OD: 287 mm/15 mm; radiation intensity: 40 μW/cm2; lamp quantity: 2; the distance between lamp and solution: 5 cm. The flowchart of separation process is shown in Figure 1.

2.3. Analytical Methods

The silver and copper concentrations in the aqueous sample were analyzed by a US PerkinElmer Optima 8000 Inductively Coupled Plasma Optical Emission Spectrometer (ICP-OES, US PerkinElmer, Singapore). The silver and copper concentrations were calculated to get silver and copper precipitation. The phase composition of precipitate was analyzed by X-ray diffraction (XRD) analysis on a Bruker D8 X-ray diffractometer (Bruker AXS, Germany). The diffractometer was used with Cu Kα radiation at 40 mA and 40 kV and the detector was rotated from 20° to 90° with a scan speed of 0.1°/sec. The XRD data was compared and analyzed with standard cards in Highscore software. The solid products on the mercuric sulfide surface were investigated by XPS methods (ESCALAB 250XI, Thermo Fisher Scientific, Waltham, MA, US). The XPS analysis was carried out by using monochromatic Al Kα x-radiation at the take-off angle of 90° with no sputtering and no charge neutralization. The C 1s (284.6 eV) line was used for binding energy calibration. The XPS data was fitted using XPS Peak software, and the matching component information was checked through the NIST XPS database.

3. Results and Discussions

3.1. Photosensitivity of Ag Thiosulfate Complexes

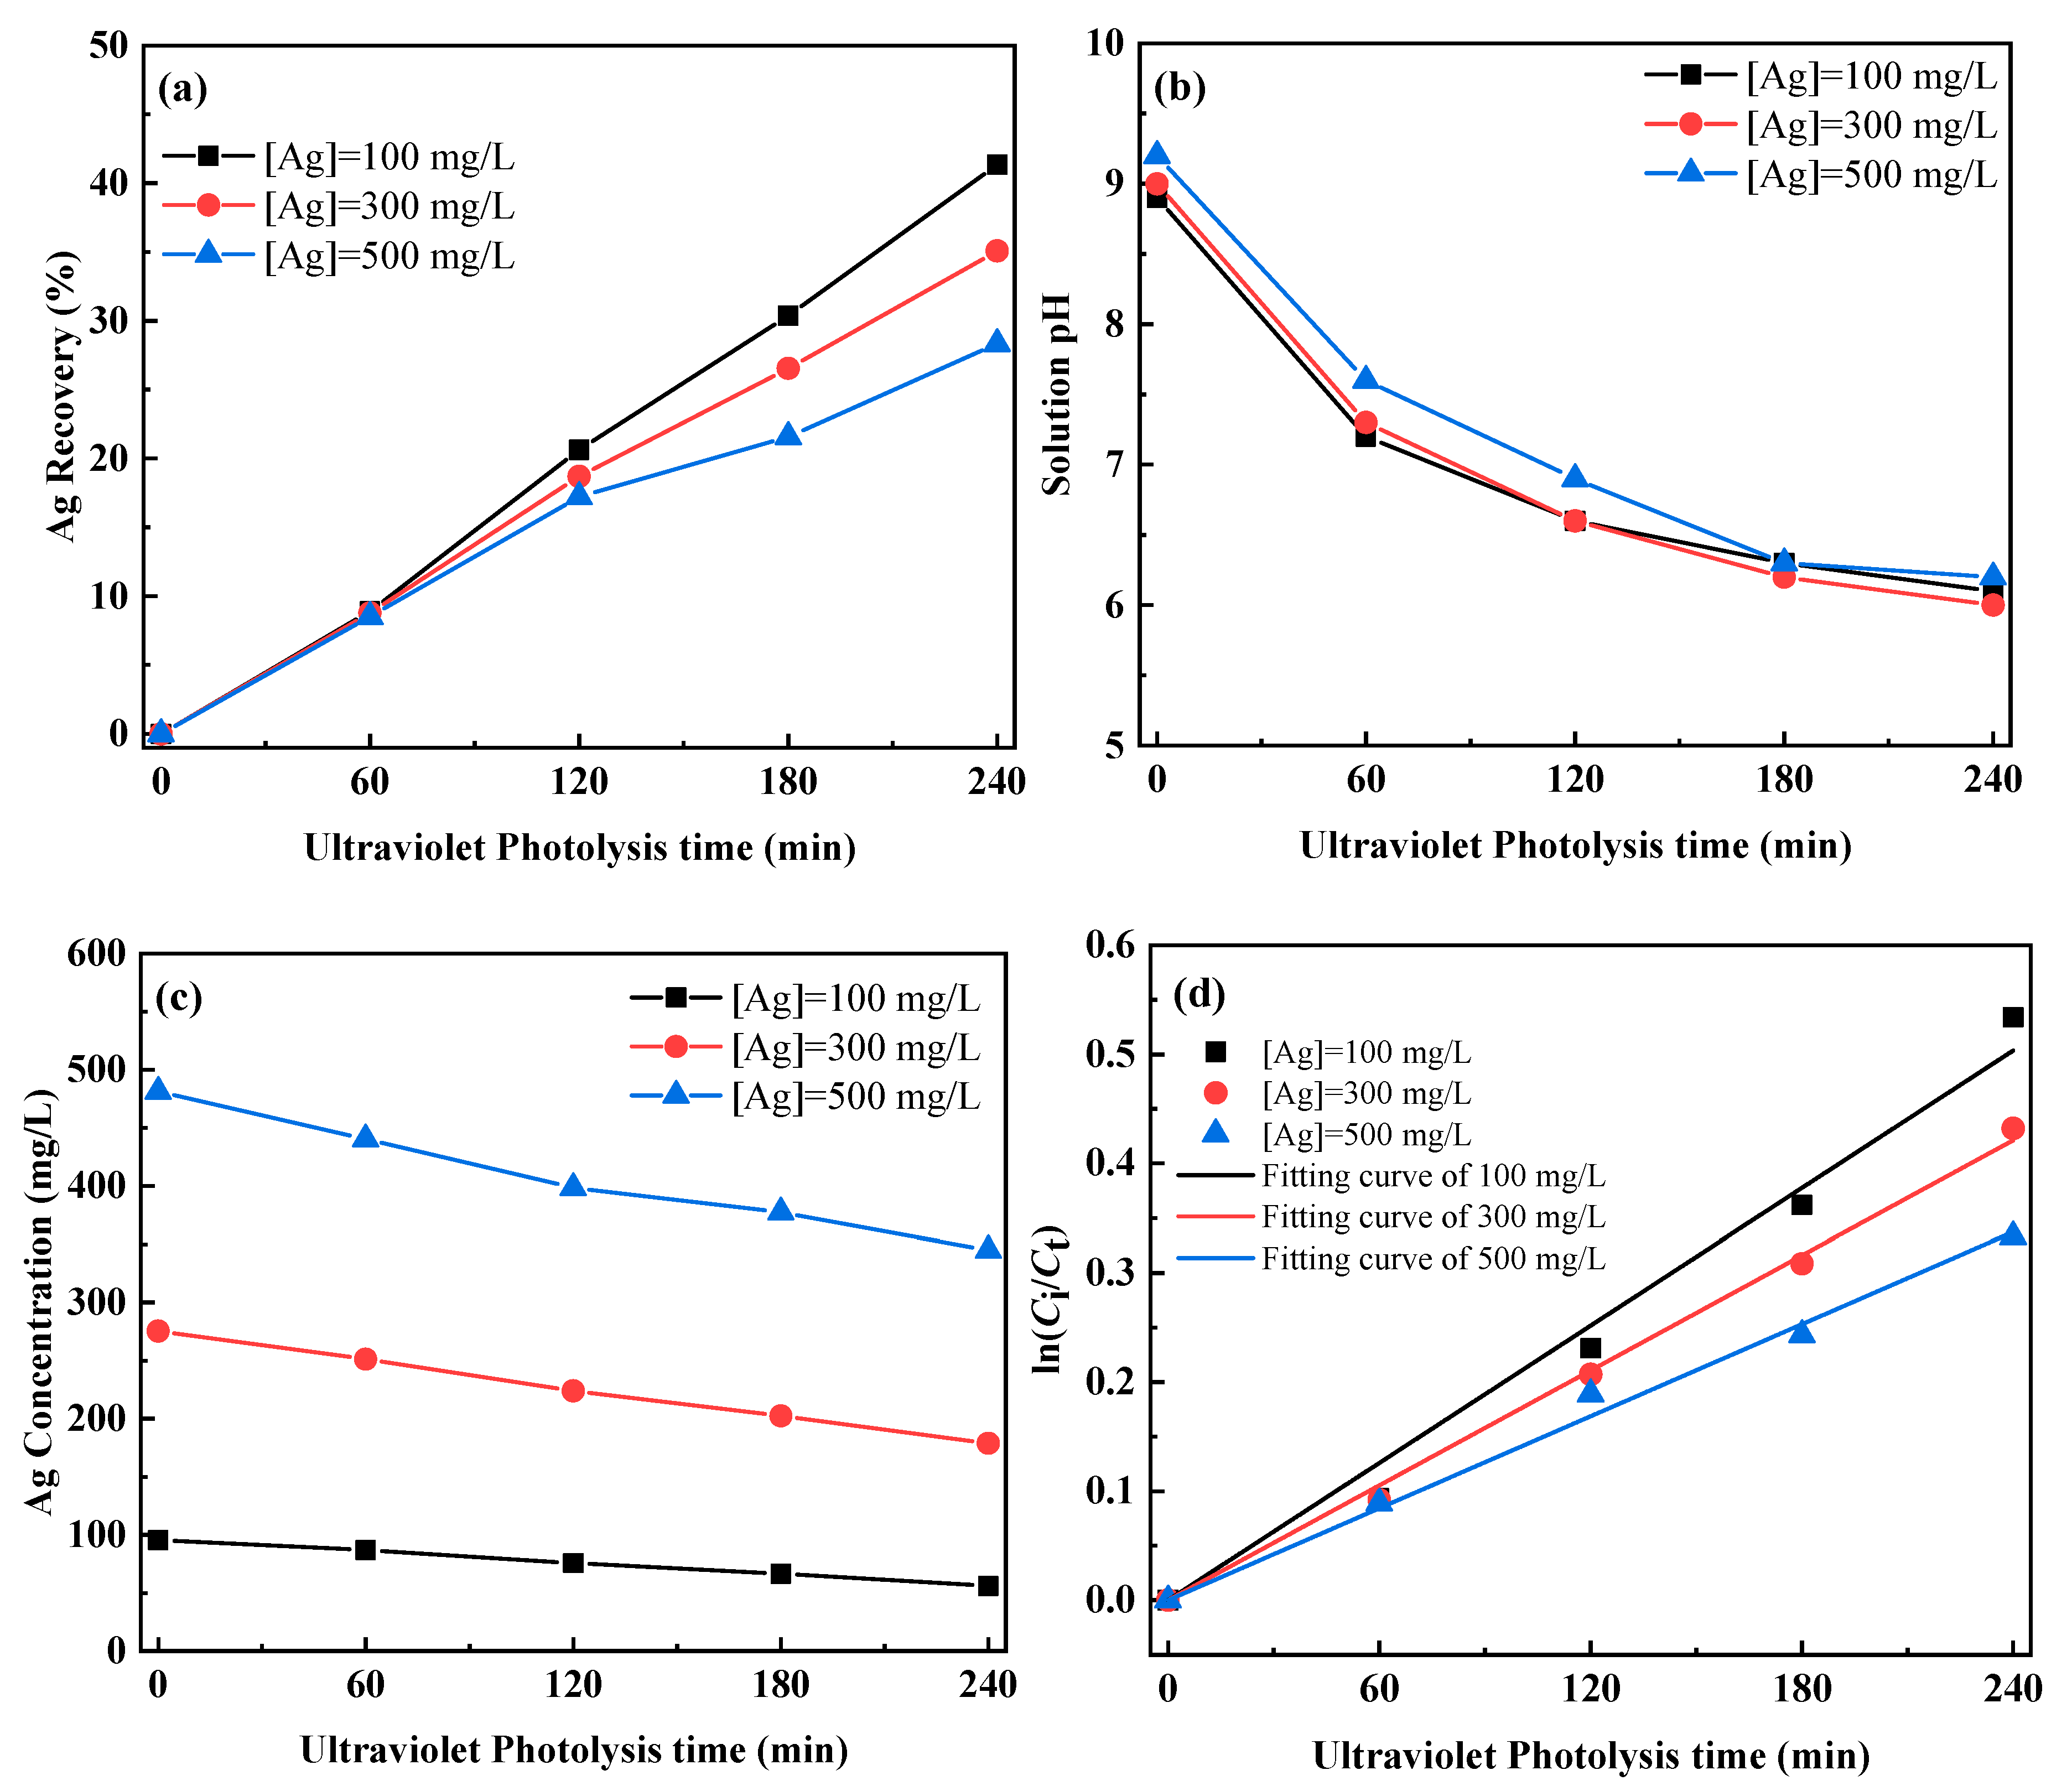
3.1.1. Photolysis of Ag–Thiosulfate Complexes by UV-C Irradiation

According to a previous study [9], the different silver concentrations (100, 300, and 500 mg/L) were chosen for the study of photolysis kinetics. Figure 2 shows the influence of the silver concentration on the decomposition kinetics of silver–thiosulfate complex solutions under UV photolysis. Figure 2a indicated that silver recovery increases with time, and after a photolysis time of 240 min, silver recovery can achieve 41.36%, 35.07%, and 28.35% at different initial silver concentrations. Figure 2b shows the solution pH decreases with time, and the solution pH went down to about 6 after 240 min. The silver concentration at different times is shown in Figure 2c, and it indicates that silver concentration decreases with time, and the silver concentration can reach 56, 178.8, and 344.8 mg/L after 240 min.
Egorov and Wei Wang [14,15,16] studied the radiation of aqueous solutions of heavy metals thiosulfate complexes (Pb, Cd, Hg) with UV light, which resulted in their decomposition. The photolysis mechanism is related to the charge transition. When the electron jumps from the ligands orbit of the complex to the central ion orbit of the complex, an absorption spectrum is formed. The absorption spectrum position of the charge transition depends mainly on the energy difference between the electron acceptor and the electron donor. The stronger chemical affinity between the core ions and ligands are formed, the shorter maximum absorption wavelength we have gotten. For example, the chemical affinity between Cl and Fe3+ is stronger than that between SCN and Fe3+. So, the maximum wavelength of the Cl and Fe3+ lies in the UV region. In terms of the silver thiosulfate complex, the large formation constants mean a strong chemical affinity between the silver and thiosulfate ions. It lies in the UV region theoretically. Every molecule has both the energies of ground state and excited state. The difference value between the two energy levels is certain. If the UV radiation energy can afford the energy difference, the molecule will change its bond length, bond angle, and charge configuration from its inside structure in order to meet the request of stability. According to the experiments results, the silver thiosulfate complex can decompose after a short radiation time. The solution pH can also decrease due to the sulfuric acid formation. The kinetic study of photolysis on a silver–thiosulfate complex with different silver concentrations was investigated, and the first-order kinetic equation is used to describe the photolysis process. The kinetic equation is shown in Equation (10).
r = d C t d t = k C i
where r: the rate, mg/(L*min); k: the rate constant, min−1; Ct: the concentration at t, mg/L; Ci: the initial concentration, mg/L; t: the photolysis time, min (ti = 0).
The logarithm on both sides of the formula was calculated, and the final equations are shown in Equation (11).
ln ( C i C t ) = k t
Based on Equation (11), the ln (Ci/Ct) at different times was calculated, and plot of ln (Ci/Ct) vs. t was generated and a straight line was obtained, as shown in Figure 2d, indicating that under UV-C irradiation, the photolysis of silver–thiosulfate complexes is a first-order equation. The slope of different silver concentrations was calculated, and the rate constant k decreases with silver concentration. The rate constant k of a silver–thiosulfate complex by UV-C at different factors is shown in Table 2.

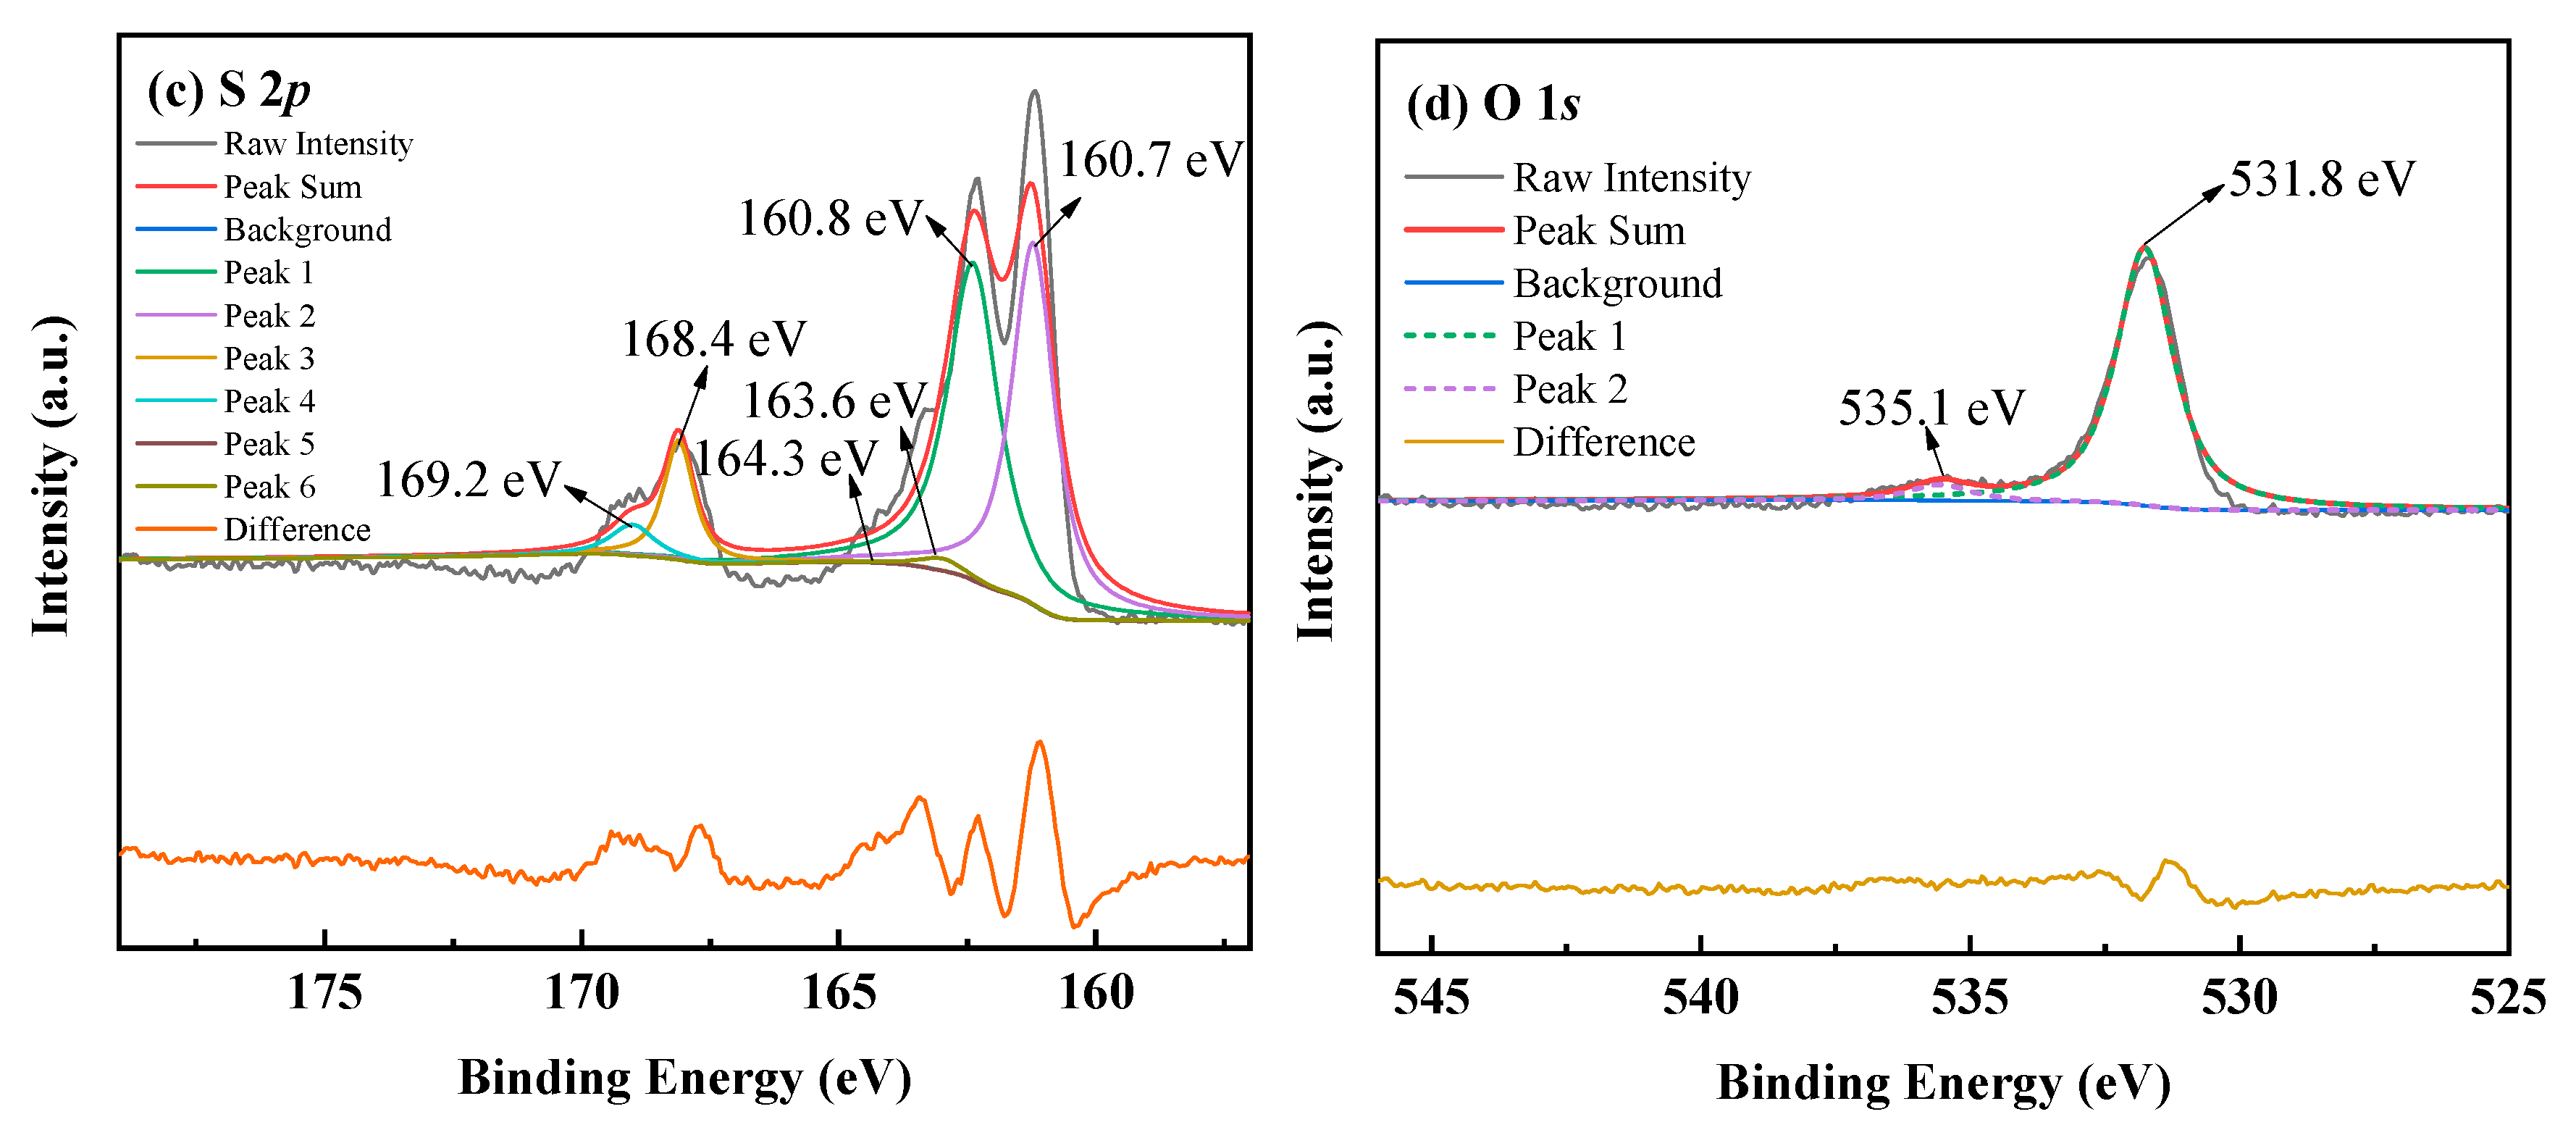
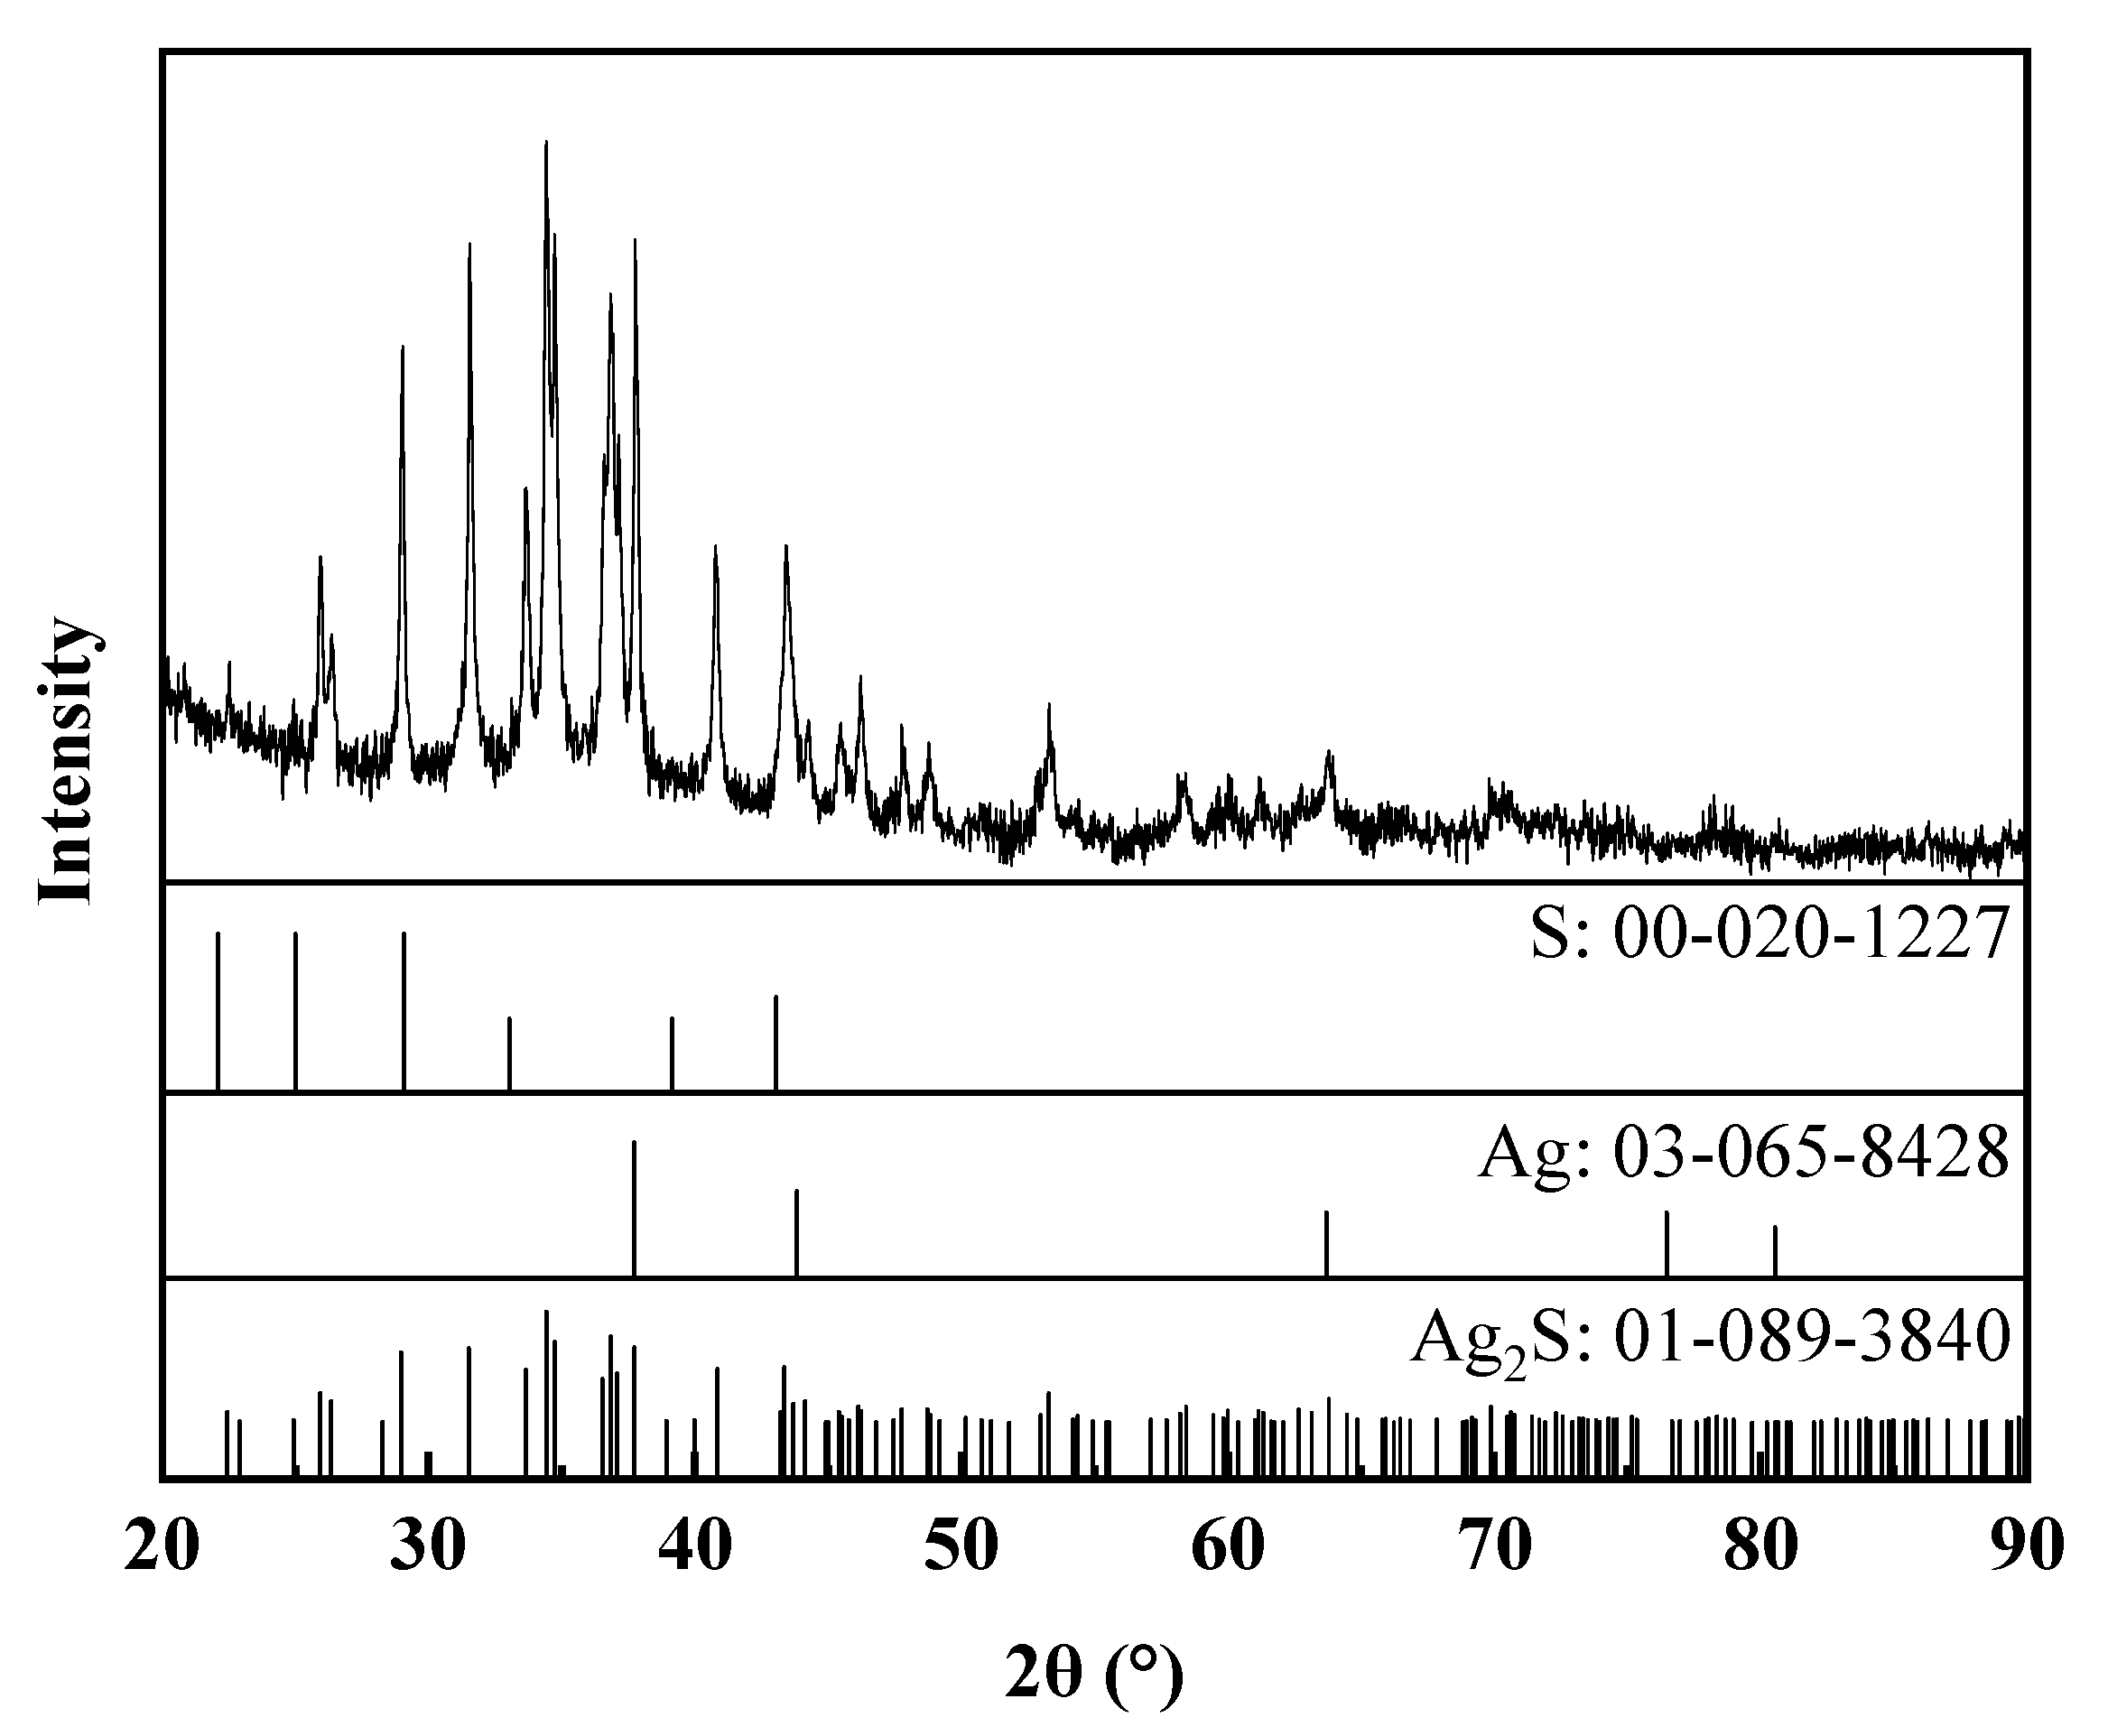
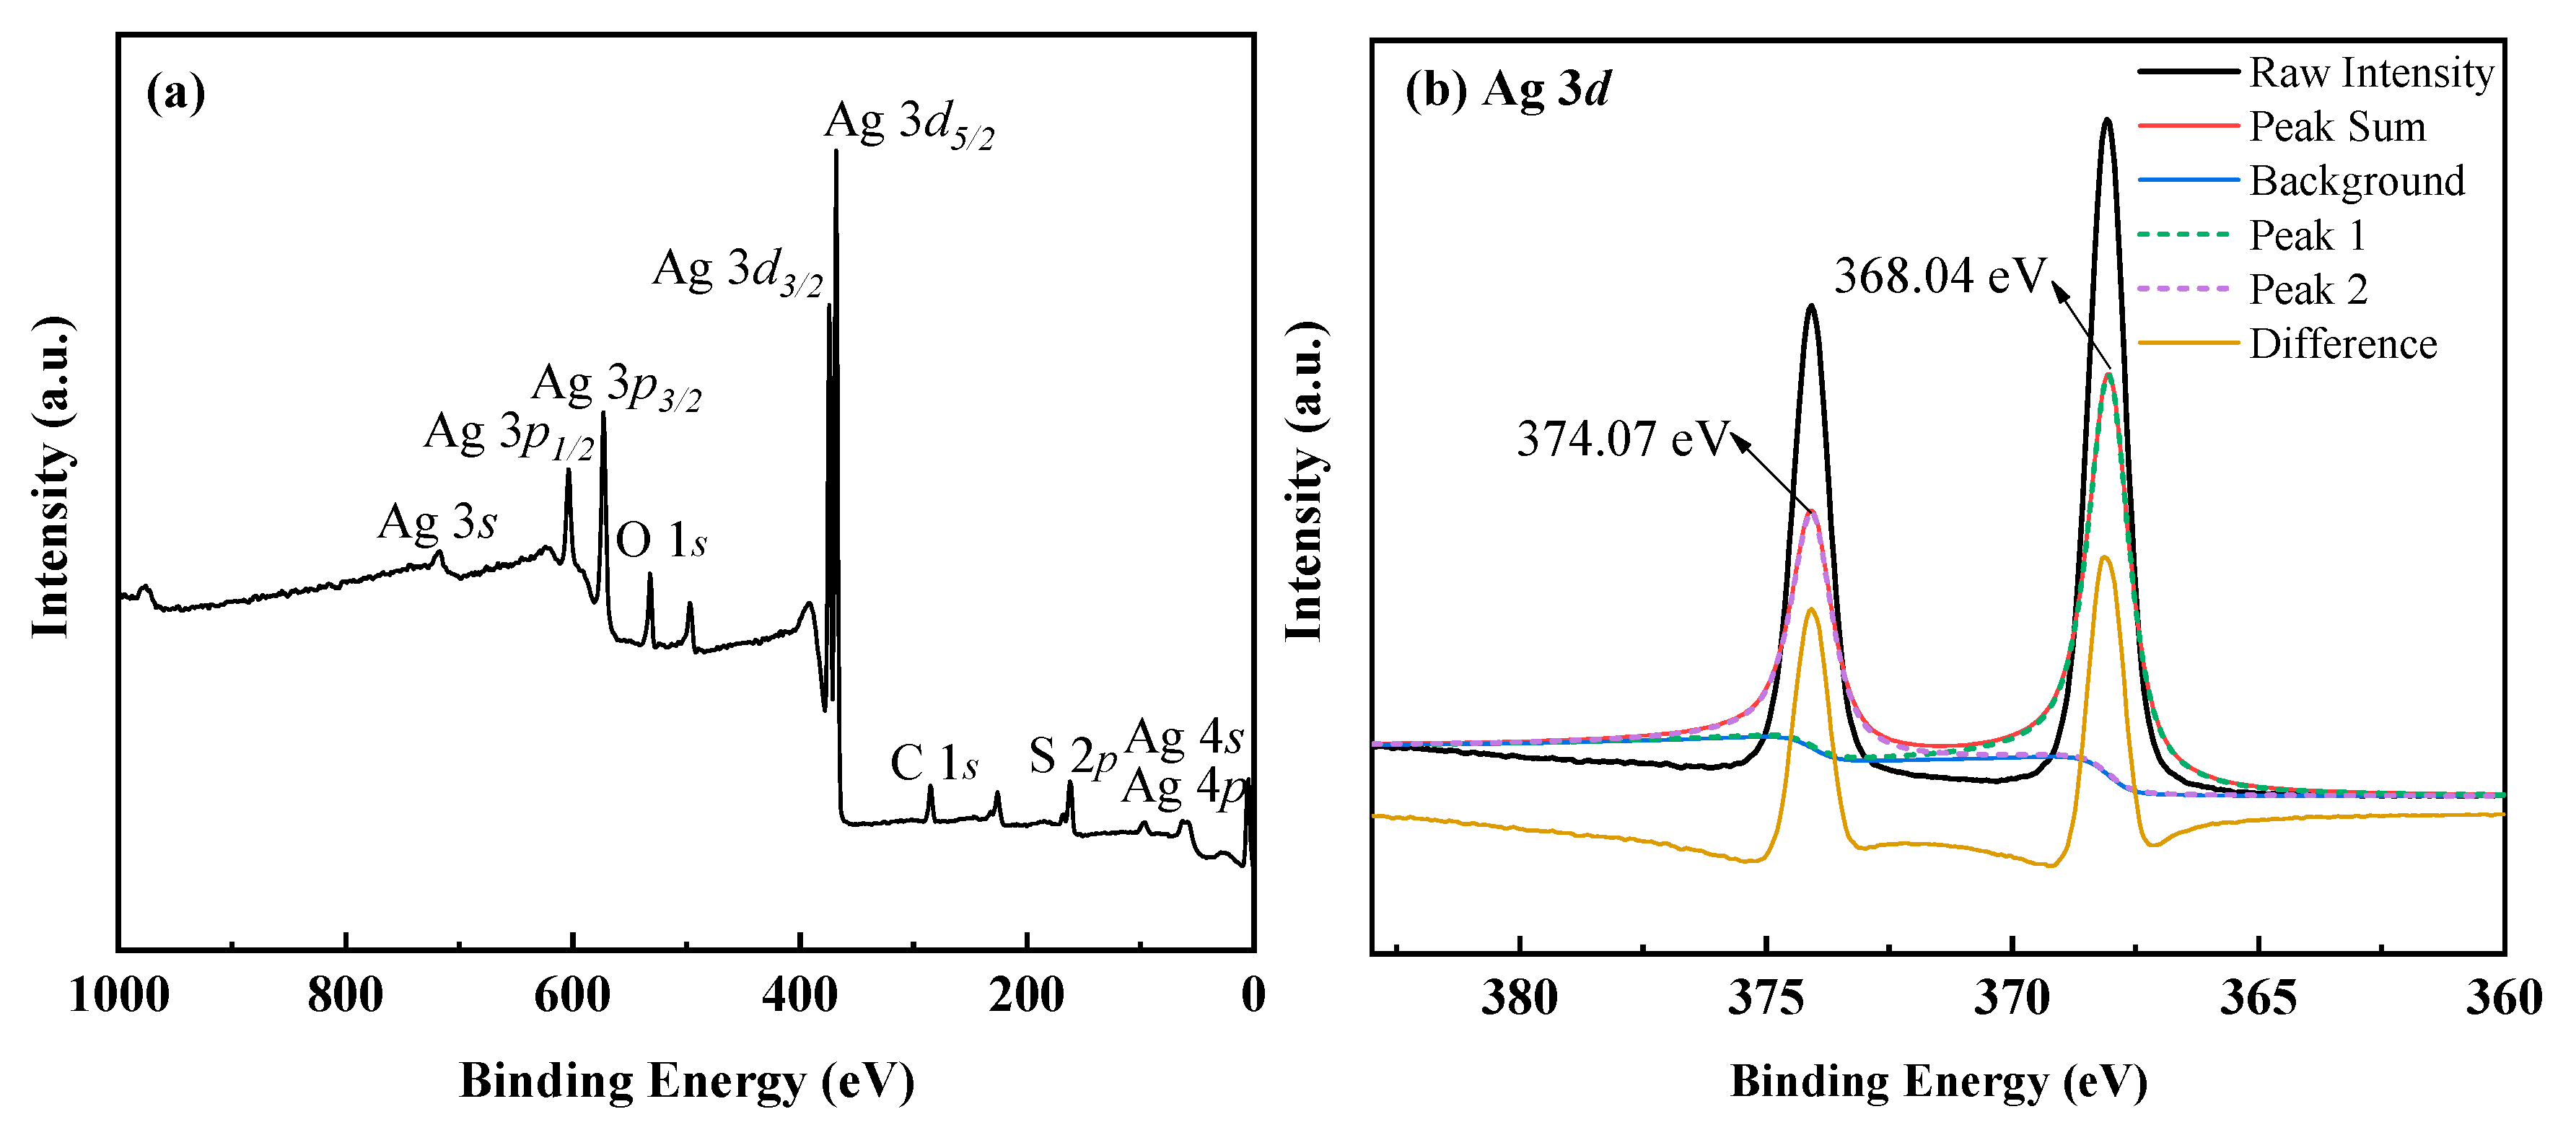
3.1.2. The Characterization of Ag–Thiosulfate Complexes Photoproducts

The XRD analysis results of the photoproducts are shown in Figure 3.
The silver photoproduct was characterized by XRD, and the pattern for the silver photoproduct displays several broad peaks at the angle of 20° to 90°, respectively. Several peaks can be well indexed to the phase of Argentite (Ag2S) (PDF: 01-089-3840), indicating the precipitation mainly occurred as Ag2S during the photolysis of silver–thiosulfate complex. Several peaks can be well indexed to the phase of silver (Ag0) (PDF:03-065-8428) and sulfur (S0) (PDF:00-020-1227), respectively, indicating the secondary products of precipitation occurred as S0 and Ag0 during the photolysis of the silver–thiosulfate complex.
In order to clarify the valence state of elements, the precipitate was further analyzed by XPS (Figure 4). Figure 4a shows the XPS spectrum of silver photoproducts after UV-C photolysis. The high resolution XPS spectra and peaks deconvoluted at Ag 3d, S 2p, and O 1s are shown in Figure 4b–d. In Figure 4b, the binding energies of Ag doublet peaks of all the samples were 368.04 and 374.07 eV, which represent Ag2S and Ag 3d3/2 and 3d1/2 [17,18], respectively. It indicates that silver components occur as Ag2S and Ag on the surface of the photoproducts. Figure 4c shows the deconvoluted XPS S 2p spectrum with the binding energies of S doublet peaks of all the samples were 160.8 and 160.7 eV, which represent Ag2S 2p3/2 and 2p1/2 [18,19], respectively. Figure 4c shows the deconvoluted XPS S 2p spectrum with the binding energies of S doublet peaks of all the samples were 164.3 and 163.6 eV, which represent S0 2p3/2 and 2p1/2 [20,21], respectively. Figure 4c shows the deconvoluted XPS S 2p spectrum with the binding energies of S doublet peaks of all the samples were 168.4 and 169.2 eV, which represent Na2S2O3 2p3/2 and Na2SO4 2p1/2 [20,22], respectively. Figure 4d shows the deconvoluted XPS O 1S spectrum with the binding energies of O doublet peaks of all the samples were 535.1 and 531.8 eV, which represent H2O and Na2S2O3 O 1s [23,24], respectively. According to the analysis, the composition of the photoproducts occurs mainly as Ag2S, S and Ag.

3.2. Photosensitivity of Cu Thiosulfate Complexes

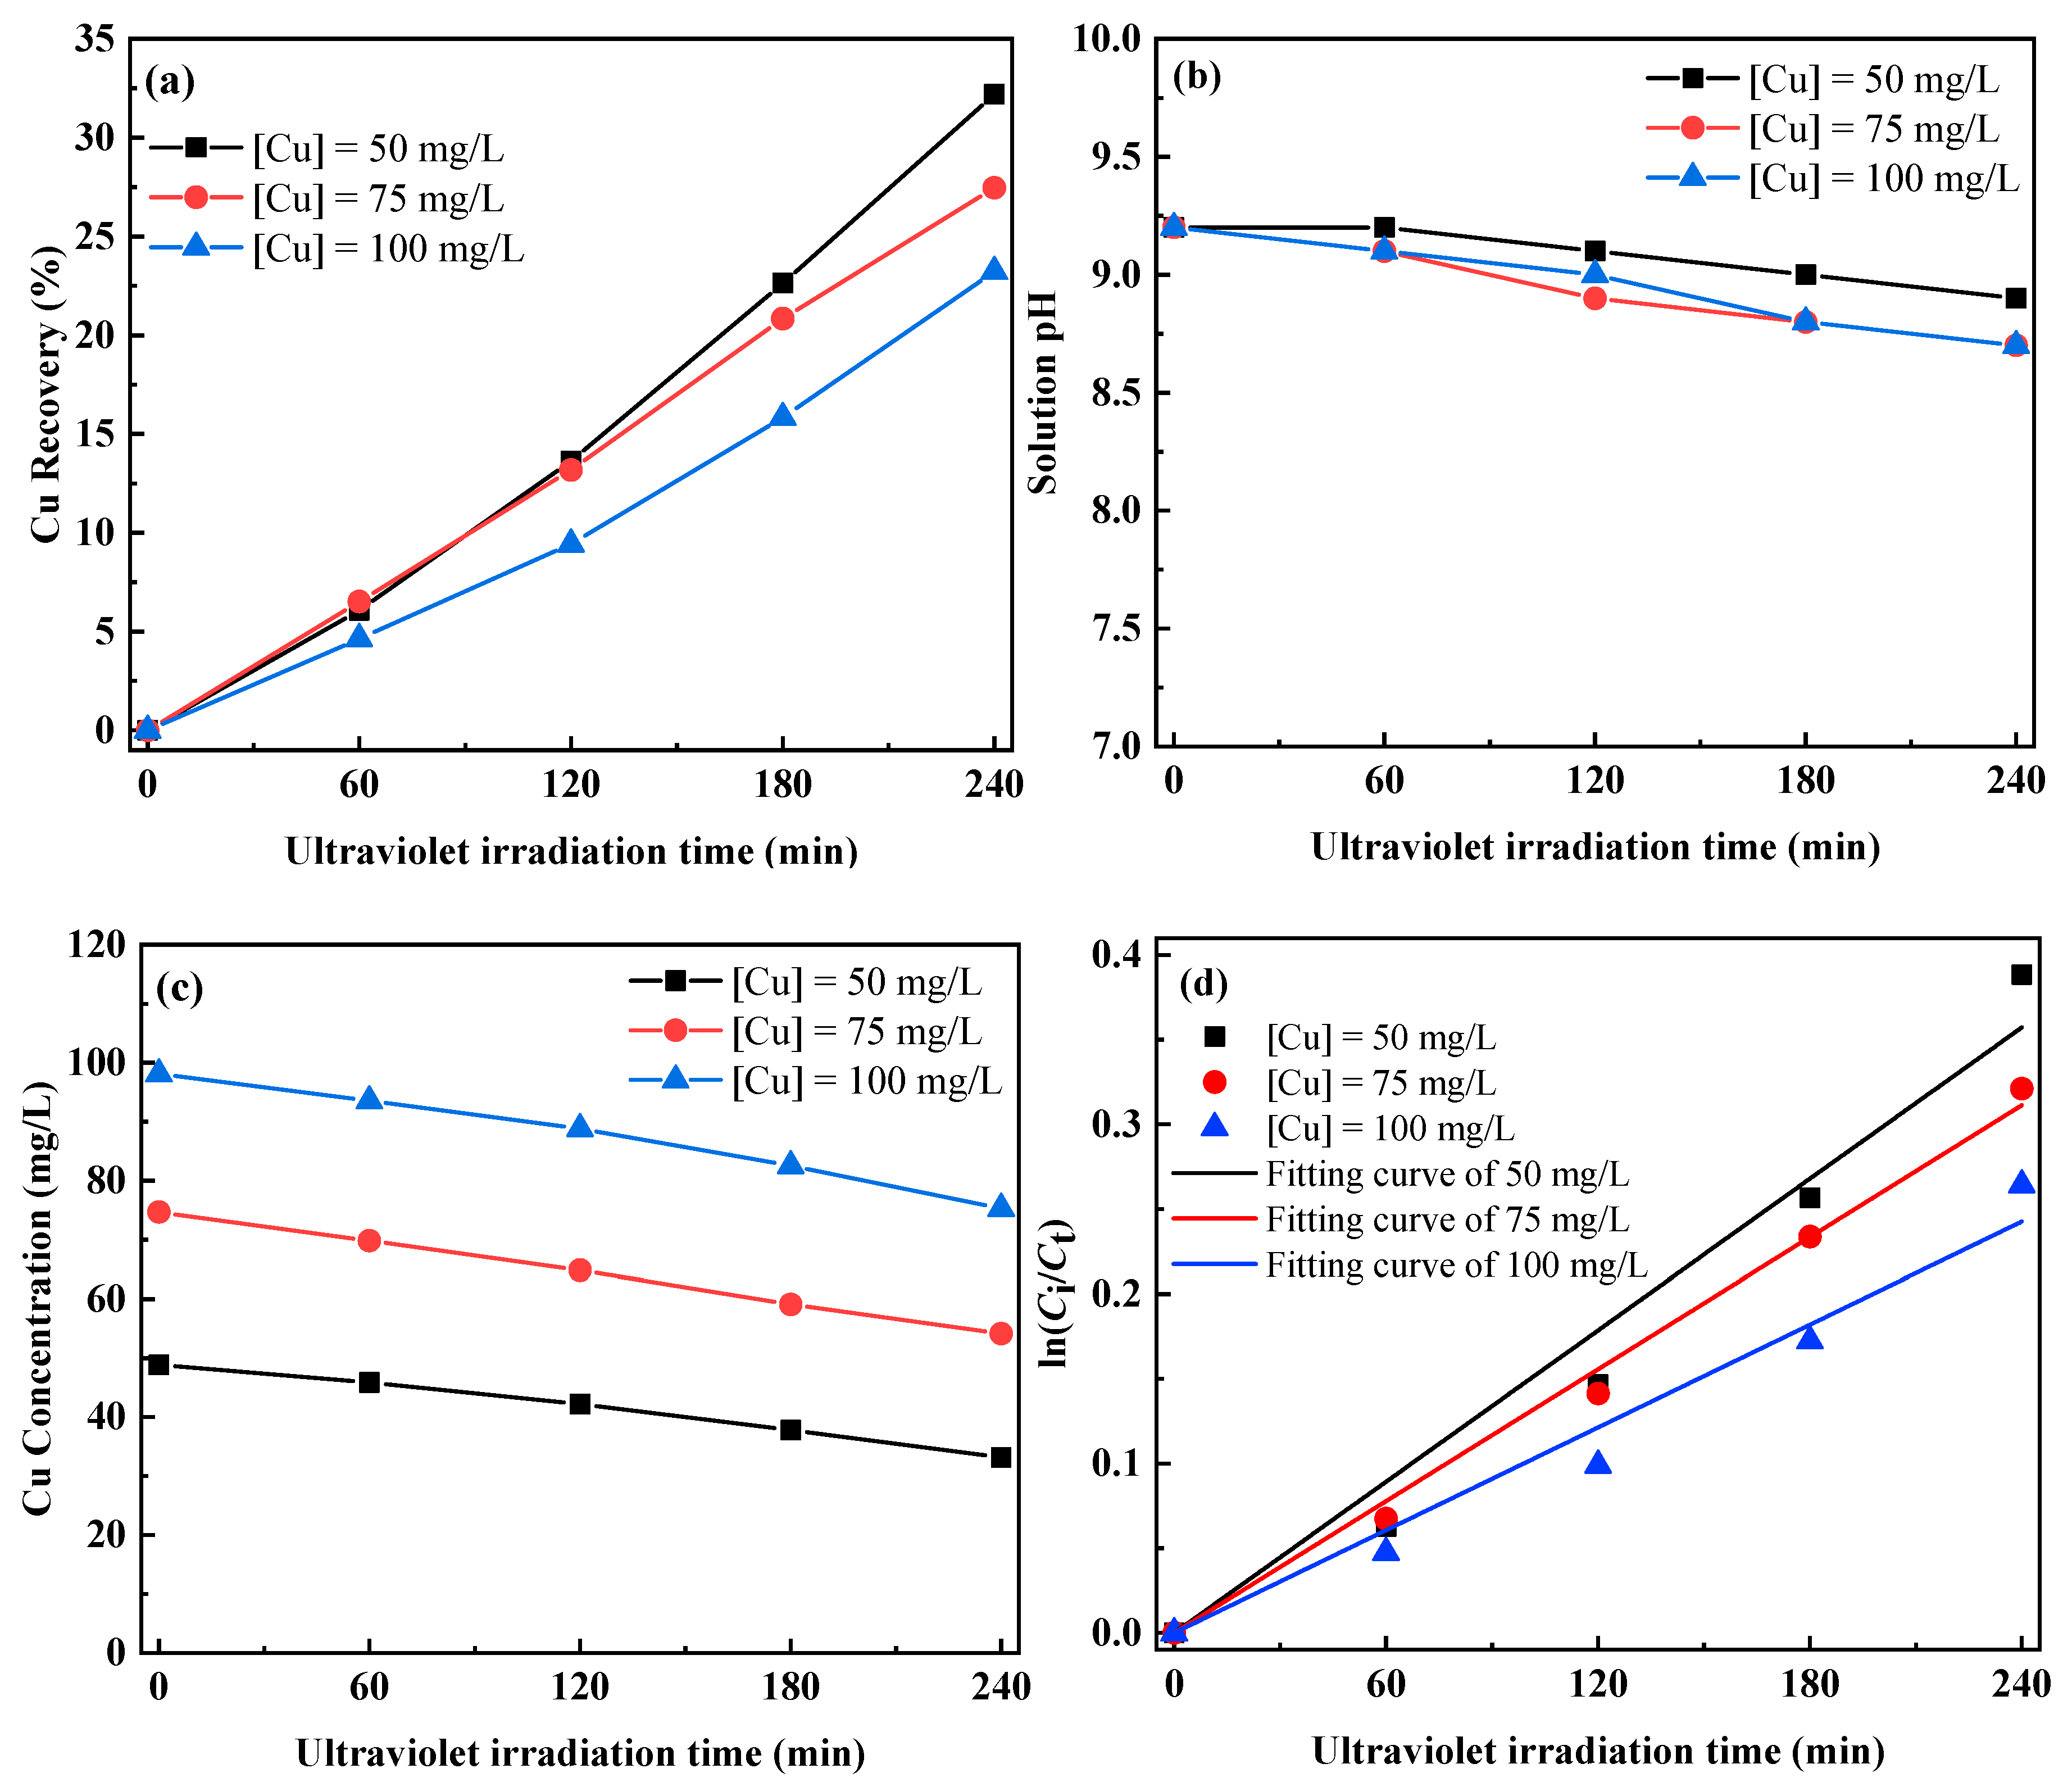
3.2.1. Photolysis of Cu–Thiosulfate Complexes by UV-C Irradiation

According to a previous study [9], the different copper concentrations (50, 75, and 100 mg/L) were chosen for the study of photolysis kinetics. Figure 5 shows the influence of copper concentration on the decomposition kinetics of a silver–thiosulfate complex solution under UV photolysis. Figure 5a indicates that copper recovery increases with time, and after a photolysis time of 240 min, copper recovery can achieve 32.19%, 27.46%, and 23.22% at different initial copper concentrations.
Figure 5b shows the solution pH decreases with time, and the solution pH went down to 8.8 after 240 min. The copper concentration at different times is shown in Figure 5c, and it indicates that copper concentration decreases with time, and the copper concentration can reach 33.13, 54.17, and 75.31 mg/L after 240 min. The photolysis mechanism of the copper–thiosulfate complex is related to the charge transition which is the same as the silver–thiosulfate complex. However, due to the different cations, the electron transfer and bond dissociation are different, resulting in the different photolysis rates. Based on Equation (11), the ln (Ci/Ct) at different times was calculated, and a plot of ln (Ci/Ct) vs. t was generated and a straight line was obtained, as shown in Figure 5d, indicating that under UV-C irradiation, the photolysis of the copper–thiosulfate complex is a first-order equation. The slope of different copper concentrations was calculated in Figure 5d, and the rate constant k decreases with copper concentration. The rate constant k of the copper–thiosulfate complex by UV-C at different factors is shown in Table 3.

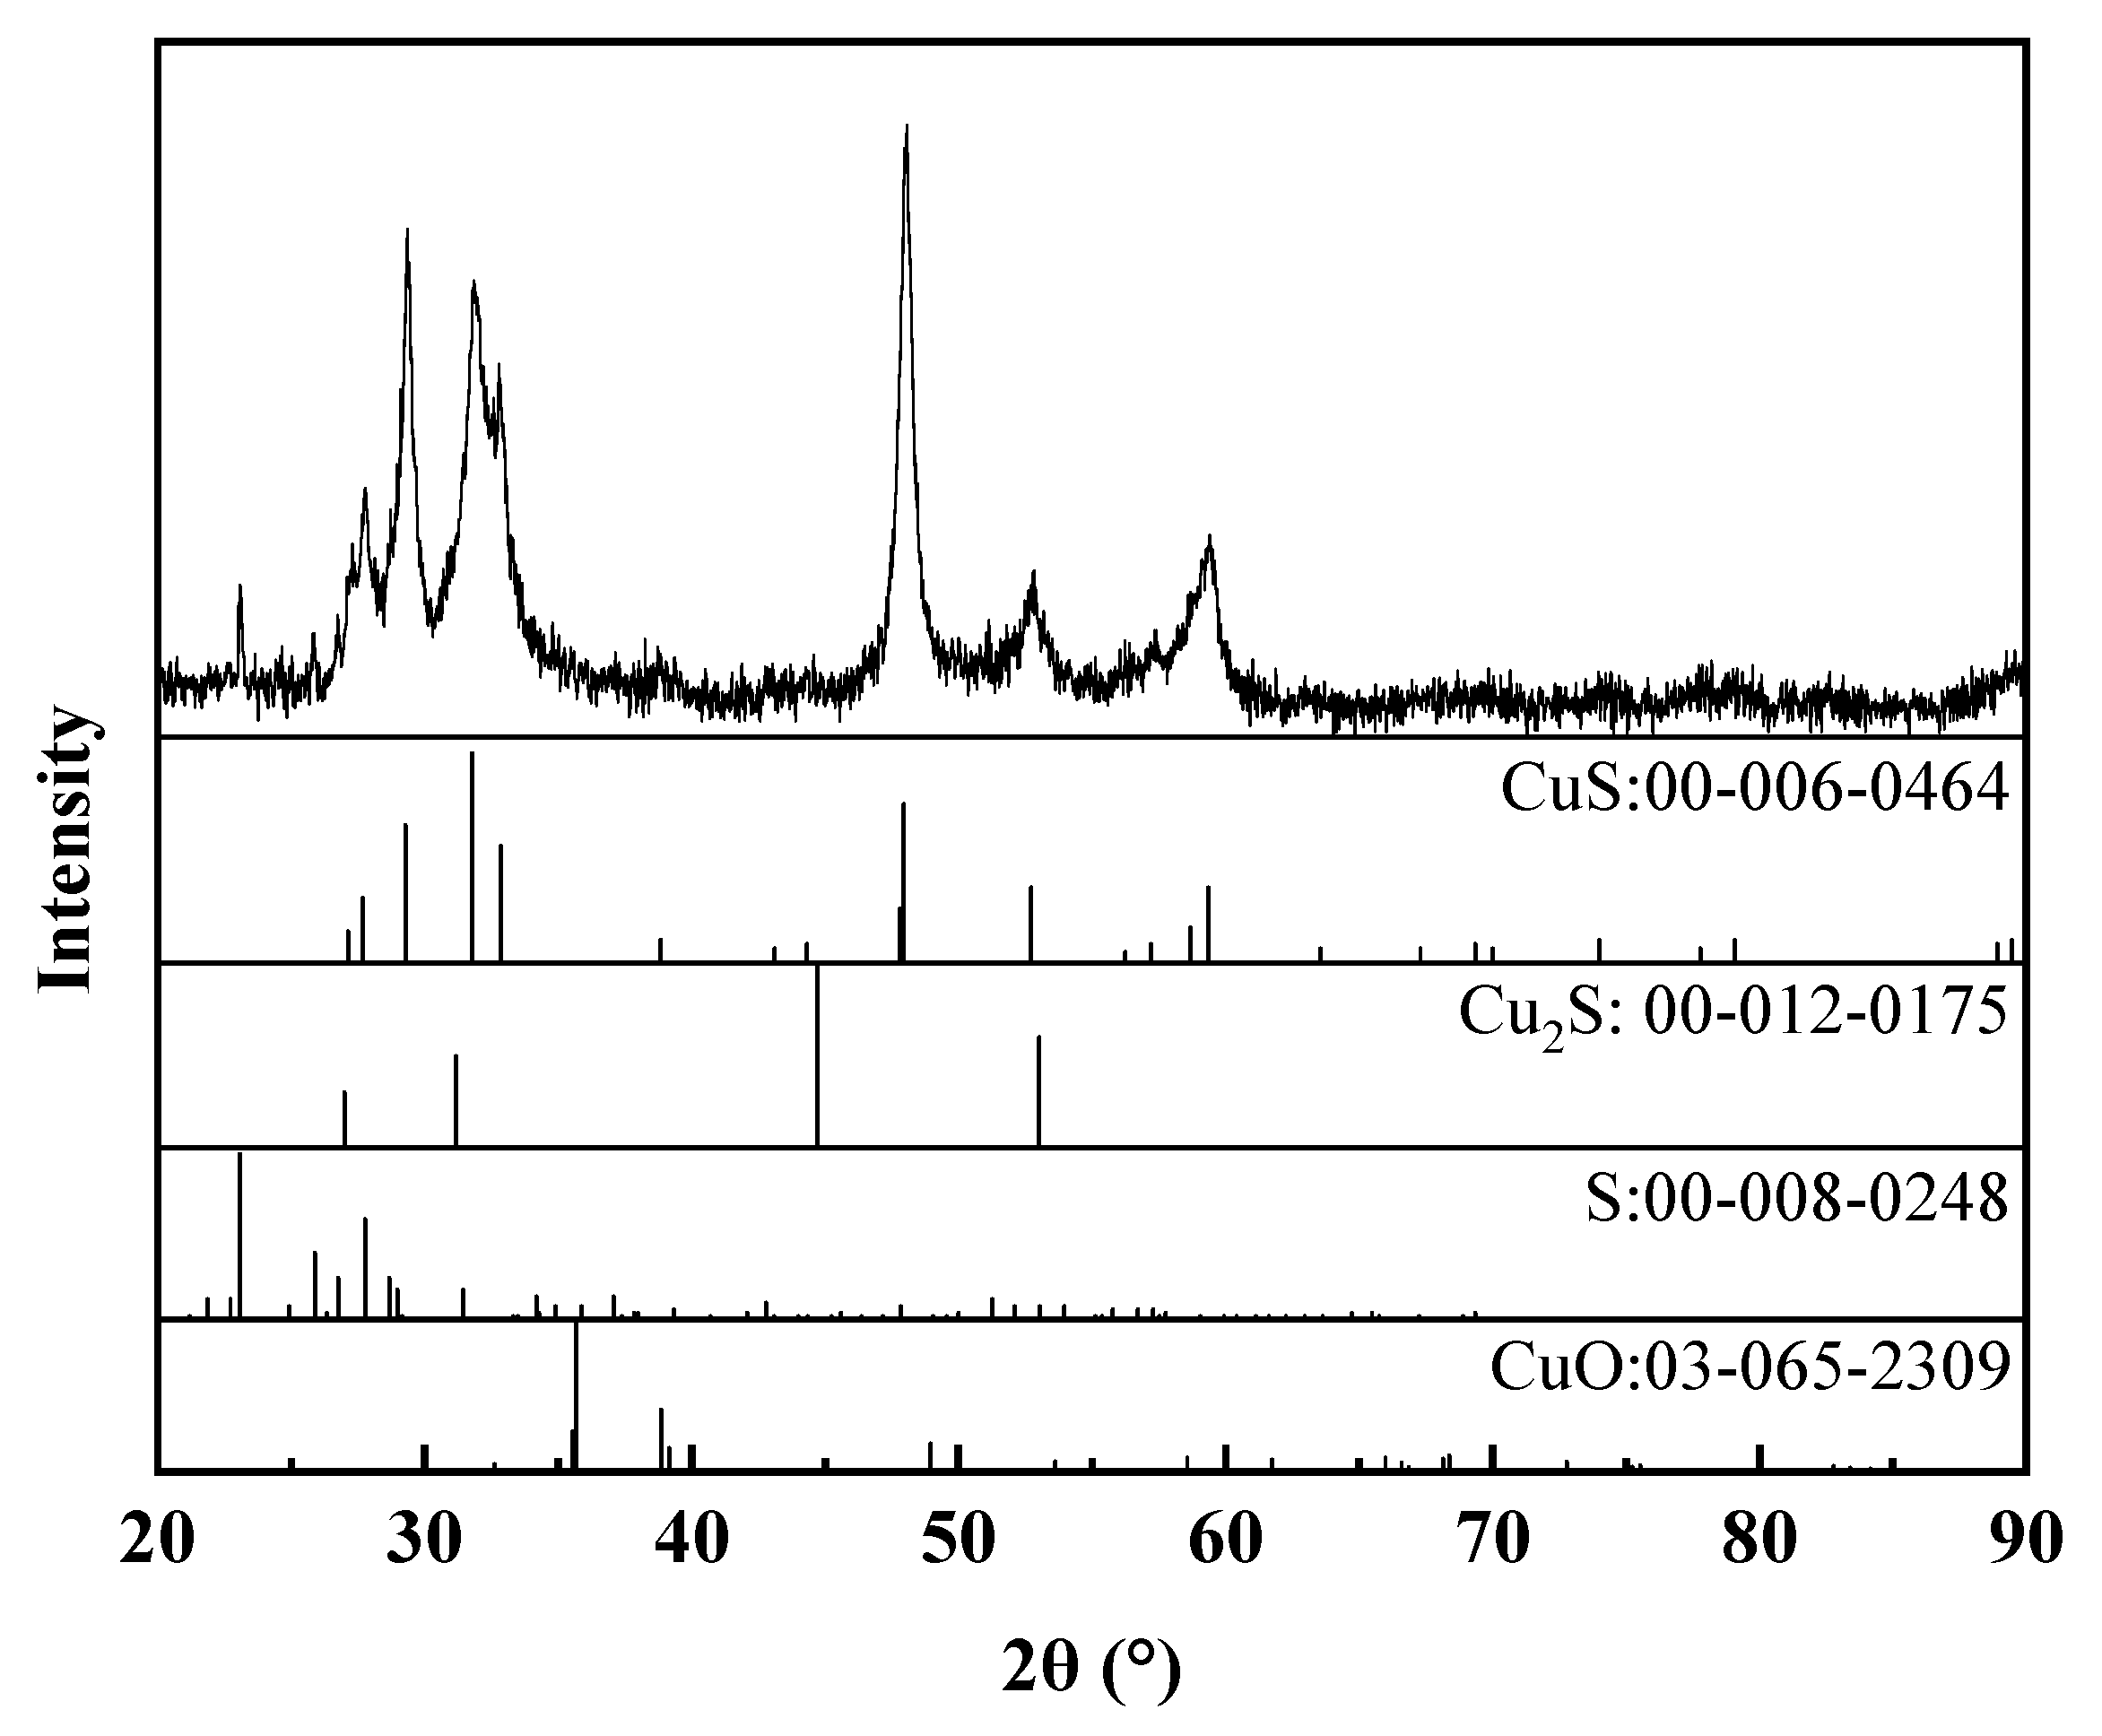
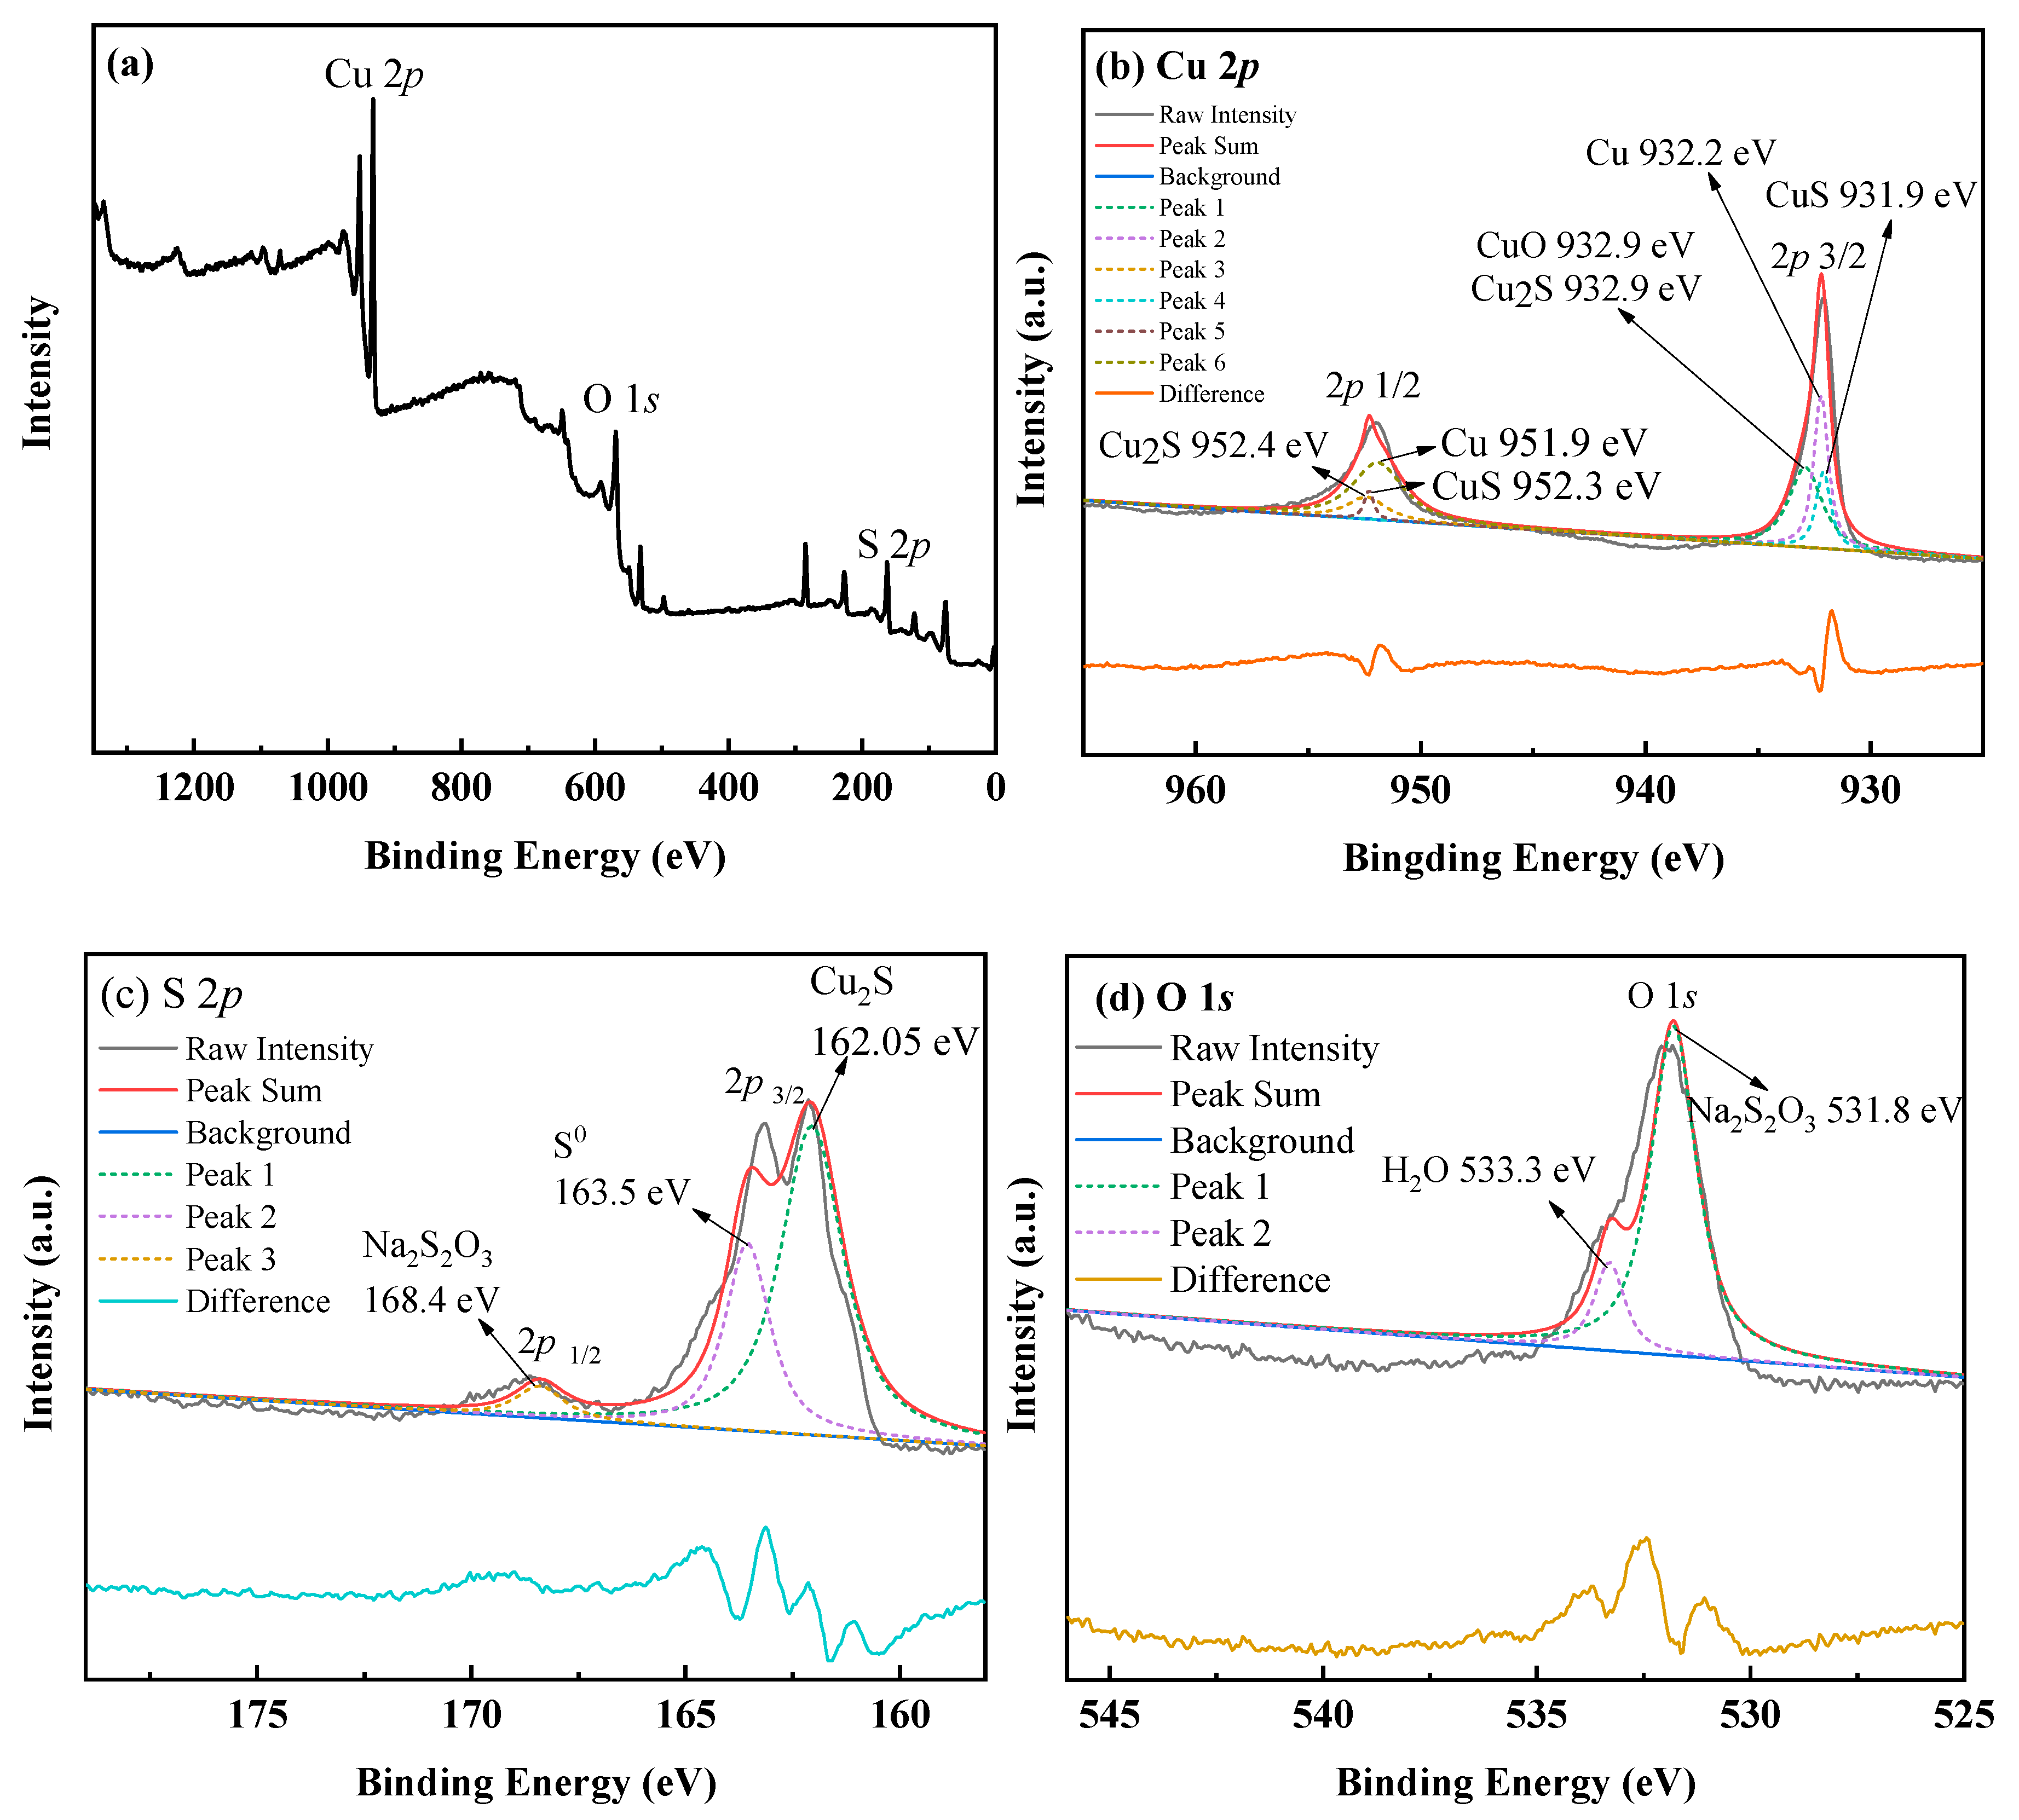
3.2.2. The Characterization of Cu–Thiosulfate Complexes Photoproducts

The XRD analysis results of the photoproducts are shown in Figure 6.
The XRD analysis results of the photoproducts are shown in Figure 6. According to XRD pattern of the photoproducts, there are several peaks lined in the angle of 20°and 90°, respectively. Some of these are in accordance with the phase of cupric sulfide (CuS) (PDF:00-006-0464) and chalcocite (Cu2S) (PDF:00-012-0175), indicating the precipitation occurred mainly as CuS and Cu2S during the photolysis of the copper–thiosulfate complex. Some are in accordance with the phase of cupric oxide (CuO) (PDF:03-065-2309) and sulfur (S0) (PDF:00-008-0248), indicating the secondary products of precipitation occurred as CuO and S0 during the photolysis of the copper–thiosulfate complex.
In order to clarify the valence state of elements, the precipitate was further analyzed by XPS (Figure 7). According to the XPS spectrum, elements of Cu, S, and O were detected on the surface of the photoproducts, according to the XPS survey scan results, as shown in Figure 7a. Figure 7b is high resolution XPS spectra of Cu 2p. It shows two peaks with broad features. It seems that the first peak group (931.9.2 eV, 932.2 eV, and 932.9 eV) corresponds to Cu 2p3/2 and the second peak group (951.9 eV, 952.3 eV, and 952.4 eV) corresponds to Cu 2p1/2. According to the study of the XPS spectra of CuS, CuO, Cu2S, and Cu, the peaks of Cu 2p existed in the bind energy of 931.9.2 eV, 932.2 eV, 932.9 eV, and the bind energy of 951.9 eV, 952.3 eV, 952.4 eV [25,26,27,28,29]. In this study, it can be concluded that silver occur as Cu2S, CuS, CuO, and Cu on the surface of the photoproducts. The deconvoluted XPS S 2p spectrum displayed in Figure 7c shows two peaks in the narrowed bind energy scope. The S 2p peaks occur as doublets, S 2p3/2 and S 2p1/2. Brion [30] reported that the S 2p3/2 energy level of Cu2S is 162.05 eV and Peisertet et al. [20] reported that the S 2p3/2 energy level of S0 is 163.5 eV. Siriwardane et al. [22] reported that the S 2p1/2 energy level of Na2S2O3 is 168.4 eV. The deconvoluted XPS O 1s spectrum displayed in Figure 7d shows two peaks in the narrowed bind energy scope. Nefedov et al. [31] reported that the O 1s energy level of H2O is 533.3 eV and Wagner et al. [32] reported that the O 1s energy level of Na2S2O3 is 531.8 eV. According to the analysis, the composition of the photoproducts occurs mainly as Cu2S, CuS, CuO, Cu and S.

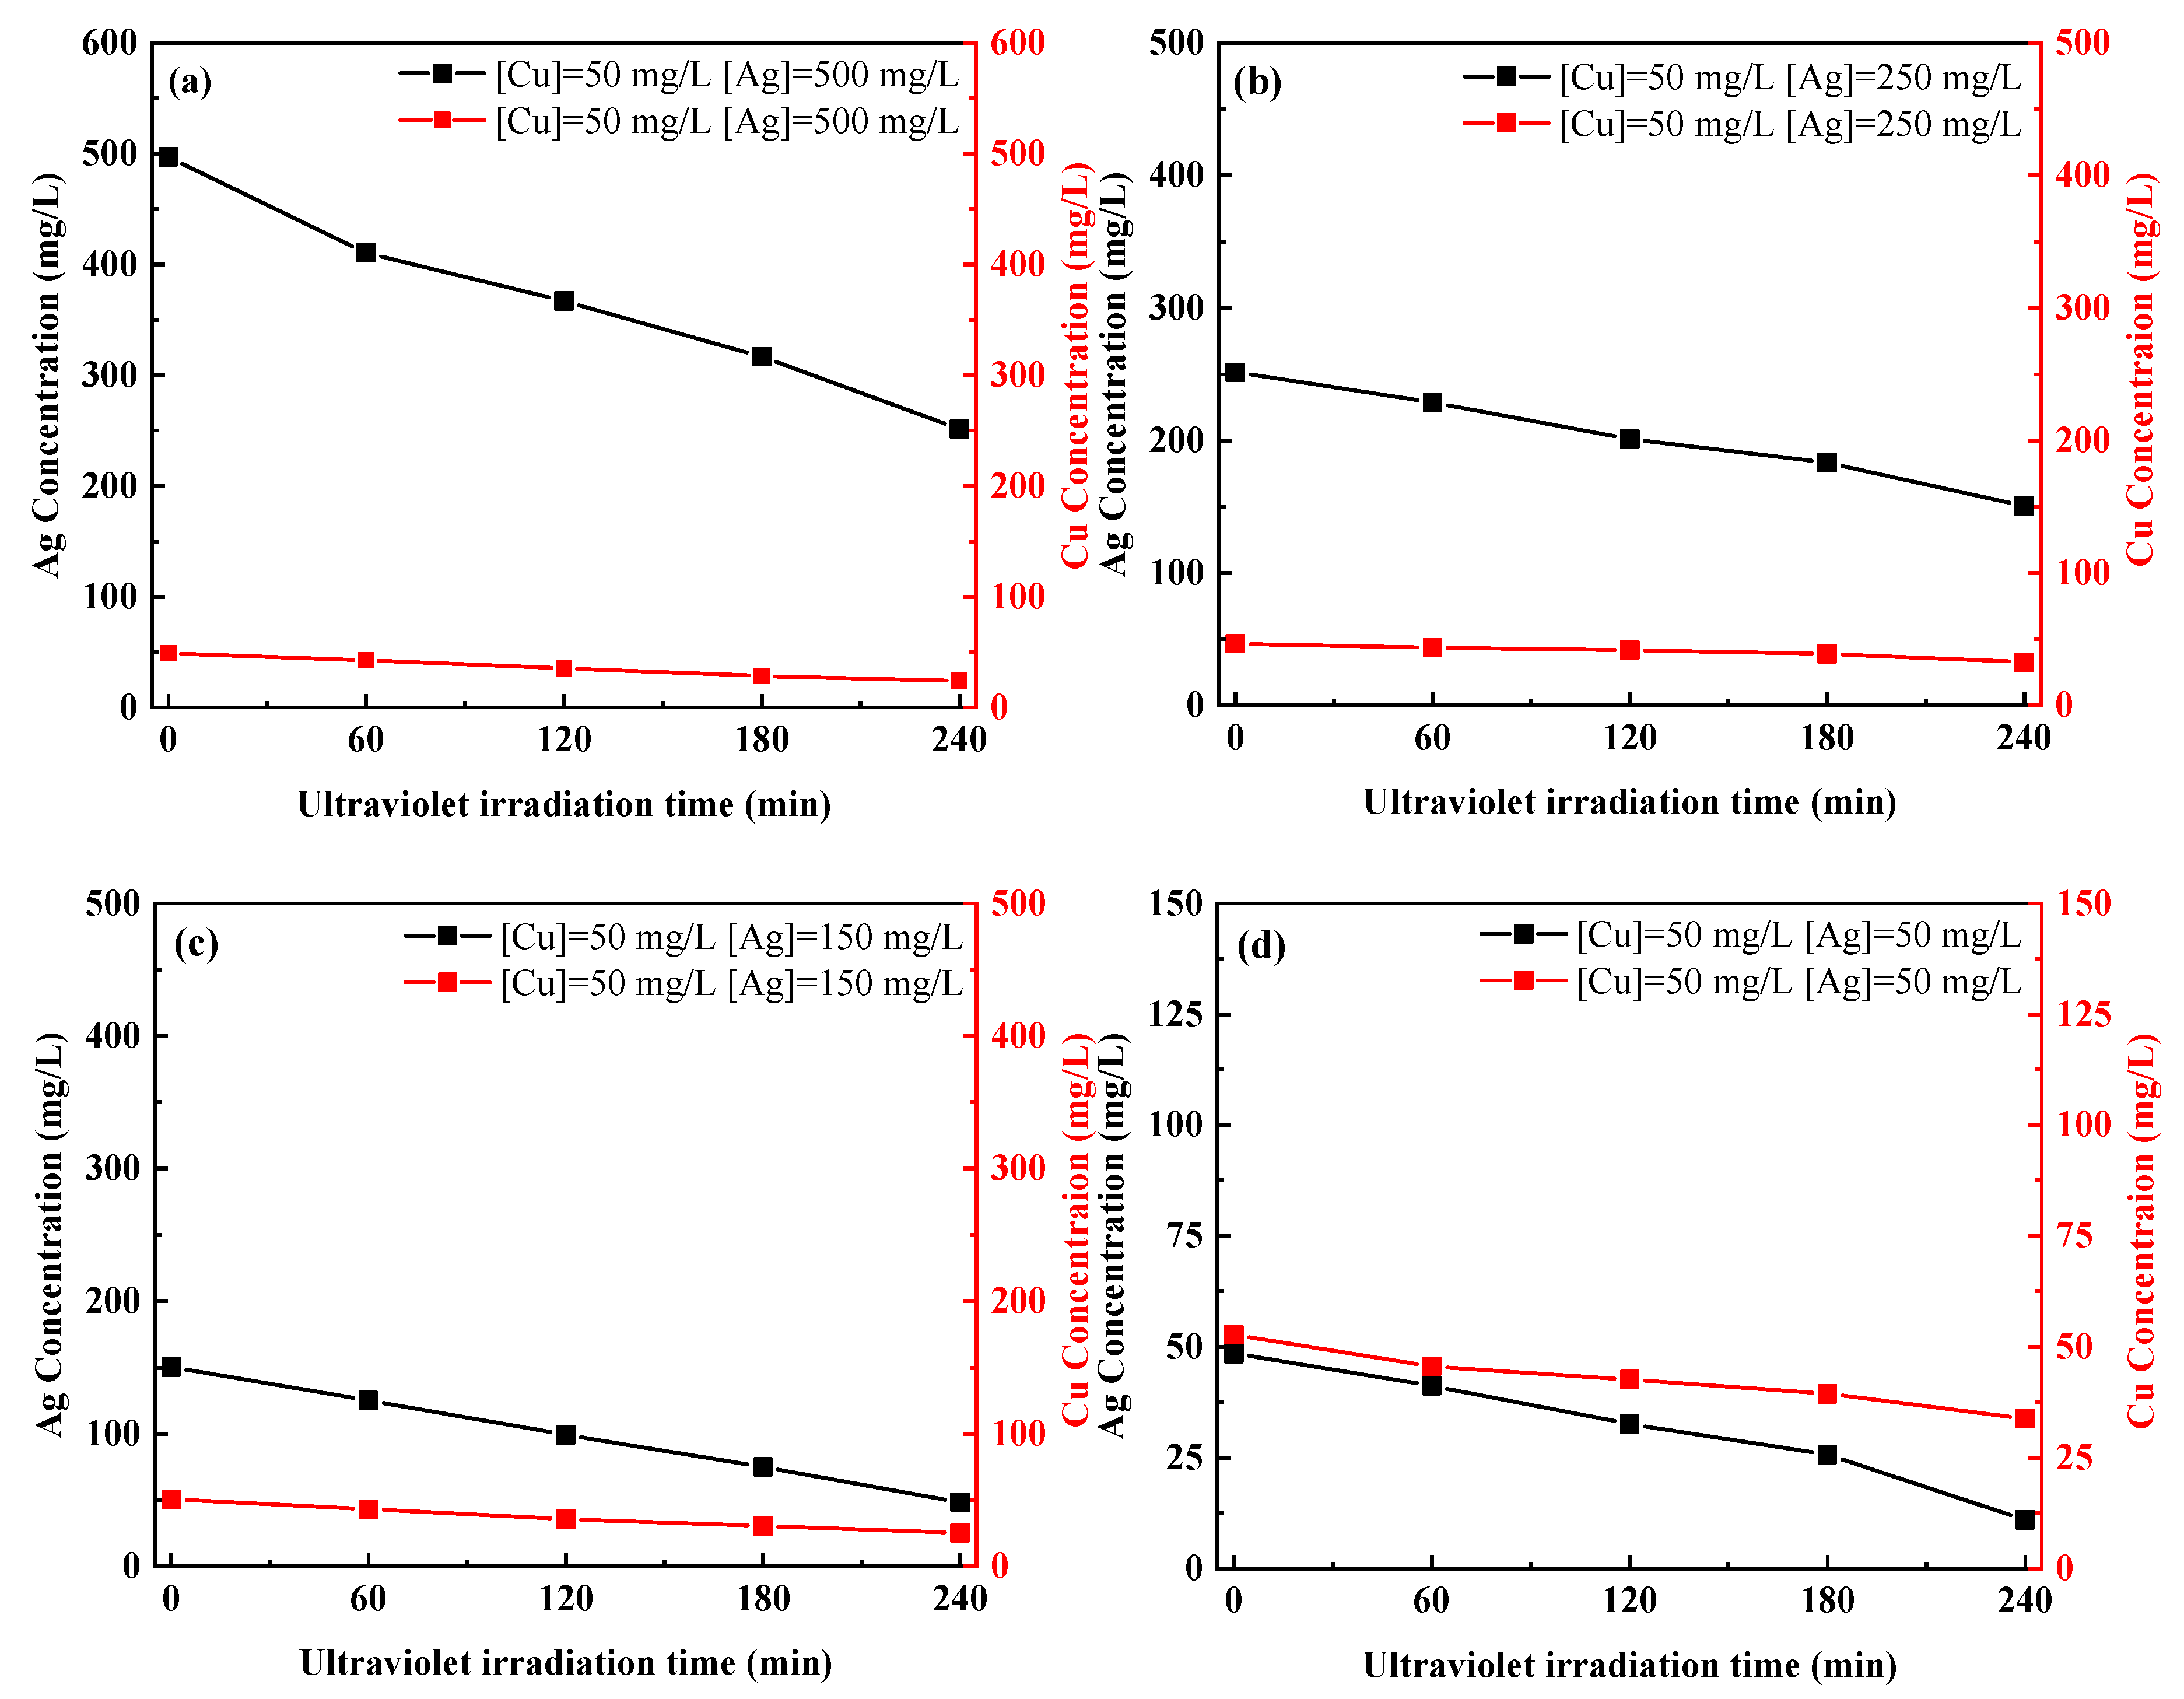
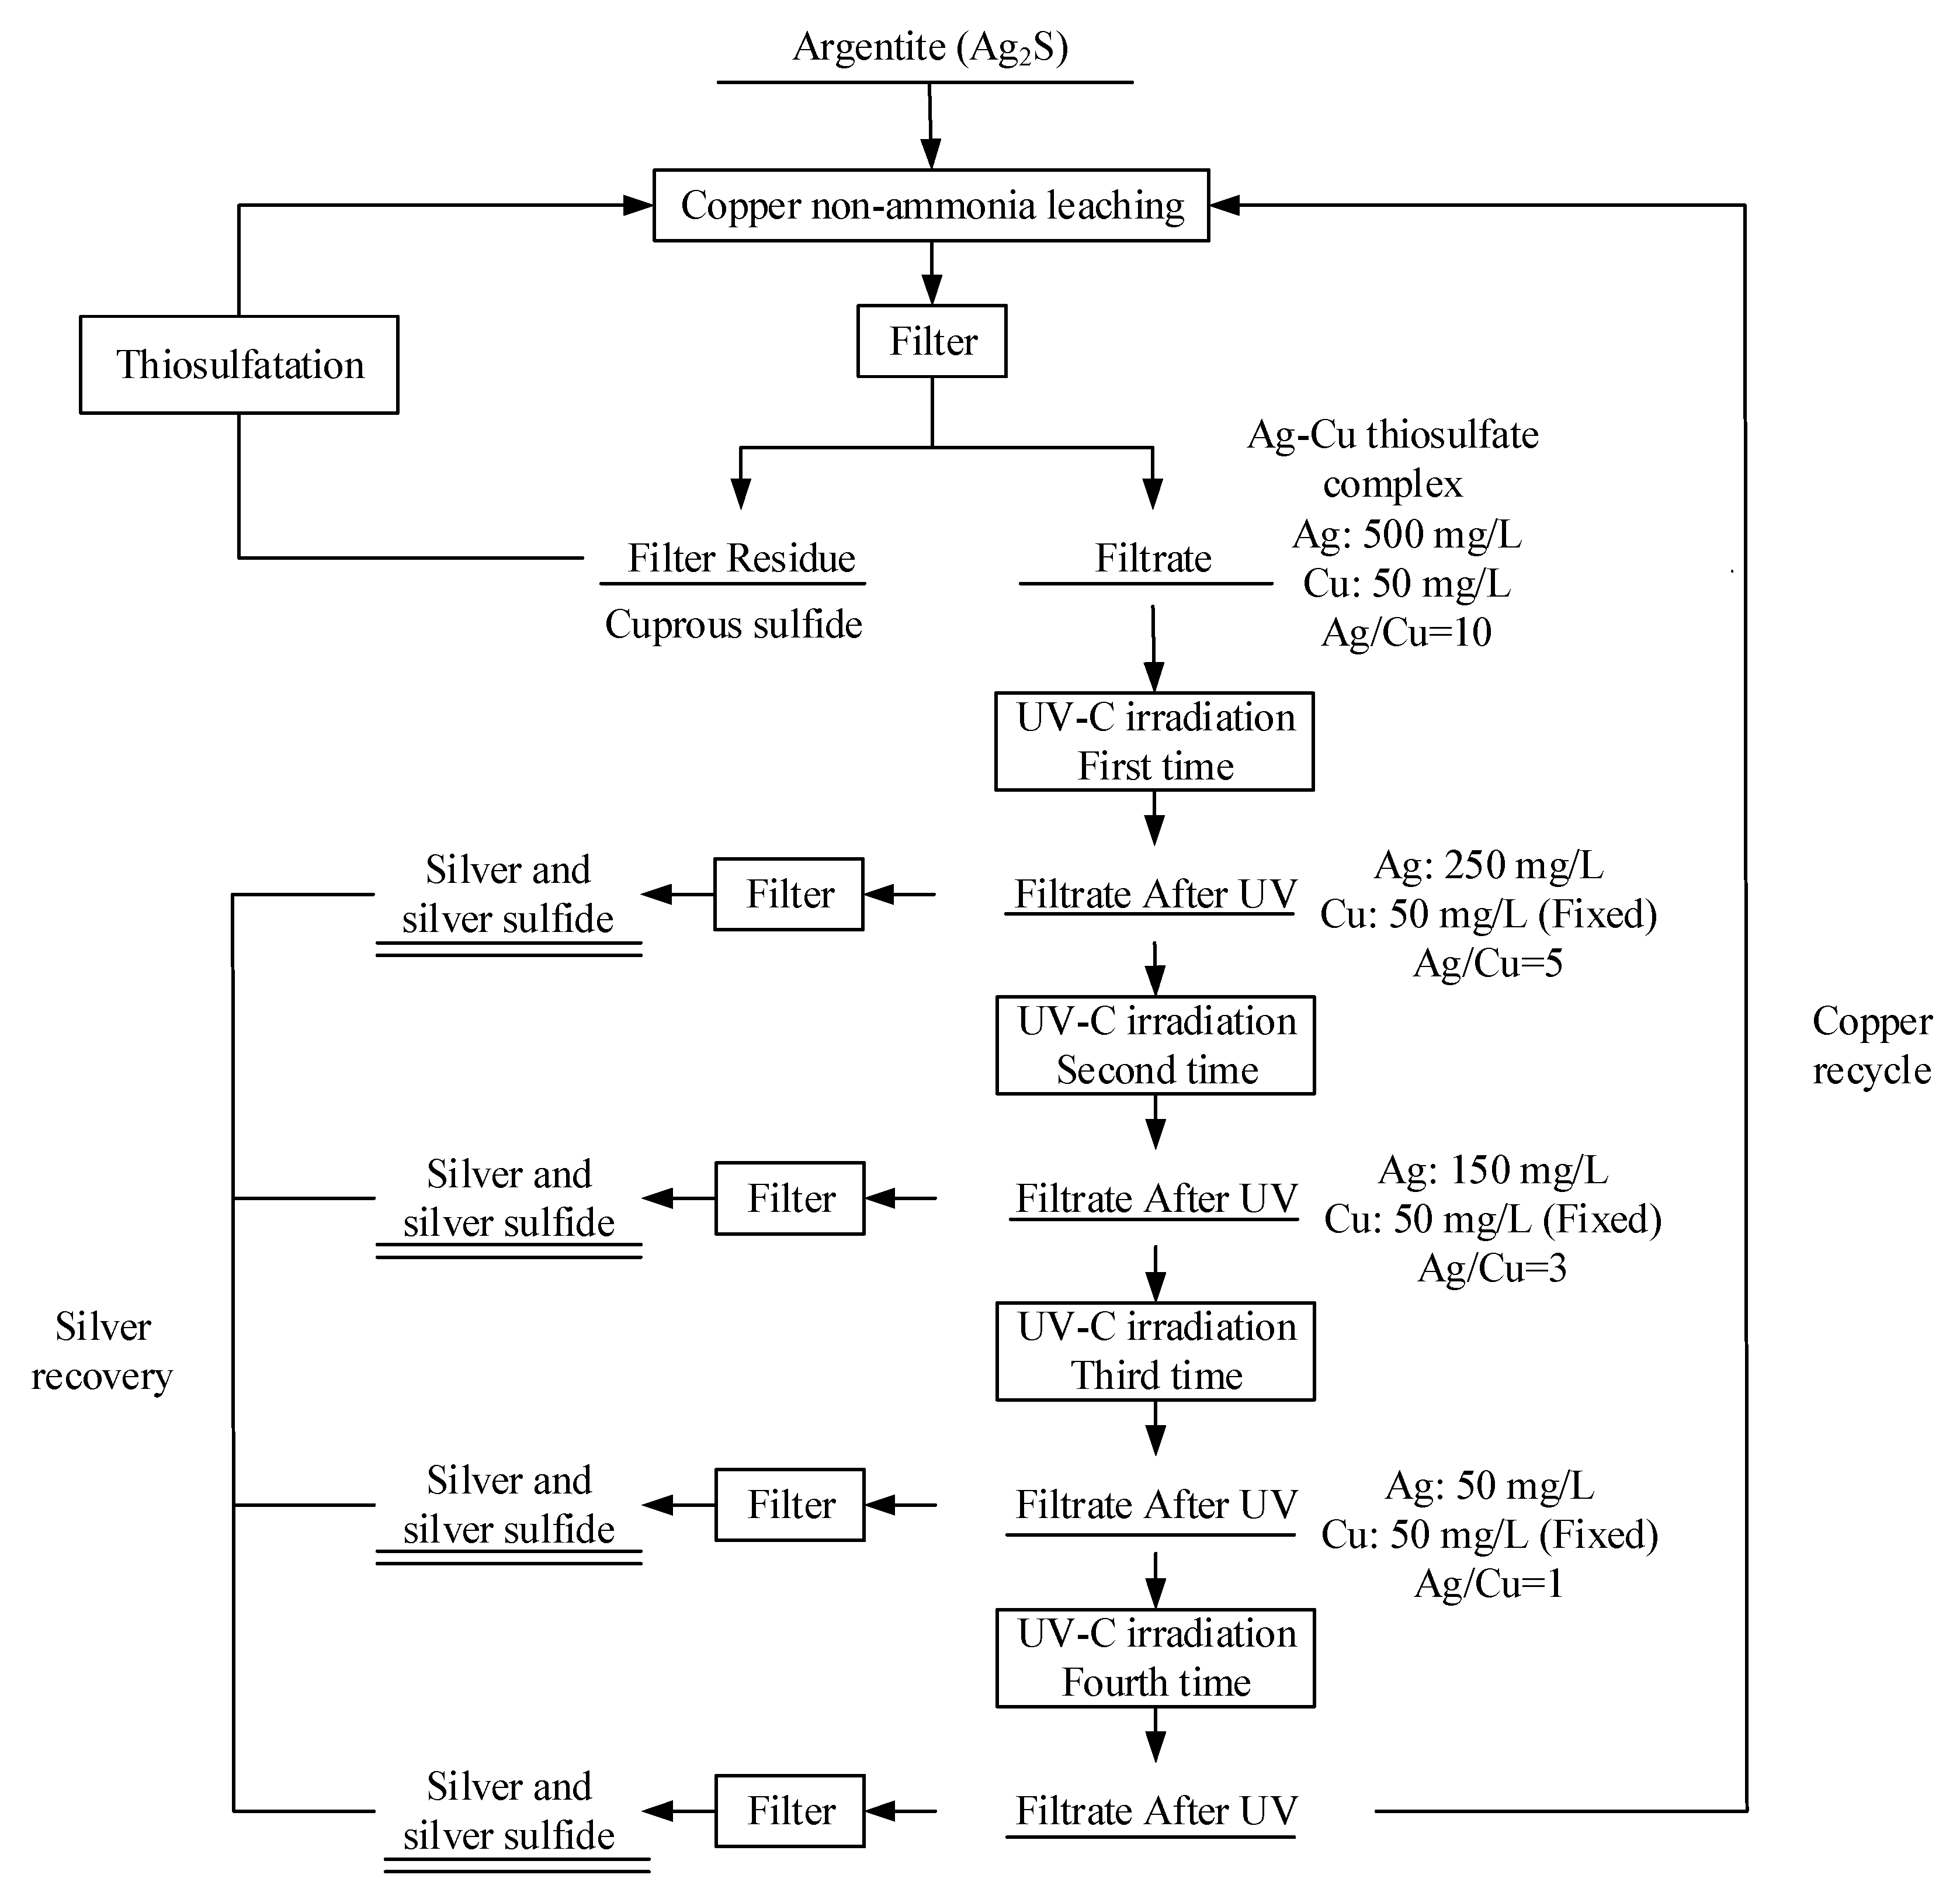
3.3. Separation of Ag and Cu by UV-C Irradiation

The adsorption spectrum result is shown in Figure 8, indicating that the Ag–Cu thiosulfate complex has several strong adsorption peaks between 200 and 300 nm. The highest peak is at wavelength of 254 nm which is in UV-C radiation range (200–280 nm) so UV-C is used as a light source. The Ag and Cu thiosulfate complex has different reaction rates due to the different cation ions. In order to study the boundary conditions of ultraviolet separation, the kinetic problems in mixed solutions are of serious concern. The kinetics of ultraviolet photolysis of Ag–Cu polymetallic thiosulfates can be regarded as an approximation of parallel reactions. One is the photolysis of the Ag–thiosulfate complex, and the other is the photolysis of the Cu–thiosulfate complex. A coefficient f is defined to represent the concentration change of silver and copper ions at t minute(s) under ultraviolet light, and the relevant formulas are shown in Equations (12)–(14).
d C Ag ,   t d t = k Ag C Ag , i
d C Cu ,   t d t = k Cu C Cu , i
f = d C Ag , t d C Cu , t = k Ag k Cu × C Ag , i C Cu , i Δ C Ag , t Δ C Cu , t
where kAg, kCu: the rate constant of silver and copper systems, min−1; CAg,i, CCu,i: the initial concentration of silver and copper, mg/L; ΔCAg,t, ΔCCu,t: the change of silver and copper concentration at t, mg/L;
The separation effect of ultraviolet irradiation depends on separation coefficient f, and the coefficient is related to the reaction rate constant of ultraviolet photolysis of silver and copper thiosulfate complexes, and the initial silver and copper concentrations, respectively. If both the ratio of initial concentration and the ratio of rate constant is 1, the coefficient f is 1 and it is a boundary condition where it is impossible to separate Ag and Cu. If the ratio of initial concentration is 1, the coefficient f equals the ratio of rate constant. According to Table 2 and Table 3, the rate constant kAg and kCu decreases with an increase of silver and copper initial concentrations. The rate constants of copper drops to a low level due to the increase of concentrations or the rate constants of silver climbing to a high level due to the decrease in concentrations, and it is a boundary condition where it is easy to separate Ag and Cu. Between the boundary conditions mentioned previously, coefficient f depends on the initial concentration ratio and the rate constant ratio. In our work, coefficient f is 9.46 at a silver concentration of 500 mg/L and a copper concentration of 50 mg/L, with a silver rate constant of 0.00141 min−1 and a copper rate constant of 0.00149 min−1.
The separation of Ag and Cu from their aqueous thiosulfate complex by UV-C irradiation was studied. The four-step separation of Ag–Cu thiosulfate complexes (Ag: 500 mg/L; Cu: 50 mg/L) was carried out, and the results are shown in Figure 9. After first time separation by UV-C irradiation, the precipitates were filtered by the filtration membrane. The silver and copper concentrations then dropped into 251.45 and 24 mg/L, respectively, and the change concentration ratio of silver to copper was 9.56. It matched the coefficient f (9.46) calculated by rate constants, and the silver recovery ratio was 49.71%, the copper recycle ratio was 48%. At the second separation step, the excessive copper solution was added in the system to increase the copper concentration to 50 mg/L. The copper rate constant is fixed, and the silver rate constant increases so that coefficient f increases at this time. After the second time of separation by UV-C irradiation, the precipitates were filtered by the filtration membrane. The silver and copper concentrations then dropped into 150.5 and 32.6 mg/L, respectively, and the ratio of silver to copper was 5.72. It also matched coefficient f (5.70) calculated by rate constants, and the silver recovery ratio was 39.80%, the copper recycle ratio was 65.20%. Repeat the above process, and after the third time of separation by UV-C irradiation, the precipitates were again filtered by the filtration membrane. The silver and copper concentrations then dropped into 48.5 and 24.5 mg/L, respectively, and the ratio of silver to copper was 3.98. It also matched coefficient f (4.02) calculated by rate constants, and the silver recovery ratio was 67.67%, the copper recycle ratio was 49%. After the fourth time of separation by UV-C irradiation, the precipitates were again filtered by the filtration membrane. The silver and copper concentrations then dropped into 10.93 and 33.8 mg/L, respectively, and the ratio of silver to copper was 2.41. It also matched coefficient f (2.41) calculated by rate constants, and the silver recovery ratio was 78.14%, the copper recycle ratio was 67.60%. The silver component was recovered with the accumulated recovery ratio of 97.81%, and the copper component was recycled with the accumulated recycle ratio of 51.60%.

4. Conclusions

The separation of silver–copper thiosulfate complex solution by ultraviolet irradiation was investigated in this paper. The decomposition of only silver or copper thiosulfate solutions under ultraviolet light was studied, respectively. The results indicate that the silver–thiosulfate complexes decompose with time under UV-C irradiation, and the photoproducts are silver sulfide, elemental silver, elemental sulfur, and sulfate through XRD and XPS analysis. The copper–thiosulfate complexes decompose with time under UV-C irradiation, and the photoproducts are cupric sulfide, cuprous sulfide, cupric oxide, elemental copper, elemental sulfur, and sulfate through XRD and XPS analysis. The pH decreases with time due to the formation of sulfate acid in both silver and copper systems. The decomposition kinetics satisfy the first order reaction rate equation, and the decomposition rate constant decreases with the increase of concentration. Based on the parallel first-order reaction kinetics, separation coefficient f was defined to study the separation boundary conditions. The silver–copper thiosulfate complexes could be separated by a four-step continuous separation method with the accumulated recovery ratio of 97.81%, and the copper component is recycled back to the leaching system with the accumulated recycle ratio of 51.60%. The results show that the separation can be carried out effectively at this concentration (500 mg/L of Ag, and 50 mg/L of Cu).

Author Contributions

Conceptualization, C.H.; methodology, C.H.; formal analysis: C.H.; writing-original draft preparation, C.H.; writing-review and editing, G.W. and C.H.; Supervision: G.W.; Investigation, M.Z.; data curation, M.Z. and C.S.

Funding

This research was funded by Doctoral Research Fund of Henan University of Science and Technology, grant number: 4002-13480089, and The Student Research Training Program of Henan University of Science and Technology, grant number: 2018048. The APC was funded by Research Center for High Purity Materials, School of Materials Science and Engineering, Henan University of Science and Technology.

Acknowledgments

This work was supported by the Doctoral Research Fund of Henan University of Science and Technology and The Student Research Training Program of Henan University of Science and Technology.

Conflicts of Interest

The authors declare no conflict of interest.

References

  1. Briones, R.; Lapidus, G.T. The leaching of silver sulfide with the thiosulfate–ammonia–cupric ion system. Hydrometallurgy 1998, 50, 243–260. [Google Scholar] [CrossRef]
  2. Matti, L.; Arto, L.; Ilkka, T. Ammoniacal thiosulfate leaching of pressure oxidized sulfide gold concentrate with low reagent consumption. Hydrometallurgy 2015, 152, 120–128. [Google Scholar]
  3. Feng, D.; Deventer, J. Effect of thiosulphate salts on ammoniacal thiosulphate leaching of gold. Hydrometallurgy 2010, 105, 120–126. [Google Scholar] [CrossRef]
  4. Aylmore, M.; Muir, D. Thiosulfate leaching of gold-A review. Miner. Eng. 2001, 14, 135–174. [Google Scholar] [CrossRef]
  5. Grosse, A.C.; Dicinoski, G.W.; Shaw, M.J.; Haddad, P.R. Leaching and recovery of gold using ammoniacal thiosulfate leach liquors (a review). Hydrometallurgy 2003, 69, 1–21. [Google Scholar] [CrossRef]
  6. Arima, H.; Fujita, T.; Yen, W. Using nickel as a catalyst in-ammonium thiosulfate leaching for gold extraction. Mater. Trans. 2004, 45, 516–526. [Google Scholar] [CrossRef]
  7. Chandra, I.; Jeffrey, M. A fundamental study of ferric oxalate for dissolving gold in thiosulfate solutions. Hydrometallurgy 2005, 77, 191–201. [Google Scholar] [CrossRef]
  8. Deutsch, J.L.; Dreisinger, D.B. Silver sulfide leaching with thiosulfate in the presence of additives Part II: Ferric complexes and the application to silver sulfide ore. Hydrometallurgy 2013, 137, 165–172. [Google Scholar] [CrossRef]
  9. Cui, Y.; Tong, X.; Lopez-Valdivieso, A. Silver sulfide leaching with a copper-thiosulfate solution in the absence of ammonia. Rare Met. 2011, 30, 105. [Google Scholar] [CrossRef]
  10. Deng, Z.; Oraby, E.A.; Eksteen, J.J. The sulfide precipitation behaviour of Cu and Au from their aqueous alkaline glycinate and cyanide complexes. Sep. Purif. Technol. 2019, 218, 181–190. [Google Scholar] [CrossRef]
  11. Xing, D.W.; Lee, M.S.; Senanayake, G. Recovery of metals from chloride leach solutions of anode slimes by solvent extraction. Part II: Recovery of silver and copper with LIX 63 and Alamine 336. Hydrometallurgy 2018, 180, 49–57. [Google Scholar] [CrossRef]
  12. Kononova, O.N.; Shatnykh, K.A.; Prikhod’Ko, K.V.; Kashirin, D.M. Ion-Exchange Recovery of Gold(I) and Silver(I) from Thiosulfate Solutions. Russ. J. Phys. Chem. A 2009, 83, 2340–2345. [Google Scholar] [CrossRef]
  13. Norasikin, O.; Hanapi, M.; Masahiro, G. Separation of silver from photographic wastes by emulsion liquid membrane system. J. Membr. Sci. 2006, 282, 171–177. [Google Scholar]
  14. Egorov, N.B. Investigation of Lead Thiosulfate Photolysis in Aqueous Solutions. High. Energy Chem. 2013, 48, 5. [Google Scholar] [CrossRef]
  15. Egorov, N.B.; Eremin, L.P.; Larionov, A.M.; Usov, V.F.; Tsepenko, E.A.; D’yachenko, A.S. Products of Photolysis of Cadmium Thiosulfate Aquepus Solutions. High. Energy Chem. 2008, 42, 119–122. [Google Scholar] [CrossRef]
  16. Wei, W.; Chao, H.; Feng, X. Efficient mercury recovery from mercuric-thiosulfate solutions by ultraviolet photolysis. Environ. Chem. Lett. 2018, 16, 1049–1054. [Google Scholar]
  17. Liu, Y.; Jordan, R.G.; Qiu, S.L. Electronic structures of ordered Ag-Mg alloys. Phys. Rev. B Condens. Matter. 1994, 49, 4478–4484. [Google Scholar] [CrossRef]
  18. Kaushik, V.K. XPS core level spectra and Auger parameters for some silver compounds. J. Electron. Spectrosc. 1991, 56, 273–277. [Google Scholar] [CrossRef]
  19. Yu, X.R.; Liu, F.; Wang, Z.Y.; Chen, Y. Auger parameters for sulfur-containing compounds using a mixed aluminum-silver excitation source. J. Electron. Spectrosc. 1990, 50, 159–166. [Google Scholar] [CrossRef]
  20. Peisert, H.; Chassé, T.; Streubel, P.; Meisel, A.; Szargan, R. Relaxation energies in XPS and XAES of solid sulfur compounds. J. Electron. Spectrosc. 1994, 68, 321–328. [Google Scholar] [CrossRef]
  21. Manocha, A.S.; Park, R.L. Flotation related ESCA studies on PbS surfaces. Appl. Surf. Sci. 1977, 1, 129–141. [Google Scholar] [CrossRef]
  22. Siriwardane, R.V.; Cook, J.M. Interactions of SO2 with sodium deposited on CaO. J. Colloid Interface Sci. 1986, 114, 525–535. [Google Scholar] [CrossRef]
  23. Schulze, P.D.; Shaffer, S.L.; Hance, R.L.; Utley, D.L. Adsorption of water on rhenium studied by XPS. J. Vac. Sci. Technol. A 1983, 1, 97. [Google Scholar] [CrossRef]
  24. Wagner, C.D.; Zatko, D.A.; Raymond, R.H. Use of the oxygen KLL Auger lines in identification of surface chemical states by electron spectroscopy for chemical analysis. Anal. Chem. 1980, 52, 1445. [Google Scholar] [CrossRef]
  25. Perry, D.; Taylor, J. X-ray photoelectron and Auger spectroscopic studies of Cu2S and CuS. J. Mater. Sci. Lett. 1986, 5, 384–386. [Google Scholar] [CrossRef]
  26. Strohmeier, B.; Levden, D.; Field, R.; Hercules, D. Surface spectroscopic characterization of CuAl2O3 catalysts. J. Catal. 1985, 94, 514–530. [Google Scholar] [CrossRef]
  27. Hussain, Z.; Salim, M.A.; Khan, M.A.; Khawaja, E.E. X-ray photoelectron and auger spectroscopy study of copper-sodium-germanate glasses. J. Non-Cryst. Solids 1989, 110, 44–52. [Google Scholar] [CrossRef]
  28. Nakai, I.; Sugitani, Y.; Nagashima, K.; Niwa, Y. X-ray photoelectron spectroscopic study of copper minerals. J. Inorg. Nucl. Chem. 1978, 40, 789–791. [Google Scholar] [CrossRef]
  29. Schoen, G. High resolution Auger electron spectroscopy of metallic copper. J. Electron. Spectrosc. 1972, 1, 377–387. [Google Scholar] [CrossRef]
  30. Brion, D. Etude par spectroscopie de photoelectrons de la degradation superficielle de FeS2, CuFeS2, ZnS et PbS a l’air et dans l’eau. Appl. Surf. Sci. 1980, 5, 133–152. [Google Scholar] [CrossRef]
  31. Nefedov, V.I.; Gati, D.; Dzhurinskii, B.F.; Sergushin, N.P.; Salyn, Y.V. X-Ray electron spectrum study of oxides. Zh. Neorgan. Khim. 1975, 20, 2307. (In Russian) [Google Scholar]
  32. Wagner, C.D.; Zatko, D.A.; Raymond, R.H. Surface studies of the interaction of cesium hydroxide vapor with 304 stainless steel. Oxid. Met. 1987, 28, 33–59. [Google Scholar]
Figure 1. The flowchart of separation process.
Metals 09 01178 g001
Figure 2. Effect of silver concentration on the photolysis of a silver–thiosulfate complex by UV-C (a) Ag recovery vs. time; (b) variation for solution pH; (c) Ag concentration vs. time; (d) plot of ln (Ci/Ct) vs. time; [S2O32−] = 0.1 mol/L, 298 K, uncontrolled pH.
Metals 09 01178 g002
Figure 3. XRD patterns of photoproducts ([Ag] = 500 mg/L, [S2O32−] = 0.1 mol/L, 298 K, uncontrolled pH).
Metals 09 01178 g003
Figure 4. Deconvoluted XPS spectra for photoproducts (a) survey spectrum; (b) Ag 3d spectrum; (c) S 2p spectrum; (d) O 1s spectrum ([Ag] = 500 mg/L, [S2O32−] = 0.1 mol/L, 298 K, uncontrolled pH).
Metals 09 01178 g004aMetals 09 01178 g004b
Figure 5. Effect of copper concentration on the photolysis of a silver–thiosulfate complex by UV-C (a) Cu recovery vs. time; (b) variation for solution pH; (c) Cu concentration vs. time; (d) plot of ln (Ci/Ct) vs. time; [S2O32−] = 0.1 mol/L, 298 K, uncontrolled pH.
Metals 09 01178 g005
Figure 6. XRD patterns of photoproducts ([Cu] = 50 mg/L, [S2O32−] = 0.1 mol/L, 298 K, uncontrolled pH).
Metals 09 01178 g006
Figure 7. Deconvoluted XPS spectra for the photoproducts (a) survey spectrum; (b) Cu 2p spectrum; (c) S 2p spectrum; (d) O 1s spectrum ([Cu] = 50 mg/L, [S2O32−] = 0.1 mol/L, 298 K, uncontrolled pH).
Metals 09 01178 g007
Figure 8. The adsorption spectrum of Ag–Cu thiosulfate complexes ([Ag] = 500 mg/L, [Cu] = 50 mg/L, [S2O32−] = 0.1 mol/L, 298 K, uncontrolled pH).
Metals 09 01178 g008
Figure 9. The separation of Ag and Cu from their aqueous thiosulfate complex. (a) First time: [Ag] = 500 mg/L, [Cu] = 50 mg/L, [S2O32−] = 0.1 mol/L, 298 K, uncontrolled pH; (b) second time: [Ag] = 250 mg/L, [Cu] = 50 mg/L, [S2O32−] = 0.1 mol/L, 298 K, uncontrolled pH; (c) third time: [Ag] = 150 mg/L, [Cu] = 50 mg/L, [S2O32−] = 0.1 mol/L, 298 K, uncontrolled pH; (d) fourth time: [Ag] = 50 mg/L, [Cu] = 50 mg/L, [S2O32−] = 0.1 mol/L, 298 K, uncontrolled pH.
Metals 09 01178 g009
Table 1. The advantages and disadvantages of different traditional methods.
MethodsResearch TargetResultsAdvantagesDisadvantagesRef.
Solvent extraction
(extractant: LIX 63 and Alamine 336; stripping agent: HCl)
Chloride leach solution of anode slimesAbove 99% of Cu(II) and most of Ag(I) extractedHighly selective and easy to industrializeLimited to cation system, needs stripping[11]
Ion exchange removal (ion exchange synthesized by Purolite UK)Thiosulfate complex solutionPurolite A530 has the best properties towards Ag and AuWith regeneration capacity and simple deviceLimited to purified exchange capacity[12]
Emulsion liquid membrane system (Cyanex 302)Liquid photographic wasteAlmost complete recovery of silverHigh selectivity, simultaneous extraction and separationLiquid membrane instability[13]
Table 2. The rate constant of photolysis of a silver–thiosulfate complex by UV-C at different factors.
Silver Concentration/mg/Lk/min−1Goodness of Fit
1000.002100.99305
3000.001760.99864
5000.001410.99679
Table 3. The rate constant of photolysis of a copper–thiosulfate complex by UV-C at different factors.
Copper Concentration/mg/Lk/min−1Goodness of Fit
500.001490.985
750.001300.997
1000.001010.986

