Abstract
The effect of seawater ions presents a great challenge to theories about mechanisms of pyrite oxidation, collector adsorption, and surface reactions. As the use of seawater is key to the sustainability of the mining industry in regions without fresh water, there is a need to study the surfaces of minerals and products that are formed in the presence of seawater salts. In this study, atomic force microscopy (AFM) was used to analyze the topography of pyrite surfaces subjected to treatments, including oxidation and exposure to xanthate and solutions of seawater salts and xanthate, at pH 8.5. Topographic details were related to surface products. The results showed that xanthate was adsorbed without hindrance on oxide-free pyrite which validated one well-known model. The results also showed that pyrite oxidized forming a structure of interconnected pillars and that xanthate was adsorbed on the top and skirt of these pillars; the experimental evidence on the increase in the height and width of these pillars validated another well-known model. In the presence of seawater salts, the cations covered the surface of the pyrite, suppressing collector adsorption regardless of the dose. The results are expected to help in decisions about the flotation of sulfide minerals in water with limited metallurgical quality.
1. Introduction
Layers of oxides and hydroxides that develop on the surface of metal sulfides drastically limit the recovery and selectivity of these minerals by flotation. Collector molecules are used to restore the hydrophobicity of valuable sulfide particles which is key to the selective separation of these particles from gangue. The complexity of these processes, very well established in both plants and laboratories, is a recurring theme in the literature [1,2,3,4,5,6,7,8,9,10,11,12]. The earliest theories of xanthate adsorption on pyrite surfaces involved the formation of any of the following four species: adsorbed xanthate, metal xanthate, elemental sulfur and/or polysulfide, and dixanthogen, each contributing to the hydrophobicity of the surface (for reviews, see Smart et al. [13,14]). A refined and more recent theory by López Valdivieso et al. [10] involved adsorption of xanthate at specific non-oxidized surface sites of pyrite, anodic oxidation of xanthate adsorbed ions to dixanthogen, and a cathodic reaction at oxidized surface sites where ferric hydroxide is reduced to Fe2+ ions. According to the same authors, the resulting Fe2+ ions can be hydrolyzed and/or oxidized to Fe3+ species depending on conditions. In parallel, Mermillod-Blondin et al. [9] presented an alternative theory in which xanthate is adsorbed as a mixture of iron–xanthate complex and dixanthogen at pillar structures of oxidized species, such as iron hydroxides and iron oxyhydroxides, on the pyrite surface. In highly oxidized pyrite, likely both theories apply. Advances in the understanding of these mechanisms and the characterization of products generated on the surface of sulfide minerals during conditioning and flotation have been assisted by surface sensitive techniques such as X-ray photoelectron spectroscopy (XPS/ESCA), scanning tunneling microscopy (STM), atomic force microscopy (AFM), scanning electron microscopy (SEM), time-of-flight secondary ion mass spectrometry (ToF-SIMS) [15,16,17,18,19,20,21]. Although the complexities of sulfide mineral flotation are not fully understood, the sustainability of the mining industry poses a new challenge, particularly for mining in desert regions, that is, the use of seawater, directly or partially desalinated [22,23,24,25,26]. The new complexities that must be addressed include the effect of saltwater cations on the surface of the pyrite, the association of cations with collector molecules, and the adsorption of collector on pyrite carpeted by cations. Recently, Paredes et al. [27] studied the effect of alkali metal ions on the zeta potential of pyrite at different salt concentrations, as well as the effect on the potential of the addition of potassium amyl xanthate to a previously conditioned pyrite solution. In this study, contact mode atomic force microscopy (AFM) is used to analyze the topography of pyrite surfaces subjected to treatments including oxidation and exposure to xanthate and solutions of seawater salts and xanthate at a pH typical of seawater.
2. Materials and Methods
High-grade pyrite (Ward’s Science) from a Peruvian mine was used. X-ray diffraction analysis showed that pyrite was the only mineralogical phase present in the sample (>98%). Fluorescence spectroscopy analysis indicated a 54.2% S and 44.3% Fe (wt. %) with 1.5% impurities (0.06% Mg, 0.24% Al2O3, 0.24% SiO2, 0.07% P, 0.4% Ca, 0.21% Cu, 0.08% Zn, 0.15% As). No attempt was made to improve the original cube faces of the pyrite by grinding and polishing. The surfaces resulting from fracture were seldom smooth but always parallel to {100}. The pyrite wafers were cut square with a characteristic size of a couple of centimeters. The surfaces of the wafers were polished with 1 μm and 0.25 μm diamond pastes in a polishing machine with a new cloth for each grade. The best possible planeness was obtained, and the surface material was removed effectively which was of great importance in this work. The samples were immediately used under nitrogen atmosphere which was permanently renewed or stored in nitrogen in separate sealed bags at low temperature. After use, the pyrite wafers were polished again following the above procedure; this greatly facilitated the availability of surfaces with the same cleavage. Before each experiment, the wafers were thoroughly washed with ultra-pure water and dried for 30 min in nitrogen. In all tests, Milli-Q deoxygenated water (18.2 MΩ/cm) was used both for surface washing and for solution preparation.
Each pyrite wafer was scanned with an atomic force microscope (AFM Dimension 3100, Digital Instruments/Veeco, Santa Barbara, CA, USA) in a nitrogen atmosphere at room temperature. Atomic force microscopy (AFM) is a type of scanning probe microscopy with resolution on the order of fractions of a nanometer. An AFM uses a cantilever with a sharp tip to scan over a sample surface. The up/down motion of the AFM tip as it scans along the surface is monitored through a laser beam reflected off the cantilever. A position-sensitive photo diode (Digital Instruments/Veeco, Santa Barbara, CA, USA) is used to track these changes. In this way, AFM generates accurate (true) topographic maps with atomic resolution vertically and sub-nanometer resolution horizontally. Compared to other techniques such as SEM and TEM, AFM images are obtained without expensive sample preparation. Commercially available silicon nitride AFM probes were used with nominal square-pyramid tip radius with a curvature of 20 nm (Veeco). The scan rate was chosen at 2 Hz at the beginning. Spring constants of individual cantilevers were typically 0.2 N/m. The flat substrates were scanned at various resolutions, ranging from 100 × 100 μm2 to 4 × 4 μm2. Topographic features, including height profile ()—measured over a sampling length (L, the length of the profile)—maximum peak height ( for , maximum valley depth ( for ), average peak height, and average peak width were measured for the highest resolution scan. The use of root mean square roughness (), a classic roughness indicator, was discarded because the resulting pyrite surfaces from the treatments were undulated and scratched and, therefore, could not be distinguished by this indicator. The Digital Instruments Nanoscope IIIa v4.42 software (Santa Barbara, CA, USA) was used for data acquisition and the Gwyddion v2.48 software (Department of Nanometrology, Czech Metrology Institute) was used for image analysis. A complete statistical analysis of the pyrite surfaces was not the objective of this study, first, because the surfaces and AFM analysis were limited in number and, second, because for each surface, the number of peaks was small. A specific objective was to distinguish the heights of peaks corresponding to oxide and oxide with potassium amyl xanthate (PAX) and to distinguish the impact of the presence of cations on such heights.
Tools such as SEM and TEM were not used in this work for a number of reasons. For the purposes of this study, it was required to keep the samples unaltered in a nitrogen atmosphere, avoid preparation protocols that alter the surfaces, and access an exceptionally high (atomic) vertical resolution. X-ray photoelectron spectroscopy (XPS) was not used in this study, because the primary interest was the three-dimensional topographic maps of the pyrite surface, although the chemical speciation of the different elements on the surface of the pyrite is part of further studies.
Pyrite wafers underwent various treatments described below. Non-oxidized pyrite wafers were immersed in PAX (ORICA) solutions in concentrations of 10−4 and 10−3 M for 10 min and under constant stirring. The PAX was previously purified by dilution in acetone and then precipitation with dimethyl ether. The resulting surfaces were washed with ultra-pure water, dried for 30 min, blown with an extremely soft stream of nitrogen, and then scanned with AFM to determine topographic parameters. Other wafers were intentionally oxidized in a controlled and reproducible manner. As an oxidizing agent, hydrogen peroxide (30% v/v) was used, which was sprayed onto the surface with an atomizer and then allowed to oxidize for 300 s. The reaction was stopped by abundant washing with ultra-pure water, left 30 min to dry, blown with nitrogen, and then the surfaces were scanned with AFM. Alternatively, some wafers with controlled oxidation were immersed in saltwater solutions at pH 8.5 for 5 min and, subsequently, in PAX solutions at the same pH and with constant stirring for 10 min. After washing, drying, and blowing, the wafers were characterized by AFM. Analytical grade salts (i.e., NaCl, CaCl2, and MgCl2 (Merck)) were used at concentrations of 0.01 and 0.5 M. The PAX was used at concentrations of 10−4 and 10−3 M. The pH was adjusted with a 0.5 M NaOH solution with a 10 μL micro pipette. It is important to reiterate that the atmosphere was nitrogen at all times.
3. Results and Discussion
Figure 1 shows the typical surfaces used in the AFM analysis. The figure shows the difference between polishing with 1 micron diamond paste and polishing with 0.25 micron paste. The surfaces were clearly wavy and scratched, but this did not prevent recognizing the baseline that corresponded to the surface of the polished pyrite free of oxide and exogenous particles. The heights of the peaks were considered from this baseline. The depth of valleys with respect to the baseline was of no interest in this study. For image analysis, the free access program Gwyddion v2.48 was used, with which the different aspects of the images were corrected and analyzed. From the topographic analysis, it follows that the pyrite of Figure 1a had an average height of 0.4 nm, while the pyrite of Figure 1b had an average height of 0.35 nm. Both surfaces were smooth, but the surface of the pyrite polished with the thickest paste showed greater local depressions, probably scratches generated in the polishing stage; however, the surface polished with the finest paste was smoother on all scales. Completely scratch-free surfaces were not as sought after as completely clean surfaces. The following analyses and measurements were performed using pyrite wafers with a polishing of 0.25 microns.


Figure 1.
Surface {100} of polished pyrite (a) with 1 micron diamond paste and (b) with 0.25 micron diamond paste. Scan size is 10 × 10 µm2. The 3D images of surfaces (a) and (b), respectively, are shown in (c) and (d). Height profiles corresponding to blue lines in (a) and (b), respectively, are shown in frames (e) and (f).
The effect of the exposure of the polished surface of non-oxidized pyrite to a solution of PAX 10−3 M can be seen in Figure 2. For the first time, a regular formation of adsorbate patches on the surface was observed which did not exist on the original surface. Analysis of these patches reveals an average peak of 5 nm, 10 times higher than the average without PAX, and a maximum peak height of 8 nm and average radii of about 130 nm, resulting in patches with a conical frustum shape with elevation angles (radius to height) of about 3 to 4 degrees.
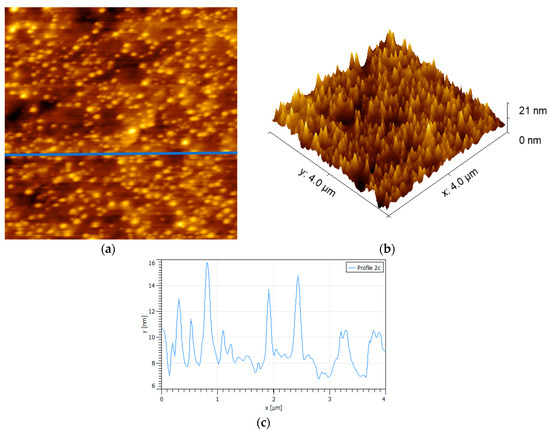
Figure 2.
Surface {100} of non-oxidized pyrite exposed to potassium amyl xanthate collector (PAX) 10−3 M at pH 8.5. Scan size is 4 × 4 µm2. (a) 3D image, (b) topographic map of the surface, and (c) height profile corresponding to the blue line in frame (a).
In pyrite, unlike other sulfide minerals exposed to PAX, the main compound found on the surface was dixanthogen and also ferric xanthate [20] but not in the abundance found in chalcopyrite or pentlandite. Therefore, the conical patches that appear all over the sample in Figure 2 consist mainly of dixanthogen agglomerates that stand out due to the fact of their bright yellow color. Dixanthogen has a melting point around 28 °C; therefore, it should be found as a soft and oily solid at room temperature [28]. The smooth and round form and distribution of patches of PAX in Figure 2 fit well with the morphology of oily hydrophobic PAX on chalcopyrite [21]. Since the pyrite surface was not oxidized or not oxidized to a high degree, the appearance of iron hydroxide, if so, would result from contact with atmospheric air, which was carefully avoided, or due to the oxygen dissolved in the solution, which was carefully removed. Regardless of the oxidation achieved in this case, this would occur in small sites scattered throughout the surface, the extensive adsorption of PAX supports the model of López-Valdivieso et al. [10], which states that the non-oxidized sites could act as initial nucleation points in the formation of dixanthogen agglomerates.
In order to have a surface with controlled oxidation, 30% hydrogen peroxide by volume was used as done by Jin et al. [29]. The results show sections of oxidized pyrite with shapes reminiscent of percolation clusters in condensed matter physics; here, we assumed that the composition of the oxide connected clusters and the few tiny small oxide islands were mainly iron hydroxide and possibly some iron hydroxy sulfates [16,19,29] (Figure 3). This oxidation pattern could well be originated by an accelerated initial oxidation at the edges of the scattered hydrogen peroxide micro droplets. Under alkaline conditions, the oxidation process of pyrite is controlled by iron hydroxides or oxyhydroxides instead of iron sulfates [19], and such formations are highlighted in yellow in the 2D image and topographic map in Figure 3. Several authors have found that oxidation products that form on the surface of pyrite do so by forming pillar structures [13,14,17,30], very similar to the structures found in this work, except, only here the pillars do not appear dispersed but interconnected. A specific analysis of the oxide cluster shows an interconnected skeleton of peaks with approximate height of 11 nm and basal width of 500 nm that is attached to a finer network of small peaks of 3 nm in height and no more than 200 nm of basal width. Following the analogy with percolation, the skeleton plus the fine network make up the oxide percolation network. The high peaks correspond to the pillars already mentioned.
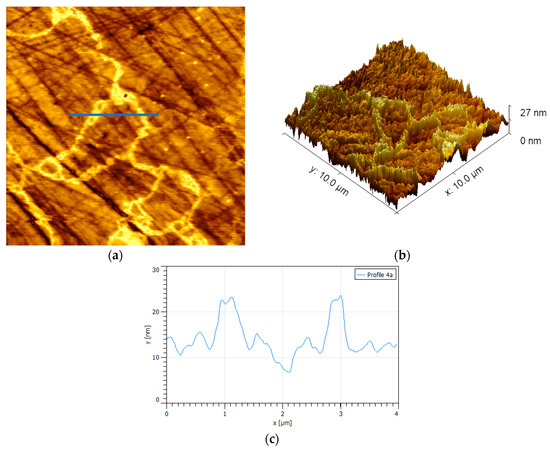
Figure 3.
Surface {100} of polished pyrite exposed to hydrogen peroxide for 300 s. (a) Percolation oxide-connected clusters and a few tiny small oxide islands, scan size is 4 × 4 µm2. (b) Topographic map. (c) Height profile corresponding to the blue line in (a); highest peaks correspond to oxide pillars.
When the samples of oxidized pyrite came into contact with a PAX solution at 10−3 M, the results shown in Figure 4 were obtained. Figure 4a shows an oxide percolation network in which a clearly distinguished percolation backbone is interconnected with a thinner but denser network. The height profiles of Figure 4a show that the percolation backbone crossed by Line 1 in the upper part of the image was composed of two pillars, one with a height of 16 nm and basal width of 1000 nm and another with a height of 14 nm and a basal width of 1800 nm; however, in the lower part of the image, the backbone crossed by Line 2 is dominated by a cord of high and wide peaks with a height of 18 nm and basal width of 2400 nm. The height profiles of Figure 4b show three large pillars in the upper part of the image, corresponding to Line 1, and three other pillars in the lower part of the image, corresponding to Line 2, as large as the previous ones. The first three pillars with heights of 17, 20, and 24 nm and widths of 800, 1800, and 1400 nm, respectively, and the last with heights of 18, 18, and 17 nm and widths of 2200, 2200, and 1000 nm, respectively. The fine network was made up of many peaks, all very small, just over 5 nm in height and no more than 300 nm wide. Clearly the high peaks in Figure 4 are taller and wider than those generated only by oxidation. Mermillod-Blondin et al. [9] proposed a xanthate adsorption mechanism where these pillar-shaped oxidized structures are introduced, in which case, the xanthate preferentially interacts near the top of such oxidized structures which leads to the release of underlying ferric sites where the xanthate is adsorbed as a monolayer of iron–xanthate followed by a multilayer dixanthogen. This mechanism would explain the increase in height and basal width of the oxidized areas seen in Figure 4 after adding PAX. In other words, the results of the AFM in this research support the model of Mermillod-Blondin et al. [9].
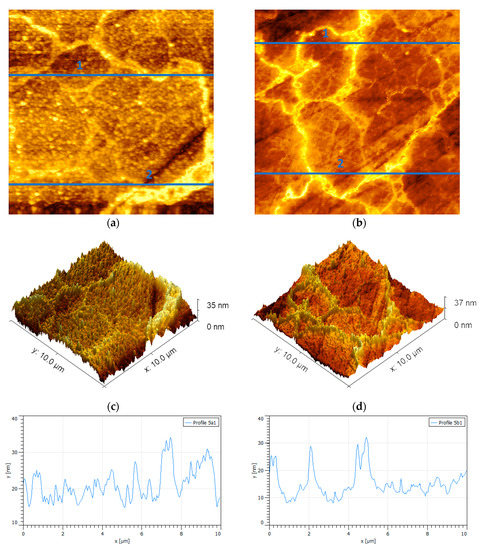
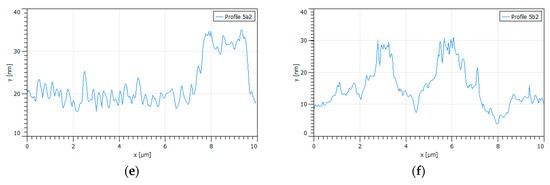
Figure 4.
Surface {100} of oxidized pyrite exposed to PAX 10−3 [M] at pH 8.5 (a–b). Scan size is 10 × 10 µm2. (c–d) Topographic maps of images (a) and (b), respectively. (e–f) Height profiles corresponding to blue lines 1 and 2 in (a) and (b), respectively; the highest peaks correspond to pillars.
When the samples of oxidized pyrite came into contact with a PAX solution at 10−3 M, the results shown in Figure 4 were obtained. Figure 4a shows a bright oxide percolation network in which a percolation backbone clearly distinguished is interconnected with a thinner but denser network; the figure also shows a number of small isolated bright spots. The height profiles of Figure 4a shows that the percolation backbone crossed by Line 1 in the upper part of the image was composed of two pillars, one with a height of 16 nm and basal width of 1000 nm and another with a height of 14 nm and a basal width of 1800 nm; however, in the lower part of the image, the backbone crossed by Line 2 is dominated by a cord of high and wide peaks with a height of 18 nm and basal width of 2400 nm. The height profiles of Figure 4b show three large pillars in the upper part of the image, corresponding to Line 1, and three other pillars in the lower part of the image, corresponding to Line 2, as large as the previous ones. The first three pillars had heights of 17, 20, and 24 nm and widths of 800, 1800, and 1400 nm, respectively, and the last with heights of 18, 18, and 17 nm and widths of 2200, 2200, and 1000 nm, respectively. The fine network was made up of many peaks, all very small, just over 5 nm in height and no more than 300 nm wide; these peaks corresponded to the PAX adsorbed on non-oxidized spots. Clearly the high peaks in Figure 4 are taller and wider than those generated only by oxidation. Mermillod-Blondin et al. [9] proposed a xanthate adsorption mechanism where these pillar-shaped oxidized structures are introduced, in which case, the xanthate preferentially interacts near the top of such oxidized structures which leads to the release of underlying ferric sites, where the xanthate is adsorbed as a monolayer of iron–xanthate followed by a multilayer dixanthogen. This mechanism would explain the increase in height and basal width of the oxidized areas seen in Figure 4 after adding PAX. In other words, the results of the AFM in this research support the model of Mermillod-Blondin et al. [9]. The small isolated bright spots correspond to the PAX over oxide spots or the PAX on non-oxidized spots as in the higher resolution image in Figure 2, in agreement with the model of López-Valdivieso et al. [10].
Sodium chloride salt (NaCl) was selected as representative of the monovalent alkaline series of chlorinated salts due to the fact of its predominance in seawater. Figure 5 shows the effect that different concentrations of salt and PAX have on the surface of oxidized pyrite and how this affects the adsorption of PAX. It was sought that the oxidation treatment was equivalent in all the pyrite wafers considered. Two limits were tested, that is, 0.01 and 0.5 M of NaCl and 10−3 and 10−4 M of PAX. The AFM images clearly show that there were differences in the adsorption of the reagent due to the different conditions. Analyzing the oxide percolation backbone, the brightest and yellowest areas in the images, it was found that in the low-salt/low-PAX limit, the average height and basal width of peaks in Figure 5a were 10 nm and 600 nm, respectively; while in the high-salt/low-PAX limit, the average height and basal width of the peaks in Figure 5b were 8 nm and 500 nm, respectively. Even when the salt concentration was low, 0.01 M NaCl, it was sufficient to prevent some adsorption of PAX at a low dose, 10-4 M. If we remember that an oxide pillar has an average height of 11 nm and basal width of 500 nm, then it can be concluded that under low PAX conditions the presence of low/high salt prevents adsorption of the collector. In the low-salt/high-PAX limit, the average height and basal width of peaks in Figure 5c were 12 nm and 700 nm, respectively; while in the high-salt/high-PAX limit, the average height and basal width of peaks in Figure 5d were 11 nm and 1800 nm, respectively. Again, it was verified that the salt cations reached the surface of the pyrite and covered it, even if PAX was in a high dose. In previous work [27], we analyzed the effect of alkali metal ions, such as Na+, on the zeta potential of pyrite in the presence of PAX. The results showed for low salt concentrations that the cations were adsorbed on the pyrite leaving few sites for the adsorption of the PAX molecules; therefore, at 0.5 M of salt it was expected that the PAX molecules would not penetrate the thick layer of cations that covered the surface of the pyrite and, therefore, little or no PAX was adsorbed. The results of the AFM and zeta potential were complemented here to explain PAX adsorption mechanisms that are far from trivial.
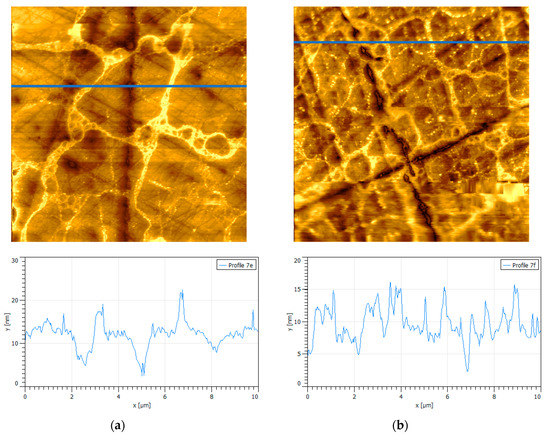
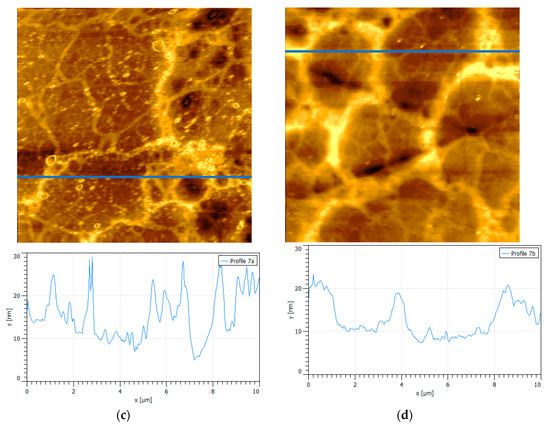
Figure 5.
Surfaces {100} of oxidized pyrite exposed to PAX and sodium chloride at pH 8.5, scan size is 10 × 10 µm2, and corresponding height profiles (blue lines in the images). (a) 0.01 M NaCl, 10−4 M PAX; (b) 0.5 M NaCl, 10−4 M PAX; (c) 0.01 M NaCl, 10−3 M PAX; (d) 0.5 M NaCl, 10−3 M PAX.
Low salt and low PAX did not change the structure of the oxide skeleton, as the image in Figure 5a shows abundant loops in loops induced by de-rounded micro-drops of peroxide and interconnected with a fine oxide network. The structure of the oxide skeleton also did not change when the salt concentration was high. Figure 5b shows a denser network, but this was due to the greater extent of the initial oxidation and not to the adsorption of PAX. The increase in peak height for high PAX at both low and high salt and the significant increase in peak width at high salt (1800 nm) could be interpreted as a result of adsorption of PAX. The height increase was very modest, and it can be simply a slenderer oxide skeleton and not PAX adsorption. However, the width could be the adsorption of PAX on the skirts of the oxide pillars, as in the structures shown in Figure 4. In any case, the adsorption of PAX on pyrite in the presence of a monovalent chloride salt, such as NaCl, is insignificant, according to the results of this study. The images in Figure 5 correspond to the surfaces after being blown gently with nitrogen. The AFM images before and after blowing are equivalent, so we concluded that the material on the surface of the pyrite did not correspond to salt deposits due to the drying of the samples.
Figure 6 shows the effect of a divalent salt, such as CaCl2, on the adsorption of PAX on oxidized pyrite. Again, pyrite wafers have been previously oxidized in an equivalent manner. Figure 6 shows that the presence of Ca2+ strongly impacts the topography of pyrite and the adsorption of PAX. At a low concentration of Ca2+, the topographic profile shows a smooth surface with the presence of a few peaks of comparable size to the oxide peaks without PAX and without salt. The few peaks that appear in the profile have typical oxide heights of about 8 nm and basal width of 600 nm. At high concentration of Ca2+, the topographic profile is denser, but also dominated by oxide peaks with a height of 8 nm and a basal width of 600 nm. A notable difference revealed by the profiles is the appearance of isolated peaks, very few at low Ca and several at high Ca, no more than 5 nm in height. This can be explained, at least at low salt concentration, by the behavior of the zeta potential versus pH for pyrite in 0.01 M CaCl2 and PAX. At pH 8.5, the absolute value (module) of the zeta potential of the pyrite decreases strongly in 0.01 M solution of CaCl2, compared to the value in fresh water; clearly, the Ca2+ cations neutralize the negative charges on non-oxide and oxide sites on the pyrite surface, forming a coating of cations. Notably, when PAX was added at a dose of 10−4 M, the absolute value of the zeta potential of pyrite changed little (approximately −10 mV), but significantly increased when the dose of PAX increased to 10−3 M (approximately −15 mV) (see Supplementary Materials Figure S1). The results suggest that PAX was very poorly adsorbed on sites already occupied by calcium, and also that PAX steals calcium cations from pyrite making it more anionic. The association of Ca and PAX to form a complex has been suggested by Dávila-Pulido et al. [31] based on UV/Vis spectrometry which shows that the xanthate concentration decreased upon addition of calcium. This should not be strange, because a hydrated cation, such as Ca2+, has more affinity with the polar head of PAX, also hydrated, which would be in accordance with the golden rule “similar adsorb similar” [32]. These results help to understand the topographic profiles of Figure 5. The presence of Ca2+ inhibits the adsorption of PAX, thus the peaks in the profile are those of uncoated oxide and favors the chemical association between Ca and PAX to the point that small and abundant peaks, less than 5 nm in height, at a high concentration of CaCl2 should correspond to a PAX–Ca complex. The hypothesis that these small and dispersed peaks could correspond to PAX on small oxide nuclei was ruled out, since the anionicity of the pyrite increased when PAX was added. In the preparation of the samples for AFM, the washing of the surfaces proved to be sufficient to sweep any excess salt or free PAX from the aqueous solution—the washing was abundant so that the drying that followed was of excess distilled water. In Figure 5, the wash–dry–blow sequence was not enough to sweep all the PAX–Ca particles which fortunately allows us to identify this complex. In the continuation of this work, FTIR will be used to confirm the existence of these complexes and clear any doubts regarding the existence of exogenous deposits.
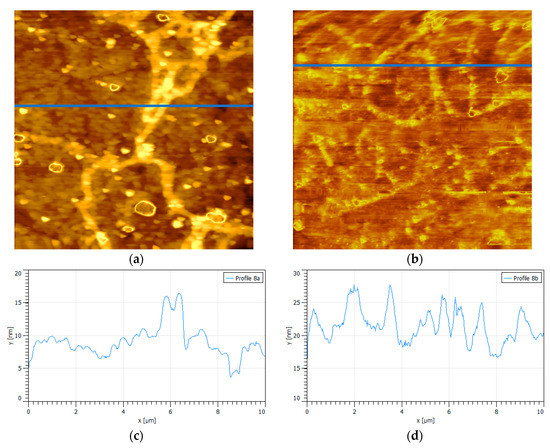
Figure 6.
Surfaces {100} of oxidized pyrite exposed to PAX and calcium chloride at pH 8.5, scan size is 10 × 10 µm2. (a) 0.01 M CaCl2, 10−4 M PAX; (b) 0.5 M CaCl2, 10−4 M PAX, pH 8.5, (c) and (d) are the corresponding height profiles (blue line in the images).
Figure 7 shows the effect of another divalent salt of seawater, MgCl2, on the adsorption of PAX on oxidized pyrite. Again, the pyrite wafers have been oxidized in an equivalent manner. Like Ca2+, the Mg2+ cation was a determinant of the topography of pyrite and the adsorption of PAX. Comparatively, topographic profiles for the same conditions were somewhat more rugged in the case of Mg2+. It is interesting to add that at all pH, the absolute value of the zeta potential of the pyrite decreased in 0.01 M MgCl2 compared to fresh water and somewhat less strongly when the cation was Ca2+, approximately −13 mV in magnesium versus approximately −10 mV in calcium (Supplementary Materials Figure S1). This seems to indicate that the adsorption of magnesium on pyrite is somewhat less than that of calcium which is expected, because magnesium always exists in a hydrated state which reduces its charge density and, as a consequence, its attraction with the anionic surface of pyrite. The magnesium water layers are so stable that the replacement time with bulk water molecules is the slowest by several orders of magnitude among all alkali and alkaline earth metals [33,34]; thus, if magnesium ions are adsorbed on pyrite, they do so by forming outer-sphere complexes, that is, with water molecules in between (for instance, see Reference [35]). When PAX was added in increasing doses of 10−4 to 10−3 M, the absolute value of the pyrite zeta potential increased (approximately −16 mV), as when the cation was Ca2+ (approximately −15 mV). At a low concentration of magnesium (0.01 M), the adsorption of PAX was poor, but not as much as with calcium at the same concentration, so the peaks in the height profile in Figure 7 are a bit slenderer (some 12 nm, others 16 nm) than those of uncoated oxide (about 10 nm). At a high concentration of magnesium (0.5 M), the adsorption of PAX remained poor according to the topographic profile in Figure 7 which shows a few somewhat higher peaks than in calcium. Figure 7 also shows several small peaks (less than 5 nm) which we speculate correspond to a PAX–Mg complex.
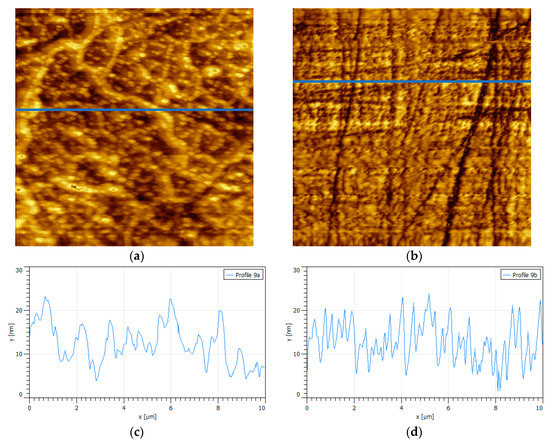
Figure 7.
Surfaces {100} of oxidized pyrite exposed to PAX and magnesium chloride at pH 8.5, scan size is 10 × 10 µm2. (a) 0.01 M MgCl2, 10−4 M PAX; (b) 0.5 M MgCl2, 10−4 M PAX, (c) and (d) are the corresponding height profiles (blue line in the images).
Table 1 summarizes the height/width of the different peaks for pyrite at different conditions, for ease of comparison.

Table 1.
Summary of average height/width of the different peaks for pyrite at different conditions.
In industrial practice, several types of collectors are applied, such as xanthate, dithiophosphate, and mercaptan, for the flotation of sulfide minerals. To increase the hydrophobicity of the mineral with xanthate, it has been proposed that first it is deposited on the mineral as xanthate metal with low solubility and then oxidized to dixanthogen. As shown in this study, this mechanism is completely inhibited by the presence of seawater salts in concentration that represent their ionic strength.
4. Conclusions
In this study contact mode atomic force microscopy (AFM) was used to analyze the topography of pyrite surfaces subjected to treatments, including oxidation and exposure to xanthate and solutions of seawater salts and xanthate, at pH 8.5. Topographic details were related to surface products. Xanthate was adsorbed without hindrance on oxide-free pyrite. The results showed that pyrite oxidized forming a structure of interconnected pillars and that xanthate was adsorbed on the top and skirt of these pillars. In the presence of seawater salts, the cations covered the surface of the pyrite suppressing the adsorption of xanthate regardless of dose. Further studies may be needed to reaffirm some of the findings of this paper; however, the results thus far are expected to help in the analysis of the results of the flotation of sulfide minerals with water with limited metallurgical quality.
Supplementary Materials
The following are available online at https://www.mdpi.com/2075-4701/9/11/1177/s1, Figure S1: Zeta potential of pyrite as function of pH for fresh water (pyrite) without PAX and 0.01 M CaCl2 and MgCl2 solutions at two concentrations of amyl xanthate (PAX). (a) 10−4 M (PAX −4) and (b) 10−3 M (PAX −3). Method: Zeta potential of pyrite was evaluated by streaming potential method (Stabino, Microtrac) in titration mode, adjusting the pH along the measurements. Surface and solutions preparation and methodology in Paredes et al. [27].
Author Contributions
Á.P., S.M.A. and P.G.T. conceived and designed the experiments; Á.P. performed the experiments; Á.P., S.M.A. and P.G.T. analyzed the data; P.G.T. contributed reagents/materials/analysis tools; S.M.A. and P.G.T. wrote the paper.
Funding
This research was funded by Centro CRHIAM through Project Conicyt/Fondap/15130015.
Acknowledgments
We thank Centro CRHIAM through Project Conicyt/Fondap/15130015 for the financial support.
Conflicts of Interest
The authors declare no conflict of interest.
References
- Fuerstenau, M.C.; Kuhn, M.C.; Elgillani, D.A. The role of dixanthogen in xanthate flotation of pyrite. Trans. Soc. Min. Eng. AIME 1968, 241, 148–156. [Google Scholar]
- Healy, T.W.; Moignard, M.S. A review of electrokinetic studies of metal sulphides. In Flotation-A.M. Gaudin Memorial Volume; SME/AIME: New York, NY, USA, 1976. [Google Scholar]
- Shannon, L.K.; Trahar, W.J. The role of collector in sulfide ore flotation. In Advances in Mineral Processing; Somasundaran, P., Ed.; Soc. Mining Engineers, Inc.: Littleton, CO, USA, 1986; pp. 408–425. [Google Scholar]
- Leppinen, J.O. FTIR and flotation investigation of the adsorption of ethyl xanthate on activated and non-activated sulfide minerals. Int. J. Miner. Process. 1990, 30, 245–263. [Google Scholar] [CrossRef]
- Montalti, M.; Fornasiero, D.; Ralston, J. Ultraviolet-visible spectroscopic study of the kinetics of adsorption of ethyl xanthate on pyrite. J. Colloid Interf. Sci. 1991, 143, 440–450. [Google Scholar] [CrossRef]
- Smart, R.S.C. Surface layers in base metal sulphide flotation. Miner. Eng. 1991, 4, 891–909. [Google Scholar] [CrossRef]
- Fornasiero, D.; Eijt, V.; Ralston, J. An electrokinetic study of pyrite oxidation. Colloid Surface 1992, 62, 63–73. [Google Scholar] [CrossRef]
- Richardson, P.E. Surface chemistry of sulphide flotation. In Mineral Surfaces, The Mineral Society Series No. 5; Vaughan, D.J., Pattick, R.A.D., Eds.; Chapman and Hall: London, UK, 1995; pp. 261–302. [Google Scholar]
- Mermillod-Blondin, R.; Kongolo, M.; de Donato, P.; Benzaazoua, M.; Barrès, O.; Bussière, B.; Aubertin, M. Pyrite flotation with xanthate under alkaline conditions-application to environmental desulfurization. In Centenary of Flotation Symposium; Brisbane Johnson, G.J., Ed.; QLD: Brisbane, Australia, 2005; pp. 683–692. [Google Scholar]
- Lopez-Valdivieso, A.; Sánchez Lopez, A.A.; Song, S. On the cathodic reaction coupled with the oxidation of xanthates at the pyrite/aqueous solution interface. Int. J. Miner. Process. 2005, 77, 154–164. [Google Scholar] [CrossRef]
- He, S.; Fornasiero, D.; Skinner, W. Correlation between copper-activated pyrite flotation and surface species: Effect of pulp oxidation potential. Miner. Eng. 2005, 18, 1208–1213. [Google Scholar] [CrossRef]
- Chandra, A.P.; Gerson, A.R. The mechanisms of pyrite oxidation and leaching: A fundamental perspective. Surf. Sci. Rep. 2010, 65, 293–315. [Google Scholar] [CrossRef]
- Smart, R.S.C.; Amarantidis, J.; Skinner, W.; Prestidge, C.A.; La Vanier, L.; Grano, S. Surface analytical studies of oxidation and collector adsorption in sulphide mineral flotation. Scanning Microsc. 1998, 12, 553–583. [Google Scholar]
- Smart, R.S.C.; Amarantidis, J.; Skinner, W.M.; Prestidge, C.A.; La Vanier, L.; Grano, S.R. Surface analytical studies of oxidation and collector adsorption in sulfide mineral flotation. In Solid-Liquid Interfaces. Topics in Applied Physics; Wandelt, K., Thurgate, S., Eds.; Springer: Berlin/Heidelberg, Germany, 2003; Volume 85, pp. 3–62. [Google Scholar]
- Buckley, A.N.; Hamilton, I.C.; Woods, R. Investigation of the surface oxidation of sulfide minerals by linear potential sweep voltammetry and X-ray photoelectron spectroscopy. In Flotation of Sulfide Minerals; Forssberg, K.S.E., Ed.; Elsevier: Amsterdam, The Netherlands, 1985; pp. 41–60. [Google Scholar]
- Buckley, A.N.; Woods, R. The surface oxidation of pyrite. Appl. Surf. Sci. 1987, 27, 437–452. [Google Scholar] [CrossRef]
- Eggleston, C.M.; Hochella, M.F. Scanning tunneling microscopy of sulfide surfaces. Geochim. Cosmochim. Acta 1990, 54, 1511–1517. [Google Scholar] [CrossRef]
- Knipe, S.W.; Mycroft, J.R.; Pratt, A.R.; Nesbitt, H.W.; Bancroft, G.M. X-ray photoelectron spectroscopic study of water adsorption on iron sulphide minerals. Geochim. Cosmochim. Ac. 1995, 59, 1079–1090. [Google Scholar] [CrossRef]
- Todd, E.; Sherman, D.; Purton, J. Surface oxidation of pyrite under ambient atmospheric and aqueous (pH = 2 to 10) conditions: Electronic structure and mineralogy from X-ray absorption spectroscopy. Geochim. Cosmochim. Acta 2003, 67, 881–893. [Google Scholar] [CrossRef]
- Zhang, Y.; Cao, Z.; Cao, Y.; Sun, C. FTIR studies of xanthate adsorption on chalcopyrite, pentlandite and pyrite surfaces. J. Mol. Struct. 2013, 1048, 434–440. [Google Scholar] [CrossRef]
- Zhang, J.; Zhang, W. An Atomic Force Microscopy Study of the Adsorption of Collectors on Chalcopyrite. In Microscopy: Advances in Scientific Research and Education; Méndez-Vilas, A., Ed.; Formatex Resarch Center: Badajoz, Spain, 2014; pp. 967–973. ISBN 978-84-942134-4-1. [Google Scholar]
- Castro, S.; Laskowski, J.S. Froth flotation in saline water. KONA Powder Part. J. 2011, 29, 4–15. [Google Scholar] [CrossRef]
- Jeldres, R.I.; Toledo, P.G.; Concha, F.; Stickland, A.D.; Usher, S.P.; Scales, P.J. Impact of seawater salts on the viscoelastic behavior of flocculated mineral suspensions. Colloid Surface A 2014, 461, 295–302. [Google Scholar] [CrossRef]
- Jeldres, R.I.; Piceros, E.C.; Leiva, W.H.; Toledo, P.G.; Herrera, N. Viscoelasticity and yielding properties of flocculated kaolinite sediments in saline water. Colloid Surface A 2017, 529, 1009–1015. [Google Scholar] [CrossRef]
- Jeldres, R.I.; Arancibia-Bravo, M.P.; Reyes, A.; Aguirre, C.E.; Cortes, L.; Cisternas, L.A. The impact of seawater with calcium and magnesium removal for the flotation of copper-molybdenum sulphide ores. Miner. Eng. 2017, 109, 10–13. [Google Scholar] [CrossRef]
- Quezada, G.R.; Jeldres, R.I.; Goñi, C.; Toledo, P.G.; Stickland, A.D.; Scales, P.J. Viscoelastic behaviour of flocculated silica sediments in concentrated monovalent chloride salt solutions. Miner. Eng. 2017, 110, 131–138. [Google Scholar] [CrossRef]
- Paredes, A.; Acuña, S.M.; Gutiérrez, L.; Toledo, P.G. Zeta potential of pyrite particles in concentrated solutions of monovalent seawater electrolytes and amyl xanthate. Minerals 2019, 9, 584. [Google Scholar] [CrossRef]
- Rao, S.R. Xanthates and Related Compounds; Dekker: New York, NY, USA, 1971. [Google Scholar]
- Jin, J.; Miller, J.D.; Dang, L.X.; Wick, C.D. Effect of surface oxidation on interfacial water structure at a pyrite (100) surface as studied by molecular dynamics simulation. Int. J. Miner. Process. 2015, 139, 64–76. [Google Scholar] [CrossRef]
- Miller, J.; Du Plessis, R.; Kotylar, D.; Zhu, X.; Simmons, G. The low-potential hydrophobic state of pyrite in amyl xanthate flotation with nitrogen. Int. J. Miner. Process. 2002, 67, 1–15. [Google Scholar] [CrossRef]
- Dávila-Pulido, G.I.; Uribe-Salas, A.; Álvarez-Silva, M.; López-Saucedo, F. The role of calcium in xanthate adsorption onto sphalerite. Min. Eng. 2015, 71, 113–119. [Google Scholar] [CrossRef]
- Franks, G.V. Zeta potentials and yield stresses of silica suspensions in concentrated monovalent electrolytes: Isoelectric point shift and additional attraction. J. Colloid Interf. Sci. 2002, 249, 44–51. [Google Scholar] [CrossRef]
- Obst, S.; Bradaczek, H. Molecular dynamics study of the structure and dynamics of the hydration shell of alkaline and alkaline-earth metal cations. J. Phys. Chem. 1996, 100, 15677–15687. [Google Scholar] [CrossRef]
- Larentzos, J.P.; Criscenti, L.J. A molecular dynamics study of alkaline earth metal-chloride complexation in aqueous solution. J. Phys. Chem. B 2008, 112, 14243–14250. [Google Scholar] [CrossRef]
- Quezada, G.R.; Rozas, R.E.; Toledo, P.G. Ab initio calculations of partial charges at kaolinite edge sites and molecular dynamics simulations of cation adsorption in saline solutions at and above the pH of zero charge. J. Phys. Chem. C 2019, 23, 22971–22980. [Google Scholar] [CrossRef]
© 2019 by the authors. Licensee MDPI, Basel, Switzerland. This article is an open access article distributed under the terms and conditions of the Creative Commons Attribution (CC BY) license (http://creativecommons.org/licenses/by/4.0/).