Article

Influence of Process Parameters and Deposition Strategy on Laser Metal Deposition of 316L Powder

1
ARM Laboratory, Institute of Systems and Technologies for Sustainable Production, Department of Innovative Technologies, SUPSI, via Cantonale 2c, 6928 Manno, Switzerland
2
Department of Applied Science and Technology, Politecnico di Torino, Corso Duca degli Abruzzi 24, 10129 Torino, Italy
*
Author to whom correspondence should be addressed.
Metals 2019, 9(11), 1160; https://doi.org/10.3390/met9111160
Submission received: 14 September 2019 / Revised: 23 October 2019 / Accepted: 25 October 2019 / Published: 28 October 2019

Abstract

:
In blown powder additive manufacturing technologies the geometrical stability of the built parts is more complex with respect to more conventional powder bed processes. Because of this reason, in order to select the most suitable building parameters, it is important to investigate the shape and the properties of the single metal bead formation and the effect that a scan track has on the nearby ones. In the present study, a methodology to identify an appropriate laser metal deposition process window was introduced, and the effect of the building parameters on the geometry of circular steel samples was investigated. The effect of the scanning strategy on the deposited part was also investigated. This work draws the attention to the importance of the obtainment of the most suitable melt pool shape, demonstrating that the laser power and the scanning strategy have a strong influence not only on the shape but also on the mechanical properties of the final component.

1. Introduction

Powder-based Laser Metal Deposition (LMD) is a production technology that belongs to the Additive Manufacturing (AM) class [1,2]. LMD has gained much interest in recent years as it can produce complex and functional 3D metal components by melting material as being deposited. The advantages of this blown powder AM process are mainly related to the possibility of using it to locally repair metal components and the possibility of manufacturing large parts [3]. Furthermore, the lack of a powder bed allows the obtainment of multi-material parts or graded compositions [4].
This process allows the production of near net shape components characterised by rough surfaces, thus the components are generally used only after post-process machining [5].
The selection of LMD building parameters is, however, very critical due to the significant effect of the system configuration and the building parameters on the melt pool stability and consequently on the densification and the properties of the deposited parts [6]. Because of this reason, several approaches based on different aspects have been used in recent years for the selection of the most suitable building parameters (powder feed rate, laser power, scan speed, overlap percentage) [7,8,9,10]. Some approaches are based on modelling and measuring the melt pool dimensions, and on the understanding of their overlapping, others select the process parameters based on bulk components’ porosity, geometrical accuracy, or microstructure and mechanical properties [5,11,12,13,14]. Recently LMD has been successfully used to process different alloys such as AlSi10Mg, Ti6Al4V, IN625 and 316L SS, showing several promising results [15,16,17,18]. In particular, some studies focused on the mechanical and microstructural characterisation of steel samples built by LMD and on the influence of process parameters on its mechanical behaviour. Park et al., for example, have studied the properties of H13 and D2 steel samples produced by LMD and showed that the hardness of the deposited H13 steel is higher than the wrought one, while the opposite is true for D2 steel [19]. Zhang et al. have investigated the properties of stainless steel 316 LMD samples and demonstrated that the hardness of the deposited material is higher than the substrate one and that it strongly depends on the location within the sample [20]. Moreover, Mahmood et al. reported that the hardness of the LMD samples is not only influenced by the building parameters but also by the particle size of the powder used [21].
However, although the LMD process of 316L steel has already been studied, little attention has been paid to the investigation of the effect of the building parameters on each single scan track and on their interaction. Furthermore, most of the studies are related to the exploitation of linear scans, notwithstanding in the LMD processes circular scanning strategy is generally used [22,23].
In the present study, a procedure for LMD parameter selection through circular scan characterisation is performed, from single to multiple, parallel, or overlapped tracks. In particular, a deep investigation of the effect of the building parameters and scanning strategy on the shape and the hardness values of LMD samples was conducted in order to better understand the process and its consequences on material properties.

2. Materials and Methods

AISI 316L stainless steel samples were fabricated in SUPSI (University of Applied Sciences and Arts of Southern Switzerland) laboratory (ARM lab–DTI) using a Laserdyne® 430 system (Prima Additive, Torino, Italy), which is a LMD customised 3-axis laser processing system (see Figure 1a). This system used a fibre laser Convergent Photonics CF1000 with a maximum laser power (P) of 1000 W, a wavelength of 1070 nm and a laser spot (D) of 1 mm. The deposition head, provided by Optomec (Albuquerque, NM, USA), is a multi-nozzle deposition head with 4 lateral nozzles (see Figure 1b). All samples were built using a stand-off distance of 10 mm, a powder feed rate of 0.042 g/s and argon of purity 4.6 as a shielding and carrier gas, using a carrier mass flow of 4 L/min and a central flow of 15 L/min to shield the laser beam. A 316L gas atomised powder provided by LPW Technology Ltd. was used as the starting material of the LMD process. A scanning electron microscope (SEM) image and the particle size distribution of the used powder are reported in Figure 1c,d, respectively.
The overall experimental campaign was structured in 2 main steps:
  • Identification and definition of an appropriate LMD process window ensuring a proper melt pool formation and a continuous metal bead deposition (experimental step 1);
  • Analysis of the influence of both building parameters and scanning strategy on the morphology, microstructure and mechanical properties of the realised samples (experimental step 2).
In experimental step 1, the influence of the laser power (P) and scanning speed (F) on the formation of the linear single tracks (20 mm long) was evaluated performing a full factorial Design of Experiments (DOE)(see Table 1). Single tracks were realised on the AISI 316L substrates having a nominal size of 150 × 80 × 8 mm3. The external quality and integrity of the track metal clad was evaluated through the on-top analysis by a digital microscope (Keyence VHX-6000, Osaka, Japan), while the metal bead shape and morphology were characterised through the cross-section analysis by an optical microscope (Leica DMI5000 M, Wetzlar, Germany) after having the cross-sectioned polished up to 1 µm and etched with Kalling’s No. 2 solution for 15 s for the deposited samples.
In experimental step 2, 2 main types of samples were investigated. The first sample type, namely the circular contour, characterised by 3 concentric circles, was realised to investigate the effect of power and scanning strategy while, in the 2nd one, the circular overlap, the track overlap was also considered. Two scanning strategies, namely S1 (starting from the centre) and S2 (starting from the external part) were considered in this study (see Figure 2). An overlap of 50% and 70% of the nominal track width was chosen in order to ensure the formation of continuous and proper bonding between successive track depositions.
The experimental results from experimental step 1, combinations of P and F, ensured proper single track deposition were selected in order to evaluate the effect of both deposition strategy and track overlapping on the clad formation. The laser spot diameter (D) and the stand-off distance were respectively 1 mm and 10 mm.
The specific energy (Es) value was calculated based on the following equation:
E s = P F × D
All samples were cut perpendicularly to the building platform, mounted, grounded and polished up to 1 µm. In order to observe the microstructure, all samples were etched using Kalling’s No. 2 solution for 15 s. Samples cross-sections were analysed by an optical microscope (Leica DMI5000 M, Wetzlar, Germany). The main geometrical features of all the scans were evaluated using the Image J software (1.51w, University of Wisconsin, Madison, WI, USA).
Micro-Vickers hardness was measured using the micro-Vickers indenter Leica VMHT (Wetzlar, Germany) with a load of 100 g applied for 15 s. The measurements were carried out on the cross-section of the samples embedded in the cold resin, concentrating on the metal bead area by making indentation grids with 150 µm separated indentations.

3. Results

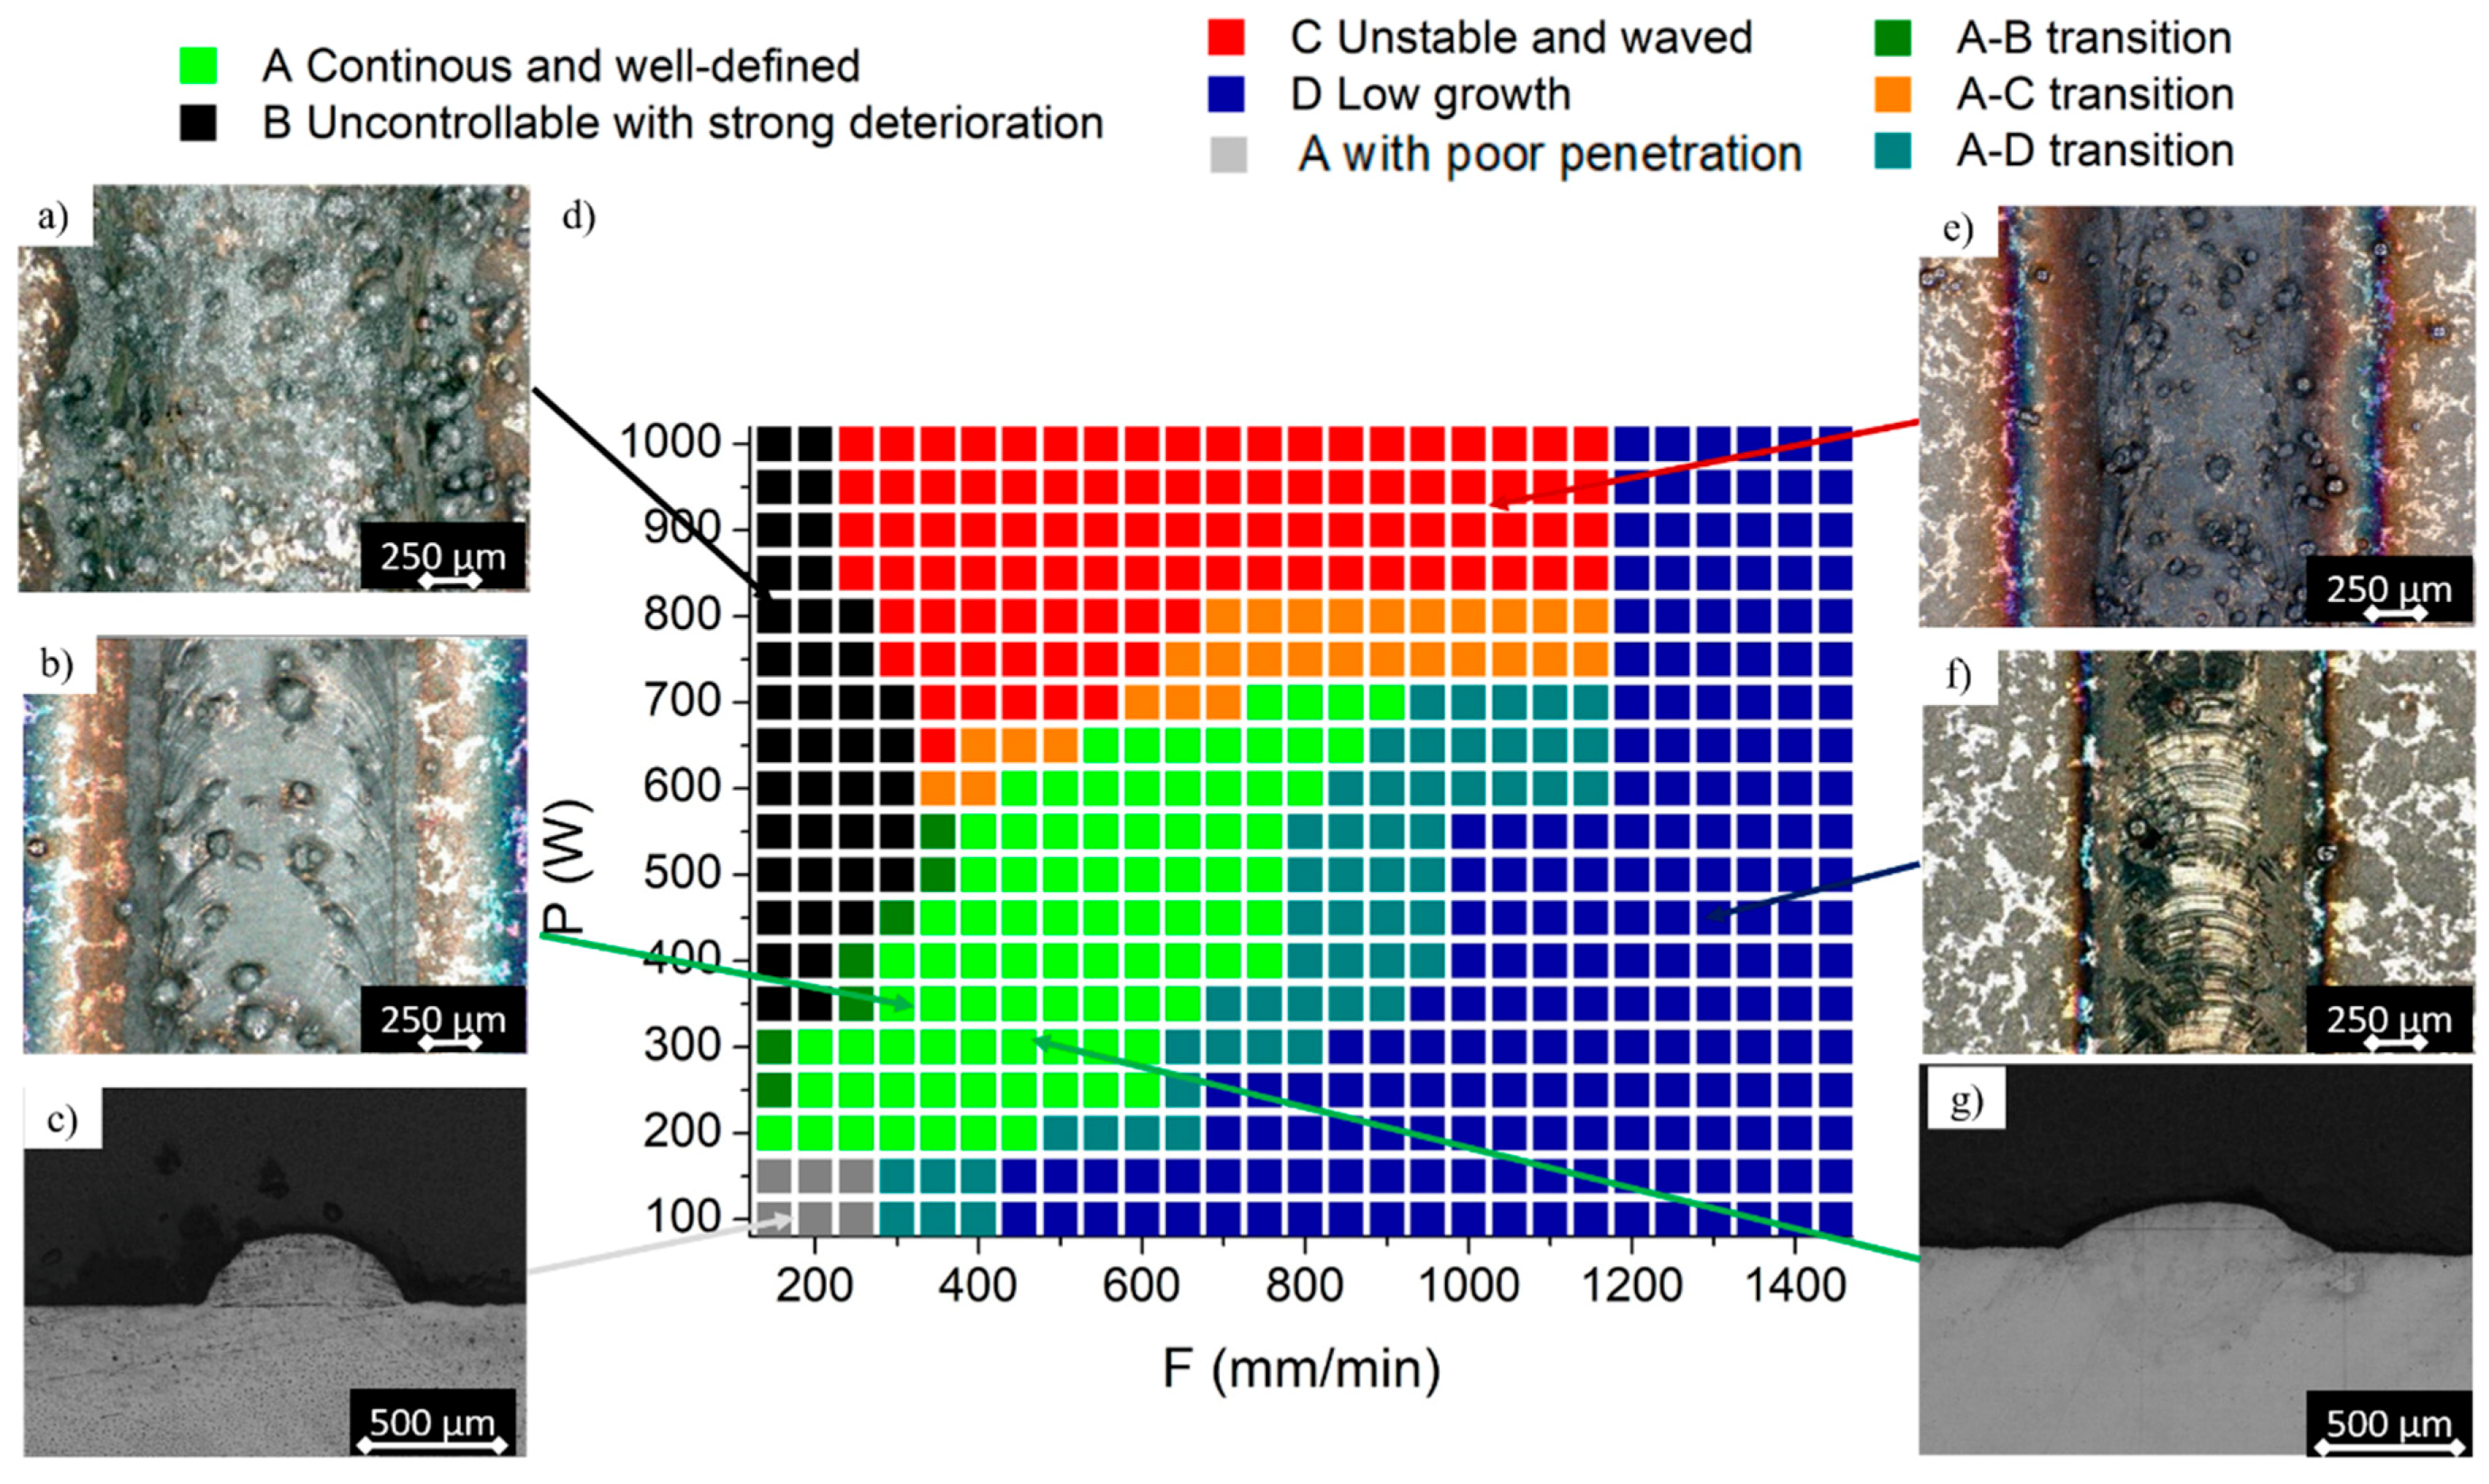
3.1. Process Window Identification

The stability of the scan track is a critical issue in the deposition processes. The obtainment of continuous and spatter-free scans will, in fact, facilitate the deposition of the subsequent layers and, therefore, the obtainment of dense components.
Because of this reason, at first, the stability of the scan was investigated with on-top evaluation and four different morphologies were identified (see Figure 3):
  • Area A: Continuous and well-defined single tracks were feasible for P ranging between 100 and 700 W in combination with F ranging between 150 and 900 mm/min;
  • Area B: For laser power higher than 300 W and for low scanning speeds, the growth of the single track was uncontrollable, showing a strong deterioration due to the high presence of powder particles stuck along both the metal clad surface and the track borders. This instability was mainly due to the high powder feed rate obtained when low scan speeds were used. This kind of track deterioration is critical when successive tracks have to be deposited. Indeed, border instability and a strong presence of un-melted particles stuck along the track could prevent a proper and constant laser/substrate interaction, inducing porosity, lack of fusion and the formation of unstable melt pools;
  • Area C: For high-power values, a strong deterioration and instability of the clad occurred. The track width was about 1.4 mm with an unstable and waved trend of the track borders. In this specific area, the loss in deposition accuracy and stability was mainly related to the high energy density provided during the process. Moreover, high Es could deteriorate the structural integrity of the deposition, inducing internal pore formation;
  • Area D: For high scanning speeds, tracks with very low or no growth of the metal bead were observed. This morphology was due to the reduced idle time and the higher cooling rate involved, which prevented the formation of a proper melt pool and a stable metal clad.
The single track evaluation was completed performing a bead characterisation of the acceptable tracks (i.e., “green labelled” tracks of Figure 3d). Figure 3c,g show different metal beads depending on the involved combination of process parameters. For low laser energy (i.e., P < 200 W), no melt pool penetration into the substrate was observed, achieving a metal clad weakly bonded with the substrate (see Figure 3c). This was due to the scattering, absorption and melting phenomena of the floating powder particles that dissipated all the laser energy provided, preventing the remelting of the substrate. On the contrary, for P higher than 200 W, the penetration of the melt pool into the substrate occurred (see Figure 3g), increasing in depth with the laser power. In this case, the laser energy provided by the medium-high P levels ensured to properly cover powder dissipations and allow the remelting of the substrate, ensuring a proper metal bonding between the as-deposited material and the substrate. Moreover, no pores or internal cracks were observed for the “green labelled” metal beads realised with a P higher than 200 W. Based on these results, the process parameter combinations characterised by the power values lower than 200 W were excluded from the processability window (i.e., “low penetration” tracks in Figure 3d).
From the identified process window, two combinations of process parameters were chosen to run the experimental step-2 and analyse the effect of the process parameters and deposition strategy on the morphology, microstructure and mechanical properties of the metal bead (see Table 2).

3.2. Analysis of the Deposition Strategy

Two green labelled conditions of the process map reported in Figure 3 have different energy densities, which were used for the study of the deposition strategy. The parameters used in this experimental step are reported in Table 2.
Figure 4 shows the four images related to the circular contours built with different combinations of process parameters listed in Table 2. Due to the geometric condition of the realised circular samples (see Figure 2a), six beads were characterised for each sample (i.e., two for the internal contour, two for the central contour, and two for the external contour).
From the comparison of the images, it can be noticed that the power has a strong effect on the melt pool dimension and especially on its depth, while the effect of the scanning strategy is not clearly visible. In order to highlight the effect of the scanning parameters on the geometry of the scans, the main geometrical features of the circular contour beads were taken as represented in Figure 5a and reported in Figure 5b,c. In all cases, the metal beads corresponding to the internal contour are slightly larger than the external ones. This can be explained by the formation of excessive heat accumulation during inner contour deposition [24]. The interaction between the laser beam and the metal deposition plane involved a temperature increment of the surrounding metal surface. For short and circular laser path, the temperature increase was larger due to the limited size of the working area. The higher the temperature of the metal substrate, the more laser energy was employed for melting, increasing the final width of the melt pool. This fact was regardless of the deposition strategy involved.
Based on these geometrical features, it was also possible to evaluate the powder efficiency based on the following equation suggested by de Oliveira et al. [25]:
P e = A v ρ p f
where A is the clad area, ρp is the powder density and f is the feed rate (g/min). The powder efficiency results for all the circular contour samples are resumed in Figure 5d. As the geometrical features, the powder efficiency is influenced by the laser power used, and it is not affected by the scanning strategy. Furthermore, Pe values of the internal contour melt pools are always higher with respect to the others. These results confirm the hypothesis according to which the central melt pools are larger because of the heat accumulation due to the shorter path of the inner contour.
As concerning the circular overlap samples, the most representative optical micrographs of their cross-sections are reported in Figure 6. It can be noticed that, when low power and low overlap values (i.e., 50%) are used, the scanning strategy does not affect the deposition morphology. On the contrary, by using higher power and high overlap values (70%), the deposition shapes were modified on the basis of the scanning strategy.
It is interesting to underline that S1 and S2 did not modify the shape of the melt pool in terms of height or width in its position. The first deposited scan went deep into the substrate, while the last one (the external for S1 and the internal for S2) was deposited on the top of the previous ones. A similar phenomenon was observed by Oliari et al. on a wire based H11 LMD process and this geometry was related to a material inefficiency phenomenon [26]. Kaplan et al. modelled a laser cladding process and observed that this geometry appeared when the large overlap values were used [27]. However, the authors pointed out that, when a large number of tracks are deposited and the steady state is reached, the parameters that bring to this geometry allow the production of a layer characterised by low roughness values.
In an AM process, however, this effect might strongly affect the shape of the final component. The shape changes observed in samples realised with high-power and overlap values may cause the modification of the working distance of the following layers, inducing the instability in the building process [28]. This effect might become more evident when more layers are deposited. The superimposition of several layers with even slightly heterogeneous growth might, in fact, cause the obtainment of components characterised by poor geometrical accuracy, increasing the post-processing phases.
In order to reduce this effect, it can be, therefore, convenient to build parts with medium-low overlap values and with an alternated scanning strategy (S1–S2) in order to control this effect.
Finally, the effect of the scanning strategy on the properties and the microstructure was also assessed by micro-hardness measurements. The Micro Vickers maps of the circular contour samples are reported in Figure 7. Similar hardness values were obtained by Mahmood et al., who investigated the relation between 316L LMD hardness and the building parameters [21].
The hardness maps show that the properties of LMD 316L slightly change within the metal bead but do not follow any specific trend related to the melt pool geometry. This variation in the bead’s hardness might be due to the combined effect of the cooling rate and thermal gradient together with the Marangoni flow. The rapid cooling causes the solid ification of a complex microstructure characterised by elongated grains containing fine cellular dendrites. The fine cells are the main responsible for the high mechanical properties of the AM materials. The Marangoni effect, which is due to the variation in the surface tension of the melt pool, causes strong fluid flow in the melt pool and the formation of areas characterised by very fine microstructure (see Figure 4).
The mean values of the bead hardness reported below each map suggest that the higher the power the lower the hardness. This effect has also been previously observed in samples produced by the powder bed and blown powder AM technologies [29,30]. Previous studies demonstrated that the reduced mechanical properties of high-power samples are, in fact, related to the wide microstructure, which is due to the lower cooling rate [18,21].
From the comparison of the maps, it can also be pointed out that the central metal bead, corresponding to the internal contour, was generally characterised by a lower hardness than the others, regardless of the scanning strategy. This trend was also probably correlated to the heat accumulation effect due to the shorter path of the central contour. As discussed in Figure 4, this phenomenon gives larger melt pools that are characterised by lower solidification rates and, therefore, wider microstructures.
Hardness maps performed on circular overlap samples showed that the mechanical properties were also strongly affected by the overlap values (see Figure 8), confirming that the LMD building parameters not only affected the parts porosity and the geometrical accuracy but also their properties. In this case, the hardness value decreased by about 15% by increasing the overlap value from 50% to 70%.

4. Conclusions

In this work, a methodology for process window identification based on single track characterization was set up, and the effect of the building parameters and scanning strategy on the geometry and the properties of the LMD 316L was investigated. The main results can be summarised as follows:
  • In LMD processes, to properly identify an optimal process window, on-top and cross-section analyses of the metal scan tracks are required.
  • In LMD, powder feed rate affects the penetration of the melt pool into the substrate, preventing a proper metal bonding formation when low laser energies are employed;
  • The selected process window is promising for the production of 316L stable and continuous scan tracks, getting metal beads free of internal defects, and with a proper metal bonding with the substrate. Nevertheless, heat accumulations strongly affect the shape of the melt pool, depending on the length of the laser path;
  • For central contours deposition, heat accumulations significantly affect the shape of the melt pool, producing larger metal bead for shorter path;
  • For circular overlap depositions, the shape of the metal bead is affected by both the scanning strategy and the track overlap. For high overlap values, the final shape of the metal bead strongly depends on the deposition strategy involved;
  • The micro-indentation maps showed that the mechanical properties slightly vary within each metal bead. However, any specific correlation between the hardness and location within the bead was found;
  • In LMD, the building parameters such as power and overlap have a strong effect on samples hardness in relation to the cooling rate conditions;
  • In LMD, the deposition strategy is a significant process parameter to be evaluated in the manufacturing of the 3D bulk parts since it affects the melt pool formation and the stability of the deposition.

Author Contributions

Conceptualization, F.M. and A.A.; methodology, F.M. A.V.; validation, S.B. and R.D.; resources, M.L. and A.V.; data curation, M.L. S.B.; writing—original draft preparation, A.A., F.M. and R.D.; writing—review and editing S.B. A.V. and M.L.; project administration, A.V.

Funding

This research was funded by Novel ALL-IN-ONE machines, robots and systems for affordable, worldwide and lifetime Distributed 3D hybrid manufacturing and repair operations, Project ID: 723795.

Acknowledgments

The authors would like to acknowledge the European research project belonging Horizon 2020 research and innovation programme Novel ALL-IN-ONE machines, robots and systems for affordable, worldwide and lifetime Distributed 3D hybrid manufacturing and repair operations (Project ID: 723795).

Conflicts of Interest

The authors declare no conflict of interest.

References

  1. Sames, W.J.; List, F.A.; Pannala, S.; Dehoff, R.R.; Babu, S.S. The metallurgy and processing science of metal additive manufacturing. Int. Mater. Rev. 2016, 6608, 315–360. [Google Scholar] [CrossRef]
  2. Gardan, J. Additive manufacturing technologies: State of the art and trends. Int. J. Prod. Res. 2016, 54, 3118–3132. [Google Scholar] [CrossRef]
  3. Wilson, J.M.; Piya, C.; Shin, Y.C.; Zhao, F.; Ramani, K. Remanufacturing of turbine blades by laser direct deposition with its energy and environmental impact analysis. J. Clean. Prod. 2014, 80, 170–178. [Google Scholar] [CrossRef]
  4. Nam, S.; Cho, H.; Cheolhee, K.; Kim, Y.-M. Effect of Process Parameters on Deposition Properties of Functionally Graded STS 316/Fe Manufactured by Laser Direct Metal Deposition. Metals 2018, 8, 607. [Google Scholar] [CrossRef]
  5. Suryakumar, S.; Karunakaran, K.P.; Bernard, A.; Chandrasekhar, U.; Raghavender, N.; Sharma, D. Weld bead modeling and process optimization in Hybrid Layered Manufacturing. CAD Comput. Aided Des. 2011, 43, 331–344. [Google Scholar] [CrossRef]
  6. Urbanic, R.J.; Saqib, S.M.; Aggarwal, K. Using Predictive Modeling and Classification Methods for Single and Overlapping Bead Laser Cladding to Understand Bead Geometry to Process Parameter Relationships. J. Manuf. Sci. Eng. 2016, 138, 051012-1–051012-13. [Google Scholar] [CrossRef]
  7. Li, W.; Li, S.; Liu, J.; Zhang, A.; Zhou, Y.; Wei, Q.; Yan, C.; Shi, Y. Effect of heat treatment on AlSi10Mg alloy fabricated by selective laser melting: Microstructure evolution, mechanical properties and fracture mechanism. Mater. Sci. Eng. A 2016, 663, 116–125. [Google Scholar] [CrossRef]
  8. Wu, Q.; Lu, J.; Liu, C.; Fan, H.; Shi, X.; Fu, J.; Ma, S. Effect of molten pool size on microstructure and tensile properties of wire arc additive manufacturing of Ti-6Al-4V alloy. Materials 2017, 10, 749. [Google Scholar] [CrossRef]
  9. Balu, P.; Leggett, P.; Hamid, S.; Kovacevic, R. Multi-response optimization of laser-based powder deposition of multi-track single layer hastelloy C-276. Mater. Manuf. Process. 2013, 28, 173–182. [Google Scholar] [CrossRef]
  10. Abioye, T.E.; Farayibi, P.K.; Clare, A.T. A comparative study of Inconel 625 laser cladding by wire and powder feedstock. Mater. Manuf. Process. 2017, 32, 1653–1659. [Google Scholar] [CrossRef]
  11. Thompson, S.M.; Bian, L.; Shamsaei, N.; Yadollahi, A. An overview of Direct Laser Deposition for additive manufacturing; Part I: Transport phenomena, modeling and diagnostics. Addit. Manuf. 2015, 8, 36–62. [Google Scholar] [CrossRef]
  12. Choi, J.; Chang, Y. Characteristics of laser aided direct metal/material deposition process for tool steel. Int. J. Mach. Tools Manuf. 2005, 45, 597–607. [Google Scholar] [CrossRef]
  13. Dinda, G.P.; Dasgupta, A.K.; Mazumder, J. Laser aided direct metal deposition of Inconel 625 superalloy: Microstructural evolution and thermal stability. Mater. Sci. Eng. A 2009, 509, 98–104. [Google Scholar] [CrossRef]
  14. Wu, Q.; Lu, J.; Liu, C.; Shi, X.; Ma, Q.; Tang, S.; Fan, H.; Ma, S. Obtaining uniform deposition with variable wire feeding direction during wire-feed additive manufacturing. Mater. Manuf. Process. 2017, 32, 1881–1886. [Google Scholar] [CrossRef]
  15. Javidani, M.; Arreguin-Zavala, J.; Danovitch, J.; Tian, Y.; Brochu, M. Additive Manufacturing of AlSi10Mg Alloy Using Direct Energy Deposition: Microstructure and Hardness Characterization. J. Therm. Spray Technol. 2017, 26, 587–597. [Google Scholar] [CrossRef]
  16. Marchese, G.; Garmendia Colera, X.; Calignano, F.; Lorusso, M.; Biamino, S.; Minetola, P.; Manfredi, D. Characterization and Comparison of Inconel 625 Processed by Selective Laser Melting and Laser Metal Deposition. Adv. Eng. Mater. 2017, 19, 1600635. [Google Scholar] [CrossRef]
  17. Weiss, L.; Acquier, P.; Germain, L.; Fleury, E. Microtexture of Ti6Al4V Obtained by Direct Energy Deposition (DED) Process. In Proceedings of the 13th World Conference on Titanium; John Wiley & Sons: Hoboken, NJ, USA, 2016; pp. 1305–1310. [Google Scholar]
  18. Liu, Y.; Liu, C.; Liu, W.; Ma, Y.; Zhang, C.; Cai, Q.; Liu, B. Microstructure and properties of Ti/Al lightweight graded material by direct laser deposition. Mater. Sci. Technol. 2017, 0836, 2–9. [Google Scholar] [CrossRef]
  19. Park, J.S.; Lee, M.-G.; Cho, Y.-J.; Sung, J.H.; Jeong, M.-S.; Lee, S.-K.; Choi, Y.-J.; Kim, D.H. Effect of heat treatment on the characteristics of tool steel deposited by the directed energy deposition process. Met. Mater. Int. 2016, 22, 143–147. [Google Scholar] [CrossRef]
  20. Zhang, K.; Wang, S.; Liu, W.; Shang, X. Characterization of stainless steel parts by Laser Metal Deposition Shaping. Mater. Des. J. 2014, 55, 104–119. [Google Scholar] [CrossRef]
  21. Mahmood, K.; Pinkerton, A.J. Direct laser deposition with different types of 316L steel particle: A comparative study of final part properties. J. Eng. Manuf. 2013, 227, 520–531. [Google Scholar] [CrossRef]
  22. Demir, A.G. Micro laser metal wire deposition for additive manufacturing of thin-walled structures. Opt. Lasers Eng. 2018, 100, 9–17. [Google Scholar] [CrossRef]
  23. Christiansson, A.; Lennartson, B. Height control of laser metal-wire deposition based on iterative learning control and 3D scanning. Opt. Lasers Eng. J. 2012, 50, 1230–1241. [Google Scholar]
  24. Gong, X.; Luo, J.; Hu, D. Effect of scanning path on temperature field in laser cladding. IOP Conf. Ser. Mater. Sci. Eng. 2017, 207, 012039. [Google Scholar] [CrossRef] [Green Version]
  25. De Oliveira, U.; Ocelík, V.; De Hosson, J.T.M. Analysis of coaxial laser cladding processing conditions. Surf. Coatings Technol. 2005, 197, 127–136. [Google Scholar] [CrossRef]
  26. Oliari, S.H.; Sofia, A.; Monteiro, C.; Schulz, M. Additive Manufacturing of H11 with Wire-Based Laser Metal Deposition. Soldag. Inspeção 2017, 22, 1–14. [Google Scholar] [CrossRef]
  27. Kaplan, A.F.H.; Groboth, G. Process Analysis of Laser Beam Cladding. J. Manuf. Sci. Eng. 2001, 123, 609–614. [Google Scholar] [CrossRef]
  28. Corbin, D.J.; Nassar, A.R.; Reutzel, E.W.; Beese, A.M.; Kistler, N.A. Effect of directed energy deposition processing parameters on laser deposited Inconel ® 718: External morphology. J. Laser Appl. 2017, 29, 022001. [Google Scholar] [CrossRef]
  29. Scipioni Bertoli, U.; Wolfer, A.J.; Matthews, M.J.; Delplanque, J.P.R.; Schoenung, J.M. On the limitations of Volumetric Energy Density as a design parameter for Selective Laser Melting. Mater. Des. 2017, 113, 331–340. [Google Scholar] [CrossRef] [Green Version]
  30. Wang, D.; Song, C.; Yang, Y.; Bai, Y. Investigation of crystal growth mechanism during selective laser melting and mechanical property characterization of 316L stainless steel parts. Mater. Des. 2016, 100, 291–299. [Google Scholar] [CrossRef]
Figure 1. Images of (a) laserdyne 430; (b) deposition head; (c) SEM micrograph of 316L particles and (d) volumetric particle size distribution.
Metals 09 01160 g001
Figure 2. Schematic representation of (a) circular contour and (b) circular overlap sample.
Metals 09 01160 g002
Figure 3. AISI 316L process parameter window through single tracks classification.
Metals 09 01160 g003
Figure 4. Optical micrographs of cross-sections of the circular contour samples.
Metals 09 01160 g004
Figure 5. (a) Schematic representation of a metal bead with the geometrical features, (b) geometrical features of circular contour samples realised with (b) 300 W and (c) 600 W (S1 solid and S2 open symbols). Continuous lines represent the geometrical feature of the single scan track obtained with the same parameters. (d) Powder efficiency (Pe) of circular contour melt pool.
Metals 09 01160 g005
Figure 6. Optical micrographs of circular overlap samples.
Metals 09 01160 g006
Figure 7. Micro Vickers maps: Circular contour samples.
Metals 09 01160 g007
Figure 8. Micro Vickers maps of (a) circular overlap samples built with 300 W, 70% overlap and S2; (b) circular with overlap samples built with 300 W, 50% overlap and S2.
Metals 09 01160 g008
Table 1. Full factorial design of experiments.
Evaluated LMD ParameterMin. LevelMax. LevelLevel Stepn° of Evaluated Levels
P (W)10010005019
F (mm/min)15015005027
Table 2. LMD parameters used for the sample’s deposition.
SampleProcess CombinationP (W)F (mm/min)Es (J/mm2)StrategyOverlap (% of the Nominal Track Width)
circular contourcombo 130045040S1, S2-
combo 260080
circular overlapcombo 33004504050–70%
combo 460080

