Quasi-Stationary Strength of ECAP-Processed Cu-Zr at 0.5 Tm


Abstract
:1. Introduction
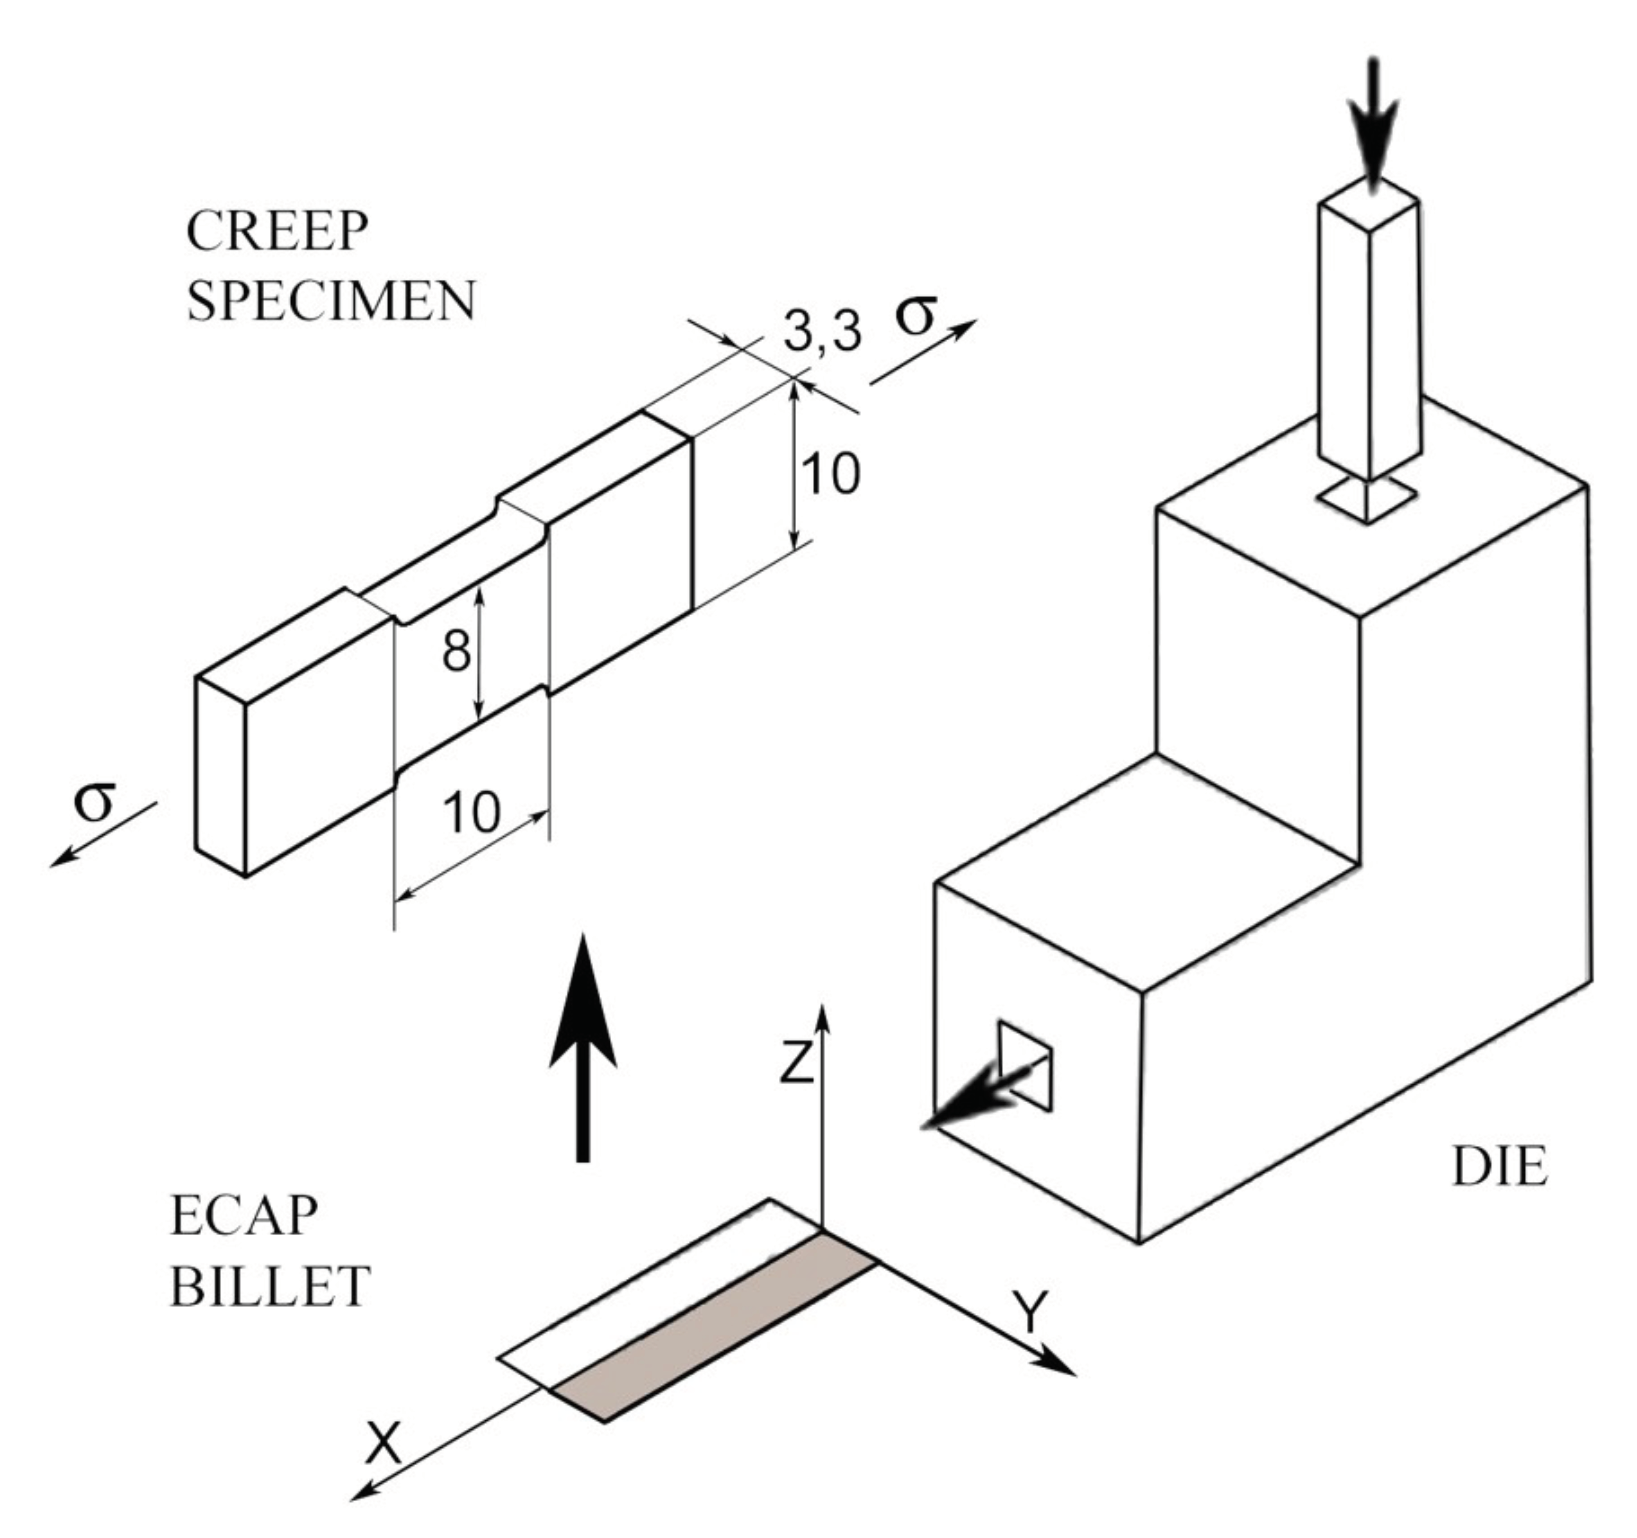
2. Experimental Details
3. Results
3.1. Influence of Predeformation
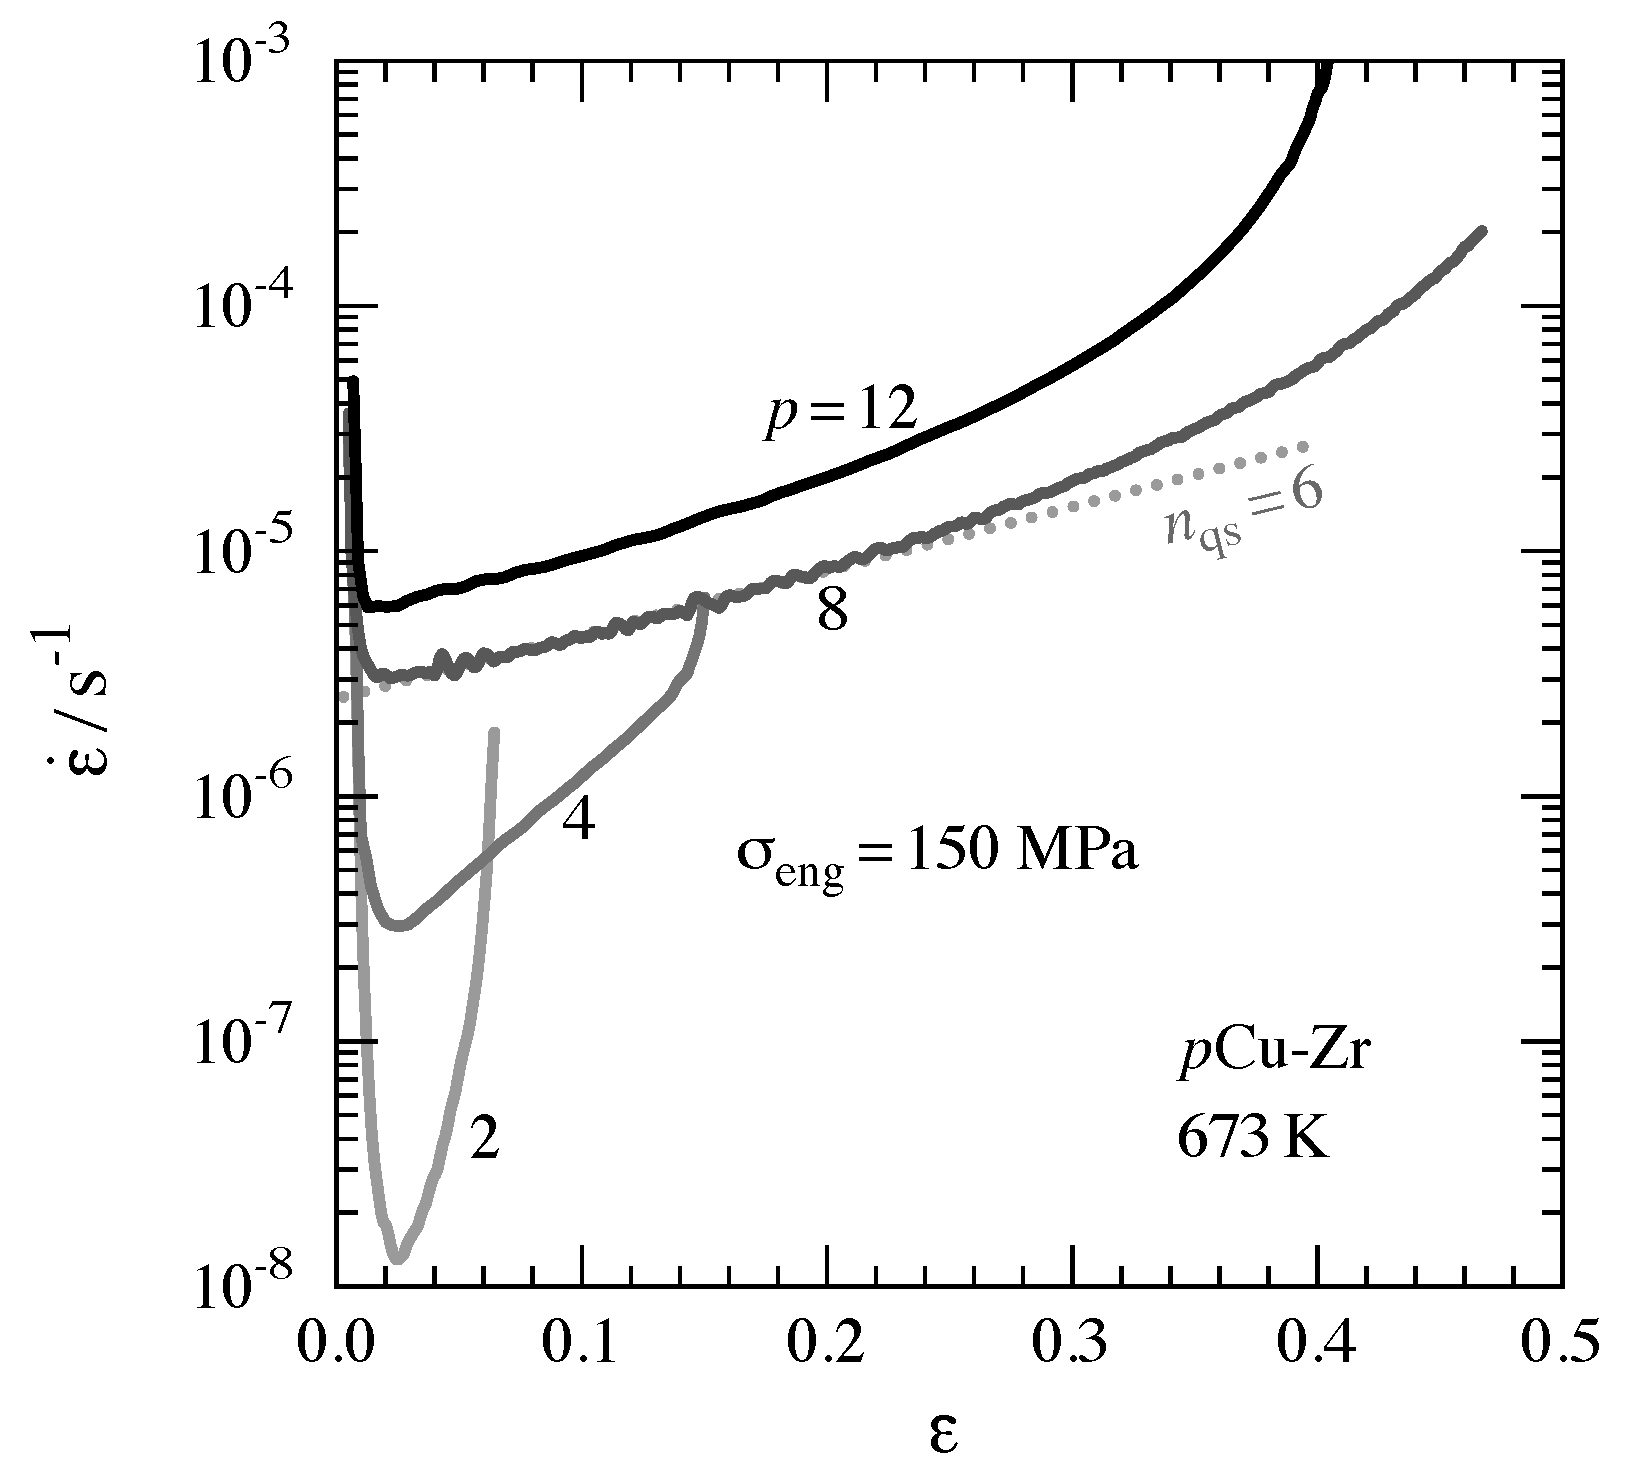
- the specimens of 8/12Cu-Zr begin to deform in their qs state right from low strains in the order of 0.02, and
- changes of boundary and particle structures are negligible.
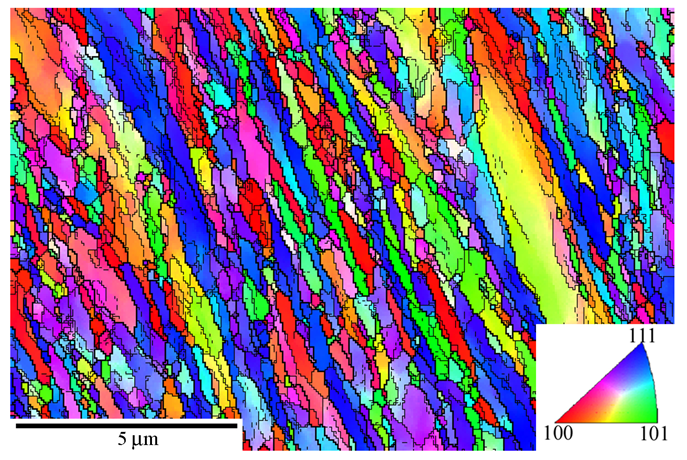
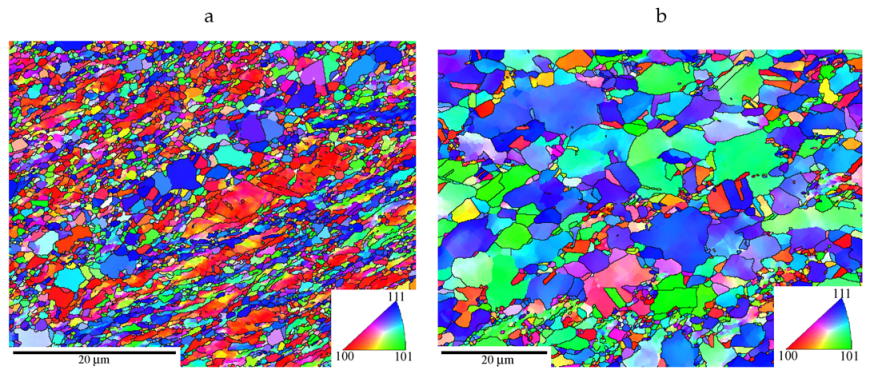
3.2. Microstructure of 8Cu-Zr
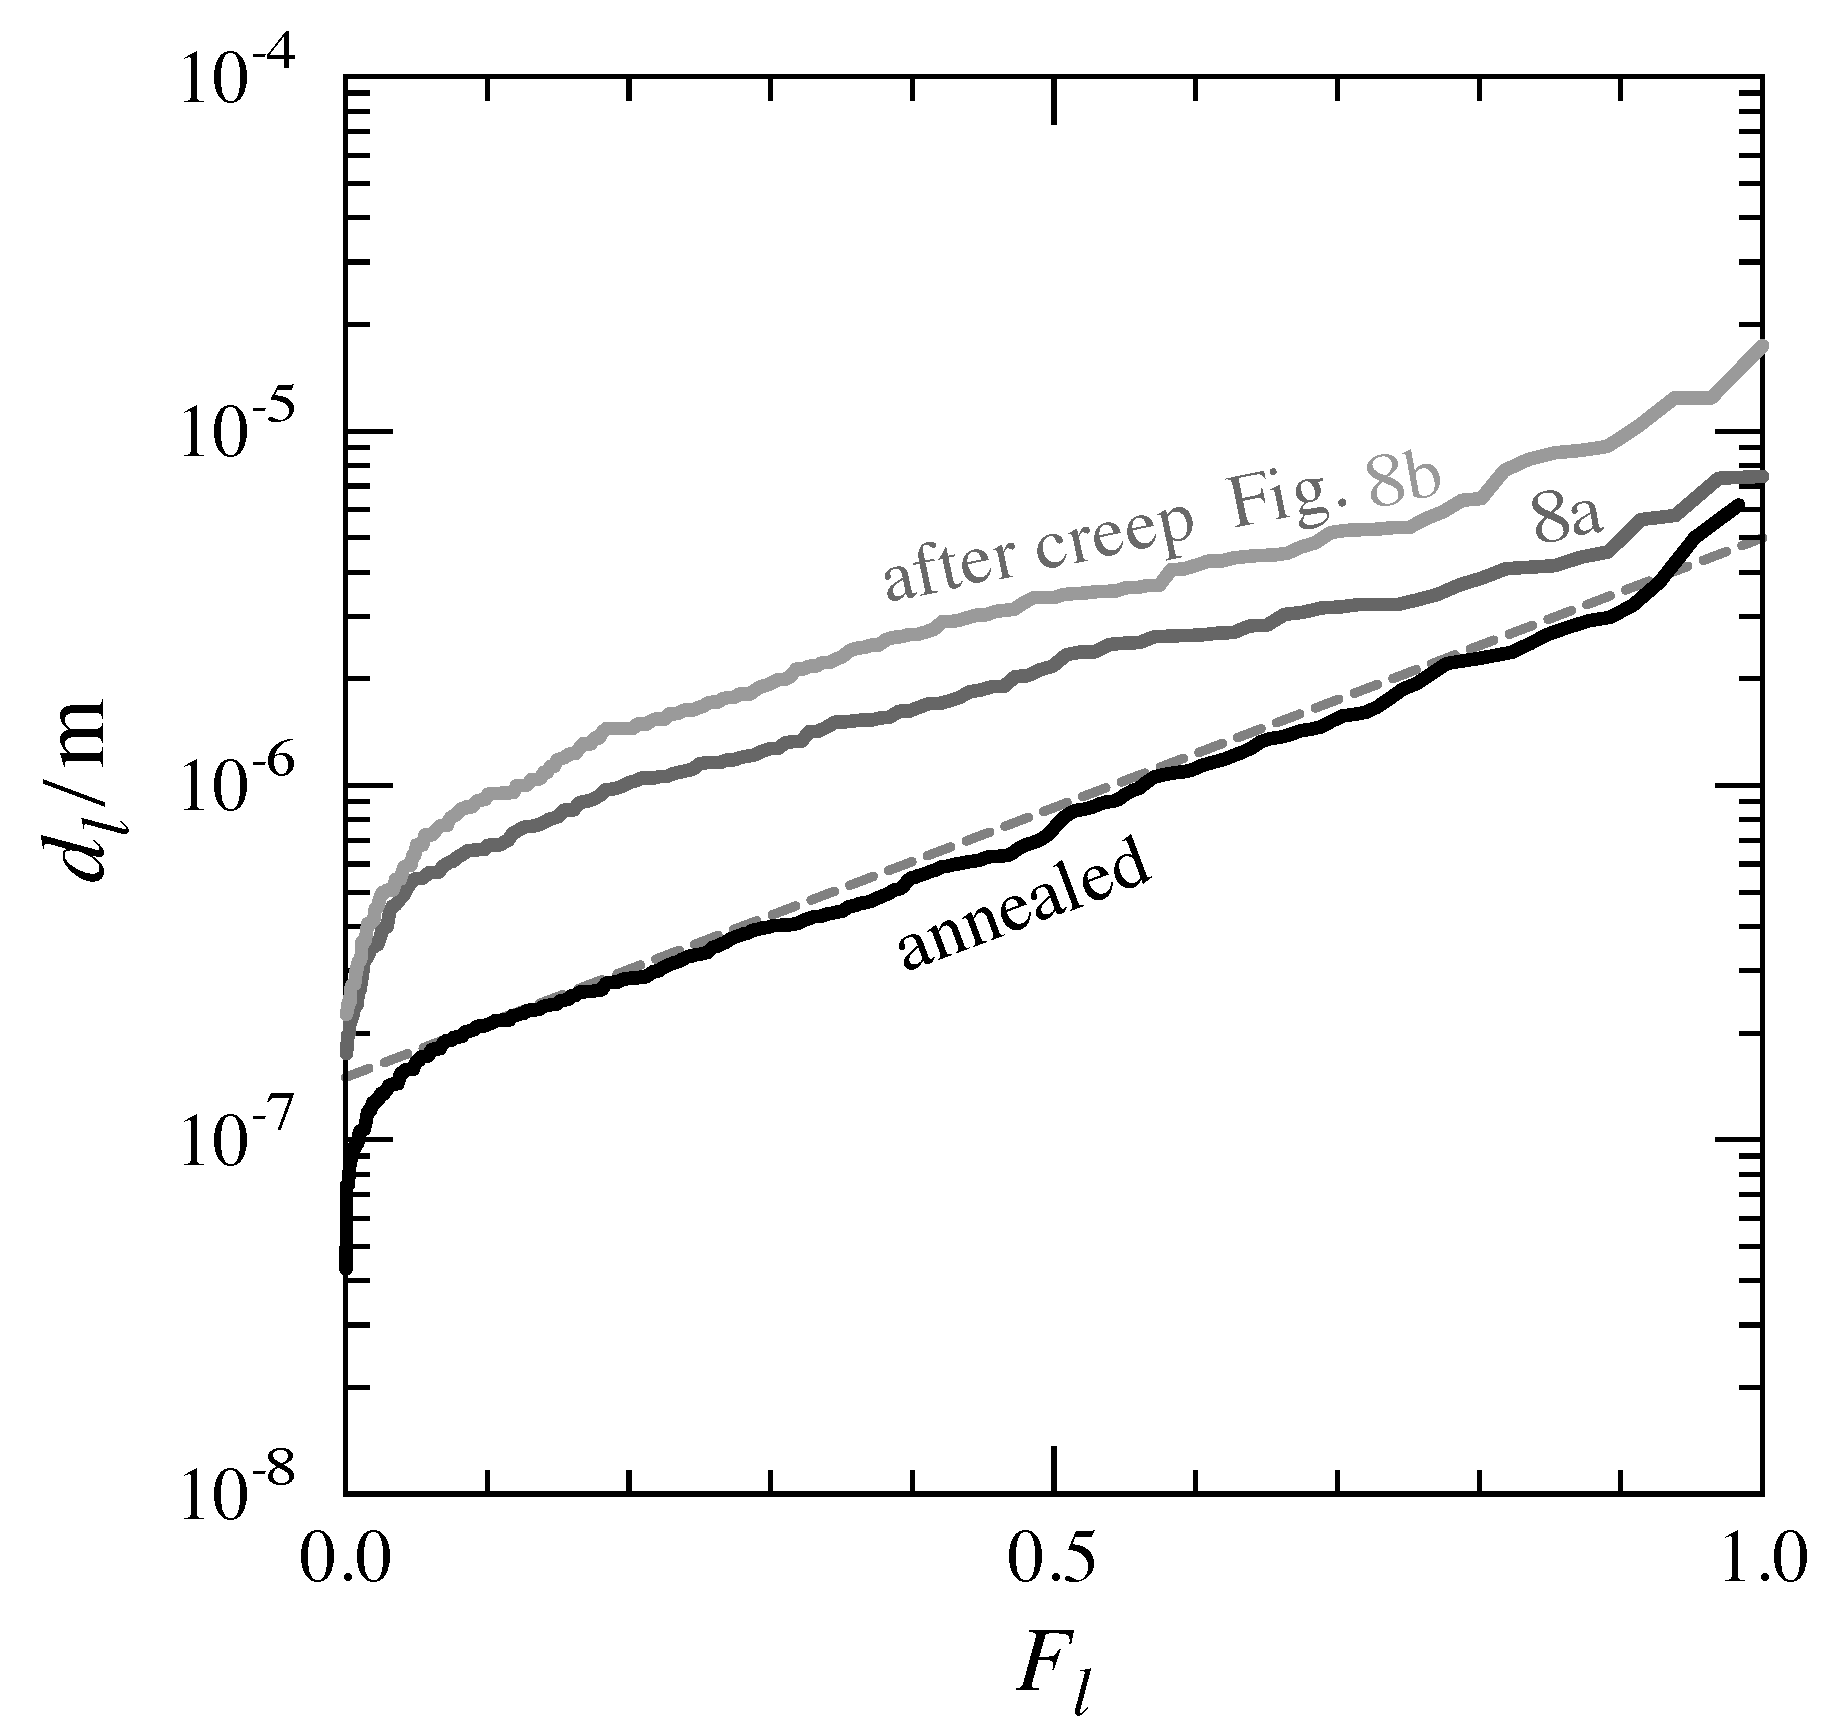
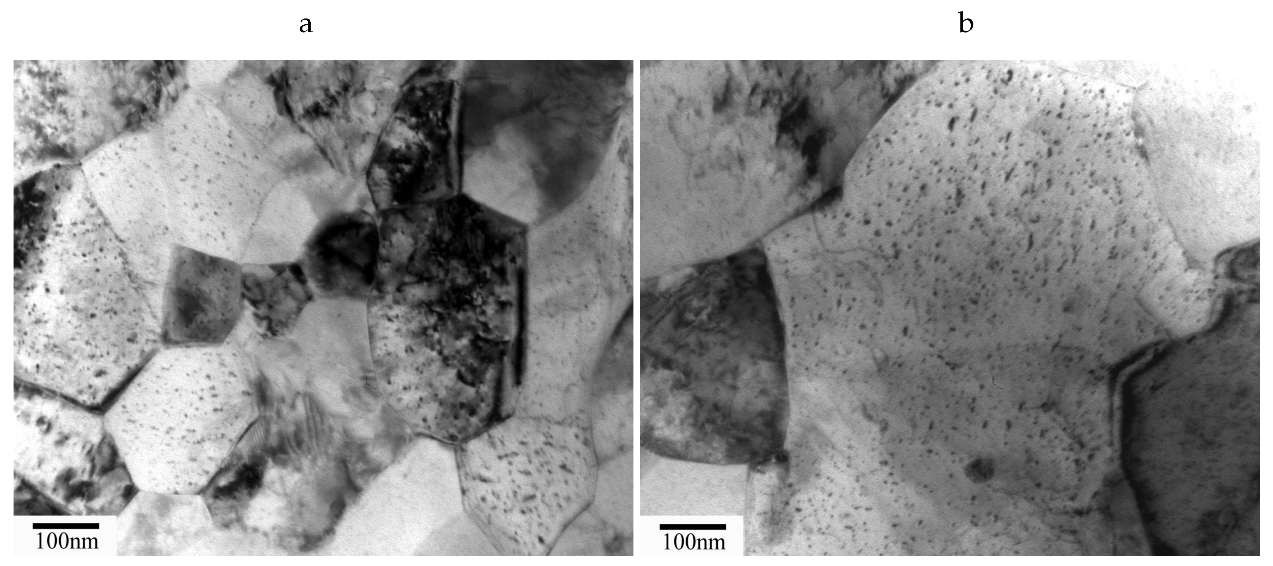
3.2.1. Before Creep
3.2.2. After Creep
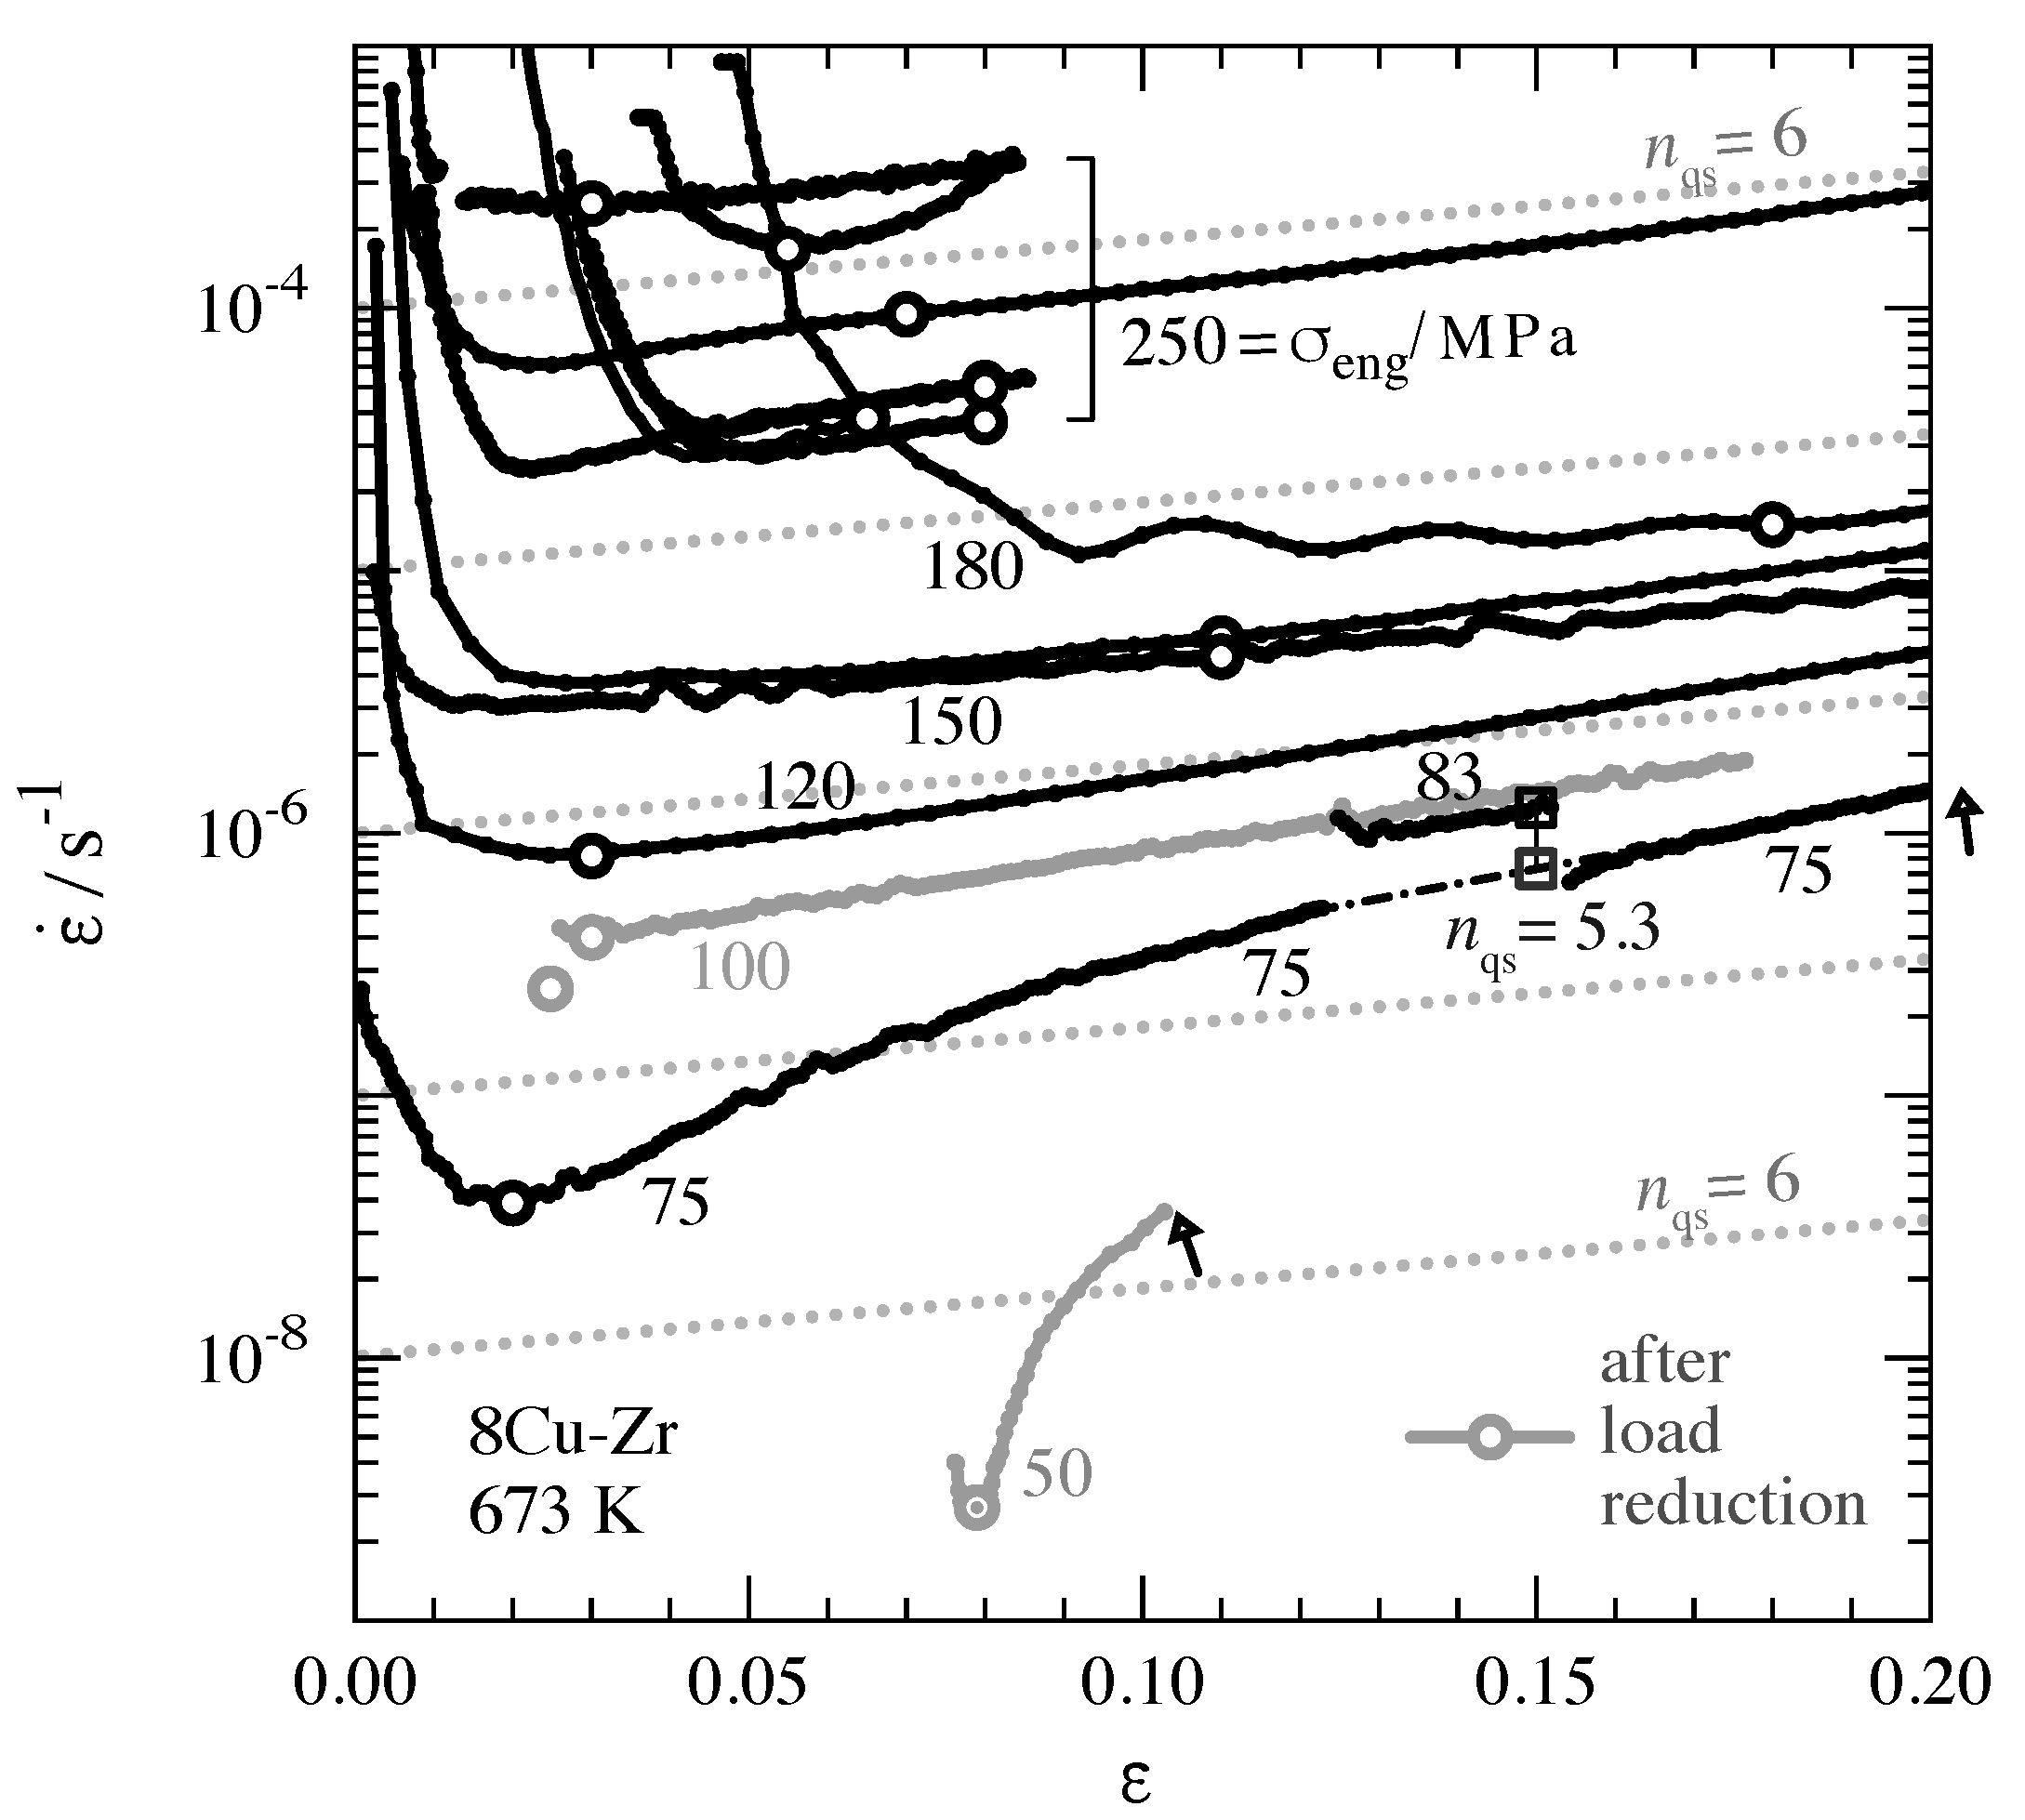
3.3. Strength Evolution of 8/12Cu-Zr with Strain
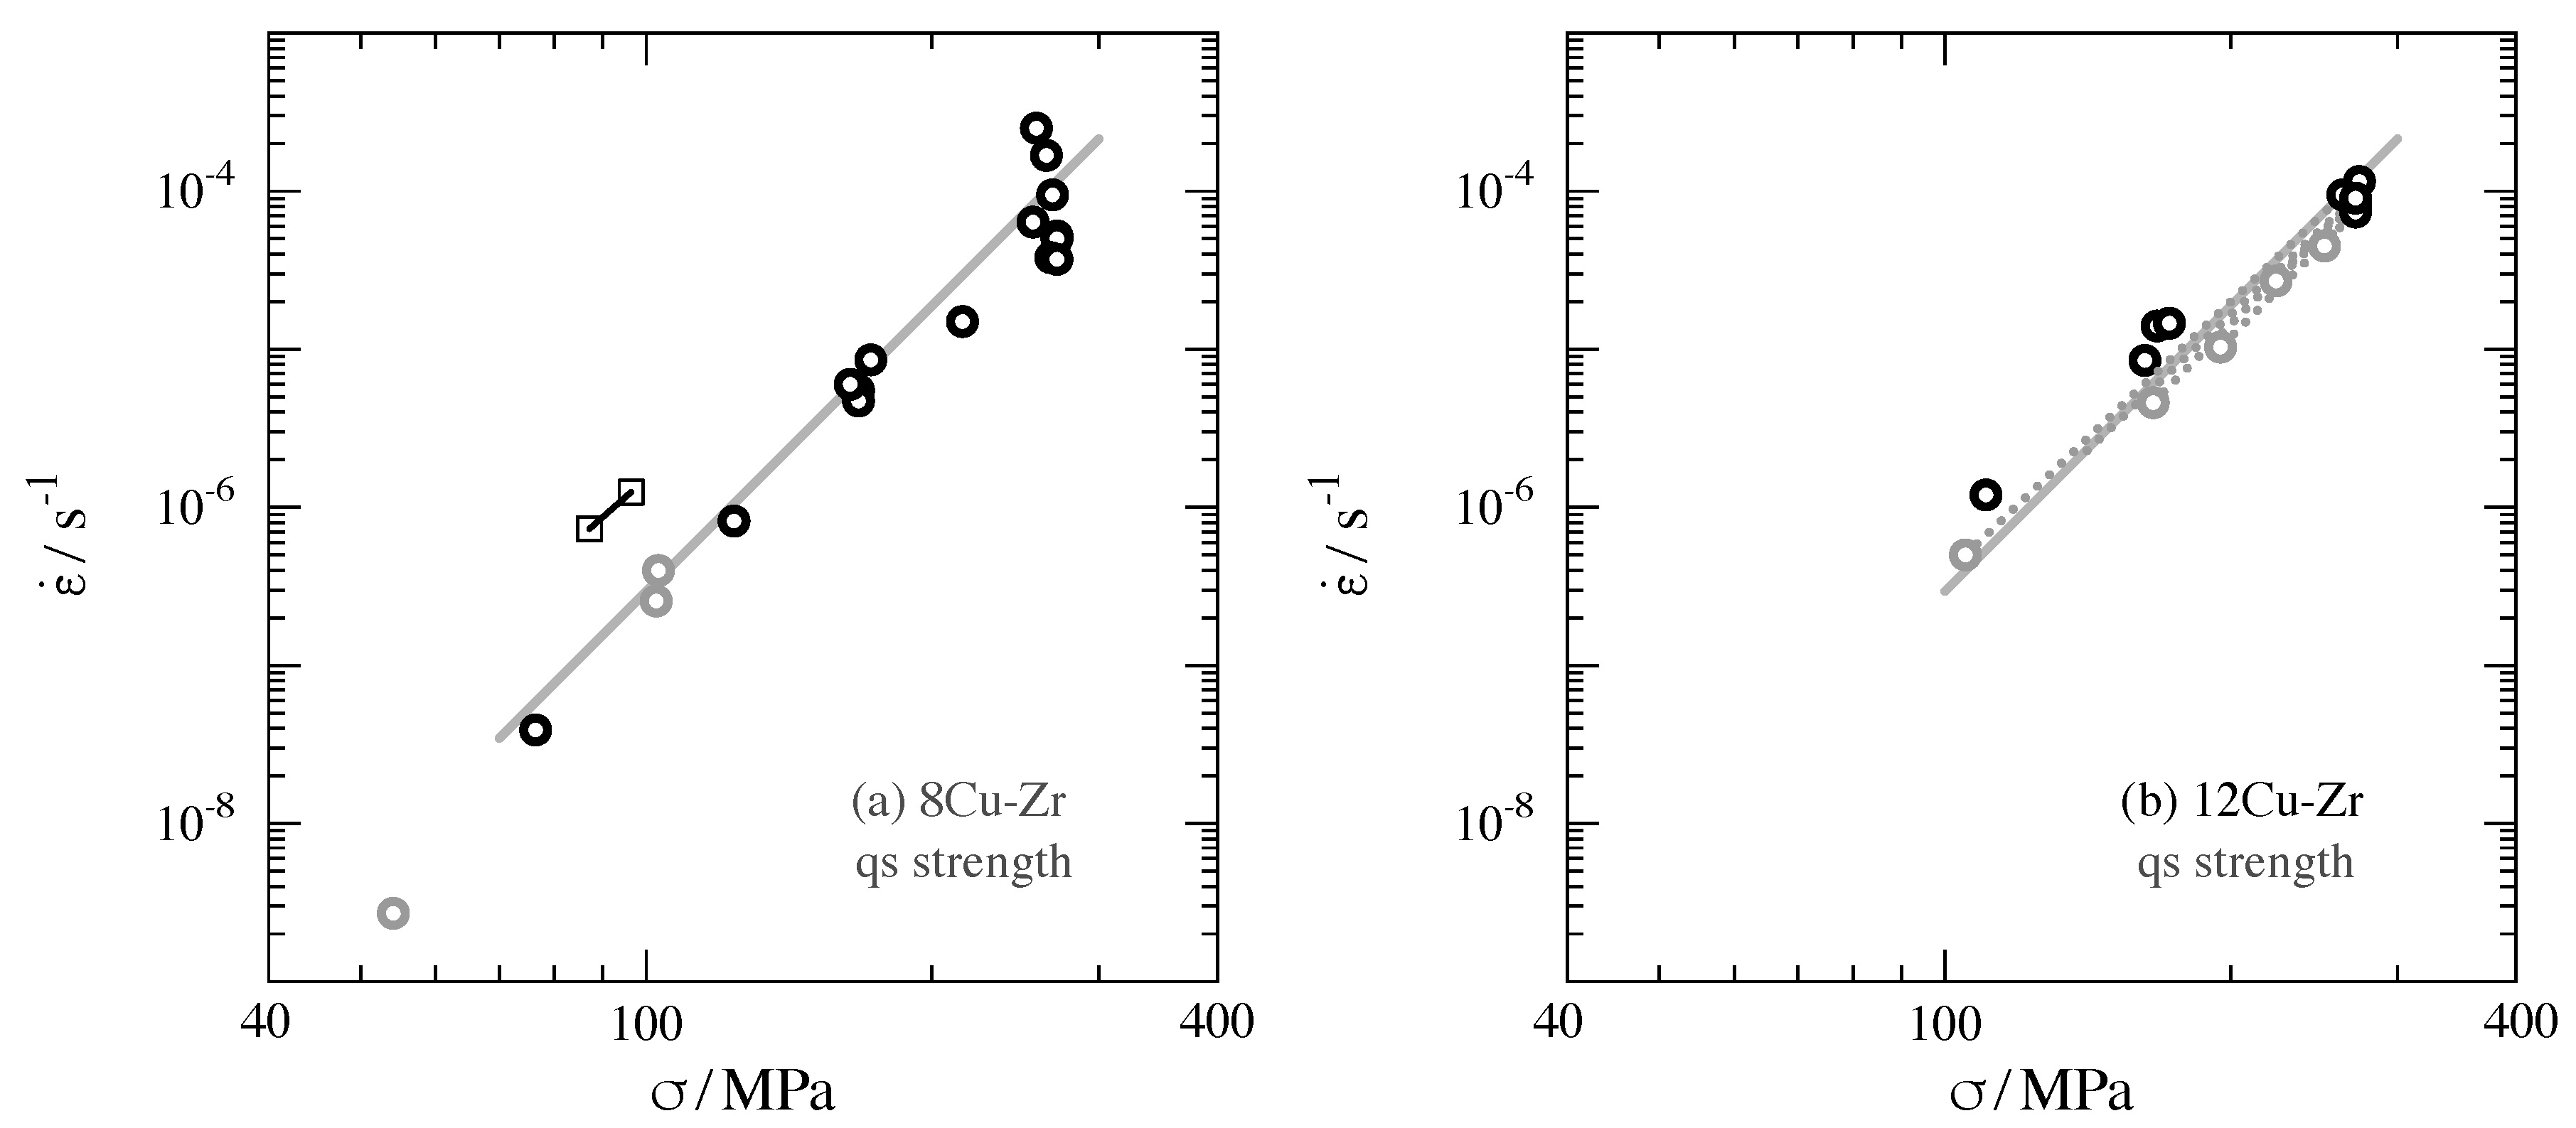
3.4. Quasi-Stationary Strength of 8/12Cu-Zr
- providing enough strain to fill the material with a qs dislocation structure (spacing of free dislocations and subgrain size) while
- avoiding grain coarsening at large strains.
4. Discussion
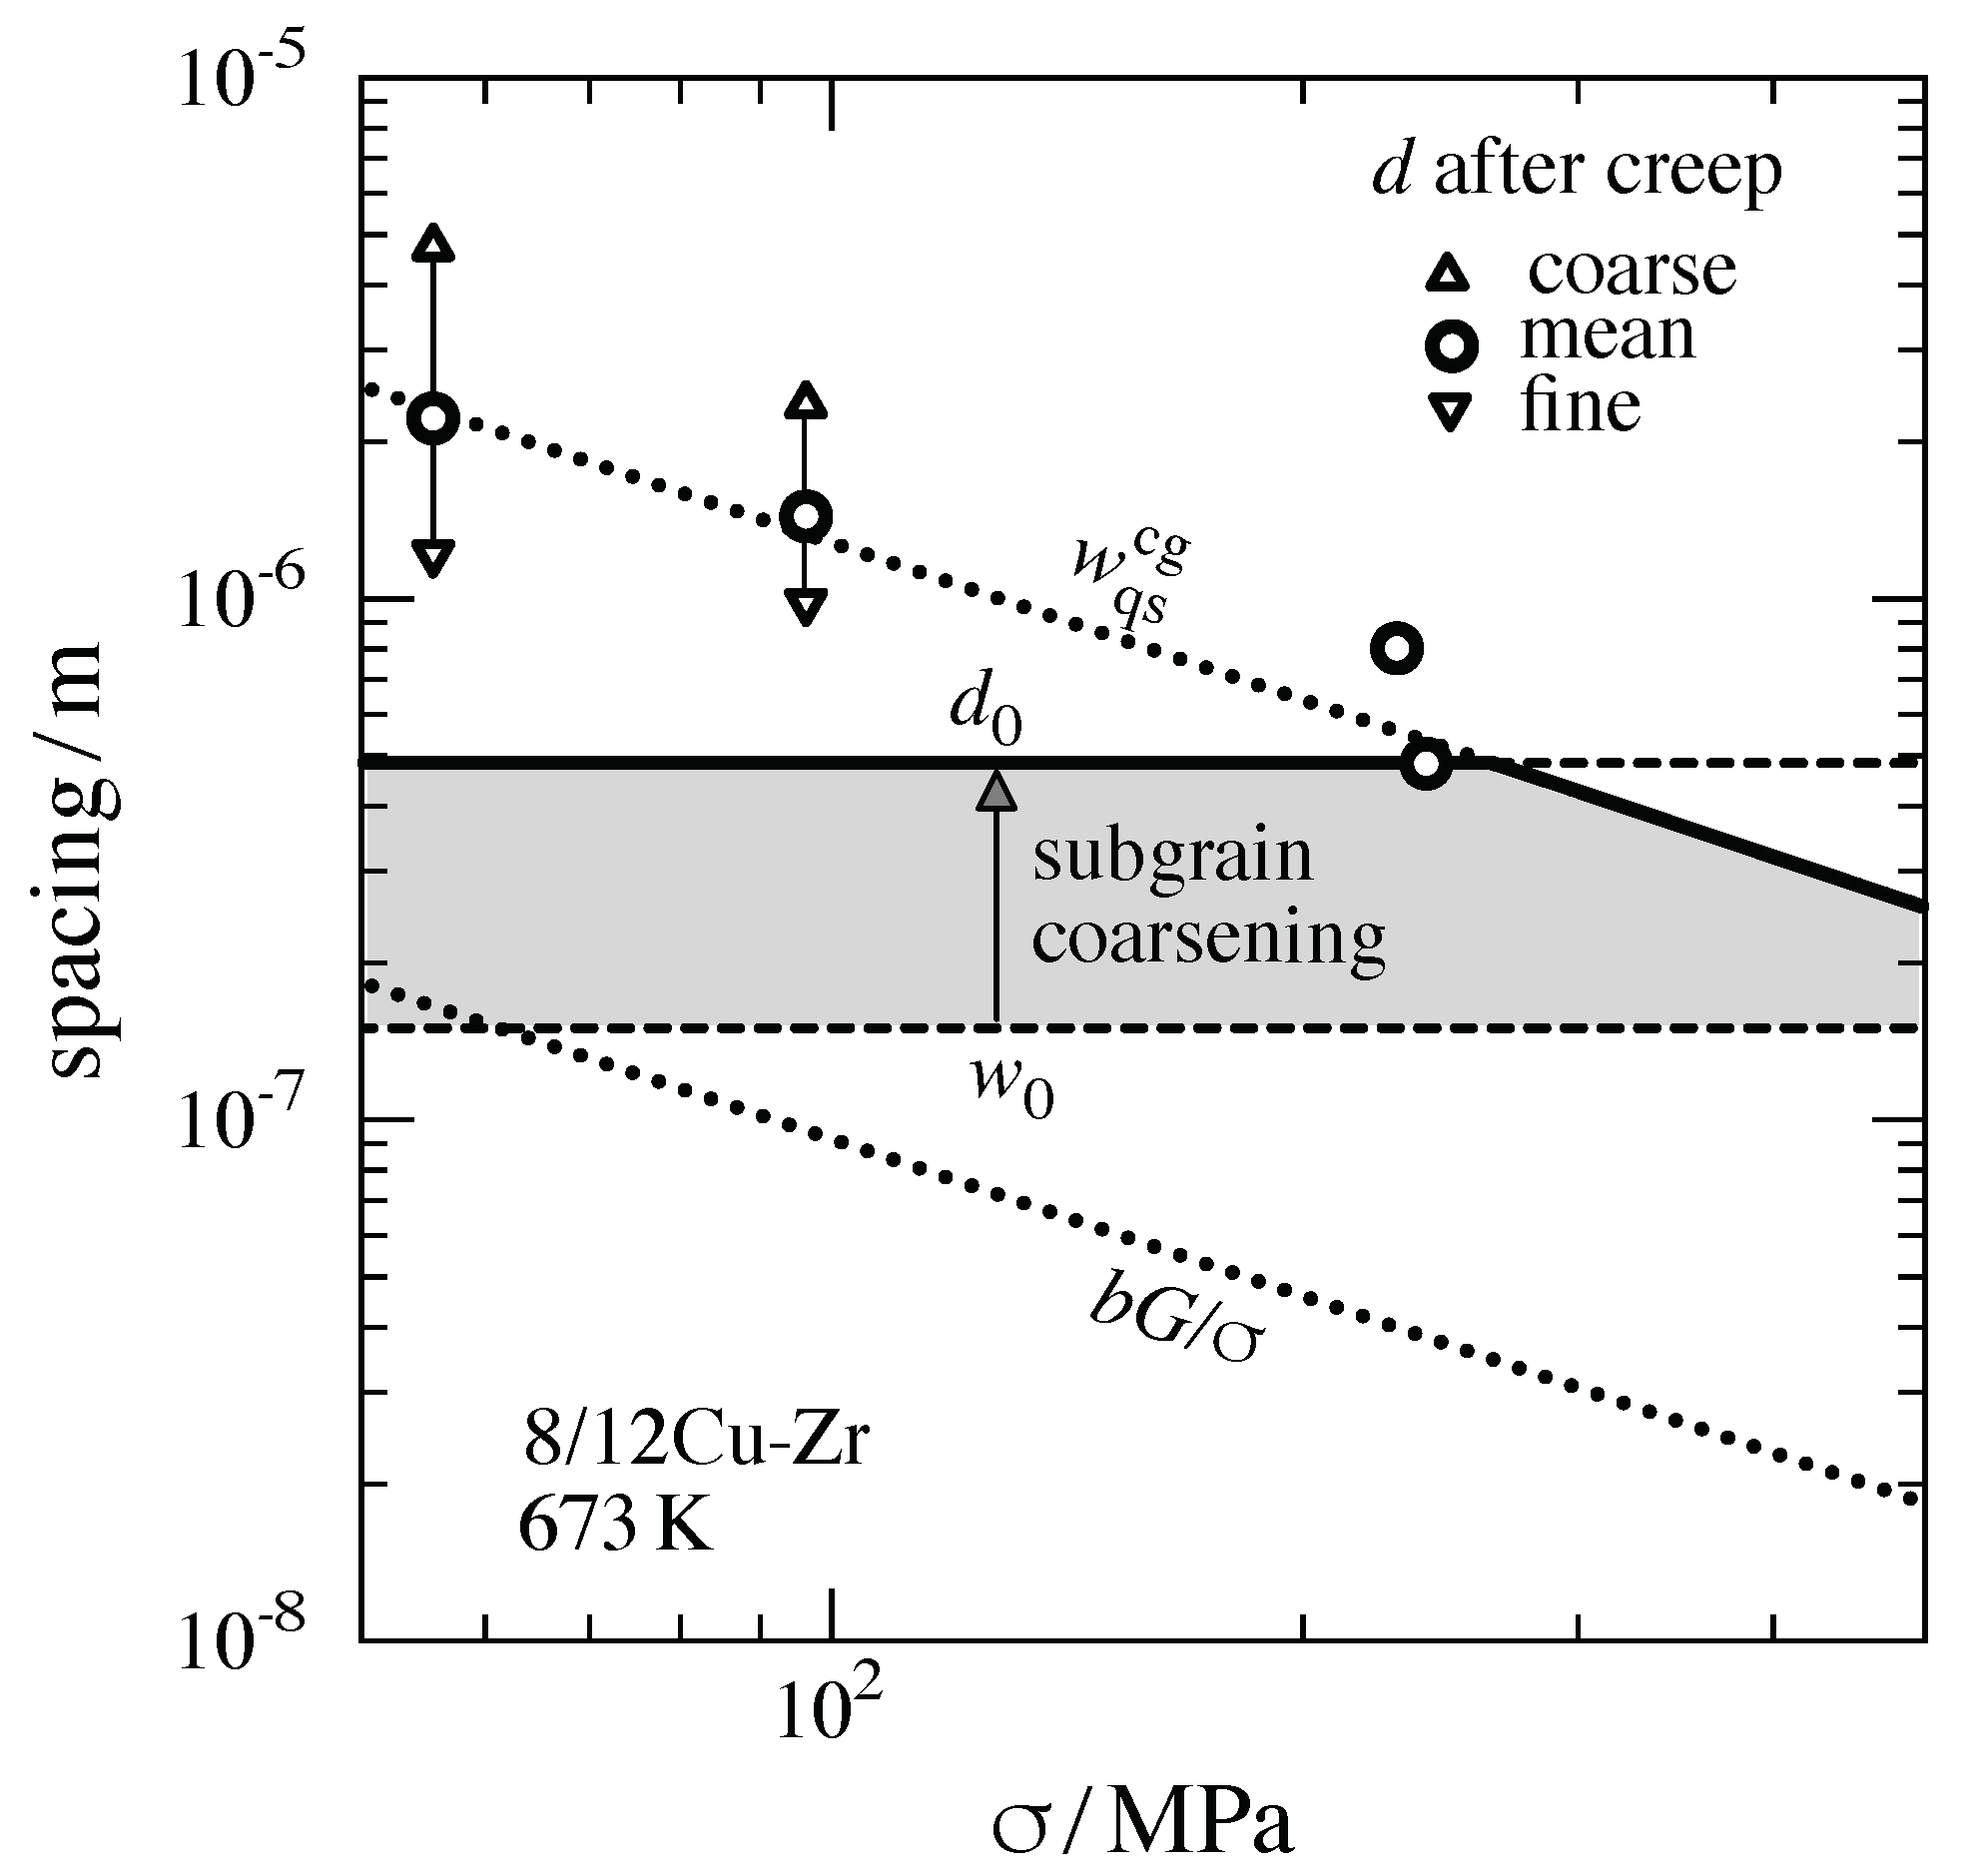
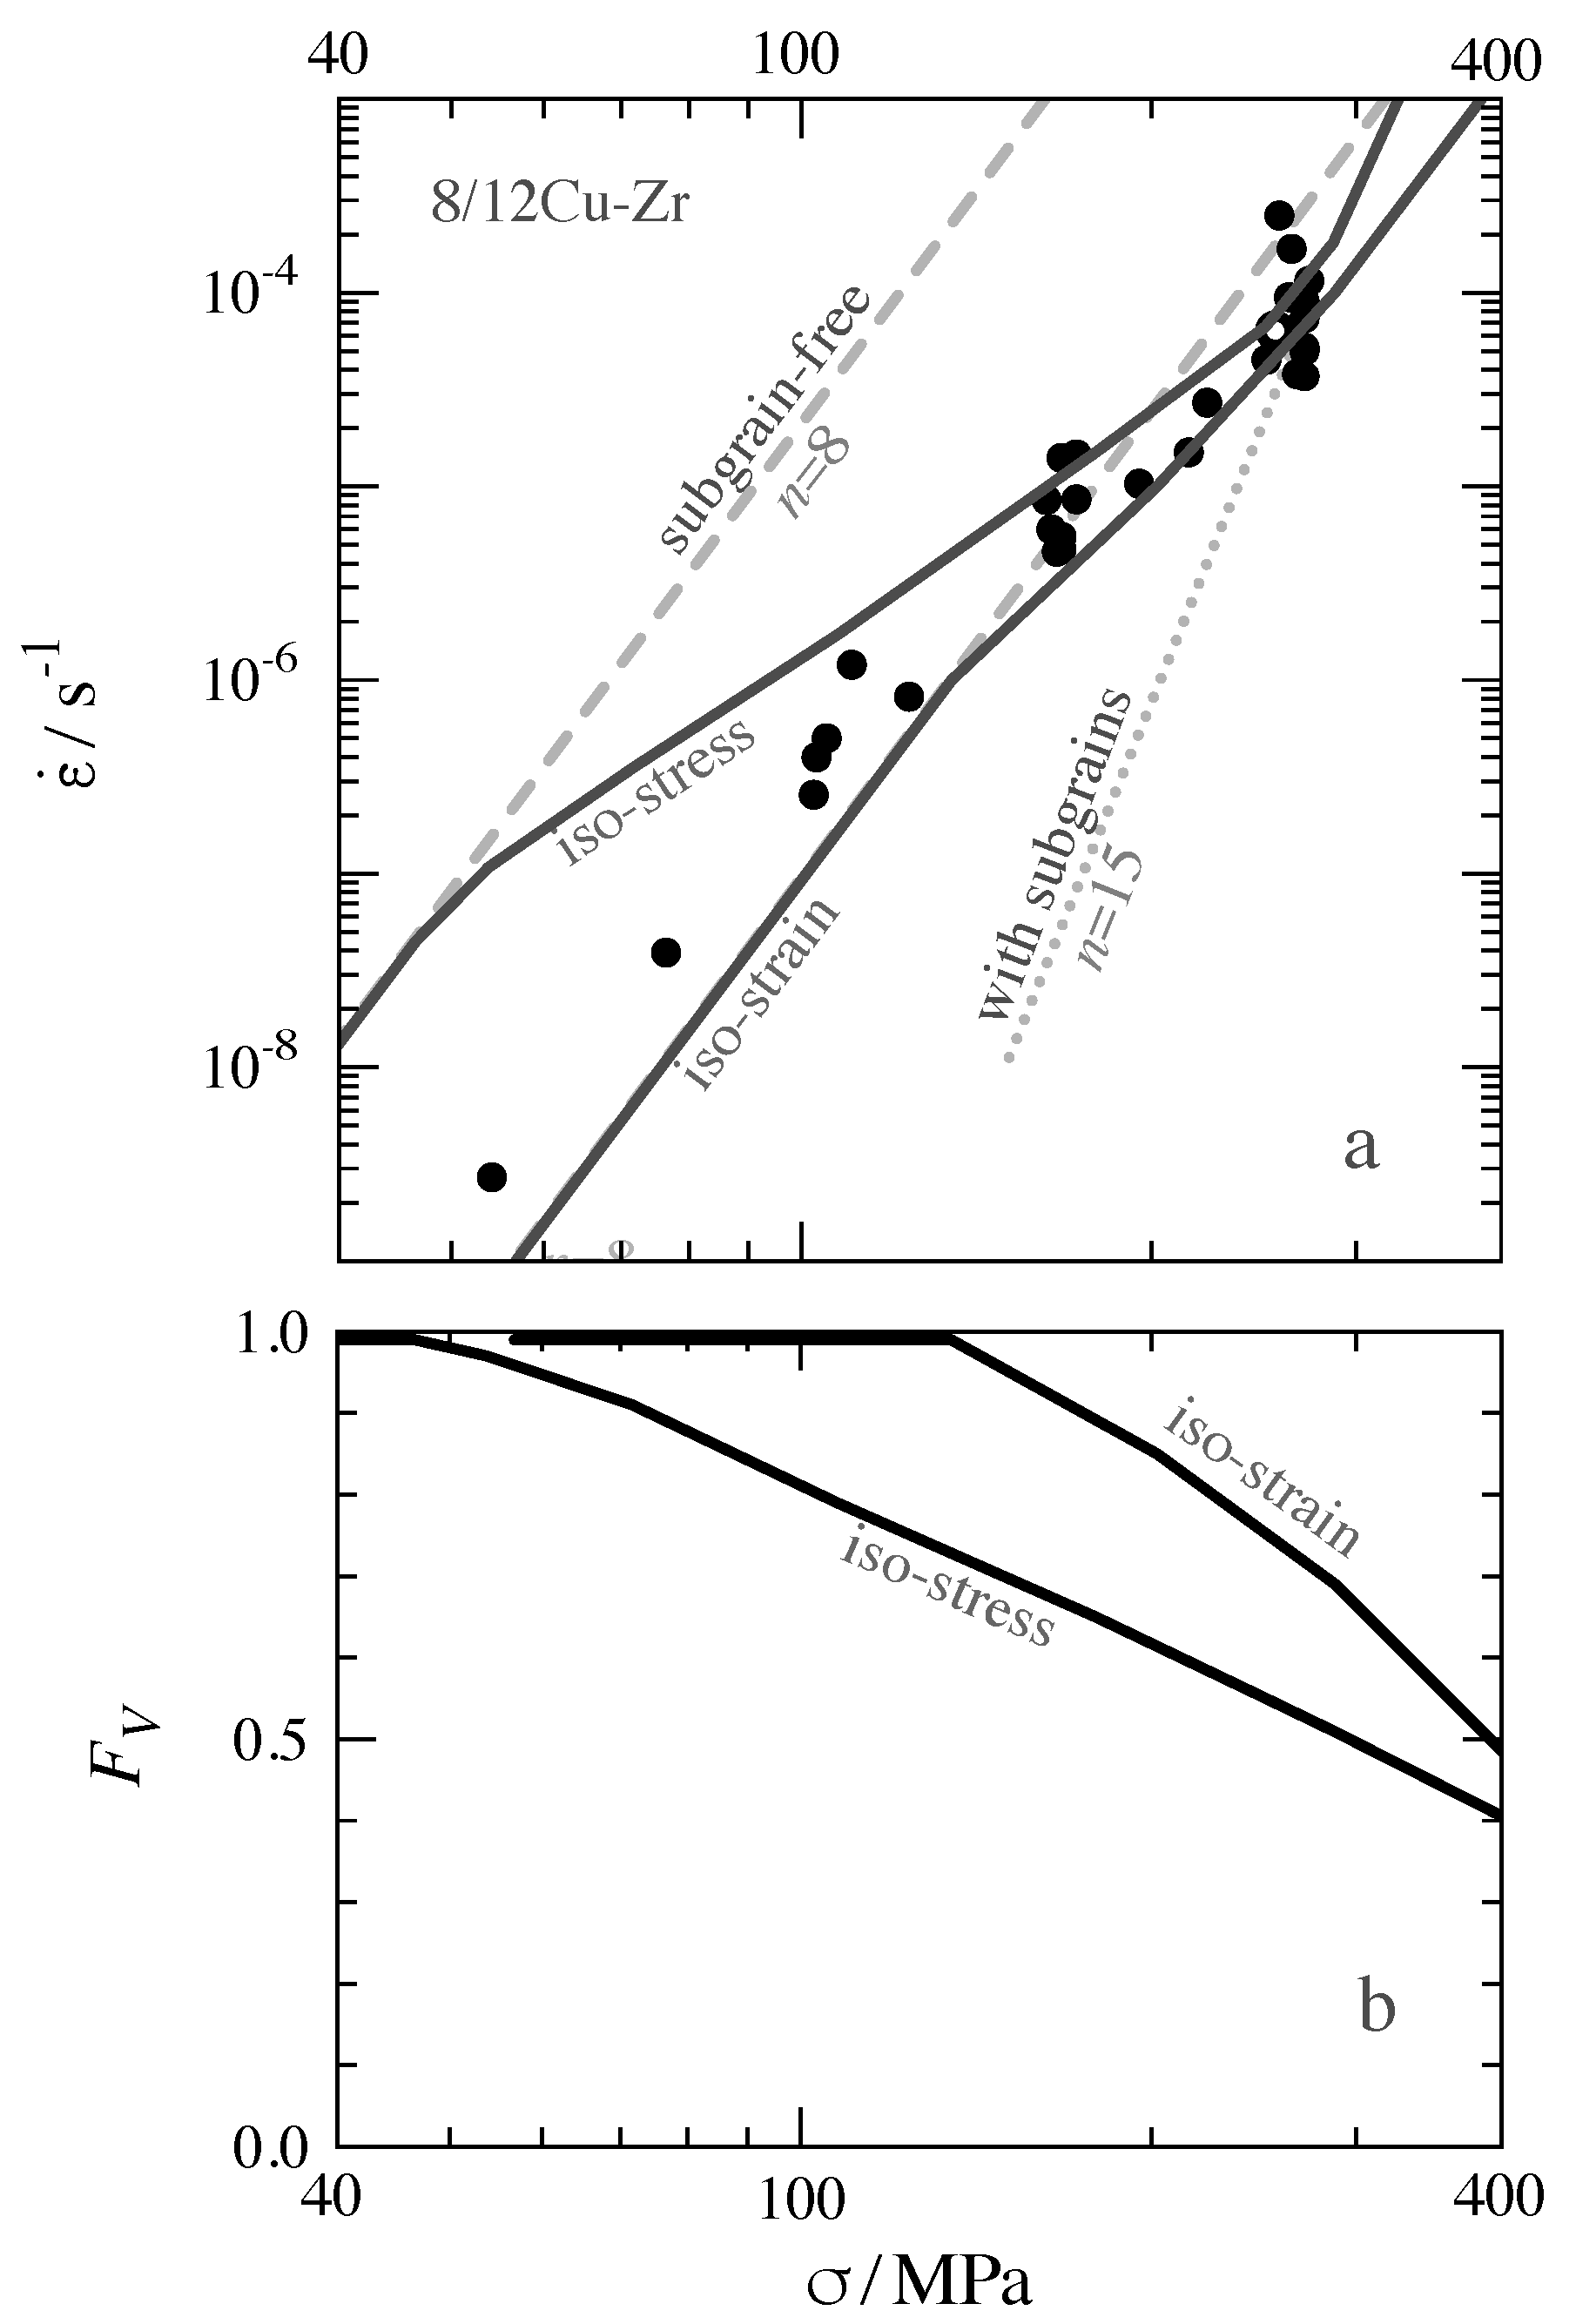
- The cumulative volume fraction with HAB-spacings is described by the thin straight line in Figure 9 (grey, dashed).
- The qs strength of subgrain-free grains is quantified by the relationfrom [27]; the f-factors were set to 0.19 (f-factors apply in the limiting case where all dislocations are lying at HABs, all are in dipolar configuration ready for recovery, and have unrelaxed stress fields; as this is unrealistic, f-values distinctly less than 1 are sensible). This choice yields the two dashed grey lines in Figure 14a for the present and the limiting assumptions of equal stress (iso-stress) or equal strain rate (iso-rate) in all grains.
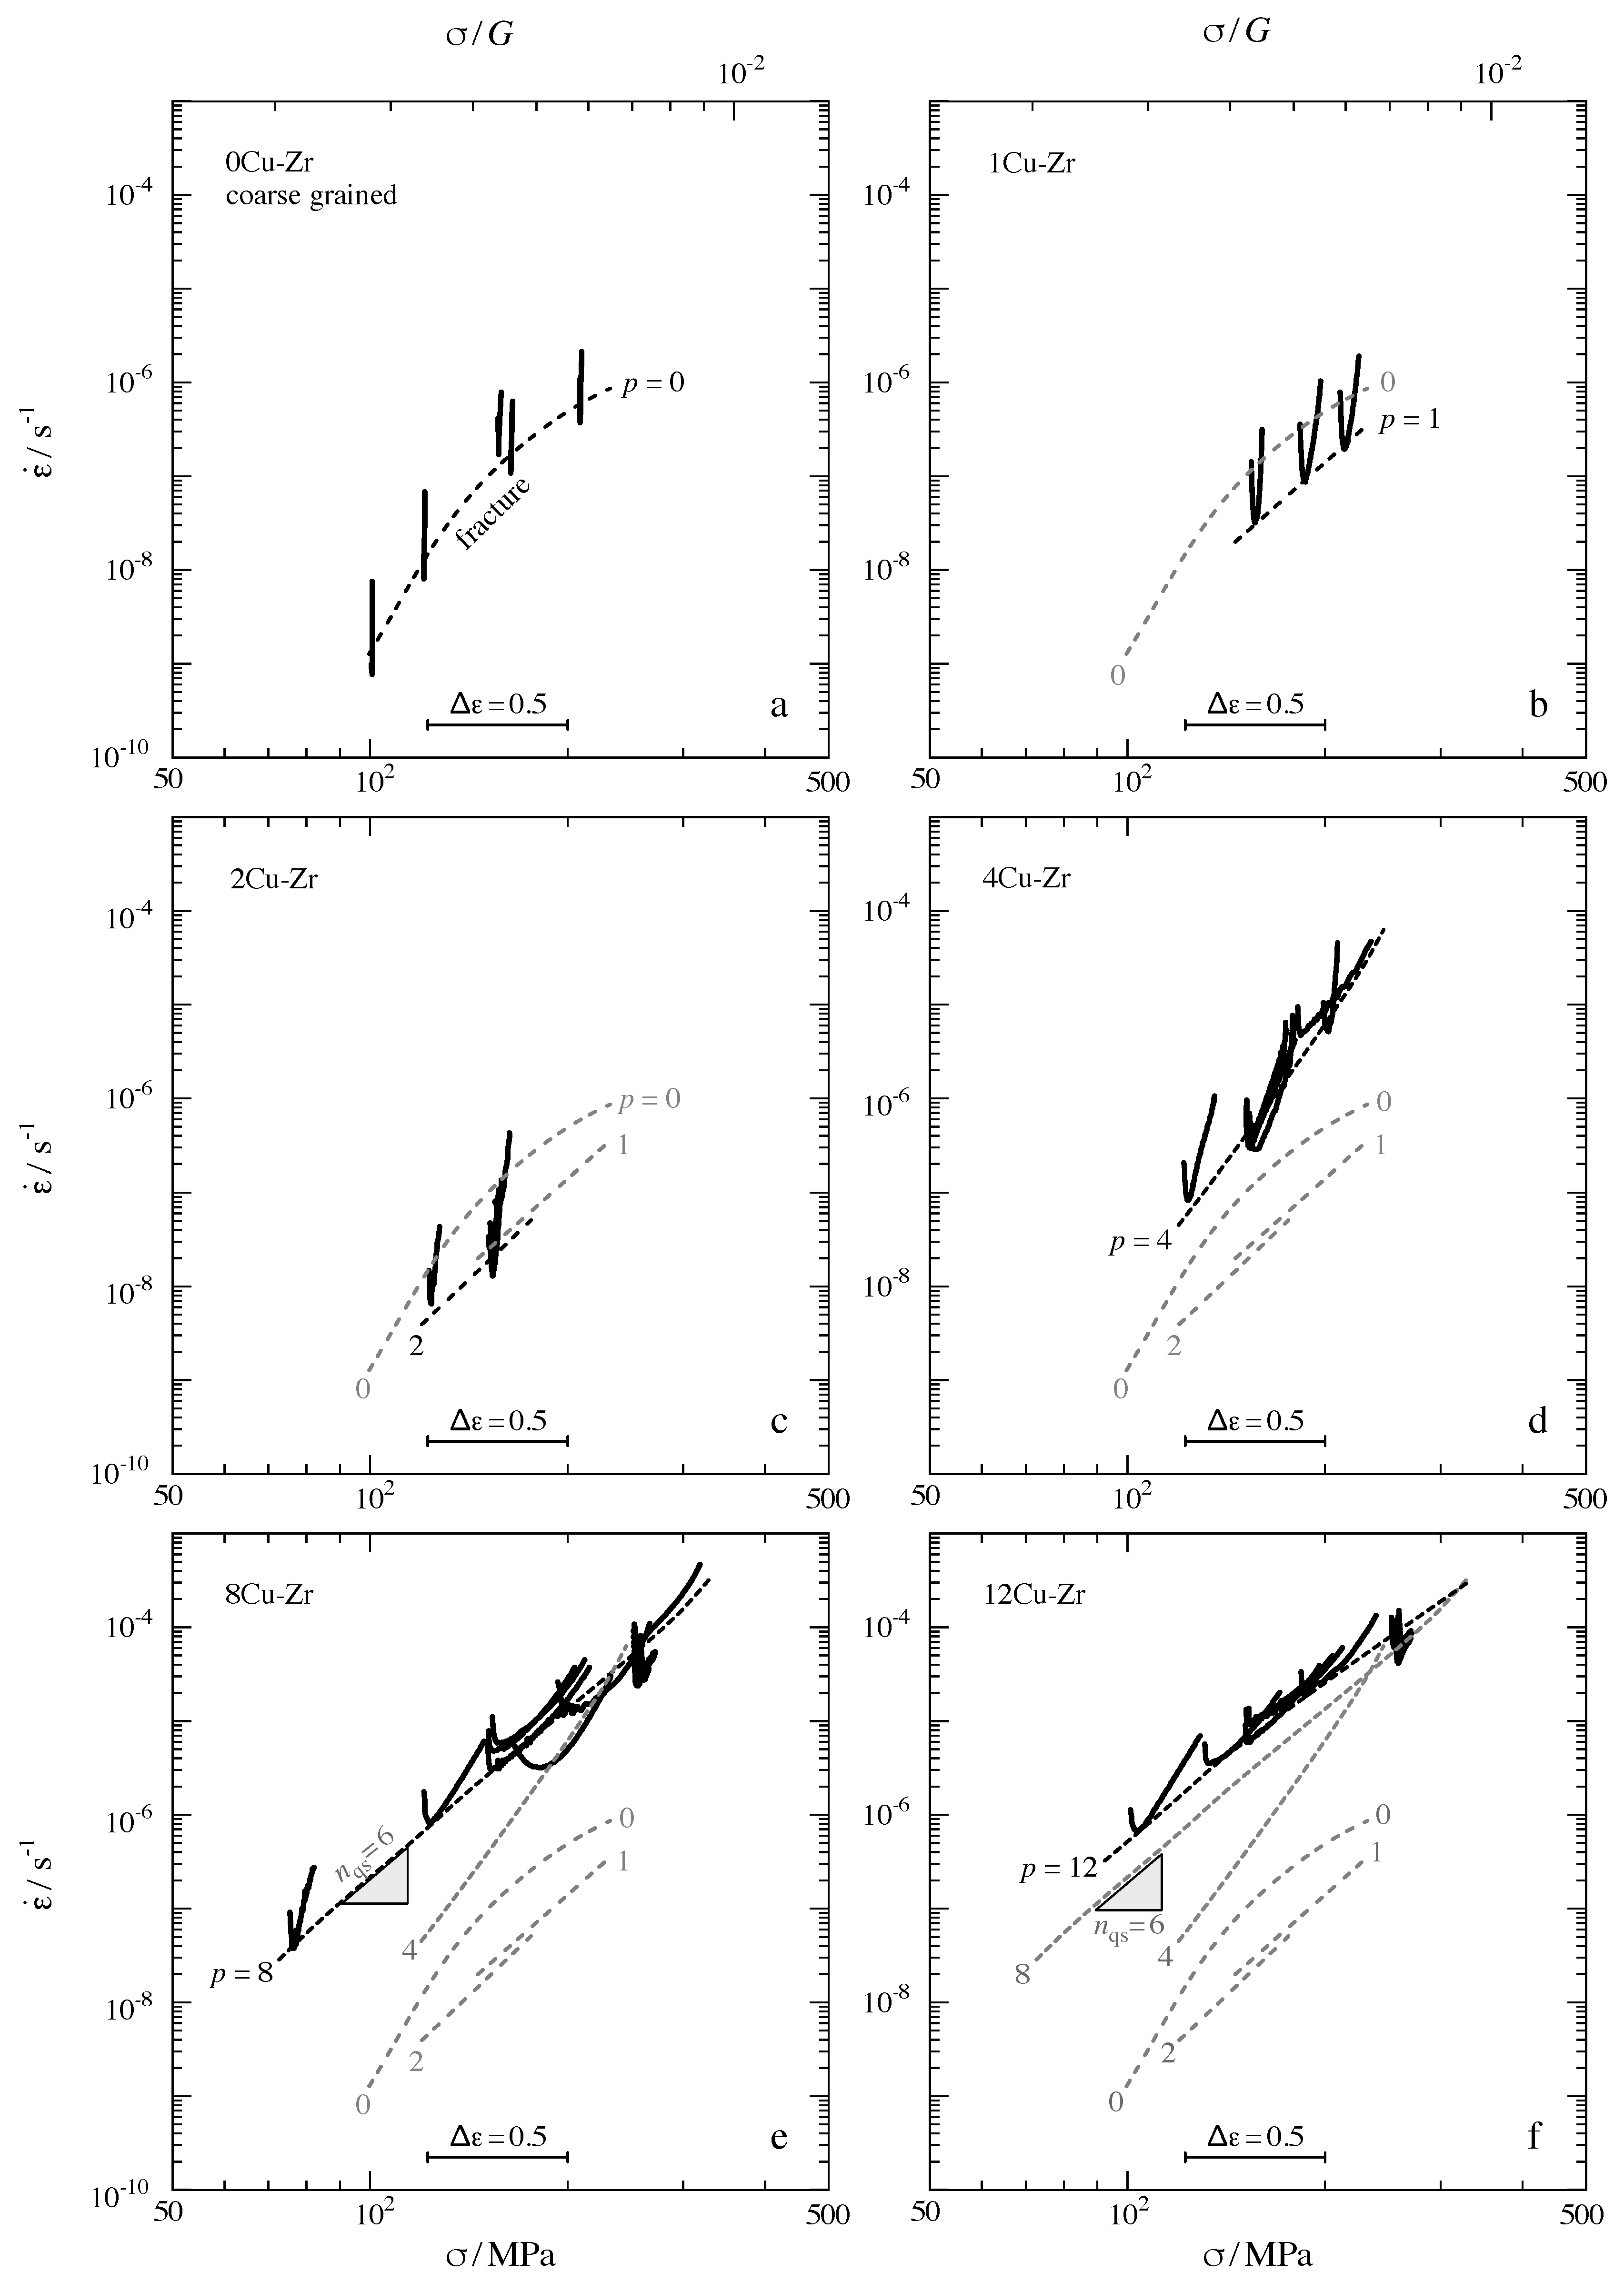
- The qs strength of crystal volumes with subgrains of size is estimated by the power law (dotted line in Figure 14a). The exponent 15 is motivated by the increase of with stress for (Figure 12). The position of the line is supported by the result for 2Cu-Zr in Figure 2: The grain size in 2Cu-Zr is so large that all grains contain subgrains; at 150 the upper bound of the initial qs strain rate of 2Cu-Zr is near s−1 (Figure 2 and Figure 3c); this is consistent with the (grey dotted) estimate for subgrain-containing grains in Figure 14a.
5. Summary
- The quasi-stationary (qs) strength of particle-strengthened ufg Cu-Zr prepared by ECAP and annealing was determined at in deformation (creep) at constant load.
- At increase of the fraction of high-angle boundaries (HABs) leads to softening and ductilization. So HABs have a net softening effect at test conditions.
- The (HAB) grain structure of ufg Cu-Zr is relatively stable at . At low dynamic grain coarsening sets in and leads to softening.
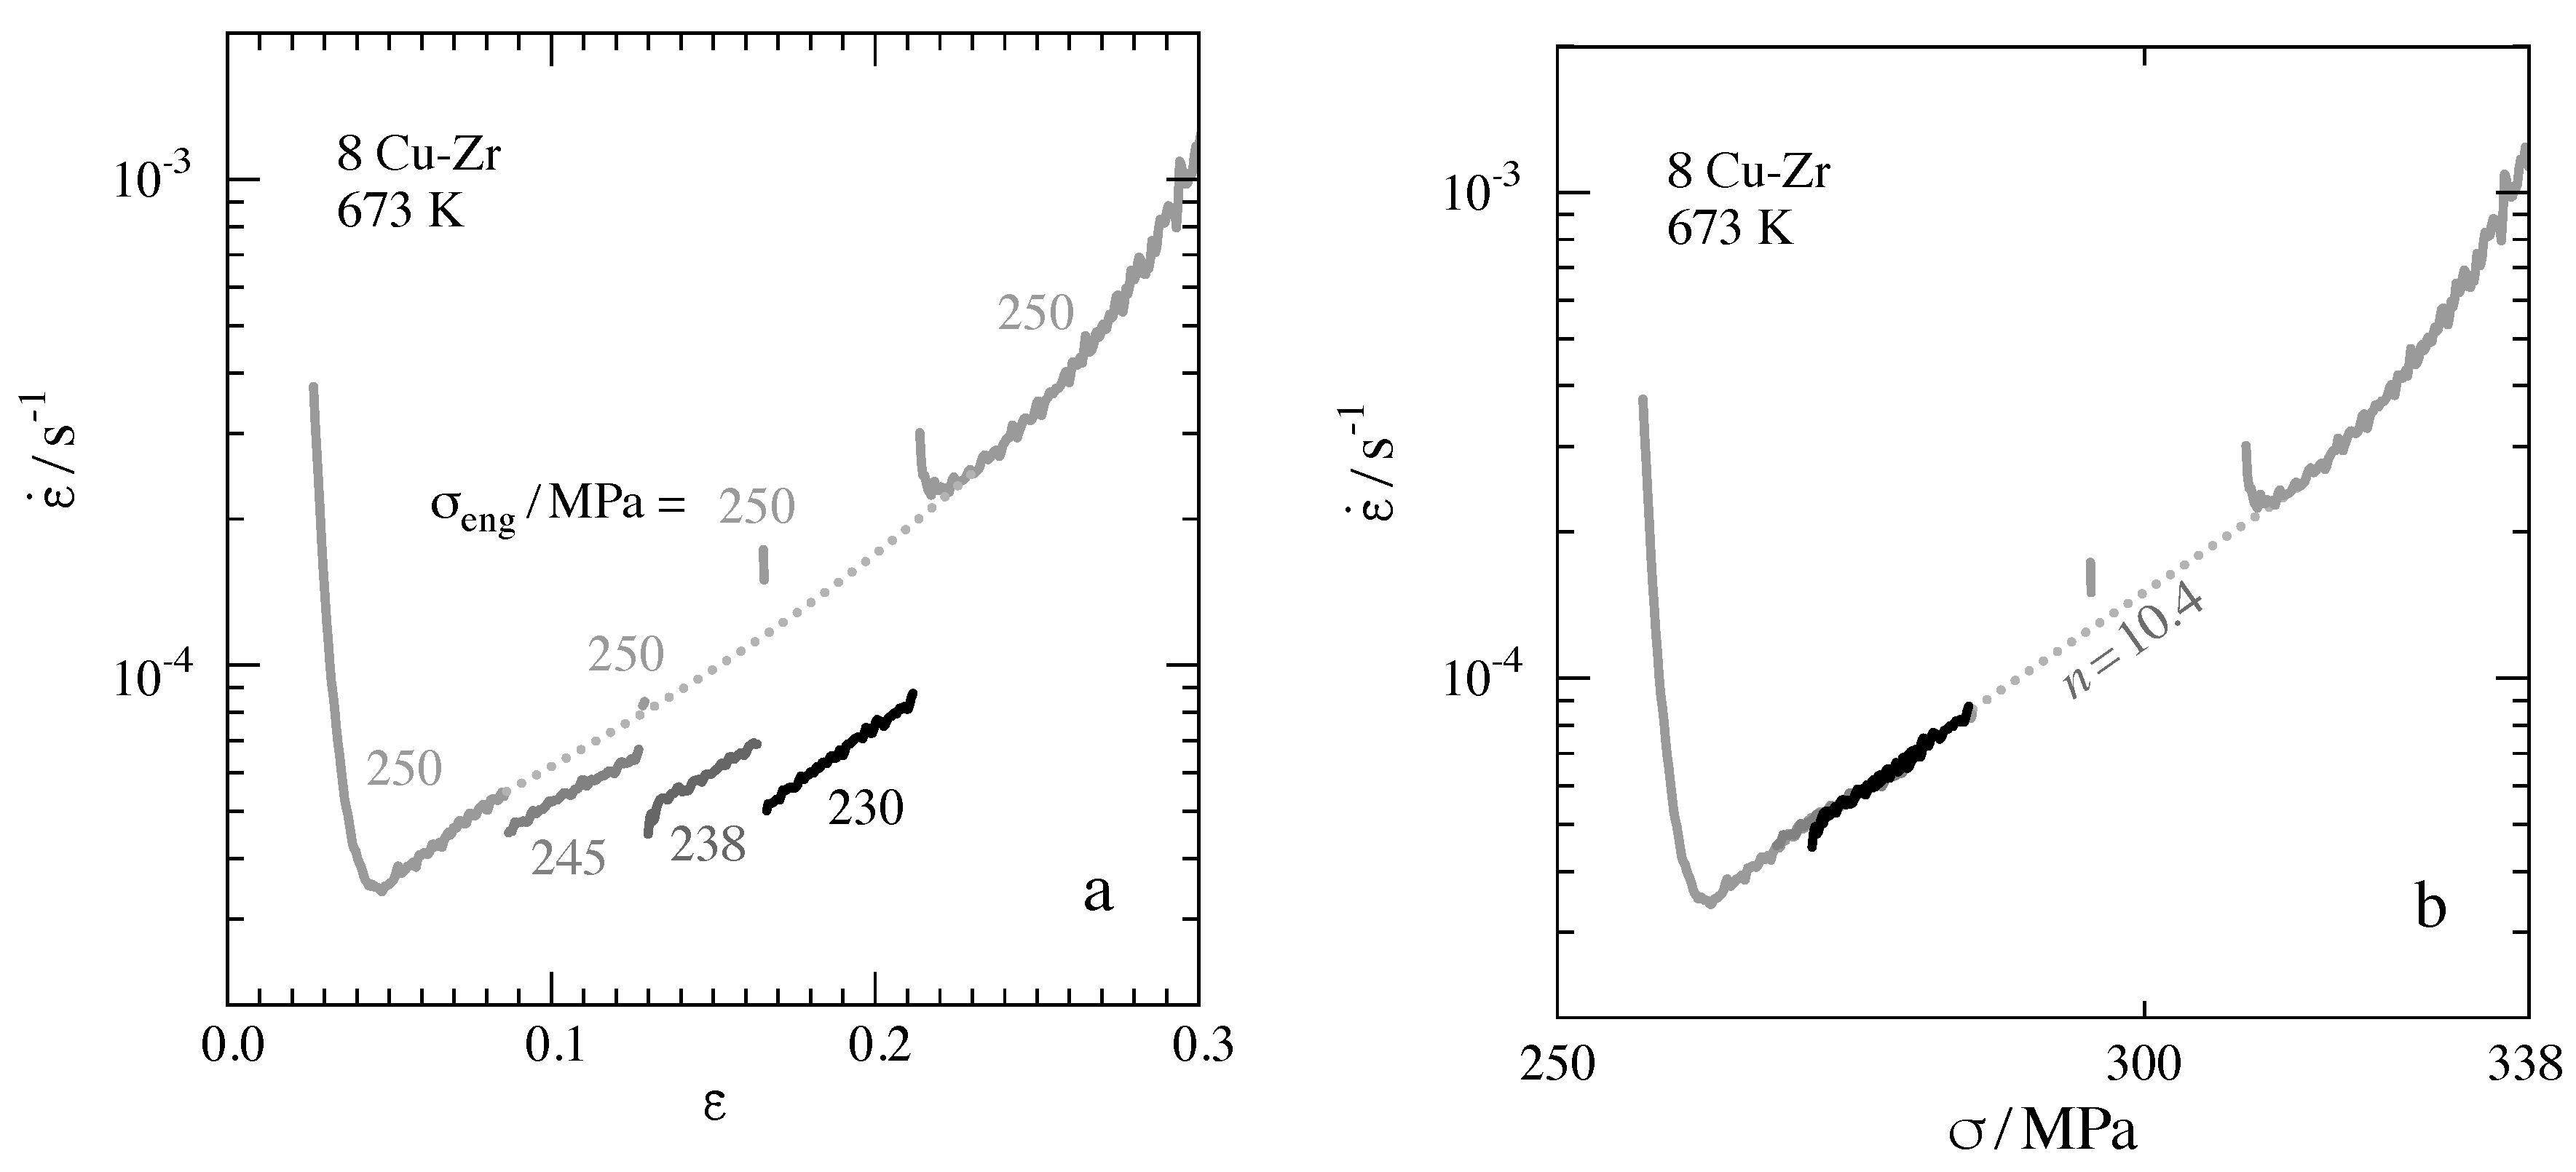
- The initial qs strength of ufg Cu-Zr measured before massive grain coarsening is described by a power law with stress exponent , corresponding to a relatively high rate sensitivity , around s−1 and the relatively high stress .
- Analysis of the grain structure indicates that an increasing fraction of small grains becomes subgrain-free in the qs state as the stress decreases.
- The relatively high qs rate sensivity of ufg Cu-Zr is modeled as a result of the variation of the fraction of relatively soft subgrain-free grain volume with stress.
Author Contributions
Conflicts of Interest
Abbreviations
| qs | quasi-stationary |
| ECAP | equal channel angular pressing |
| ufg | ultrafine-grained |
| cg | coarse grained |
| LAB | low-angle boundary |
| HAB | high-angle boundary |
| TEM | Transmission electron microscopy |
References
- Blum, W.; Dvořák, J.; Král, P.; Eisenlohr, P.; Sklenička, V. What is stationary deformation of pure Cu? J. Mater. Sci. 2014, 49, 2987–2997. [Google Scholar] [CrossRef]
- Mughrabi, H. Implications of non-negligible microstructural variations during steady state deformation. Z. Metallkd. 2005, 96, 546–551. [Google Scholar] [CrossRef]
- Blum, W.; Eisenlohr, P. Structure evolution and deformation resistance in production and application of nanostructured materials—The concept of steady-state grains. Mater. Sci. Forum 2011, 683, 163–181. [Google Scholar] [CrossRef]
- Valiev, R.Z.; Korznikov, A.V.; Mulyukov, R.R. Structure and properties of ultrafine-grained materials produced by severe plastic deformation. Mater. Sci. Eng. A 1993, 168, 141–148. [Google Scholar] [CrossRef]
- Iwahashi, Y.; Horita, Z.; Nemoto, M.; Langdon, T. The process of grain refinement in equal-channel angular pressing. Acta Mater. 1998, 46, 3317–3331. [Google Scholar] [CrossRef]
- Valiev, R.; Islamgaliev, R.; Alexandrov, I. Bulk nanostructured materials from severe plastic deformation. Progr. Mater. Sci. 2000, 45, 103–189. [Google Scholar] [CrossRef]
- Estrin, Y.; Vinogradov, A. Extreme grain refinement by severe plastic deformation: A wealth of challenging science. Acta Mater. 2013, 61, 782–817. [Google Scholar] [CrossRef]
- Kral, P.; Svoboda, M.; Dvorak, J.; Kvapilova, M.; Sklenicka, V. Microstructure Mechanisms Governing the Creep Life of Ultrafine-grained Cu-0.2wt.%Zr Alloy. Acta Phys. Pol. 2012, A 122, 485–489. [Google Scholar]
- Dvorak, J.; Kral, P.; Kvapilova, M.; Svoboda, M.; Sklenicka, V. Microstructure stability and creep behaviour of Cu-0.2wt.%Zr alloy processed by equal-channel angular pressing. Mat. Sci. Forum 2011, 667–669, 821–826. [Google Scholar] [CrossRef]
- Sklenička, V.; Dvořák, J.; Král, P.; Svoboda, M.; Kvapilova, M.; Langdon, T. Factors influencing creep flow and ductility in ultrafine—Grained metals. Mater. Sci. Eng. A 2012, 558, 403–411. [Google Scholar] [CrossRef]
- Frost, H.J.; Ashby, M.F. Deformation-Mechanism Maps; Pergamon Press: Oxford, UK, 1982. [Google Scholar]
- Neishi, K.; Horita, Z.; Langdon, T.G. Achieving superplasticity in ultrafine-grained copper: Influence of Zn and Zr additions. Mater. Sci. Eng. A 2003, 352, 129–135. [Google Scholar] [CrossRef]
- Li, Y.; Zeng, X.; Blum, W. Transition from strengthening to softening by grain boundaries in ultrafine-grained Cu. Acta Mater. 2004, 52, 5009–5018. [Google Scholar] [CrossRef]
- Amouyal, Y.; Divinski, S.; Estrin, Y.; Rabkin, E. Short-circuit diffusion in an ultrafine-grained copper–zirconium alloy produced by equal channel angular pressing. Acta Mater. 2007, 55, 5968–5979. [Google Scholar] [CrossRef]
- Wongsa-Ngam, J.; Wen, H.; Langdon, T.G. Microstructural evolution in a Cu–Zr alloy processed by a combination of ECAP and HPT. Mater. Sci. Eng. A 2013, 579, 126–135. [Google Scholar] [CrossRef]
- Blum, W. High-Temperature Deformation and Creep of Crystalline Solids. In Plastic Deformation and Fracture of Materials; Mughrabi, H., Ed.; VCH Verlagsgesellschaft: Weinheim, Germany, 1993; pp. 359–405. [Google Scholar]
- Reppich, B. Particle Strengthening. In Plastic Deformation and Fracture of Materials; Mughrabi, H., Ed.; VCH Verlagsgesellschaft: Weinheim, Germany, 1993; pp. 311–357. [Google Scholar]
- Li, Y.J.; Mueller, J.; Höppel, H.; Göken, M.; Blum, W. Deformation kinetics of nanocrystalline nickel. Acta Mater. 2007, 55, 5708–5717. [Google Scholar] [CrossRef]
- Mukherjee, A.; Bird, J.; Dorn, J. Experimental Correlations for High-Temperature Creep. ASM Trans. Q. 1969, 62, 155–179. [Google Scholar]
- Čadek, J. Creep in Metallic Materials; Elsevier: Amsterdam, The Netherlands, 1988. [Google Scholar]
- Kassner, M.; Pérez-Prado, M.T. Five-Power-Law Creep in Single Phase Metals and Alloys. Prog. Mater. Sci. 2000, 45, 1–102. [Google Scholar] [CrossRef]
- Blum, W.; Eisenlohr, P. A simple dislocation model of the influence of high-angle boundaries on the deformation behavior of ultrafine-grained materials. In 15th International Conference on the Strength of Materials (ICSMA-15); IOP Publishing: Bristol, UK, 2010; Volume 240, pp. 1–4. [Google Scholar] [CrossRef]
- Ghosh, A.K.; Raj, R. Grain size distribution effects in superplasticity. Acta Metall. 1981, 29, 607–616. [Google Scholar] [CrossRef]
- Blum, W.; Dvořák, J.; Král, P.; Eisenlohr, P.; Sklenička, V. Effect of grain refinement by ECAP on creep of pure Cu. Mater. Sci. Eng. A 2014, 590, 423–432. [Google Scholar] [CrossRef]
- Eisenlohr, P.; Blum, W. Maximal strain rate sensitivity of quasi-stationary deformation strength when subgrain size matches grain size. J. Mater. Sci. Technol. under review.
- Blum, W.; Dvořák, J.; Král, P.; Sklenička, V. Dynamic grain coarsening in creep of pure Cu at 0.42 Tm after predeformation by ECAP. Mater. Sci. Eng. A 2018, 731, 520–529. [Google Scholar] [CrossRef]
- Blum, W.; Zeng, X.H. A simple dislocation model of deformation resistance of ultrafine-grained materials explaining Hall–Petch strengthening and enhanced strain rate sensitivity. Acta Mater. 2009, 57, 1966–1974, Corrigendum to 2011, 59, 6205–6206. [Google Scholar] [CrossRef]


© 2019 by the authors. Licensee MDPI, Basel, Switzerland. This article is an open access article distributed under the terms and conditions of the Creative Commons Attribution (CC BY) license (http://creativecommons.org/licenses/by/4.0/).
Share and Cite
Blum, W.; Dvořák, J.; Král, P.; Eisenlohr, P.; Sklenička, V. Quasi-Stationary Strength of ECAP-Processed Cu-Zr at 0.5 Tm. Metals 2019, 9, 1149. https://doi.org/10.3390/met9111149
Blum W, Dvořák J, Král P, Eisenlohr P, Sklenička V. Quasi-Stationary Strength of ECAP-Processed Cu-Zr at 0.5 Tm. Metals. 2019; 9(11):1149. https://doi.org/10.3390/met9111149
Chicago/Turabian StyleBlum, Wolfgang, Jiři Dvořák, Petr Král, Philip Eisenlohr, and Vaclav Sklenička. 2019. "Quasi-Stationary Strength of ECAP-Processed Cu-Zr at 0.5 Tm" Metals 9, no. 11: 1149. https://doi.org/10.3390/met9111149
APA StyleBlum, W., Dvořák, J., Král, P., Eisenlohr, P., & Sklenička, V. (2019). Quasi-Stationary Strength of ECAP-Processed Cu-Zr at 0.5 Tm. Metals, 9(11), 1149. https://doi.org/10.3390/met9111149