Article

Fractographic Study on Naturally Initiated Short Fatigue Cracks in a Near-Lamellar TiAl Alloy at Room Temperature

1
College of Material Science and Technology, Nanjing University of Aeronautics and Astronautics, Nanjing 210000, China
2
School of Metallurgy and Materials, University of Birmingham, Birmingham B29 2TT, UK
*
Authors to whom correspondence should be addressed.
Metals 2019, 9(10), 1101; https://doi.org/10.3390/met9101101
Submission received: 30 August 2019 / Revised: 7 October 2019 / Accepted: 9 October 2019 / Published: 14 October 2019

Abstract

:
Short crack phenomena are considered important for lamellar structures in γ-TiAl alloys and have been thoroughly investigated in the past. However, the short cracks in the previous studies were nearly all introduced artificially. No particular investigations have looked into the initiation of fatigue short cracks. Therefore, naturally initiated short fatigue cracks at room temperature under two different stress ratios (0.1 and 0.5) were investigated in a near-lamellar γ-TiAl alloy (Ti-45Al-2Mn-2Nb) in this study. The observations show that the fatigue crack initiation behaved differently at low and high stress ratios. At low stress ratio, the specimens failed at lower ultimate stress levels (σmax = 450 and 475 MPa), and the crack initiated from the cluster of interlamellar fracture near mode-I orientation or stress concentration areas. At the higher stress ratio, the specimens failed at higher but consistent stress levels (σmax = 560 and 570 MPa), and in the specimen crack initiation areas, the interlamellar fractures were still the primary fracture mode, whereas some were found at tilted angles due to shear deformation. The results suggest that short fatigue cracks can naturally initiate in lamellar γ-TiAl alloys, thus attention should be paid to their microstructure design, surface finishing and cleanliness.

1. Introduction

Reducing environmental impacts and raising propulsive efficiency are the primary objectives in jet engine development, which can be interpreted as lighter turbines [1]. In recent decades, gamma titanium aluminides (γ-TiAls) have received increasing attention as candidates for next generation gas turbines, because of their absolute advantages of low density and relatively superior high temperature properties. However, their extensive applications in aero-engines are still limited due to their low ductility and toughness compared to the conventional superalloys. As a direct result of these drawbacks, the fatigue and fracture behaviours of γ–TiAls are the all-important issue for practical design.
In γ-TiAls, compared with the traditional fatigue life (S/N) approach, fatigue threshold defined by the damage-tolerance approach has a higher importance, as the number of cycles between starting a fatigue crack and final catastrophic failure is rather small [2]. Thus, prevention of fatigue crack occurrence in γ-TiAl alloys is one of the top priorities for practical design. The reason for high crack growth resistance in lamellar TiAl alloys is that there are more microstructural barriers, such as lamellar interfaces and colony boundaries, which can impede the propagation of microcracks to adjacent microstructural units [3,4,5]. The crack-arrest phenomenon has been frequently observed in lamellar TiAl alloys. When a cyclic load reaches localised fatigue thresholds in colonies with mode-I direction, at which the crack plane is perpendicular to the nominal loading axis, cracks nucleate and extend rapidly in colonies along lamella interfaces, and can be arrested by colony boundaries or equiaxed grains [6,7]. Because the lamellar colonies are randomly oriented, the localised fatigue threshold value varies [6]. At a macroscale, the fatigue threshold of a γ-TiAl alloy is the minimum fatigue load that allows fatigue cracks to surmount surrounding microstructural barriers and grow continuously [8]. The fatigue threshold and growth behaviour of long cracks in lamellar TiAl alloys are well established. The stress ratio can affect the fatigue crack behaviours intrinsically and extrinsically. The fatigue threshold in TiAl alloys decreases with increasing stress ratio, while the crack growth rate is the contrary.
Furthermore, in aero-applications, components are always well produced with care, i.e., minimizing the potential for defects. Hence, it is worth evaluating the potential for naturally initiated fatigue cracks in lamellar γ-TiAl alloys without pre-introduced defects and its causes. Although short cracks have been studied in depth, the short cracks were nearly all introduced via artificial methods, such as laser beam [7], sparks damage [7], or controlled tensile force [6]. Even some short crack tests were carried out on smooth test pieces without artificial damage, but only surface short cracks were observed by microscope or surface replica, and thus interior short cracks have not been studied in detail. Therefore, in this study, a near lamellar γ-TiAl alloy was investigated for the fatigue behaviour of naturally initiated short cracks at stress ratios of 0.1 and 0.5. Unnotched smooth cylindrical specimens were used in order to avoid stress concentration. The testing procedure was designed based on preliminary testing results, which was consistent with the founding of Pippan et al. [8] in a fully lamellar Ti-46.5Al at.% alloy. The results of the research showed that the fatigue cracks in a lamellar γ-TiAl alloy can only propagate continuously above a critical load value (ΔK). Therefore, by carefully controlling the fatigue loading procedure, the final fatigue load at failure can infinitely approach the loading level of the fatigue threshold.
The aims of this study are to reveal how fatigue cracks naturally initiate and propagate in a lamellar TiAl alloy at different R ratios and also to present the understandings of the reasons for the fatigue crack initiations.

2. Material and Experimental Methods

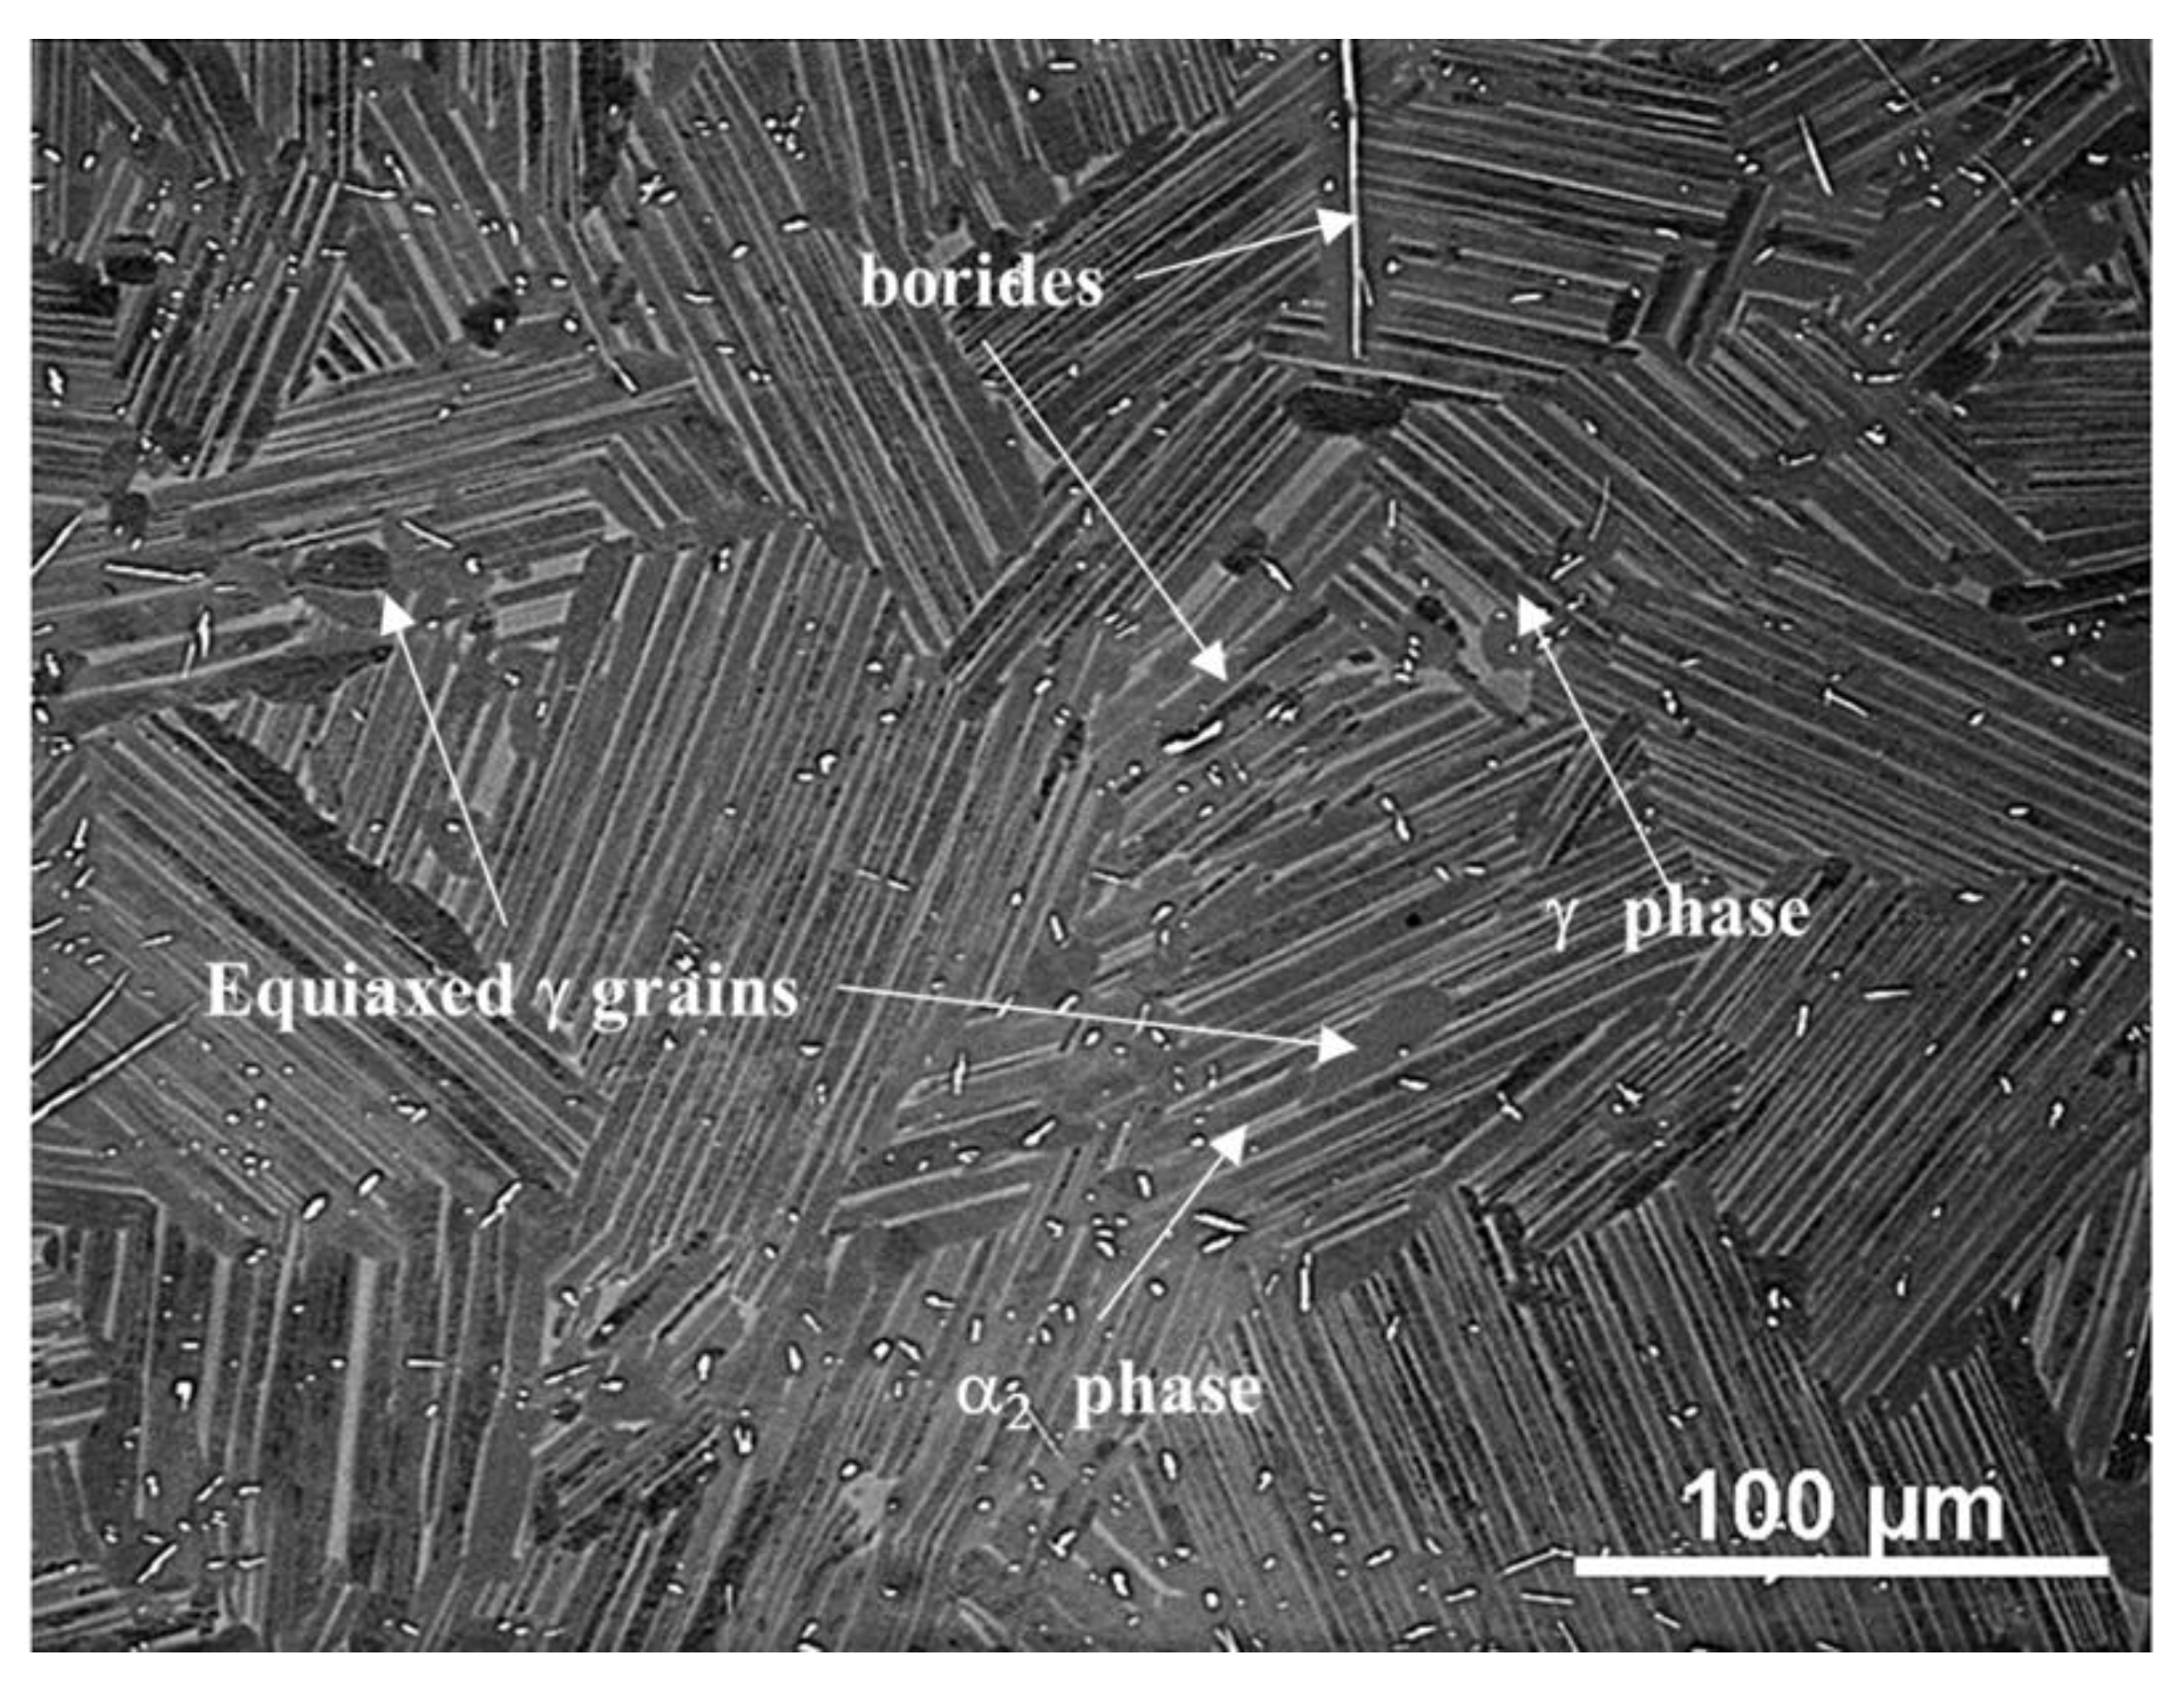
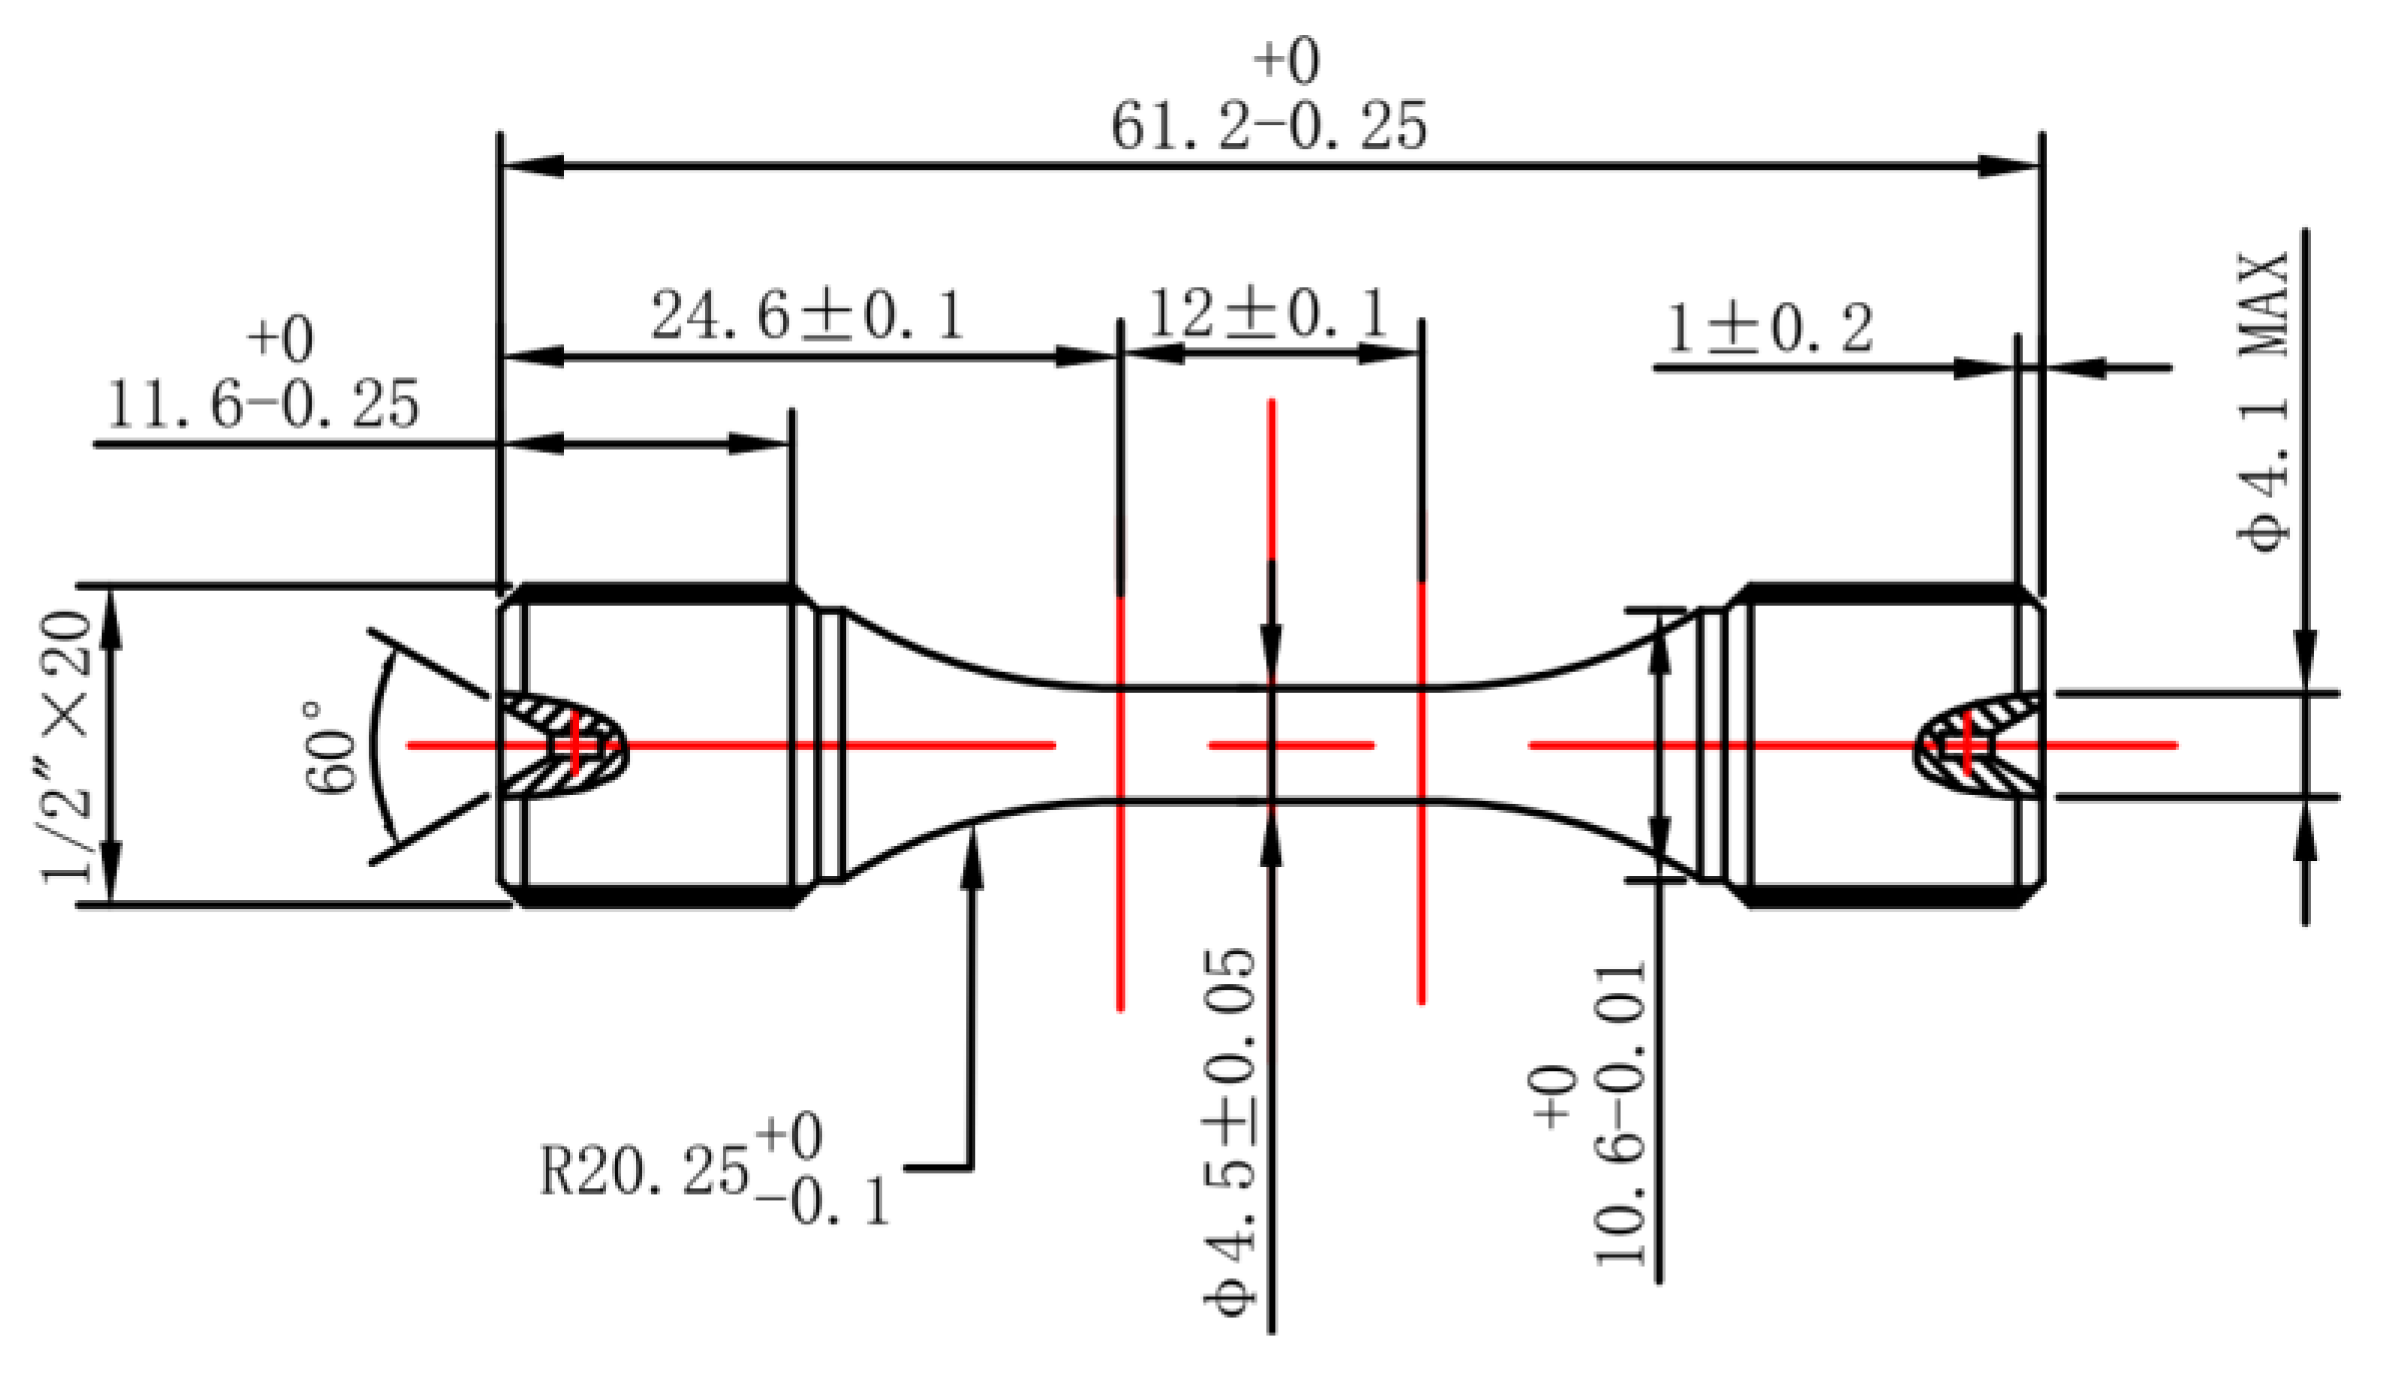
2.1. Material and Specimen

The nominal composition of the near lamellar TiAl alloy in this study is Ti-45Al-2Mn-2Nb-1B at.%. The microstructure of the alloy is as shown in Figure 1. The alloy is composed of lamellar colonies, equiaxed γ grains and needle-like boride particles. The specimens used for investigating naturally initiated short fatigue cracks were firstly blanked out by electrical-discharge machine (EDM), and then ground and polished with care to avoid introducing residual stress. These specimens are called cylindrical specimens because the cross sections of their testing areas are circular which can eliminate the stress concentration caused by sharp edges or corners. The geometry of cylindrical specimens is shown in Figure 2. The specimens were tested without artificial defects, i.e., notches, cracks, indentation, and etc.

2.2. Testing Methods

Short crack tests were conducted in tension–tension loading mode using an electro-mechanical fatigue machine with a load cell of 20 kN. Sinewave fatigue loading was performed at the resonant frequency (~105 Hz) which was determined by the loading system and ambient temperature. The testing temperature was carried out at room temperature (RT) and two stress ratios (σminmax) of 0.1 and 0.5. All tests were performed via step-wise peak load (σmax) increasing method, of which the increment of σmax for every step was 15 MPa (~0.25 kN). The tests were started with a peak load far below the yield stress of the material with a run-out criterion of 107 cycles. If the specimen did not fail at the stress level, higher peak stresses would be applied until the final failure occurred within 107 cycles.
The fracture surfaces were examined using optical microscopy and SEM. Failed specimens were sliced, mounted, ground and polished for microstructure assessment. The grinding and polishing procedures were performed following the Struers instruction for titanium alloys. The crack size and microstructural assessments were carried out by Axiovision software. The colony size was evaluated by taking colonies as circular shapes and working out the average value of their diameters.

3. Results

3.1. Fatigue Failures under Defect-Free Condition

The colony size of the alloy studied here ranged between 40 and 130 μm with an average colony size of ~80 μm. The R ratio, ultimate stresses (the stresses at which the specimens fail, i.e., the stresses at the last loading step) and number of cycles at final failure are summarised in Table 1. It is clear from these results that the maximum ultimate stresses (σmax) are higher at R = 0.5 than at R = 0.1, whilst Δσ values are contrary. No catastrophic failure was found to have occurred within the ultimate 107 cycles until the last loading level.

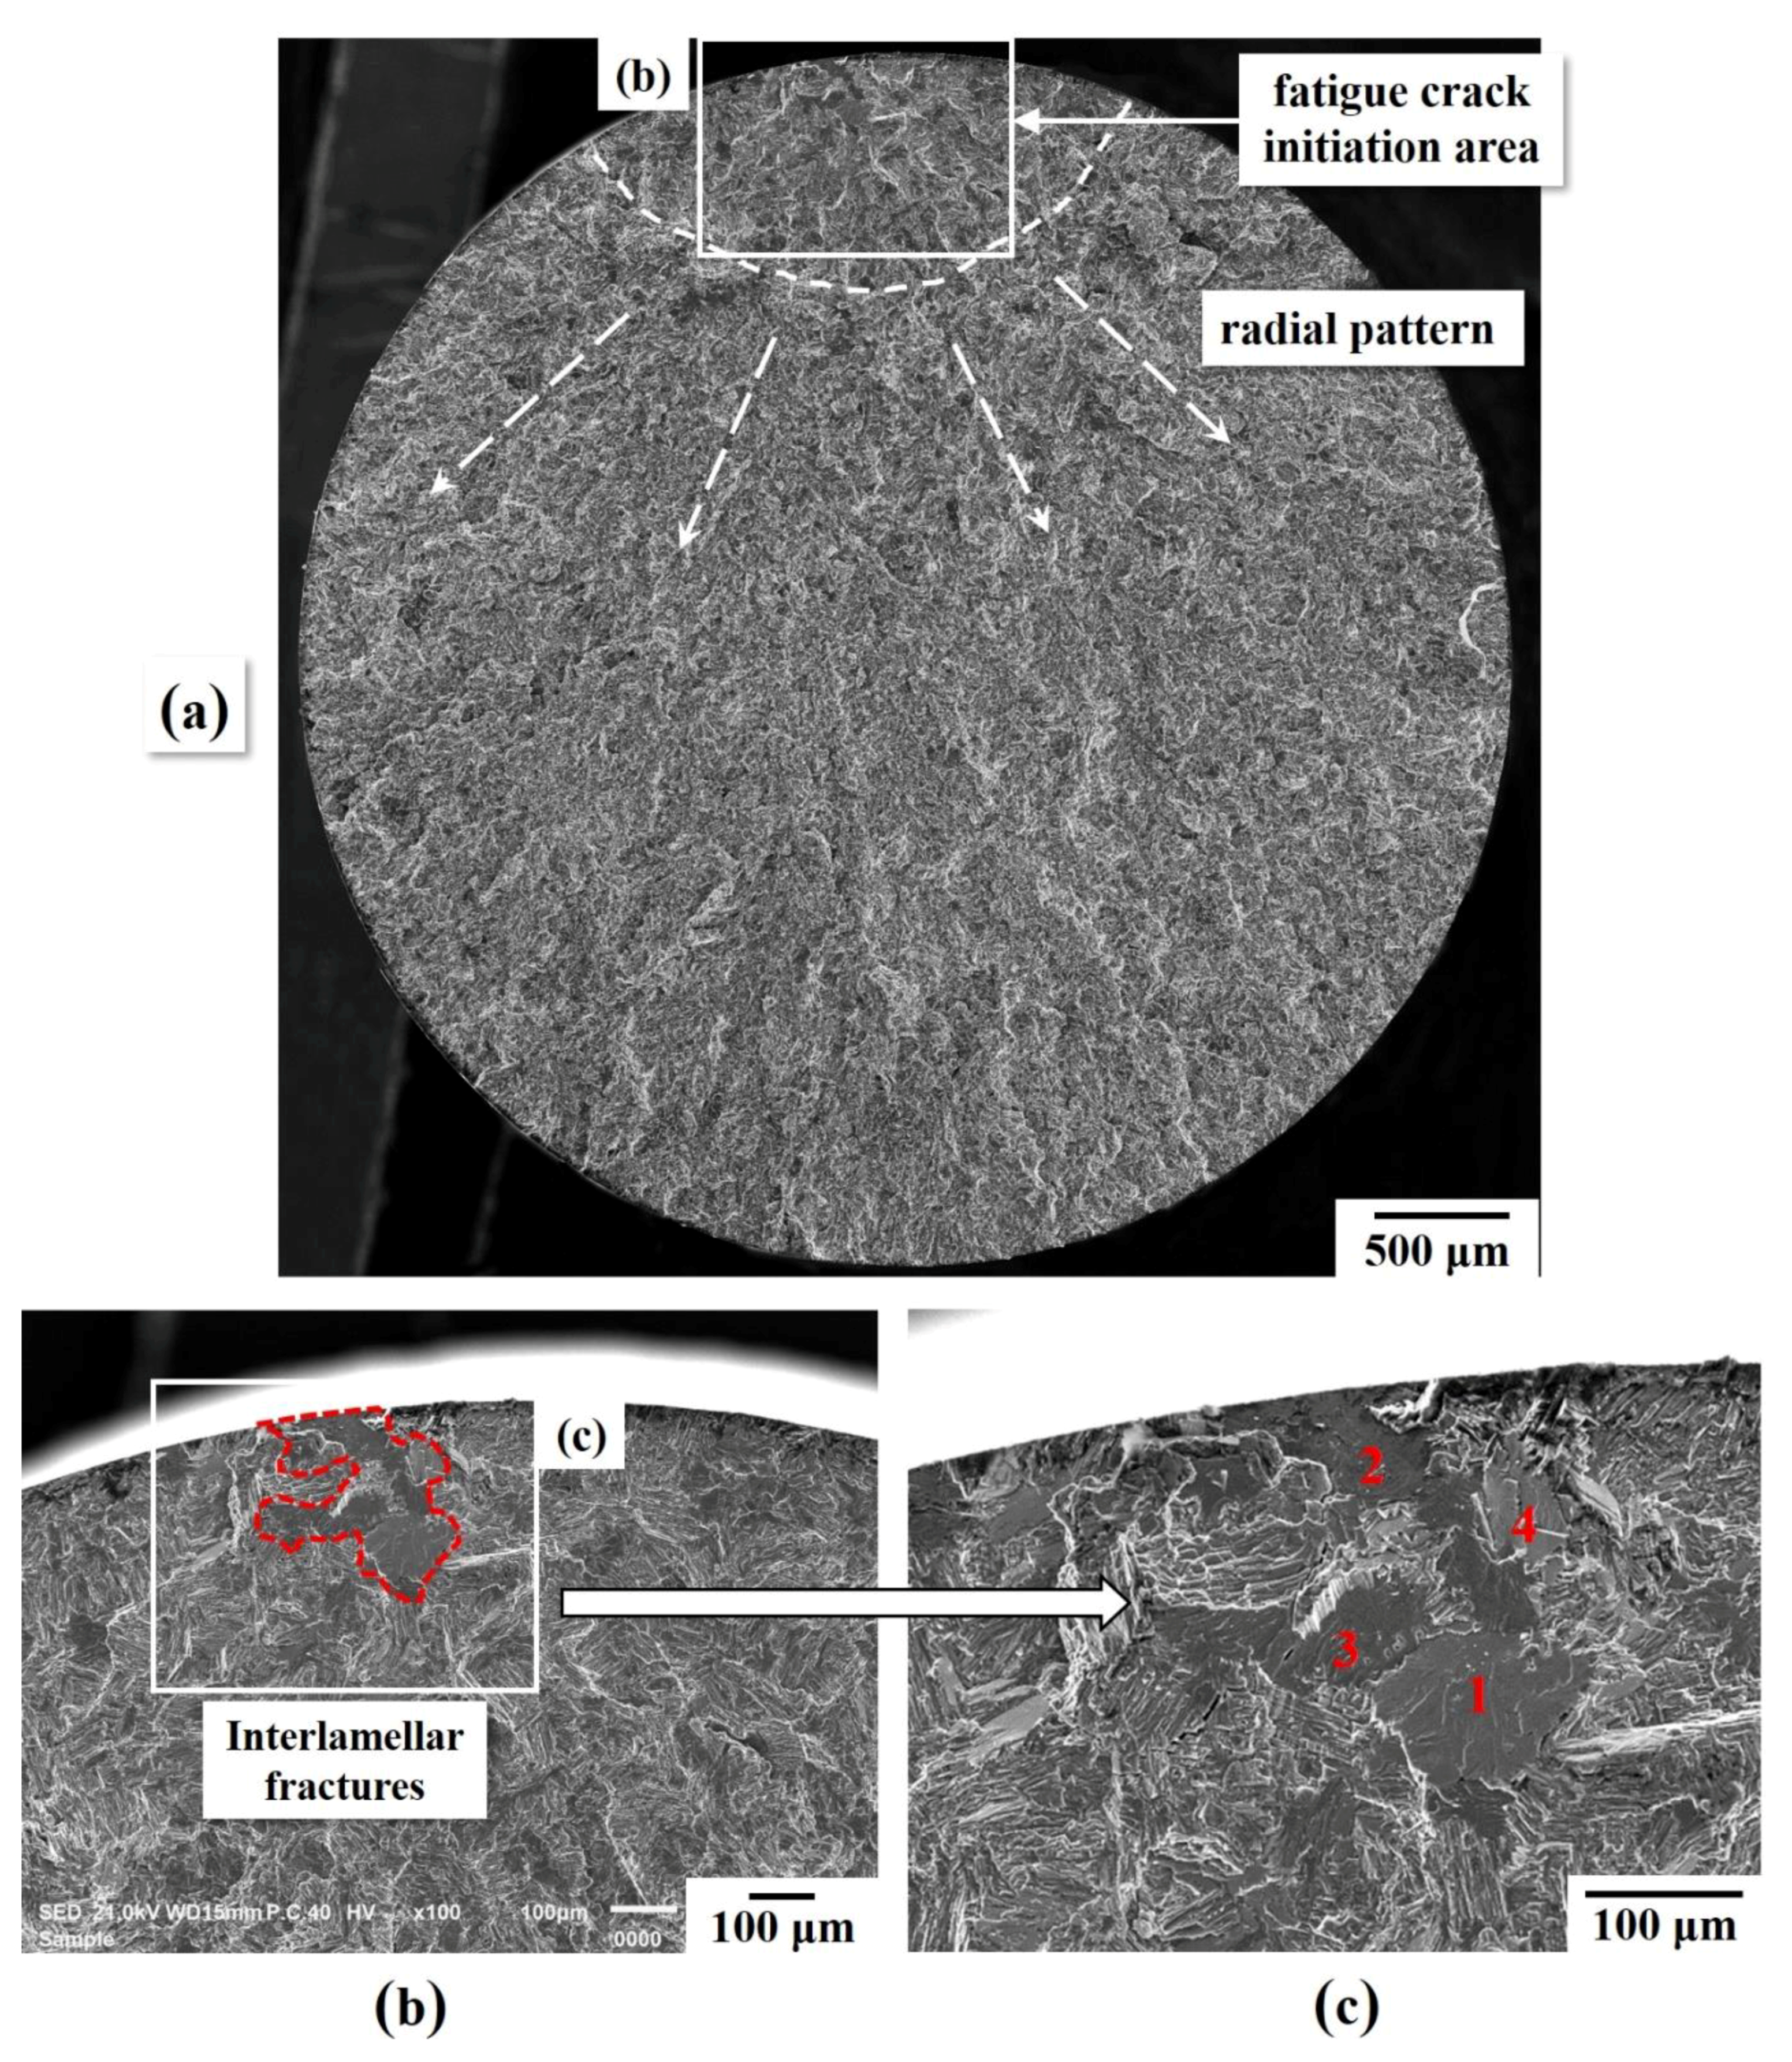
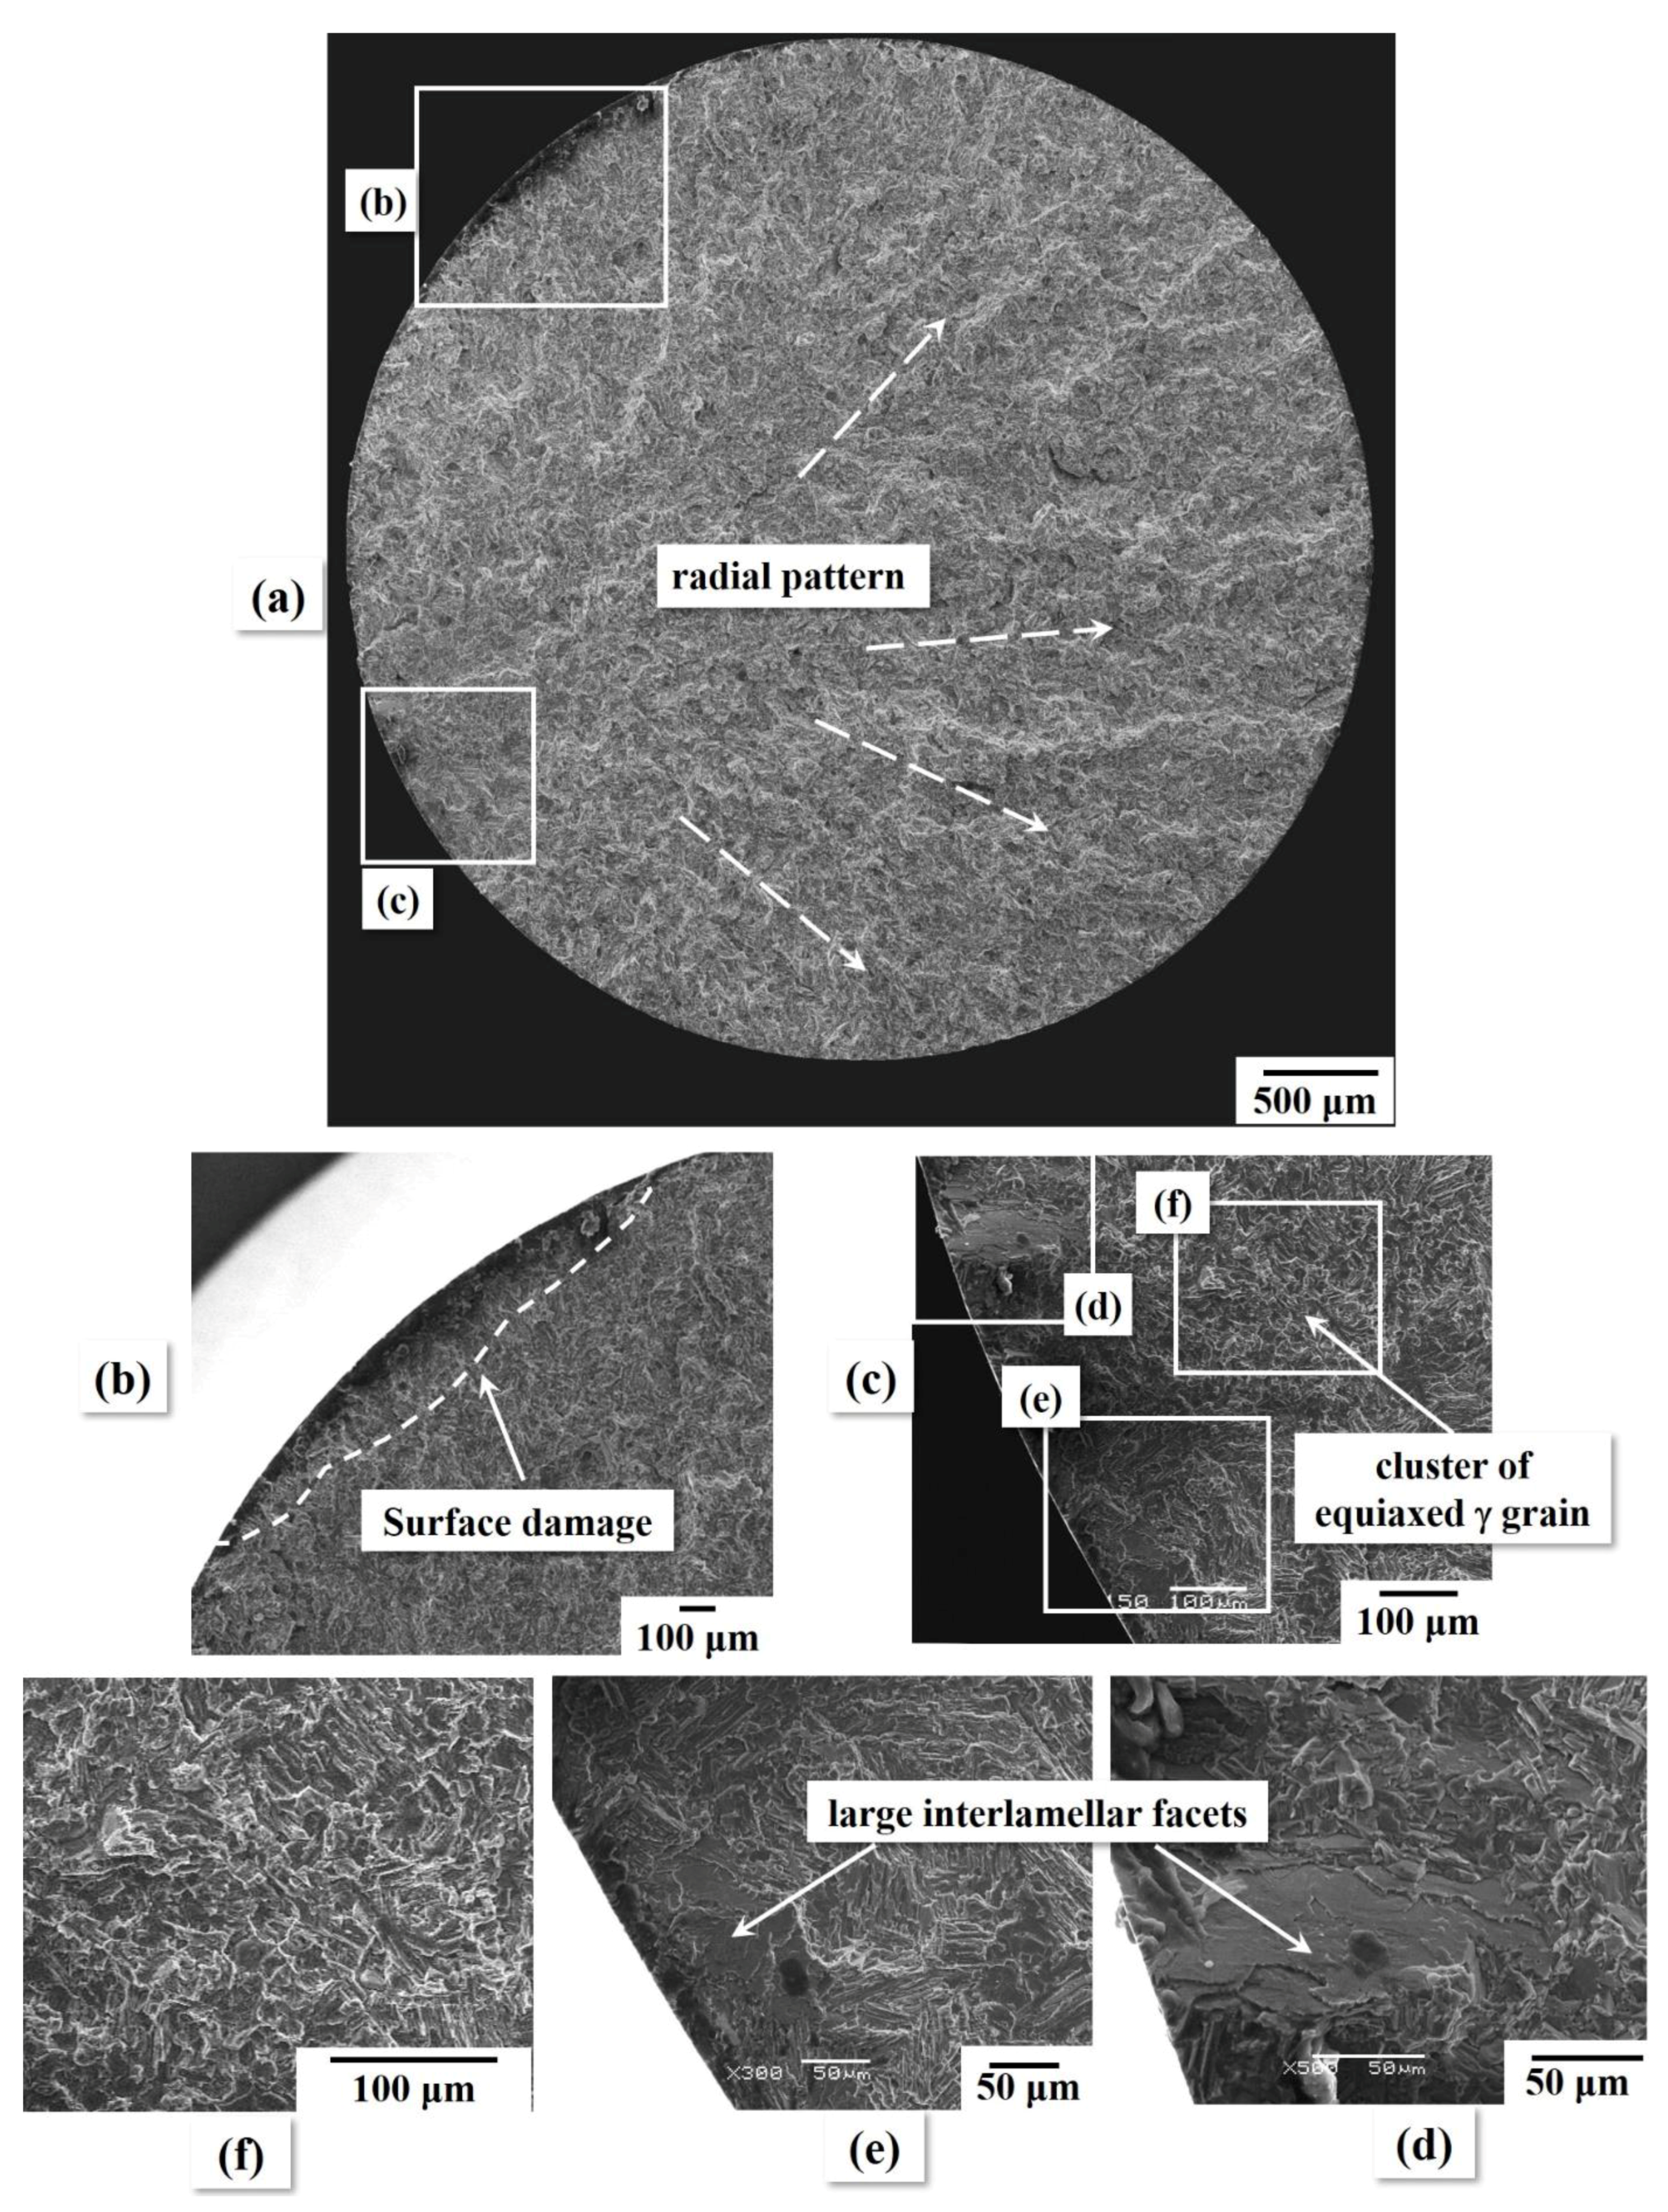
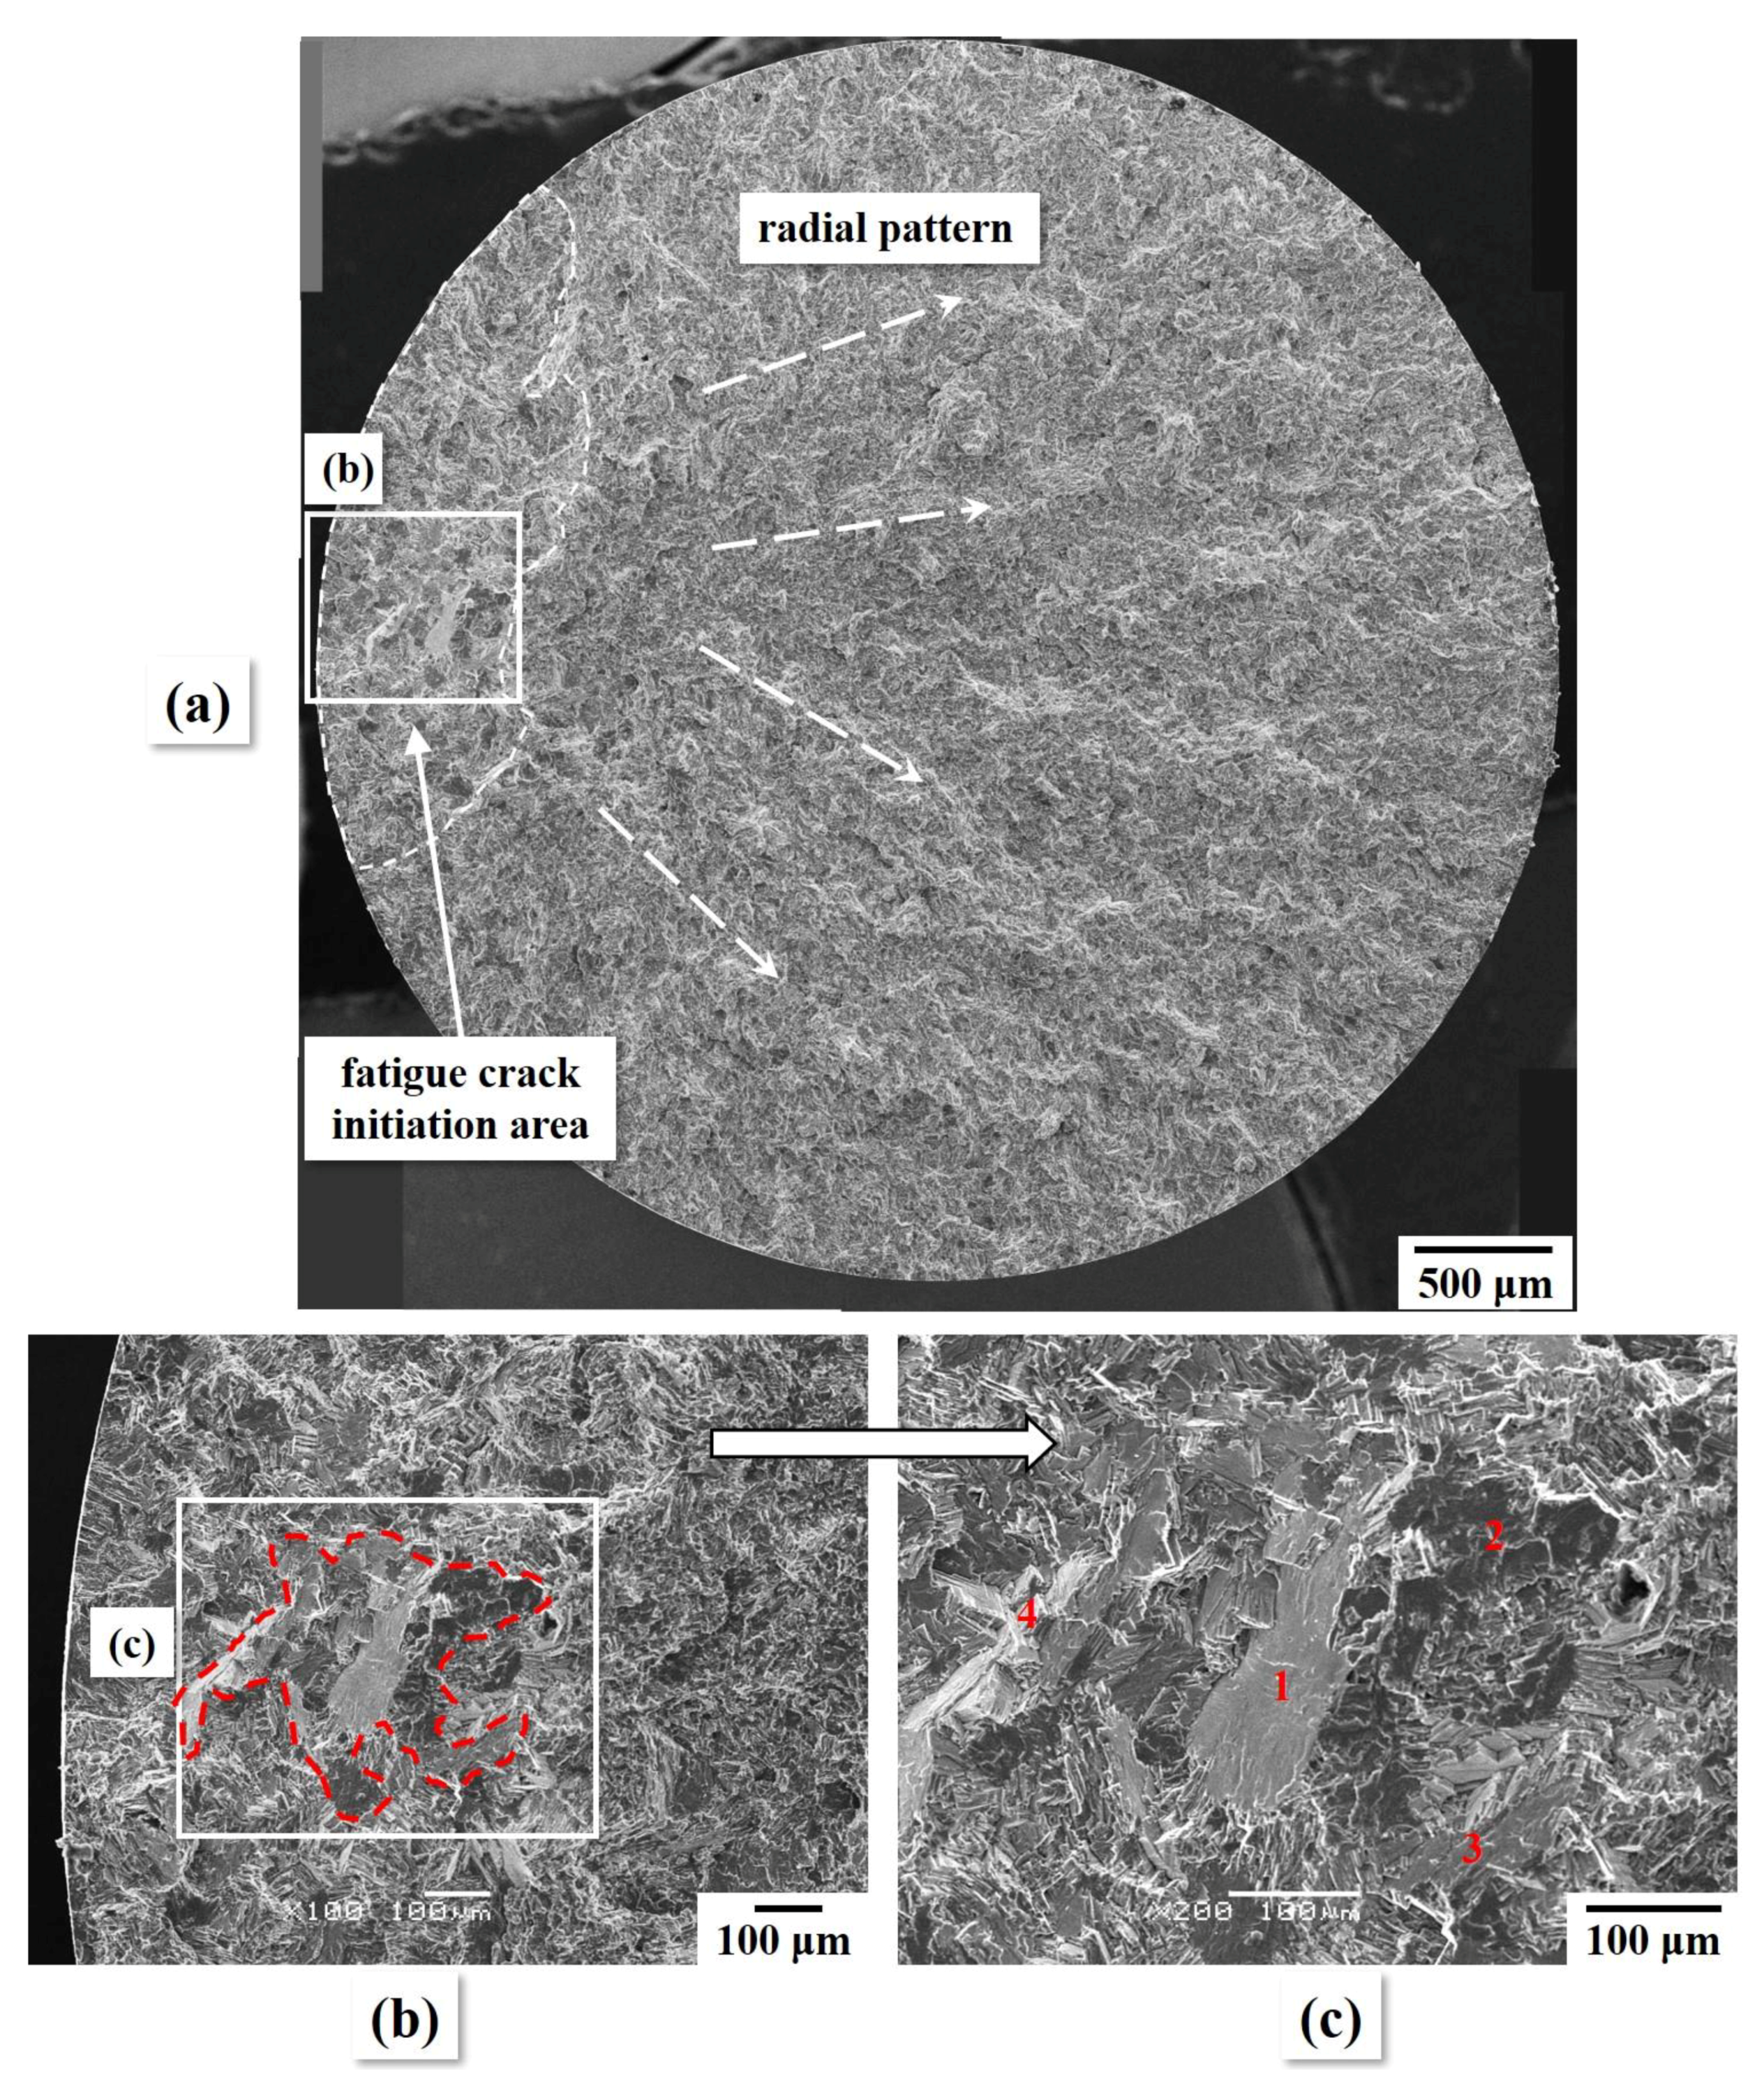
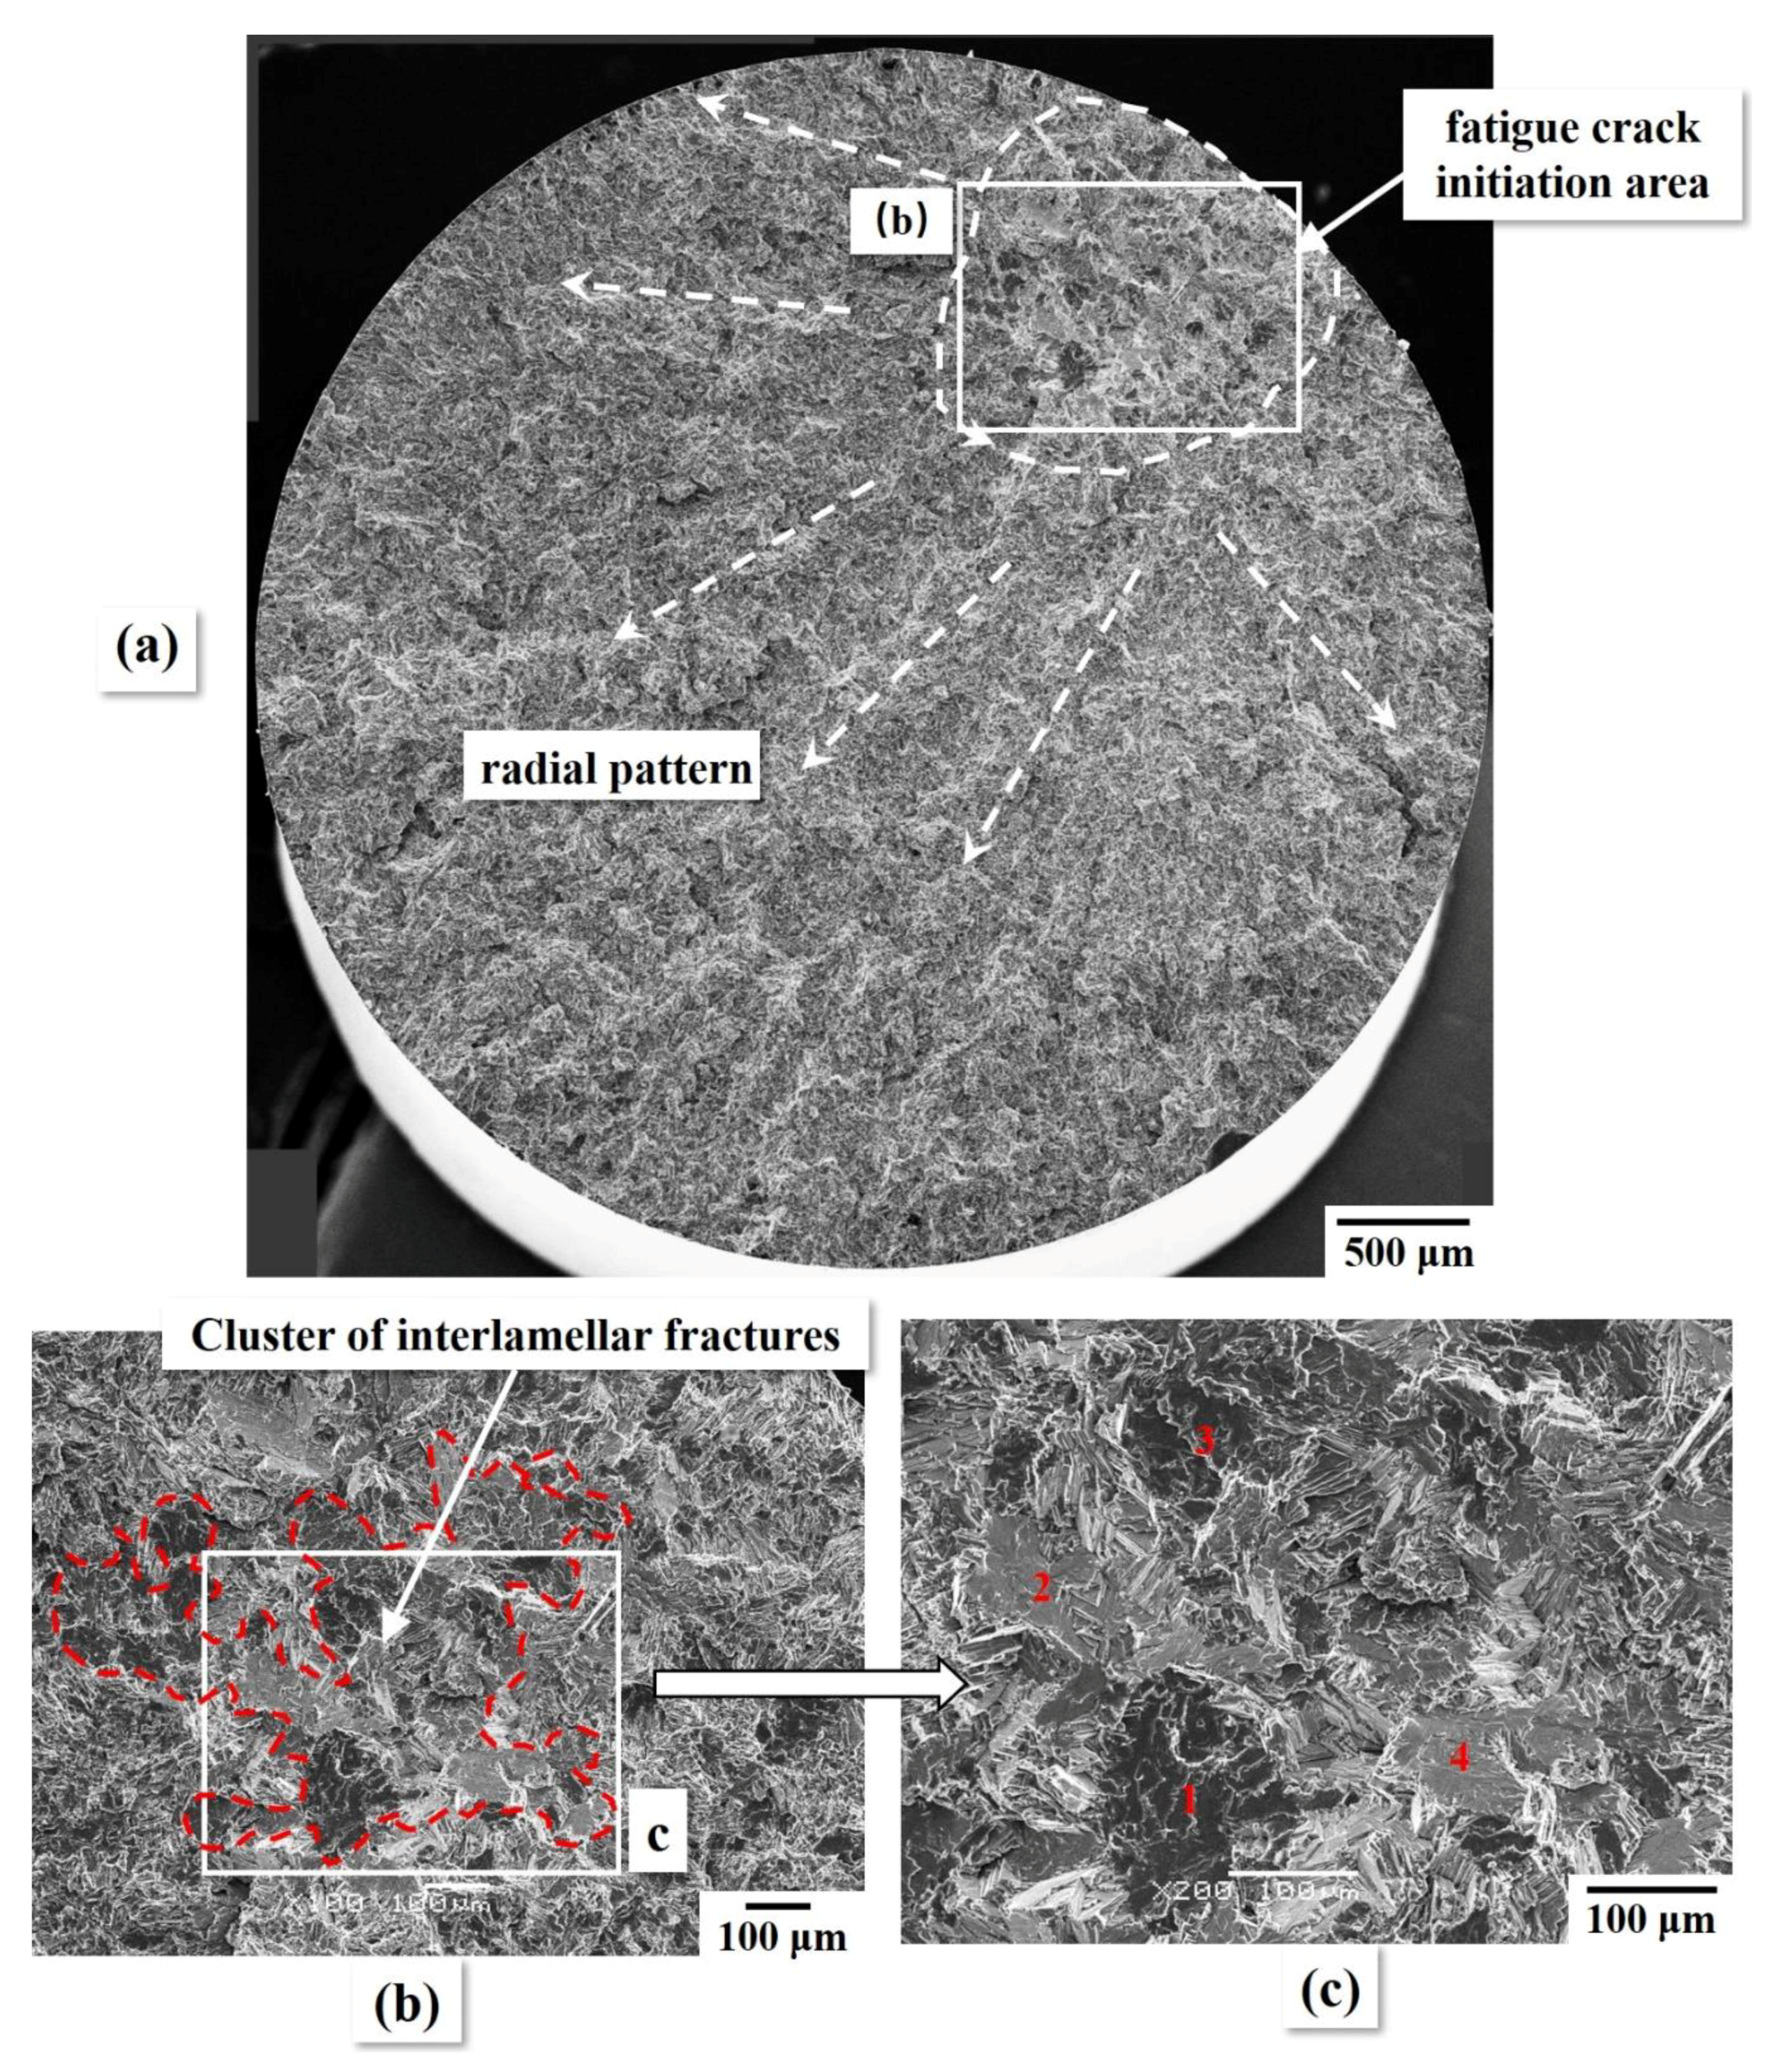
3.2. Naturally Initiated Fatigue Cracks

The fracture surfaces were carefully evaluated with SEM to find crack initiation areas. Normally, the fatigue crack area may be identified via the following microscopic or macroscopic features [9]:
  • surrounded by radial patterns (such as steps, striations)
  • flatter fracture surface compared to final fracture region
  • crack growth direction perpendicular to main principal stress
  • cracks grow transgranularly
Based on these features, fatigue crack areas were identified on the fracture surfaces as shown in Figure 3a, Figure 4a, Figure 5a and Figure 6a. In general, the fracture surfaces all follow the above features showing brittle behaviour as lack of plastic deformation and relatively flat overall morphology. At both R ratios, fatigue cracks propagated mainly in translamellar mode, whereas large conspicuous cluster or individual interlamellar fractures could be observed in the crack initiation areas. By examining these interlamellar fractures at higher magnifications (Figure 3c, Figure 4b–d, Figure 5c and Figure 6c), the cluster of interlamellar fractures generated at R = 0.1 and R = 0.5 in the initiation areas were slightly different. The angle of interlamellar facets generated at R = 0.1 was less varied compared to those generated at R = 0.5.
At R = 0.1, in the crack initiation area, a cluster of three to four conjoined interlamellar fractures (~80–100 μm in diameter) of similar orientations were found in RC1 (Figure 3b). RC2 failed as a result of multiple crack sources including surface damage (Figure 4b) and large interlamellar fractures (Figure 4d,e). It is worth noting that in the crack initiation site “d”, a cluster of equiaxed γ-grain was observed ahead of the crack growth path. Equiaxed γ grains are reported to be less resistant to crack growth compared to the lamellar structure [10,11], which can further favour the crack propagation from the site “d”.
At R = 0.5, as seen in Figure 5b,c and Figure 6b,c, the interlamellar facets are less closely connected and show more obvious variations of angles as compared to those found at R = 0.1 in the crack initiation area. That is to say, the crack initiation at R = 0.5 was less continuous than it was at R = 0.1. In lamellar γ-TiAl alloys, their mechanical properties, such as fracture toughness, fatigue thresholds and yield strength, are often related to the lamellar orientations. In some works [7,12], the orientations were specified at “high angles” and “low angles” with respect to the loading axis or crack propagation plane, and more works defined the orientation between 20°–70° as “soft orientations” and the other angles as “hard orientations” [13,14]. Here, the angles of interlamellar facets were not accurately measured due to the lack of a standard horizontal/vertical reference system, because the fracture surfaces were cut off from whole broken specimens and the cut-off surfaces were hard to be kept horizontally. Therefore, the orientation of interlamellar fracture facets was roughly judged by titling the SEM stage and comparing the facets to the horizontal plane. The interlamellar fracture facets which are close to horizontal planes are defined as colonies near the mode-I direction.

4. Discussions

4.1. Naturally Initiated Short Fatigue Cracks

Jha et al. [2] found that cracks are likely to nucleate at γ−α2 interface in a lamellar TiAl alloy, which is consistent with an earlier study carried out by Huang et al. [15]. The possible reasons were explained as the γ−α2 interface having a higher chemical energy for changes and more obstacle to dislocation slip than the γ−γ interface. Hence, it is more difficult for dislocations to cross the γ−α2 interface which leads to a pile-up at lamellar interfaces and thus causes the delamination of lamellae. In addition, in lamellar microstructure, the most dominant cleavage planes, which are (111) in the γ phase and (0001) in the α2 phase, are parallel to the lamellar interfaces [16].
For a lamellar γ-TiAl alloy, the angle between the lamellar orientation and the loading orientation significantly affects the localised fracture toughness and crack growth resistance [16]. Normally, mode-I crack is the weakest link in a material, which is associated with low toughness values in lamellar microstructure. Colonies orientated at mode-I orientation are more likely to form early fatigue cracks than elsewhere [12,17]. Several authors also testified there are obvious variations of KIC values among colonies with low angles (crack plane perpendicular to loading direction) and high angles (crack plane parallel to loading direction), and the lowest KIC value is always found at mode-I orientation [12,17,18]. Therefore, it is not surprising that fatigue cracks initiated from the lamellar interface at or near mode-I orientation first, as seen in Figure 3, Figure 4, Figure 5 and Figure 6.
The anisotropic fracture behaviour has been widely recognized in lamellar TiAl alloys as a result of various colony orientations. Theoretically, the distribution of weak-oriented colonies should be homogeneous in a specimen, and thereby we could suspect that fatigue cracks can initiate at arbitrary colonies which are at weak orientations. However, there are more features of naturally initiated fatigue cracks as described previously rather than just at or near mode-I directions. These features will be discussed next.

4.2. Evaluations of Fatigue Crack Initiation

Normally, naturally initiated fatigue cracks are not in regular shapes as shown in the above results, and thus it is difficult to define their aspect ratios. To estimate the critical stress intensity factor that allows continuous growth of these cracks, the cracks are assumed as circular/semi-circular mode-I surface cracks or embedded cracks for simplification. Their crack length, a, was calculated based on the projected area of a real crack to the horizontal plane (as shown by red dashed lines in Figure 3, Figure 5 and Figure 6). The crack type, equivalent crack length, stress intensity factor solutions and stress intensity factors, ΔK and Kmax, are listed in Table 2. The K function used for calculating the semi-circular surface breaking crack was determined by Levan and Royer [19]. In this formula, a crack shape parameter α = 0 (semi-circular) and a/R = 0.06 (a and R are the crack length and radius of a round bar, respectively) were used. The final stress levels were regarded as the stress amplitude of the fatigue threshold at the testing condition. Because the models and crack lengths are not as exact as the real cracks, these values can only approximately describe the relationship between the crack length and the stress intensity factors under the two stress ratios.
The ΔK values of RC1 are more likely to be close to the fatigue threshold of a real short crack as the outline of the crack initiation area was clear, whereas they were less indicative for the threshold at R = 0.5 because it was difficult to identify the real boundary of a critical crack size at threshold. These K values are more applicable for critical crack sizes beyond which cracks are very likely to grow at a high rate and lead to the ultimate failure, rather than the fatigue threshold values of short cracks. Or in other words, these values approximately mark the transition of physical short cracks to long cracks. Additionally, the ΔKth and KIC values can be quite different in different TiAl alloys even though their microstructures are similar. Hence, the evaluation made here is not aiming at giving accurate values to be compared with the findings in the literatures, but to provide more quantized results for the comparison between the two stress ratios.
The conclusion that several coalescent interlamellar cracks can cause catastrophic fatigue failures in this near-lamellar alloy can be drawn from the above observations. However, it is still unknown what is the smallest size of a sustainably grown small crack and whether a single mode-I interlamellar crack can propagate non-stop to cause a failure. In this near-lamellar γ-TiAl alloy, for a mode-I interlamellar crack with the colony size ranging from 40 to 130 μm (as given above), under fatigue loading levels of σmax = 450 MPa at R = 0.1 and σmax = 565 MPa at R = 0.5, the ΔK and Kmax for the embedded penny-shaped cracks were calculated and listed in Table 3. The stress levels were determined using average stress values at each R ratio as given in Table 1. The calculations were made based on the basis of small variations (±50 MPa) of the stress values not affecting the results significantly. The average ΔK values were calculated using the average colony size of 80 μm. As reported by other authors, the fatigue threshold (ΔKth) for short fatigue cracks in lamellar TiAl alloys is scattered at R = 0.1 ranging from ~3.5 to 6.5 MPa·m1/2 as strongly dominated by the localised microstructures [7], and as low as 1.9 MPa·m1/2 in the case of R = 0.5 [20]. Although, the upper ΔKth values in Table 3 are very similar to the lower limits of the above testified ΔKth, in fact, an interlamellar crack cannot grow across an entire colony without deviation. That is to say, the real values should be smaller than the data in Table 3. Therefore, a single large mode-I interlamellar fracture, the colony size of which is defined as 80–130 μm, has little chance to form a sustainably grown fatigue crack. However, two or more (depending on colony size) of the adjacent colonies near the mode-I orientation are likely to reach a critical size of fatigue thresholds in a lamellar γ-TiAl alloys.

4.3. Effect of Stress Ratio on Naturally Initiated Fatigue Cracks

In terms of ΔK and Kmax, ΔK is normally referred to as the driving force ahead of the crack tip, which is high enough to create crack-tip damage and therefore triggers crack growth. Kmax can be interpreted as the peak stress necessary to fatigue open the crack-tip bonds, which is sensitive to the crack-tip environment [22]. In lamellar structures, authors reported ΔK and Kmax are different predominant mechanisms at low and high stress ratios, respectively [20,23].
As indicated by the fracture surfaces, it is obvious that fatigue crack nucleation mechanisms are different at low and high R ratios. At R = 0.1, cracks are likely to initiate from several similarly oriented interlamellar fractures, stress concentrated areas or surface damages, whereas the interlamellar fractures found in the crack initiation sites of R = 0.5 tests show various angles. Normally in ductile metals, crack growth is mainly controlled by ΔK via crack tip opening and blunting during loading and resharpening on unloading, leaving a relatively flat fracture surface. At high Kmax fatigue loading level where Kmax plays a more predominant role, crack growth is close to the circumstances under a monotonic load, i.e., static modes, which involves fracture modes of cleavage, intergranular cracking and microcrack coalescence. Such a Kmax−controlled mechanism makes the fracture surface more tortuous and multifaceted in lamellar alloys [24]. The fractographic observations at R = 0.1 and R = 0.5 coincide with the features caused by ΔK- and Kmax-predominant fracture mechanisms, respectively.
As seen in Table 2, the ultimate average ΔK values are higher at R = 0.1, while the average Kmax values are higher at R = 0.5. It also can add weight to the conclusion that ΔK plays a more important role at low stress ratios while Kmax is more dominant at high stress ratios. The authors proposed that the stress ratio effects in lamellar TiAl alloys are related to the crack closure mechanisms and explained the ΔK- and Kmax-controlled mechanisms via this factors [8,20,25]. Most of these closure mechanisms are associated with the build-up crack wakes, such as the two main extrinsic shielding mechanisms in lamellar TiAl alloys which are a bridging effect caused by the unbroken lamellas [20,26] and contact shielding effect caused by the rough crack surfaces [27]. Intrinsic mechanisms are also available in the lamellar structure which are related to the loading history, for example, microcracks produced ahead of the crack tip during pre-loading history can reduce local stress intensity around the crack tip [23]. Nevertheless, this crack closure concept is not applicable for short or small cracks (especially for microstructurally short cracks) and crack initiation due to a lack of crack wake and pre-loading history. Another reason for the “short/small crack” behaviour is that short cracks can propagate at lower ΔKth and higher growth rate than long cracks [28,29,30]. Therefore, ΔK and Kmax affect the fatigue crack initiation modes much more intrinsically.
Wessel et al. [6] observed that microcracks are most likely to nucleate in colonies at 60°–80° to the loading axis in a TNM-B1 alloy. Besides, Kruzic et al. [7] found that cracks mostly nucleate in colonies with orientations perpendicular to the maximum tensile direction (90°) or along maximum shear stress directions (45°). Both results imply that shear deformation plays an important role in crack initiation. However, obvious inclined interlamellar fractures are mainly observed in the fatigue crack initiation areas of specimens tested at R = 0.5. The interlamellar fractures at R = 0.1 are almost near the mode-I direction. The longitudinal plasticity at R = 0.5 requires the local critical resolved shear stress to be reached. Theoretically, for an oblique crack with respect to the axial tensile loading (σ) axis at an angle, θ, the function for the shear stress (τ) is τ = (σ/2) sin2θ [31]. As mentioned above, the maximum shear stress of 0.5σ is obtained at θ = ± 45°, and thereby 0 ≤ τ ≤ 0.5σ depending on the values of θ and σ. The delamination can only occur at oblique angles if the axial tensile stress is high enough to result in a sufficient shear stress. It can be inferred from the observations that the starting fatigue stress level at R = 0.1 is not high enough to initiate a significant amount of shear plastic deformation between the lamellar interface, or it will be easy to find more oblique interlamellar facets in the crack initiation areas of RC1 and RC2.
Fundamentally, Kmax and ΔK are both responsible for the crack propagation. Kmax is related to monotonic plastic flows for breaking the crack tip bonds, such as internal stresses and chemical bonds. In general, Kmax is more static rather than a cyclic type of force, and thus its ability to promote crack growth is closely related to the microstructure around the crack tip, while ΔK is related to cyclic plastic flow which facilitates crack propagation mainly via promote the movement and formation of crystal defects and does not strongly interact with the metallurgical microstructure [32]. In this lamellar alloy, when the stress ratio is high, microcracks can initiate at a lamellar interface with various orientations but are difficult to propagate via translamellar fractures due to a weak capacity of driving dislocation and twinning across lamellae (ΔK value is low). Thus, crack propagation via coalesce of adjacent interlamellar fractures and colony boundary cracking result in clusters of multi-angles interlamellar fractures at the crack initiation sites. When the stress ratio is low, microcracks can only nucleate at colonies near mode-I orientation owing to insufficiently resolved shear stress. Although at higher ΔK values the accumulation of crack-tip damage and nucleation of microcrack can be promoted, the short crack can grow continuously only if the critical crack size is reached. Consequently, the fatigue crack initiation area appears as a conjoined mode-I interlamellar fracture cluster surrounded by a large portion of translamellar fractures.

4.4. Short Fatigue Crack in Lamellar γ-TiAl Alloys

Although short cracks are not a novel topic for γ-TiAl alloys, their initiation at different stress ratios was rarely studied. In the work of Wessel et al. [6], the crack extension is divided into four phases. The first phase is called “microstructurally short cracks”, of which the crack size is determined by the size of a single colony. At the second stage, microcracks overcome microstructural barriers and grow into the neighbouring colonies. During the third stage, cracks can extend to a “physically short cracks” scale which is larger than the microstructural units and local plasticity zone but still physically small [30]. At the final stage, short cracks propagate to long cracks. This theory is applicative for the circumstance of R = 0.1 in this study, but the first stage here involves three to four colonies rather than just one. When referring to the circumstance at R = 0.5, the first three phases need to be redefined as: (1) microcracks firstly nucleate at weakly oriented colonies; (2) microcracks start to form at high-angle colonies as shear stress increased; (3) microcracks at different angles join together mainly via colony boundary cracking to form “physically short cracks” and then grow into long cracks.
For practical concerns, this near-fully lamellar γ-TiAl alloy can achieve higher ultimate maximum fatigue loading at a high stress ratio than at a low stress ratio. For lamellar γ-TiAl alloys, colony size, microstructural anisotropy and surface condition need to be carefully controlled to avoid the initiation of short cracks which can grow into long cracks causing catastrophic failure of components. The measurement of the fatigue threshold of short cracks needs to be carefully designed in order to simulate the real critical short crack length and even crack morphology, and therefore accurately decide the magnitude of tolerable cyclic-stress levels in a damage tolerance approach. Last but not the least, large groups of equiaxed γ-grains need to be discreetly controlled as their appearance at crack initiation sites probably facilitates the crack propagation.

5. Conclusions

Short cracks can naturally initiate in the near lamellar γ-TiAl alloy (Ti-45Al-2Mn-2Nb-1B at.%) under different fatigue stress ratios at room temperature. These short cracks can grow into long cracks and lead to catastrophic failure of the material in brittle manners through two distinct mechanisms:
  • At a low stress ratio (R = 0.1), the short fatigue cracks are likely to initiate either from three to four conjoined interlamellar fractures at or near mode-I direction or stress concentration areas, e.g., machining surface damage. These mode-I cracks can grow translamellarly to become long cracks and lead to the final failure. Specimens failed at lower ultimate maximum fatigue stresses compared to the tests carried out at R = 0.5.
  • At a high stress ratio (R = 0.5), microcracks still tend to firstly nucleate at colonies at or near mode-I orientation, but as a consequence of increased shear stress, interlamellar fractures can be formed at higher angles due to shear deformation. Unlike the circumstance at R = 0.1, the critical crack length is reached by coalescence of the interlamellar fractures at various angles, which is achieved primarily via colony boundary cracking and a small portion of translamellar fractures. The fatigue crack initiation sites are relatively tortuous and multifaceted compared to the R = 0.1 tests.
In the absence of several connected colonies which are near the mode-I direction, the specimen RC2 still failed as a result of multiple crack initiation sites, of which surface damage is suspected. Therefore, from the viewpoint of practical application, engineering components made from lamellar γ−TiAl alloys need to be carefully inspected for their surface finish and cleanliness before being used in service, since the lamellar alloys are sensitive to the stress concentration. It is important to design the microstructure to obtain an optimum combination of colony size and mechanical properties and to select an appropriate manufacturing process to ensure a good microstructural anisotropy, as both colony size and colony orientation can directly affect the crack initiation as seen in this study.

Author Contributions

Investigation, S.W. and Y.X.; Data curation, S.W.; Writing-original draft, S.W.; Writing-review & editing, S.W.; Supervision, H.L. and P.B.; Funding acquisition, P.B.

Funding

This research received no external funding.

Acknowledgments

This work was conducted in the University of Birmingham, UK. The author would like to acknowledge Paul Bowen and Hangyue Li for their supervision and funding support on this study.

Conflicts of Interest

The authors declare no conflict of interest.

References

  1. Lee, H.J.; Strahan, N.; Boyd, E. Turbocharger Jet Engine Build. and Engineering Analysis; Mechanical Engineering and Materials Science Independent Study at Washington University: St. Louis, MO, USA, 2016. [Google Scholar]
  2. Jha, S.K.; Larsen, J.M.; Rosenberger, A.H. The role of competing mechanisms in the fatigue life variability of a nearly fully-lamellar γ-TiAl based alloy. Acta Mater. 2005, 53, 1293–1304. [Google Scholar] [CrossRef]
  3. Chan, K.S. Toughening mechanisms in titanium aluminides. Metall. Trans. A 1993, 24, 569–583. [Google Scholar] [CrossRef]
  4. Campbell, J.P.; Venkateswara Rao, K.T.; Ritchie, R.O. On the role of microstructure in fatigue-crack growth of γ-based titanium aluminides. Mater. Sci. Eng. A 1997, 239–240, 722–728. [Google Scholar] [CrossRef]
  5. Appel, F.; Wagner, R. Microstructure and deformation of two-phase γ-titanium aluminides. Mater. Sci. Eng. R Rep. 1998, 22, 187–268. [Google Scholar] [CrossRef]
  6. Wessel, W.; Zeismann, F.; Brueckner-Foit, A. Short fatigue cracks in intermetallic γ-TiAl-alloys. Fatigue Fract. Eng. Mater. Struct. 2016, 38, 1507–1518. [Google Scholar] [CrossRef]
  7. Kruzic, J.J.; Campbell, J.P.; Ritchie, R.O. On the fatigue behavior of gamma-based titanium aluminides: Role of small cracks. Acta Mater. 1999, 47, 801–816. [Google Scholar] [CrossRef]
  8. Pippan, R.; Hageneder, P.; Knabl, W.; Clemens, H.; Hebesberger, T.; Tabernig, B. Fatigue threshold and crack propagation in gamma-TiAl sheets. Intermetallics 2001, 9, 89–96. [Google Scholar] [CrossRef]
  9. Schijve, J. Fatigue of Structures and Materials; Springer Science & Business Media: Berlin, Germany, 2001. [Google Scholar]
  10. Gnanamoorthy, R.; Mutoh, Y.; Mizuhara, Y. Fatigue crack growth behavior of equiaxed, duplex and lamellar microstructure γ-base titanium aluminides. Intermetallics 1996, 4, 525–532. [Google Scholar] [CrossRef]
  11. Kim, Y.-W. Effects of microstructure on the deformation and fracture of γ-TiAl alloys. Mater. Sci. Eng. A 1995, 192–193, 519–533. [Google Scholar] [CrossRef]
  12. Gnanamoorthy, R.; Mutoh, Y.; Hayashi, K.; Mizuhara, Y. Influence of lamellar lath orientation on the fatigue crack growth behavior of gamma base titanium aluminides. Scr. Metall. Mater. 1995, 33, 907–912. [Google Scholar] [CrossRef]
  13. Yang, J.; Li, H.; Hu, D.; Martin, N.; Dixon, M. Lamellar orientation effect on fatigue crack propagation threshold in coarse grained Ti46Al8Nb. Mater. Sci. Technol. 2014, 30, 1905–1910. [Google Scholar] [CrossRef]
  14. Wang, Y.; Yuan, H.; Ding, H.; Chen, R.; Guo, J.; Fu, H.; Li, W. Effects of lamellar orientation on the fracture toughness of TiAl PST crystals. Mater. Sci. Eng. A 2019, 752, 199–205. [Google Scholar] [CrossRef]
  15. Huang, Z.W.; Bowen, P.; Jones, I.P. Transmission electron microscopy investigation of fatigue crack tip plastic zones in a polycrystalline γ-TiAl-based alloy. Philos. Mag. A 2001, 81, 2183–2197. [Google Scholar] [CrossRef]
  16. Appel, F.; Paul, J.D.H.; Oehring, M. Gamma Titanium Aluminide Alloys: Science and Technology; Wiley: Hoboken, NJ, USA, 2011. [Google Scholar]
  17. Chen, M.; Lin, D.; Da, C. Influence of lamellar lath orientation on crack propagation in a gamma TiAl alloy. Acta Met. Sin. 1994, 36, 497–501. [Google Scholar] [CrossRef]
  18. Chan, K.S.; Wang, P.; Bhate, N.; Kumar, K.S. Intrinsic and extrinsic fracture resistance in lamellar TiAl alloys. Acta Mater. 2004, 52, 4601–4614. [Google Scholar] [CrossRef]
  19. Levan, A.; Royer, J. Part-circular surface cracks in round bars under tension, bending and twisting. Int. J. Fract. 1993, 61, 71–99. [Google Scholar] [CrossRef]
  20. Zhu, S.J.; Peng, L.M.; Moriya, T.; Mutoh, Y. Effect of stress ratio on fatigue crack growth in TiAl intermetallics at room and elevated temperatures. Mater. Sci. Eng. A 2000, 290, 198–206. [Google Scholar] [CrossRef]
  21. Schijve, J. Stress Intensity Factors of Cracks. In Fatigue of Structures and Materials; Springer: Berlin, Germany, 2009; pp. 105–140. [Google Scholar]
  22. Sadananda, K.; Vasudevan, A. Fatigue crack growth behaviour in titanium aluminides. Mater. Sci. Eng. A 1995, 192, 490–501. [Google Scholar] [CrossRef]
  23. Ritchie, R.O. Mechanisms of fatigue crack propagation in metals, ceramics and composites: Role of crack tip shielding. Mater. Sci. Eng. A 1988, 103, 15–28. [Google Scholar] [CrossRef]
  24. Ritchie, R.O. Mechanisms of fatigue-crack propagation in ductile and brittle solids. Int. J. Fract. 1999, 100, 55–83. [Google Scholar] [CrossRef]
  25. Hénaff, G.; Gloanec, A.-L. Fatigue properties of TiAl alloys. Intermetallics 2005, 13, 543–558. [Google Scholar] [CrossRef]
  26. Campbell, J.P.; Kruzic, J.J.; Lillibridge, S.; Venkateswara Rao, K.T.; Ritchie, R.O. On the growth of small fatigue cracks in γ-based titanium aluminides. Scr. Mater. 1997, 37, 707–712. [Google Scholar] [CrossRef]
  27. Henaff, G.; Cohen, S.A.; Mabru, C.; Petit, J. The role of crack closure in fatigue crack propagation behaviour of a TiAl-based alloy. Scr. Mater. 1996, 34, 1449–1454. [Google Scholar] [CrossRef]
  28. El Haddad, M.H.; Smith, K.N.; Topper, T.H. Fatigue Crack Propagation of Short Cracks. J. Eng. Mater. Technol. 1979, 101, 42–46. [Google Scholar] [CrossRef]
  29. Taylor, D.; Knott, J. Fatigue crack propagation behaviour of short cracks; the effect of microstructure. Fatigue Fract. Eng. Mater. Struct. 1981, 4, 147–155. [Google Scholar] [CrossRef]
  30. Ritchie, R.; Peters, J. Small fatigue cracks: mechanics, mechanisms and engineering applications. Mater. Trans. 2001, 42, 58–67. [Google Scholar] [CrossRef]
  31. Patnaik, S.N.; Hopkins, D.A. Chapter 2–Determinate Truss. In Strength of Materials: A New Unified Theory for the 21st Century; Elsevier: Amsterdam, The Netherlands, 2004; pp. 55–128. [Google Scholar]
  32. Sadananda, K.; Vasudevan, A.K. Multiple mechanisms controlling fatigue crack growth. Fatigue Fract. Eng. Mater. Struct. 2003, 26, 835–845. [Google Scholar] [CrossRef]
Figure 1. Microstructure of the near-lamellar alloy.
Metals 09 01101 g001
Figure 2. Geometry of cylindrical specimens used for naturally initiated short fatigue crack tests. The unit of dimensions is in mm.
Metals 09 01101 g002
Figure 3. RC1 was tested with an R ratio of 0.1. Scanning electron microscopy (SEM) images show (a) general morphology of fracture surface; (b) a cluster of interlamellar fractures outlined by red dashed lines that were surrounded by translamellar fractures and (c) details of coalescent interlamellar fractures. The four connected interlamellar facets are indicated by red numbers.
Metals 09 01101 g003
Figure 4. RC2 was tested with an R ratio of 0.1. SEM images show (a) general morphology of fracture surface with multi crack initiation source, which are (b) shallow surface damage and (c) close interlamellar fractures. (d) and (e) are high magnification images of interlamellar fractures found at the crack initiation site (c). (f) is a high magnification image showing the equiaxed γ grain clusters in site (c).
Metals 09 01101 g004
Figure 5. RC3 was tested with an R ratio of 0.5. SEM images show (a) general morphology of fracture surface, (b) coalescent interlamellar fractures indicated by red dashed lines in the fatigue crack initiation area and (c) details of coalescent interlamellar fractures. The four connected interlamellar facets at different angles are indicated by red numbers.
Metals 09 01101 g005
Figure 6. RC4 was tested with an R ratio of 0.5. SEM images show (a) general morphology of fracture surface, (b) coalescent interlamellar fractures indicated by red dashed lines in the fatigue crack initiation area and (c) details of coalescent interlamellar fractures. The four connected interlamellar facets at different angles are indicated by red numbers.
Metals 09 01101 g006
Table 1. Summary of R ratio, ultimate stresses and duration at final failure.
Specimen IDStress Ratio (R)σmax/MPaσmin/MPaΔσ/MPaTotal Cycle
RC10.142542.5382.56.6 × 106
RC20.147547.5427.53.7 × 106
RC30.55702852852.6 × 106
RC40.55602802808.4 × 106
Table 2. Summary of crack type, equivalent crack length, stress intensity factor solution and stress intensity factor (ΔK and Kmax) for naturally initiated fatigue short cracks.
Specimen IDCrack Typea (μm)K Solution ΔK
(MPa·m1/2)
Κmax
(MPa·m1/2)
RC1surface breaking semi-circular crack178 K = 0.7 ( σ π a ) [19]6.47.1
RC2multi surface breaking crackN/AN/AN/AN/A
RC3embedded penny-shaped crack242 K = 2 / π ( σ π a ) [21]5.010.0
RC4embedded penny-shaped crack280 K = 2 / π ( σ π a ) [21]5.310.6
Table 3. Summary of ΔK and Kmax for mode-I surface breaking semi-circular and embedded penny-shaped microcracks within a single colony the size of which is ranging from 40 to 130 μm under R = 0.1 and R = 0.5.
Crack TypeR Ratioσmax (MPa)2a (μm)ΔK (MPa·m1/2)Average ΔK (MPa·m1/2)Kmax (MPa·m1/2)
embedded penny-shaped microcrack0.145040–130
(80 for average)
2.1–3.73.22.3–4.1
0.55651.4–2.62.02.8–5.2

