Abstract
The use of eddy currents for detecting flaws in specimens is of considerable significance in the industrial sector. In this study, a new design of a rotating uniform eddy current (UEC) probe, termed the rotating butterfly probe, is presented. The probe consists of two pairs of excitation coils arranged perpendicular to each other, positioned in two layers, and in a detection coil. The excitation and detection coils were installed the pancake orientation, which provides larger induction and enhances the sensitivity of flaws detection. In addition, to generate a rotating UEC distribution with same amplitude in all directions, the number of turns between first and second layers of the excitation coils and the amplitude of excitation current were arranged. Finite element simulations were conducted to confirm that rotating UEC distribution has the same amplitude in all directions. The experiment with the rotating butterfly probe was then conducted. In the experiment, the measured results with the probe was indicated the self-differential and self-nulling properties. Moreover, the probe was successful in detecting flaws in all directions on an aluminum plate. This attribute can be used for the effective inspection of test pieces.
1. Introduction
Eddy current testing using electromagnetic phenomena is a very useful method for detecting flaws such as cracks on the surface of a test piece, and is widely used in the industry [1,2,3,4,5]. Eddy current probes have been used to enhance the signal/noise (S/N) ratio [6].
Two approaches are employed for the development of eddy current probes. The first involves the increase in the intensity of the generated eddy current by modifying the position and shape of the excitation coils. The second is to improve the electromotive force of the detection coil by modifying its position and shape; this improvement in the electromotive force is a function of the interaction zone, the nature of self-differential, and self-nulling [7,8,9,10].
To achieve a high S/N ratio from the signal, a uniform eddy current (UEC) probe is used [11,12]. A UEC probe is a specially designed probe such that the configuration of the excitation coil provides UEC distribution, and the detection coils are characterized by self-differential and self-nulling features [4].
A Hoshi probe, as a fundamental UEC probe, was invented by Hoshikawa. It consists of a large tangential rectangular excitation coil and a small pancake circular detection coil whose position is in the backside surface of the middle of the excitation coil. A Hoshi probe was designed to detect flaws such as cracks on the weld zone having uneven surface a nonmagnetic material [11,13]. By improving the detectability of the flaw based on further studies by Hoshikawa, a cross probe and plus probe of the UEC probe were invented. The cross probe consists of a large tangential rectangular excitation coil and a large tangential rectangular detection coil, while the plus probe consists of a large tangential rectangular excitation coil and two tangential rectangular detection coils [14,15,16]. Another type, a developed tangential eddy current array probe, can provide a clear measurement signal of surface flaws despite changes in lift-off and permeability [17].
As one of the UEC probe types, UEC probe with a giant magnetoresistance (GMR) detector (that is, in conjunction with a magnetic sensor) was studied. The probe consists of one tangential rectangular excitation coil and a GMR detector. The probe can work at frequencies below 1 kHz, and thereby, can detect deeper flaws from the surface of the test piece [18,19,20]. A similar type, using a tunnel magnetoresistance sensor, with a rotating UEC orientation, was able to detect flaws in carbon fiber reinforced polymers with variation in orientation and length of the flaws [21].
The recent probe design that uses the UEC principle is a differential planar eddy current probe, was called the IOnic probe. The probe consists of one tangential rectangular excitation coil and two pancake semicircular planar coils as the detector, and is capable of detecting fine flaws. However, the production of the probe requires high precision as the symmetrical planar spiral detectors must be identical on both sides [22,23,24].
In the UEC probe, the excitation coils are tangentially oriented to generate UEC distribution. However, this orientation provides a weak induction on the test piece, resulting in low amplitude of UEC as well. Recently, a new UEC probe consisting of a pair of rectangular excitation coils and a pick-up coil that are pancake-oriented was developed by our research group and was called a one-directional butterfly probe by the authors [24,25]. This probe has a large electromagnetic field induction on the test piece, and thereby has the advantage of a large S/N ratio. However, the butterfly probe uses a unidirectional UEC, and it has the disadvantage of not being able to detect a flaw whose direction is parallel to the flow of UEC.
Therefore, to overcome this disadvantage, the one-directional butterfly probe was improved. In this study, a UEC probe consisting of two pairs of rectangular pancake excitation coils arranged in two layers and a circular pancake detection coil has been proposed. The configuration of the probe was designed so as to generate a rotating UEC that is able to detect cracks in all directions. This was called the rotating butterfly probe by authors. The UEC distribution by a rotating butterfly probe was analyzed via finite element simulation. Furthermore, experiments were carried out to examine the detectability of flaws in all directions on the surface of an aluminum plate.
2. Materials and Methods
2.1. Rotating Butterfly Probe Design
A one-direction butterfly probe proposed in a previous study [21] was modified into a rotating butterfly probe.
The structure of the rotating butterfly probe is shown in Figure 1. It consists of two pairs of rectangular excitation coils arranged in two layers whose longitudinal axes are perpendicular to each other. A circular detection coil is present at the bottom middle of the probe.
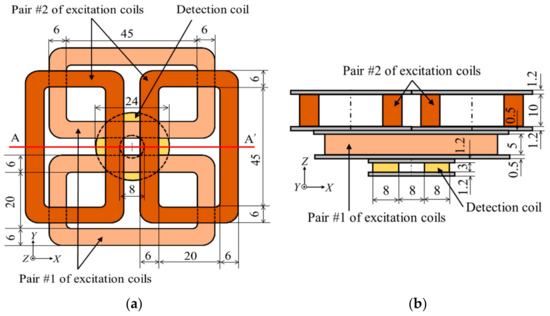
Figure 1.
The structure of the coils in a rotating butterfly probe, all dimensions in mm, (a) top view (b) section view of A-A’.
The number of turns of each excitation coil of pair #1 of excitation coils was 500, the total number of turns being 1000. The number of turns of each excitation coil of pair #2 of excitation coils was 1000; thus, the total number of turns was 2000. The purpose of a larger number of turns of coils for pair #2 was to induce the same induction strength to the test pieces as pair #1, considering that the former has a larger lift-off value (11.5 mm). The number of turns of the detection coil was 330 turns.
Figure 2 shows the rotating UEC distribution when using the rotating butterfly probe. Since the two pairs of the excitation coils were orthogonally installed, it is assumed that UEC1 generated from pair #1 of the excitation coils flows in y direction, while UEC2 generated from pair #2 of the excitation coils flows in x direction. UEC1 and UEC2 are, respectively, the UECs that are generated by pair #1 and #2 of excitation coils, using two excitation currents for which the phase difference is 90°. The rotating UEC is the resultant UEC (RUEC) of the UECs generated by pair #1 and pair #2 of the excitation coils, as given by the following equations:
where T is the period of the excitation current, A is the amplitude of the UECs, and φR is the RUEC direction on the surface of the test piece. When two excitation currents are flowing in the same period, RUEC is rotated in all directions with constant amplitude.
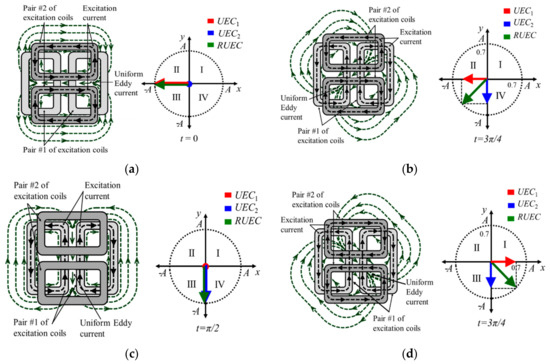
Figure 2.
Uniform eddy current (UEC) distribution with the rotating butterfly probe (a) t = 0, (b) t = π/4, (c) t = π/2, and (d) t = 3π/4.
The principles of the electromotive force of pancake circular detection coil with flaws and without flaws are the same as that of a one-directional UEC probe. There are two conditions of the detection coil in the butterfly probe: balanced and unbalanced. These conditions are determined by the response of the interaction zone of the detection coil against the UEC, as shown by the red dotted line in Figure 3.
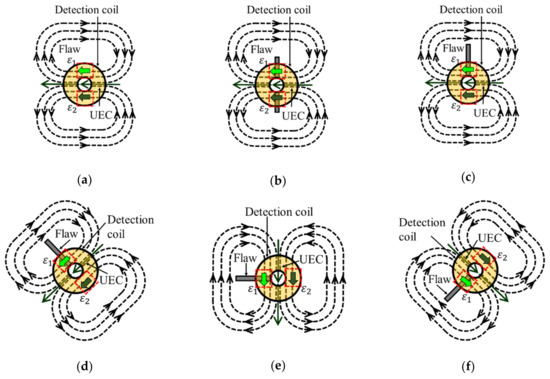
Figure 3.
The resultant UEC (RUEC) distribution patterns of the rotating butterfly probe based on the excitation signal cycle. (a) RUEC at 0 position, (b) RUEC at π/2 position, (c) RUEC at π/4 position, and (d) RUEC on 3π/4 position.
Under the balanced condition, ε1 and ε2 of the electromotive force of the detection coil are of the same amplitude, but opposite in polarities, as shown in Figure 3a. As a result, they cancel each other out. This phenomenon is called self-nulling, where the detection coil output is zero. The output is also zero when the probe is positioned in the middle of a flaw, as shown in Figure 3b; this is because the eddy currents have the same disturbance on both the sides of the detection coil.
The model in which the edge of a flaw is located under the detection coil is shown in Figure 3c. Because the disturbance caused by the flaw caused ε1 and ε2 of the detection coil to have unequal amplitudes, an output is generated. When there is a flaw on the surface of the test piece, the rotating UEC has a position perpendicular to that of the flaw, as shown in Figure 3c,d. In this position, the signal of the detection coil picks up the disturbance due to the flaw, which provides a maximum signal during the measurement. Furthermore, the self-nulling characteristic of the pick-up coil maintains even under the rotating UEC distribution. Finally, to ensure high accuracy of the rotating butterfly probe, the resultant UEC generated from pairs #1 and #2 of the excitation coils should have the same amplitude in all directions. Moreover, the excitation coils and the pick-up coil must have a self-nulling characteristic.
2.2. Numerical Calculations
The distribution of rotating UEC on the surface of the test piece was analyzed with a time-harmonic analysis. In the analysis, with Magnet 7 version 7.4.1 (Mentor Graphics Corporation, Wilsonville, OR, USA), which used the current vector potential (T), the magnetic scalar potential (Ω) method was used. In conducting medium, the basic equations of the method are expressed by using Faraday’s law, Ampere’s law and constitutive relation:
where the various quantities involved are defined as
- E: Electric field intensity (V/m)
- H: Magnetic field intensity (A/m)
- B: Magnetic flux density (T)
- J: Current density (A/m2)
- t: Time (s)
- ε: Material permittivity (F/m)
- σ: Material conductivity (S/m)
- μ: Magnetic permeability (H/m)
We then have the following equation by using Equations (5) to (8):
The software is used together with Equations (9) and (10).
The element of the mesh was modeled as a linear superposition of polynomial basis function for high accuracy. The total number of meshes was 947,420. The analysis was carried out with the meshes of the rotating butterfly probe and the area under the probe as small a size as possible within the performance of a personal computer.
Figure 4 shows the analytical model set up of the rotating butterfly probe. The size and configuration of the rotating UEC probe were the same as those shown in Figure 1. In the analytical model, an aluminum plate test piece was modeled with dimensions of 120 mm in width, 120 mm in length, and 10 mm in thickness. Table 1 shows the electromagnetic parameters used in the analysis.
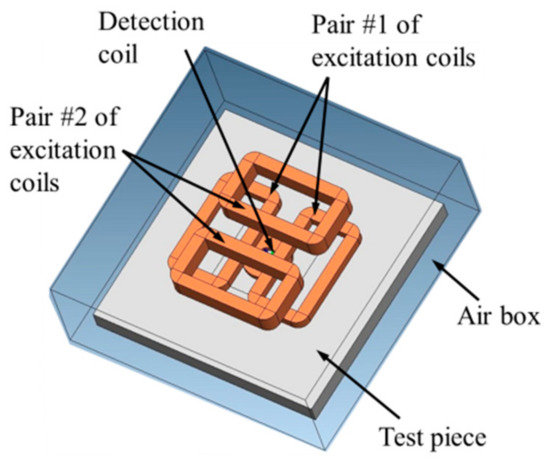
Figure 4.
The analytical model set up of the rotating butterfly probe.

Table 1.
Electromagnetic parameters used in analysis.
Pair #1 and #2 of the excitation coils were supplied with a 6.5 mA and 9.5 mA current, respectively, at a frequency of 10 kHz. The phase difference of the excitation currents between pair #1 of excitation coils was 90°.
Figure 5 shows the arrow plot of the UEC distribution on the surface of the test piece with the rotating butterfly probe. When the phases of excitation currents were 0 and 90°, respectively, the UEC from pair #2 of excitation coils was at a maximum, while that from pair #1 was zero. As a result, the resultant UEC was formed in y direction, as shown in Figure 5a. When the phases of excitation currents were 45°and 135°, respectively, the UEC from pair #1 and #2 of the excitation coils was of the same amplitude. Thus, the resultant UEC was formed at 135° as shown in Figure 5b. When the phases of excitation currents were 90° and 135°, respectively, the UEC from pair #1 of excitation coils was at a maximum, while that from pair #2 was zero. Therefore, the resultant UEC was formed in y direction, as shown in Figure 5c.
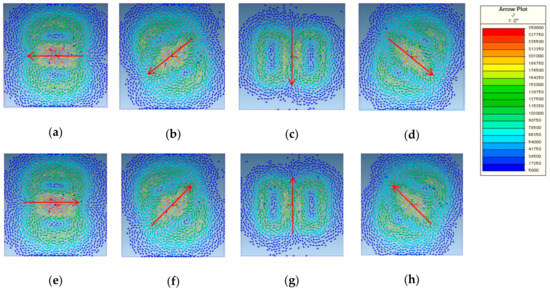
Figure 5.
Arrow plot of the UEC distribution on the surface of the test piece with the rotating butterfly probe. (a) t = 0, (b) t = π/4, (c) t = π/2, (d) t = 3π/4, (e) t = π, (f) t = 5π/4, (g) t = 3π/2, and (h) t = 7π/4.
Similarly, as shown in Figure 5a–h, the distribution of UEC with the rotating butterfly probe was in a counterclockwise direction. The intensity of the rotating UEC in the area under the middle of the probe was almost the same although the intensity of the UEC at 90°and 270° was a little lower.
2.3. Experimental Setup
The test piece used for the study is shown in Figure 6, with dimensions of 315 mm in width, 315 mm in length, and 10 mm in thickness. Four flaws of different lengths and depths on the surface of the test piece were made; the specific dimensions are given in Table 2. The specifications of the coils are summarized in Table 3.
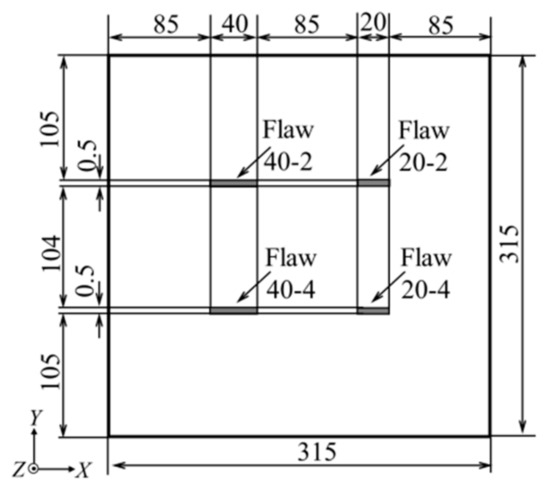
Figure 6.
Specifications of test piece (units in mm).
Table 2.
Size of flaws on test piece surface.
Table 3.
Specifications of the rotating butterfly probe of 10 kHz.
Figure 7 represents the experimental set-up using the rotating butterfly probe. Two excitation currents of sine wave with 10 kHz were generated using a synthesizer. Two excitation currents, with a phase difference of 90°, were then amplified to 6.5 mA and 9.5 mA for pair #1 and #2 of the excitation coils, respectively, using high speed bipolar amplifiers. The signal of the detection coil was analyzed via a two-phase lock in the amplifier to obtain the amplitude and phase of the signal. The acquired data were stored using a digital oscilloscope having a frequency of 4 Hz.
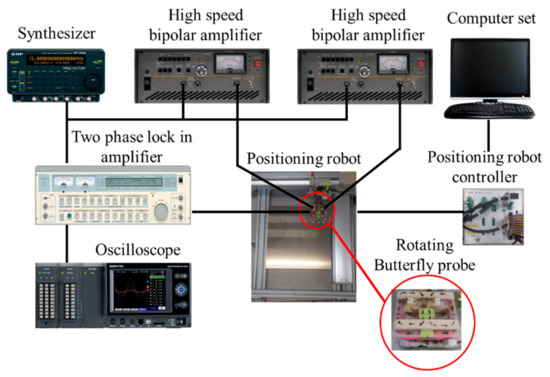
Figure 7.
Experimental set-up using the rotating butterfly probe.
The rotating butterfly probe was moved by a positioning robot to scan the surface of the test piece. The robot’s speed was set to 10 mm/s and the scanning interval was 2.5 mm for both the x and y directions. The distance between the probe and the surface of the test piece was approximately 1.2 mm.
3. Experimental Results
Figure 8 shows the scanning direction of the rotating butterfly probe on the test piece. There are four patterns of scanning, as shown in Figure 8a,b. Scanning #1 was for the rotating butterfly probe moving along the y axis (blue line); it was repeated by shifting it in the x axis direction (red line). In scanning #2, the rotating butterfly probe moved along the x axis (red line), and then was shifted in the y axis direction (blue line).
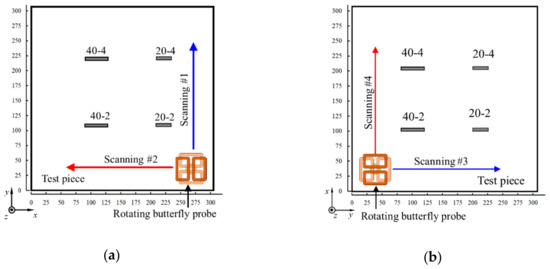
Figure 8.
Scanning direction of the rotating butterfly probe. (a) The flaws are parallel to the x axis. The axis of pair #2 of the excitation coils is perpendicular to the flaw lengths. (b) The flaws are parallel to the y axis. The axis of pair #1 of the excitation coils was perpendicular to the flaw lengths.
In scanning #3 and #4, the position of the test piece was rotated by 90° from its position during scanning #1 and #2. Scanning #3 involved the moving of the rotating butterfly probe along the y axis (blue line), followed by shifting in the x axis direction (red line). In scanning #4, the probe moved along the x axis (red line), and then shifted in the y axis direction (blue line). In scanning #1 and #2, the flaws were parallel to the x axis, and the axis of pair #2 of the excitation coils was perpendicular to the flaw lengths. In scanning #3 and #4, the flaws were parallel to the y axis, and the axis of pair #1 of the excitation coils was perpendicular to the flaw lengths. These scanning paths allow further discussion regarding the orientation of the flaws and the scanning paths.
The measurement results from scanning #1 to scanning #4 are shown in Figure 9. In general, the measurement results clearly distinguish the signals from flaws, which is indicated by the presence of two peaks of amplitudes for each flaw. However, there were significant differences in the amplitude and peak patterns of the amplitude between the results of scanning #1 and #2 compared with the results of scanning #3 and #4. The repeatability of measured results with the rotating butterfly probe was investigated. As a result, similar results with a similar amplitude and distribution were obtained.
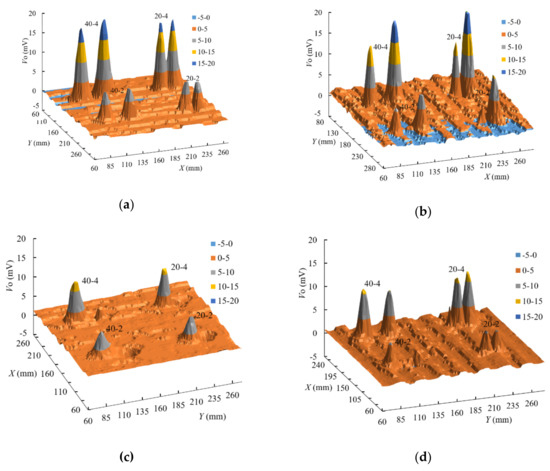
Figure 9.
Measurement results (a) scanning #1, (b) scanning #2, (c) scanning #3, and (d) scanning #4.
3.1. Measurement of Flaws in Scanning with Parallel to x Axis
In Figure 9a, the two peaks of the signal on the edge of the flaw were relatively similar. The signals of 40-4 and 20-4 were approximately 18 mV, and the signals of 40-2 and 20-2 were nearly 8 mV. The amplitude of the signal of flaw depth of 4 mm was twice as large as that of the flaw depth of 2 mm. Moreover, the distance between the peaks of the signal of each flaw corresponded to the flaw length itself.
Figure 9b shows the measurement result of scanning # 2. The signals were clear, although the two peaks of the signal from each flaw were not the same. The amplitude of peak at one end of a flaw, which was first scanned by the probe, was larger than that at another end of the flaw that was scanned subsequently.
3.2. Measurement of Flaws in Scanning with Parallel to y Axis
The measurement results of scanning #3 are shown in Figure 9c. All detection signals differed from the other measurement results, signifying that the signal did not have two peaks. However, the amplitude of the peak of the signal size was relatively similar to that in scanning #4.
Figure 9d shows the measurement result of scanning #4. Three flaws, 40-4, 20-4, and 20-2, were clearly detected with two signal peaks. The amplitude of the peaks of flaws 40-4 and 20-4 were approximately 11 mV, while the amplitude of the peaks of flaws 20-2 measure approximately 5.5 mV. However, the amplitude of the larger peak for the 40-2 flaw was approximately 5.5 mV, while the amplitude of another peak was almost half (approximately 3 mV).
4. Discussion
Based on the measurement results, two issues from experimental findings were analyzed. The first issue was that the peak amplitude of scanning #1 and #2 was approximately 1.5 times higher than those of scanning #3 and #4. This was caused by the influence of induction strength that dominates from pair #1 and #2 of excitation coils in the measurement. By considering the structure of the butterfly probe and the mounting condition of the probe to the positioning robot, the predominant factor affecting the amplitude of the peak of the signal was whether the axis of the excitation coils was perpendicular to the flaw length or not. In scanning #1 and #2, the axis of pair #2 of the excitation coils was perpendicular to the flaw length, while, in scanning #3 and #4, the axis of pair #1 of the excitation coils was perpendicular. Moreover, the number of turns of pair #2 of the excitation coils was twice than that of pair #1. In addition, the excitation current was also 1.5 times higher for pair #2 than that for pair #1. These differences between pair #1 and pair #2 of the excitation coils were intended to balance the strength of the induction to generate the rotating UEC with the same amplitude in all directions by considering the different lift off values, which were 11.5 mm for pair #2 and 4.2 mm for pair #1 of the excitation coils. However, the difference was insufficient to generate the rotating UEC with same amplitude in all directions. The induction of pair #2 of the excitation coil was larger than that of pair #1 of the excitation coils, so that the amplitude of the peak of the signal dominated by pair #2 was larger than that dominated by pair #1 of the excitation coils.
The second issue was that the amplitude of two peaks of the detection signal on the edge of each flaw were not relatively similar. This issue was evident from the results of scanning #2 and scanning #3. In these cases, the rotating probe moved toward the edge of the flaw and parallel to the flaw length; the UEC was of relatively high density, as it was compressed owing to the flaw, so that the signal of the electromotive force generated from the detection coil increased (Figure 10a). As the rotating probe moved away from the edge of the flaw, UEC at the area was relatively uncompressed, and the signal of the electromotive force generated from the detection coil decreased (Figure 10b). Meanwhile, in scanning #1 and #4, as shown Figure 10c, the rotating butterfly probe was moving toward the edge of the flaw and perpendicular to the flaw length. In these cases, UEC distributions on the edge of the flaw were almost same on both the edges of the flaw; as a result, the same amplitudes of the peaks of the signals were observed.
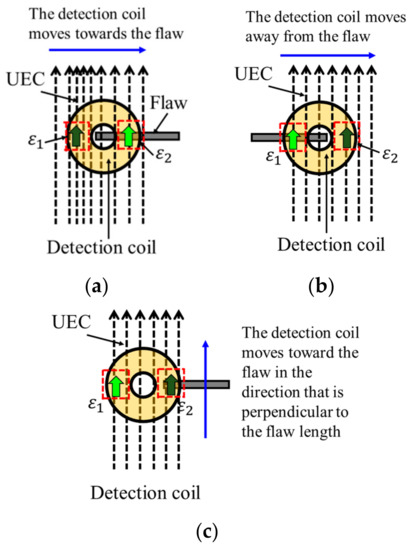
Figure 10.
UEC distributions due to the movement of the rotating butterfly probe (a) probe moving towards the flaw, (b) probe moving away from the flaw, and (c) probe moving toward the flaw perpendicular to the flaw length.
As described above, the amplitude of the two peaks of the detection signal on the edge of each flaw were not relatively the same. Moreover, in the measurement results of scanning #3, one peak of the detection signal on the edge of each flaw disappeared because pair #1 of the excitation coils, whose induction was weak, was dominant in generating the signal when the rotating butterfly probe was moving away to the edge of flaw parallel to the flaw length.
Finally, an essential requirement for improving the rotating butterfly probe is to determine the ratio of the number of turns between the pair of excitation coils, the excitation currents for each pair of the excitation coils, and the structure between the excitation coils to generate the rotating UEC with the same amplitude in all directions. Determining the position to meet the right balance between the excitation and detection coils to ensure self-nulling characteristic for a high S/N ratio is another aspect that merits further investigation.
5. Conclusions
In the present study, a rotating butterfly probe with two pairs of pancake-oriented excitation coils was proposed. An analysis with a finite element simulation and experiments with a rotating butterfly probe were carried out. The obtained findings of the study were as follows.
- The rotating butterfly probe was successfully generated with the rotating UEC distribution, having almost the same amplitude in all directions.
- The probe successfully indicated the self-differential and self-nulling characteristics.
- The probe revealed the detection signal as having two distinct signal peaks as reliable information regarding flaw length and flaw depth.
- The probe successfully detected flaws in all directions although the detectability of the probe, which was a function of the scanning direction.
Author Contributions
Conceptualization, A.S.R. and N.K.; Methodology, A.S.R.; Software, N.K.; Validation, A.S.R. and N.K.; Formal analysis, A.S.R., K.S., and N.K.; Investigation, A.S.R., K.S., L.Q.T., and M.M.; Resources, K.S.; Data curation, A.S.R., M.M., and L.Q.T.; Writing—Original draft preparation, A.S.R.; Writing—Review and editing, A.S.R. and N.K.; Visualization, A.S.R. and M.M.; Supervision, N.K.; Project administration, A.S.R.; Funding acquisition, N.K.
Funding
This research was founded by the Yokohama National University, The Japan Welding Engineering Society and the Scholarships of Excellence for Indonesian Lecturers (BUDI)—Indonesia Endowment Fund for Education (LPDP) of Research, Technology and Higher Learning Ministry of Indonesia.
Acknowledgments
The authors gratefully acknowledge the financial support from Yokohama National University, The Japan Welding Engineering Society and Indonesian Directorate General for Higher Education and Ministry of Finance, and the Republic of Indonesia through Indonesia Endowment Fund for Education (BUDI-LPDP) Scholarship.
Conflicts of Interest
The authors declare no conflict of interest.
References
- Auld, B.A.; Moulder, J.C. Review of Advances in Quantitative Eddy Current Nondestructive Evaluation. J. Nondestruct. Eval. 1999, 18, 3–36. [Google Scholar] [CrossRef]
- Sukhorukov, V.V.; Slesarev, D.A.; Vorontsov, A.N. Electromagnetic Inspection and Diagnostics of Steel Ropes: Technology, Effectiveness and Problems. Mater. Eval. 2014, 72, 1019–1027. [Google Scholar]
- Hamia, R.; Cordier, C.; Dolabdjian, C. Eddy-current non-destructive testing system for the determination of crack orientation. NDT E Int. 2014, 61, 24–28. [Google Scholar] [CrossRef]
- Yusa, N.; Janousek, L.; Rebican, M.; Chen, Z.; Miya, K.; Chigusa, N.; Ito, H. Detection of embedded fatigue cracks in Inconel weld overlay and the evaluation of the minimum thickness of the weld overlay using eddy current testing. Nucl. Eng. Des. 2006, 236, 1852–1859. [Google Scholar] [CrossRef]
- Rocha, T.J.; Ramos, H.G.; Lopes Ribeiro, A.; Pasadas, D.J. Magnetic sensors assessment in velocity induced eddy current testing. Sens. Actuators A Phys. 2015, 228, 55–61. [Google Scholar] [CrossRef]
- Hur, D.O.H.; Choi, M.S.I.K.; Shim, H.; Lee, D.H.; Yoo, O.N.E. Influence of Signal-to-Noise Ratio on Eddy Current Signals of Cracks in Steam Generator Tubes. Nucl. Eng. Technol. 2014, 46, 883–888. [Google Scholar] [CrossRef]
- Repelianto, A.S.; Kasai, N. The improvement of flaw detection by the configuration of uniform eddy current probes. Sensors 2019, 19, 397. [Google Scholar] [CrossRef] [PubMed]
- AbdAlla, A.N.; Faraj, M.A.; Samsuri, F.; Rifai, D.; Ali, K.; Al-Douri, Y. Challenges in improving the performance of eddy current testing: Review. Meas. Control 2019, 52, 46–64. [Google Scholar] [CrossRef]
- Dolapchiev, I. A New Eddy Current Surface Probe with Perpendicular Coils. Mater. Sci. Forum 2016, 856, 207–212. [Google Scholar] [CrossRef]
- Anil, K.S.; Umar, S.; Sasi, B.; Thirunavukkarasu, S.; Rao, B.P.C. Development of Eddy Current Probe for Detection of Deep Sub-Surface Defects. IETE Tech. Rev. 2016, 33, 386–395. [Google Scholar] [CrossRef]
- Hoshikawa, H.; Koyama, K.; Karasawa, K. A new ECT surface probe without lift-off noise and with phase information on flaw depth. AIP Conf. Proc. 2001, 20, 969–976. [Google Scholar] [CrossRef]
- Koyama, K.; Hoshikawa, H.; Mito, Y. Surface Flaw Testing of Weld Zone by Uniform Eddy Current Probe. J. Jpn. Soc. Non Destr. Insp. 2006, 60, 275–282. [Google Scholar] [CrossRef]
- Koyama, K.; Hoshikawa, H. Basic Study of a New ECT Probe Using Uniform Rotating Direction Eddy Current. Rev. Prog. Quant. Nondestruct. Eval. 1997, 16, 1067–1074. [Google Scholar]
- Koyama, K.; Hoshikawa, H.; Kojima, G. Eddy Current Nondestructive Testing for Carbon Fiber- Reinforced Composites. J. Press. Vessel Technol. 2013, 135, 41501. [Google Scholar] [CrossRef]
- Hoshikawa, H.; Koyama, K.; Maeda, M. A New Eddy Current Surface Probe for Short Flaws with Minimal Lift-off Noise. AIP Conf. Proc. 2003, 22, 413–418. [Google Scholar]
- Hoshikawa, H.; Koyama, K. A New ECT Probe with Rotating Direction Eddy Current. In Review of Progress in Quantitative Nondestructive Evaluation; Thompson, D.E., Ed.; Chimenti Plenum Press: New York, NY, USA, 1996; Volume 15, pp. 1091–1098. [Google Scholar]
- Raude, A.; Sirois, M.; Lemieux, H.; Crepeau, J. Advances in Carbon Steel Weld Inspection using Tangential Eddy Current Array. In Proceedings of the 19th World Conference on Non Destructive Testing 2016, Munich, Germany, 13–17 June 2016; Available online: https://www.ndt.net/article/wcndt2016/papers/we2c5.pdf (accessed on 19 September 2017).
- Rifai, D.; Abdalla, A.N.; Ali, K.; Razali, R. Giant magnetoresistance sensors: A review on structures and non-destructive eddy current testing applications. Sensors 2016, 16, 298. [Google Scholar] [CrossRef] [PubMed]
- Dogaru, T. Deep Crack Detection around Fastener Holes in Airplane Multi-Layered Structures Using GMR-Based Eddy Current Probes. AIP Conf. Proc. 2004, 700, 398–405. [Google Scholar] [CrossRef]
- Cadugan, B.B. Application Information Allegro ICs Based on Giant Magnetoresistance (GMR). In Technical Documents-Allegro MicroSystems; LLC: Manchester, NH, USA, 2018; pp. 1–5. [Google Scholar]
- Ye, C.; Anders, R.; Mahmoodul, H.; Erik, S.; Lalita, U.; Satish, U. EC probe with orthogonal excitation coils and TMR sensor for CFRP inspection. Int. J. Appl. Electromagn. Mech. 2019, 59, 1247–1255. [Google Scholar] [CrossRef]
- Rosado, L.S.; Santos, T.G.; Piedade, M.; Ramos, P.M.; Vilaça, P. Advanced technique for non-destructive testing of friction stir welding of metals. Measurement 2010, 43, 1021–1030. [Google Scholar] [CrossRef]
- Rosado, L.S.; Santos, T.G.; Ramos, P.M.; Vilaça, P.; Piedade, M. A differential planar eddy currents probe: Fundamentals, modeling and experimental evaluation. NDT E Int. 2012, 51, 85–93. [Google Scholar] [CrossRef]
- Rosado, L.S.; Santos, T.G.; Ramos, P.M.; Vilaça, P.; Piedade, M. A new dual driver planar eddy current probe with dynamically controlled induction pattern. NDT E Int. 2015, 70, 29–37. [Google Scholar] [CrossRef]
- Repelianto, A.S.; Kasai, N.; Sekino, K.; Masaki, M. A Uniform eddy current probe with a double-excitation coil for flaw detection on aluminium plates. Metals 2019. submitted. [Google Scholar] [CrossRef]


© 2019 by the authors. Licensee MDPI, Basel, Switzerland. This article is an open access article distributed under the terms and conditions of the Creative Commons Attribution (CC BY) license (http://creativecommons.org/licenses/by/4.0/).