Article

Thermo-Mechanical Fatigue Lifetime Assessment of Spheroidal Cast Iron at Different Thermal Constraint Levels

by
Sepideh Ghodrat
1,*,
Aakarshit Kalra
2,3,
Leo A.I. Kestens
2,4 and
Ton (A.C.) Riemslag
2
1
Department of Design Engineering, Faculty of Industrial Design Engineering, Delft University of Technology, Landbergstraat 15, 2628 CE Delft, The Netherlands
2
Department of Materials Science and Engineering, Delft University of Technology, Mekelweg 2, 2628 CD Delft, The Netherlands
3
DAF Trucks N.V., Hugo van der Goeslaan 1, 5643 TW Eindhoven, The Netherlands
4
Metal Science and Technology Group, EEMMeCS Department, Ghent University, Technologiepark 46, B9052 Ghent, Belgium
*
Author to whom correspondence should be addressed.
Metals 2019, 9(10), 1068; https://doi.org/10.3390/met9101068
Submission received: 27 July 2019 / Revised: 3 September 2019 / Accepted: 26 September 2019 / Published: 1 October 2019
(This article belongs to the Special Issue Metal Plasticity and Fatigue at High Temperature)

Abstract

:
In previous work on the thermo-mechanical fatigue (TMF) of compacted graphite iron (CGI), lifetimes measured under total constraint were confirmed analytically by numerical integration of Paris’ crack-growth law. In current work, the results for CGI are further validated for spheroidal cast iron (SGI), while TMF tests at different constraint levels were additionally performed. The Paris crack-growth law is found to require a different C P a r i s parameter value per distinct constraint level, indicating that Paris’ law does not capture all physical backgrounds of TMF crack growth, such as the effect of constraint level. An adapted version of Paris’ law is developed, designated as the local strain model. The new model considers cyclic plastic strains at the crack tip to control crack growth and is found to predict TMF lifetimes of SGI very well for all constraint levels with a single set of parameters. This includes not only full constraint but also over and partial constraint conditions, as encountered in diesel engine service conditions. The local strain model considers the crack tip to experience a distinct sharpening and blunting stage during each TMF cycle, with separate contributions to crack-tip plasticity, originating from cyclic bulk stresses in the sharpening stage and cyclic plastic bulk strains in the blunting stage.

Graphical Abstract

1. Introduction

Cast iron finds widespread application in the automotive industry. Spheroidal (or nodular) cast iron is a grade of cast iron frequently used in engine components. It is often preferred over flake and compacted cast irons for load-bearing applications. Higher strength of spheroidal cast iron stems from the spheroidal shape of graphite particles. However, the spheroidal shape of the graphite particles also leads to lower thermal conductivity. In SiMo spheroidal cast iron, silicon and molybdenum are added to the material to compensate for the lower thermal conductivity by providing strength to the material at high temperatures.
As a result of sequential start-up and shutdown, these engine components are subjected to repeated thermal cycling, resulting in a phenomenon known as thermo-mechanical fatigue (TMF). The extent of resulting TMF damage depends on the amount of constraint during the thermal expansion. This constraint emanates from the spatial temperature gradients that develop in the material during start-up and shutdown.
For the manufacturers of engine components, it is imperative to predict the thermo-mechanical fatigue lifetime of these components under the constraint conditions during service. Various approaches are available for TMF lifetime prediction as summarized by Gocmez et al. [1]. According to this reference, three main types of models can be distinguished: (i) phenomenological models, (ii) cumulative damage models, and (iii) crack-growth models.
Rémy et al. [2] successfully calculated lifetimes under high cycle fatigue for a powder metallurgy (PM) material containing defects, using the hypothesis that a defect can be considered a crack. To calculate the high cycle fatigue (HCF) lifetime, they employed Paris’ fatigue crack-growth equation, which describes the crack-growth rate (da/dN) as a function of the stress intensity range (ΔK), taking a representative dimension of particles as the initial crack size.
Fatigue-crack initiation and growth in graphitic cast irons is largely affected by the presence of graphite particles. Because of the likely fast initiation of TMF cracks in cast irons as a result of delamination at the graphite–metal interface, Ghodrat et al. [3,4,5] evaluated TMF lifetime using a crack-growth model, and they proved that, in tension, the graphite particles can be considered as internal notches or defects, from which TMF cracks start to grow during the very first TMF cycles. In the presence of an external notch, the notch depth can be considered as the initial crack length. The mechanical graphite/matrix interaction of CGI is demonstrated by Ghodrat and Kestens [6], showing a weak mechanical bonding. This was confirmed by a recent work [7], studying the mechanical behavior of the graphite/matrix interface for cycling load conditions at room temperature, for three types of cast iron, including spheroidal cast iron. The measured macroscopic cyclic stress–strain behavior was validated using both micromechanical calculations with the finite element method (FEM) and microstructural strain measurements by digital image correlation (DIC). De-bonding of the graphite/matrix interface was found to develop during the initial load cycles, resulting in an interface free of bonding forces. Consistently, both the FEM calculations and the DIC observations showed a pronounced increase in strain levels at the graphite particle boundaries. Therefore, the results of Reference [7] confirmed that graphite particles can be considered as internal notches, as also argued in the current work.
Despite the fact that TMF loading is often a case of low cycle fatigue involving bulk cyclic plasticity, Ghodrat et al. [3] proved the applicability of the Paris’ crack-growth law in successfully predicting the TMF lifetime of compacted graphite iron (CGI) under total constraint conditions, although the Paris law is based on a linear elastic fracture mechanics (LEFM) approach, which ignores low cycle fatigue conditions. However, total constraint conditions are rarely encountered in service. A fracture-mechanical approach, capable of determining TMF lifetime under any possible constraint condition, is lacking. Considering the diesel engine background of this research, this work focuses on out-of-phase TMF loading, signifying that there is a 180° phase difference between temperature and mechanical cycling.
This work aims to understand and model crack growth in spheroidal cast iron for any TMF constraint condition. To this purpose, TMF tests were performed at different constraint levels, and results were analyzed using two fatigue crack-growth models. Both models were developed using the same set of experimental results, with their backgrounds covered in Section 3.
It is acknowledged that, apart from TMF constraint levels, other factors also influence TMF lifetime, most notably high temperature effects such as creep and oxidation. However, the additional variation of test conditions identifying high temperature effects, such as using prolonged holding times [5], was considered to be beyond the scope of this research.

2. Experimental Set-Up and Methods

This section covers details about the materials used, as well as the experimental set-up, and specifies the definition of test conditions.

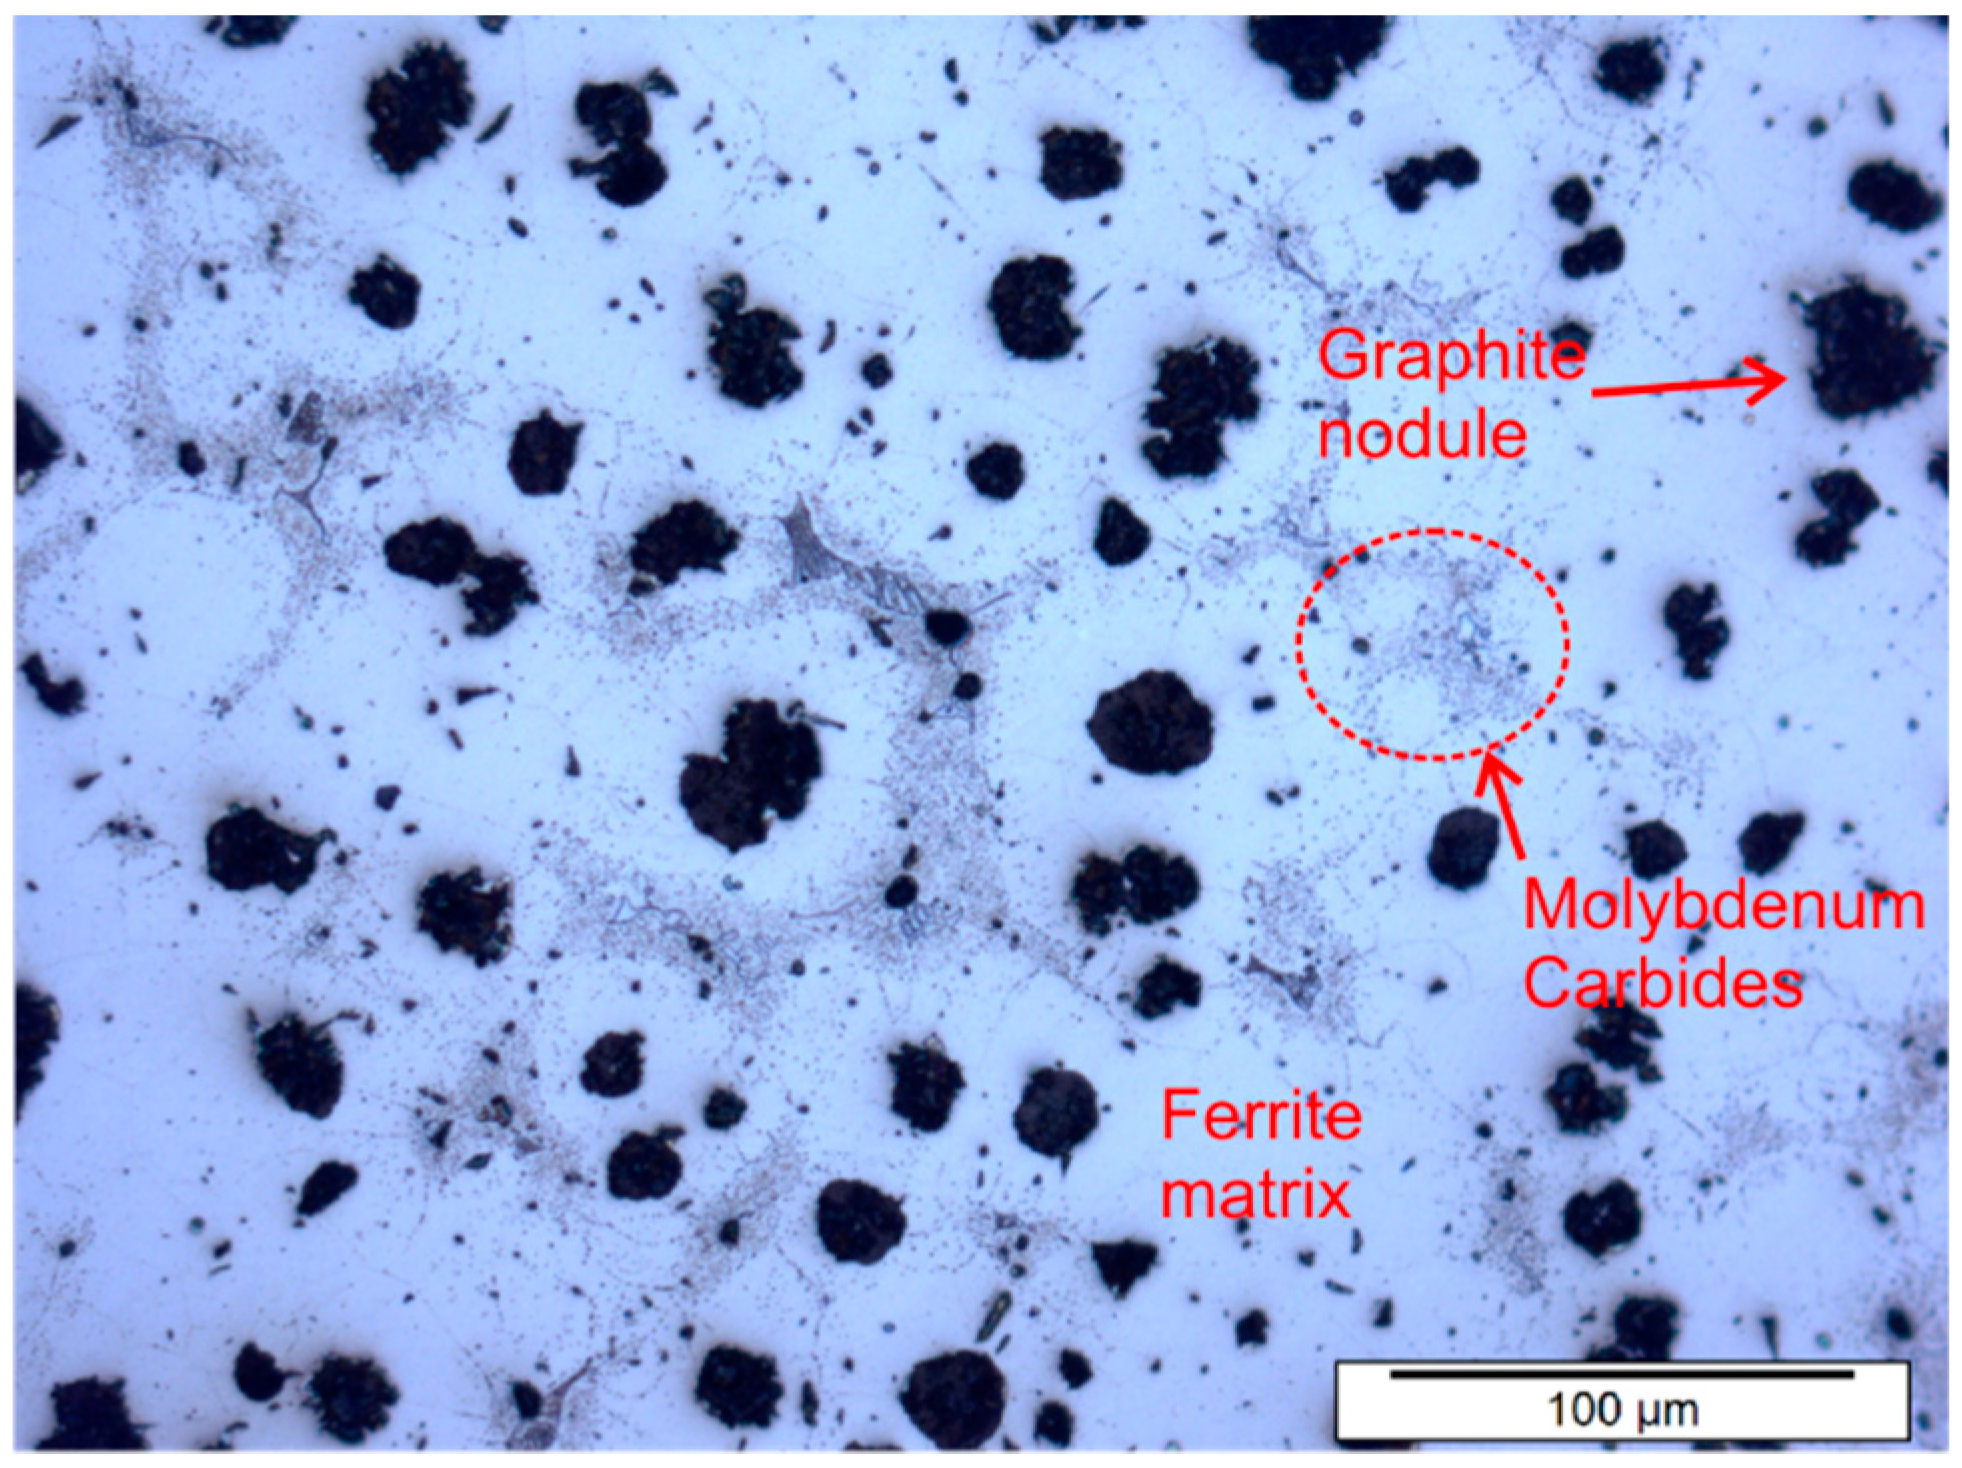
2.1. Material and Specimens

The material under investigation for this study was a type of SiMo spheroidal graphite cast iron, also known as ductile cast iron, with a ferritic matrix, and Si and Mo as the major alloying elements. The microstructure of the material under investigation is represented in Figure 1, showing graphite nodules with an average size of 30 μm ± 8 μm. The chemical composition is listed in Table 1. The coefficient α of linear thermal expansion of the material was obtained by measurements of the strain during heating from 50 to 550 °C in free expansion. By plotting the axial strain measured as a function of temperature, linear expansion was observed, of which the slope, α, was found to be 13.6 × 10 6 °C−1.
Cylindrical dog bone-shaped specimens were used for TMF testing. A sharp circumferential notch was machined in the center of the gauge section of some of the samples, using a lath and a sharp chisel. The machined notch depth used for each TMF test is reported in Table 2. The geometrical specifications of the sample and notch are given in Figure 2. A dedicated extensometer with a gauge length of 12 mm was used to measure the total strain (extensometer model 632.53 F14, MTS systems, Eden Prairie, MN, USA).

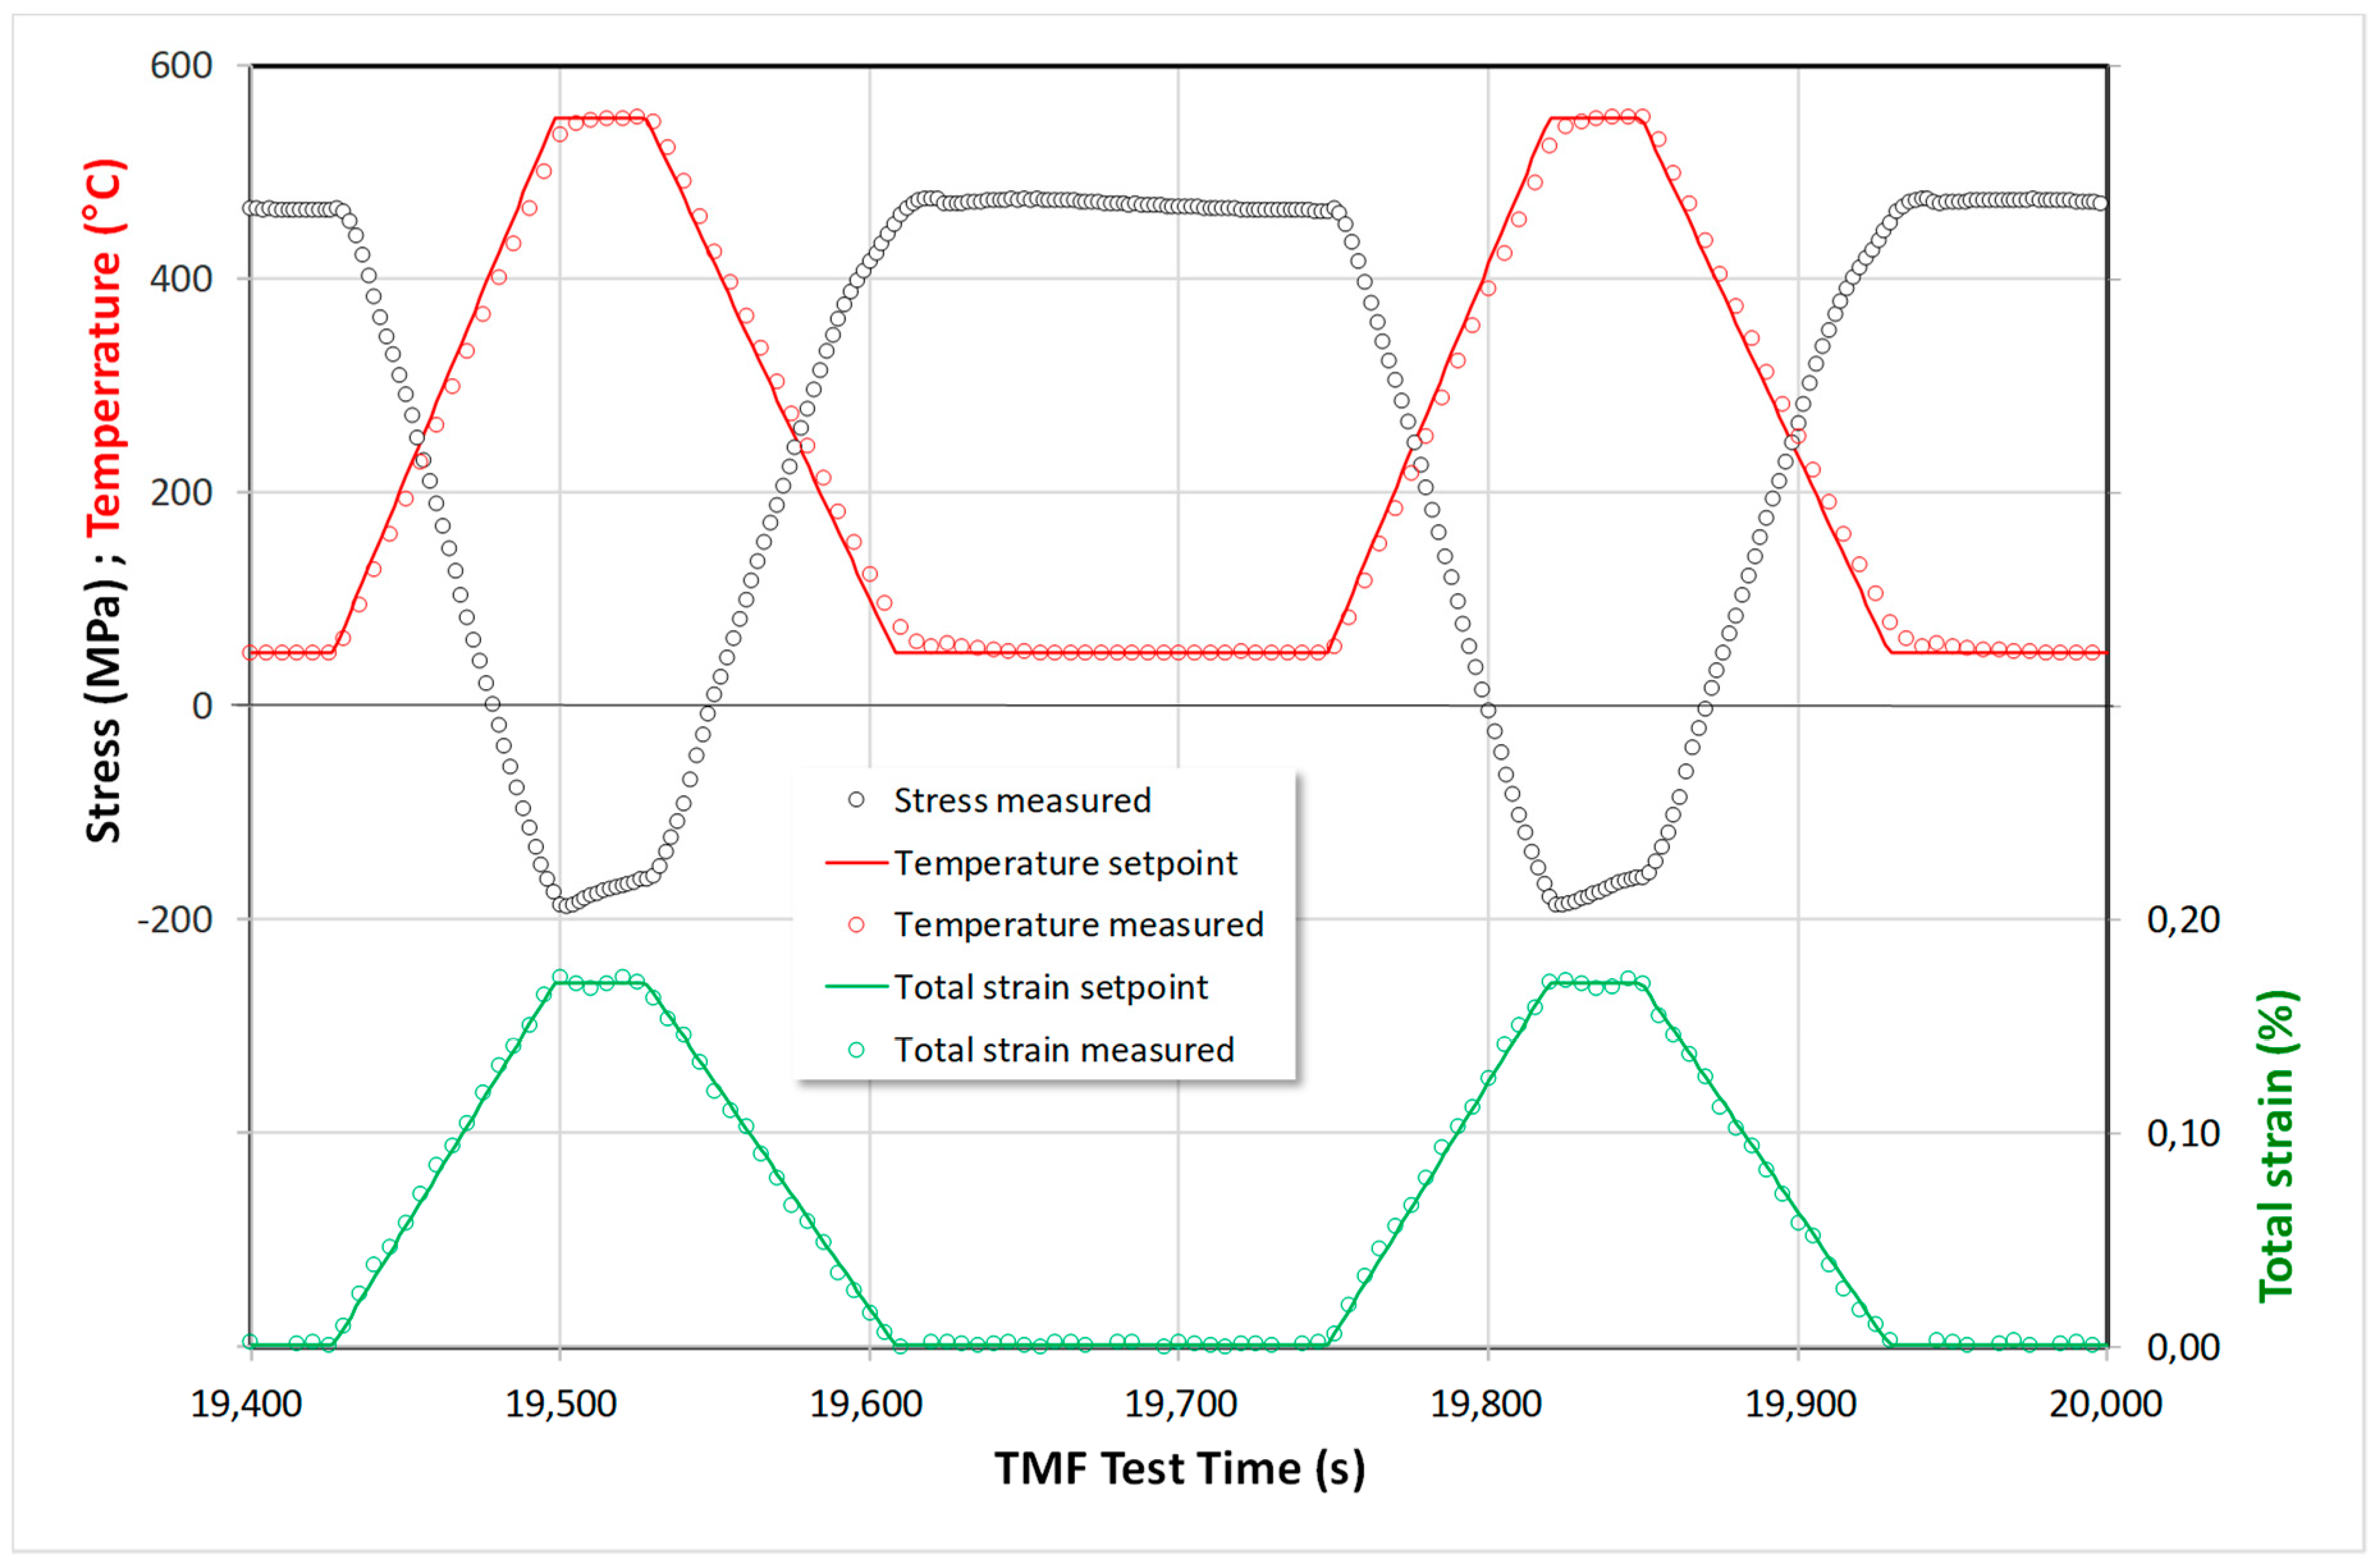
2.2. Experimental Set-up

A TMF test set-up, capable of independently imposing temperature and strain profiles on the specimen, was employed for TMF testing identical to the set-up that was as used by Ghodrat et al. For a detailed description of the TMF test set-up, the reader is referred to this previous work [3,4].
The material was subjected to temperature cycling between minimum and maximum values of 50 °C and 550 °C, respectively. Holding times of 30 and 140 s were applied at maximum and minimum temperatures, respectively, whereas the heating and cooling rates were 7 and 6 °C∙s−1, respectively. Out-of-phase TMF tests were performed at the following constraint levels: 125% (over constraint), 100% (total constraint), 75% (partial constraint), and 50% (partial constraint). The definition of the constraint levels is given in Section 2.4. It is acknowledged that 100% is the maximum theoretical constraint level possible, as a result of a thermal mismatch, in product service situations. However, the enforced 125% constraint level, enabled by using a TMF test machine, was chosen to broaden the range of TMF conditions, so as to model TMF crack-growth parameters more accurately. As a bonus, the 125% constraint TMF tests have the advantage of short lifetimes, i.e., short testing times.
The total strain (directly measured by the extensometer) was controlled in order to realize the abovementioned constraint values. Figure 3 shows the schematic input temperature and total strain profiles for different constraint conditions. Figure 4 presents the controlled temperature and strain profiles of a conducted 75% constraint TMF test, together with resulting cycling out-of-phase stress levels. Figure 5 exhibits typical resulting hysteresis loops, for the lowest (50%) and highest (125%) constraint levels tested, demonstrating that a stable regime sets in already after the first few loops.

2.3. The Necessity and Relevance of Using Notched Specimens

In order to shorten the tests and improve the statistical relevance of the data, the test program necessarily employed specimens with various machined notch depths. In our previous work [3], it was found that the average TMF lifetimes were calculated by taking the notch depth values as initial fatigue crack length [3], which resulted in an accurate match between calculated and experimental TMF lifetimes. Moreover, for unnotched (smooth) specimens, taking the average graphite particle size as initial crack length for the numerical lifetime calculations also produced good results, which indicated the general validity of the initial crack length concept. The quick crack initiation was also microscopically confirmed in recent work on TMF of CGI [8]. The principle of initial crack lengths is adopted in the current research on SGI, the results of which are discussed in Section 4.
The use of various notch depths is essential to determine the crack-growth model parameters. For instance, a model with two unknown model parameters needs at least two distinct boundary conditions to determine the model parameters. Different notch depths (i.e., initial crack lengths) produce distinct TMF lifetimes and can, therefore, provide the necessary boundary conditions to find the crack-growth model parameters. Also, with known model parameters, i.e., from notched specimens, TMF lifetimes of smooth specimens can be calculated by taking the average graphite particle size as initial crack length. This strategy is especially valuable for less severe (i.e., realistic) TMF conditions, since a TMF test for a smooth specimen typically requires a testing time of several weeks.

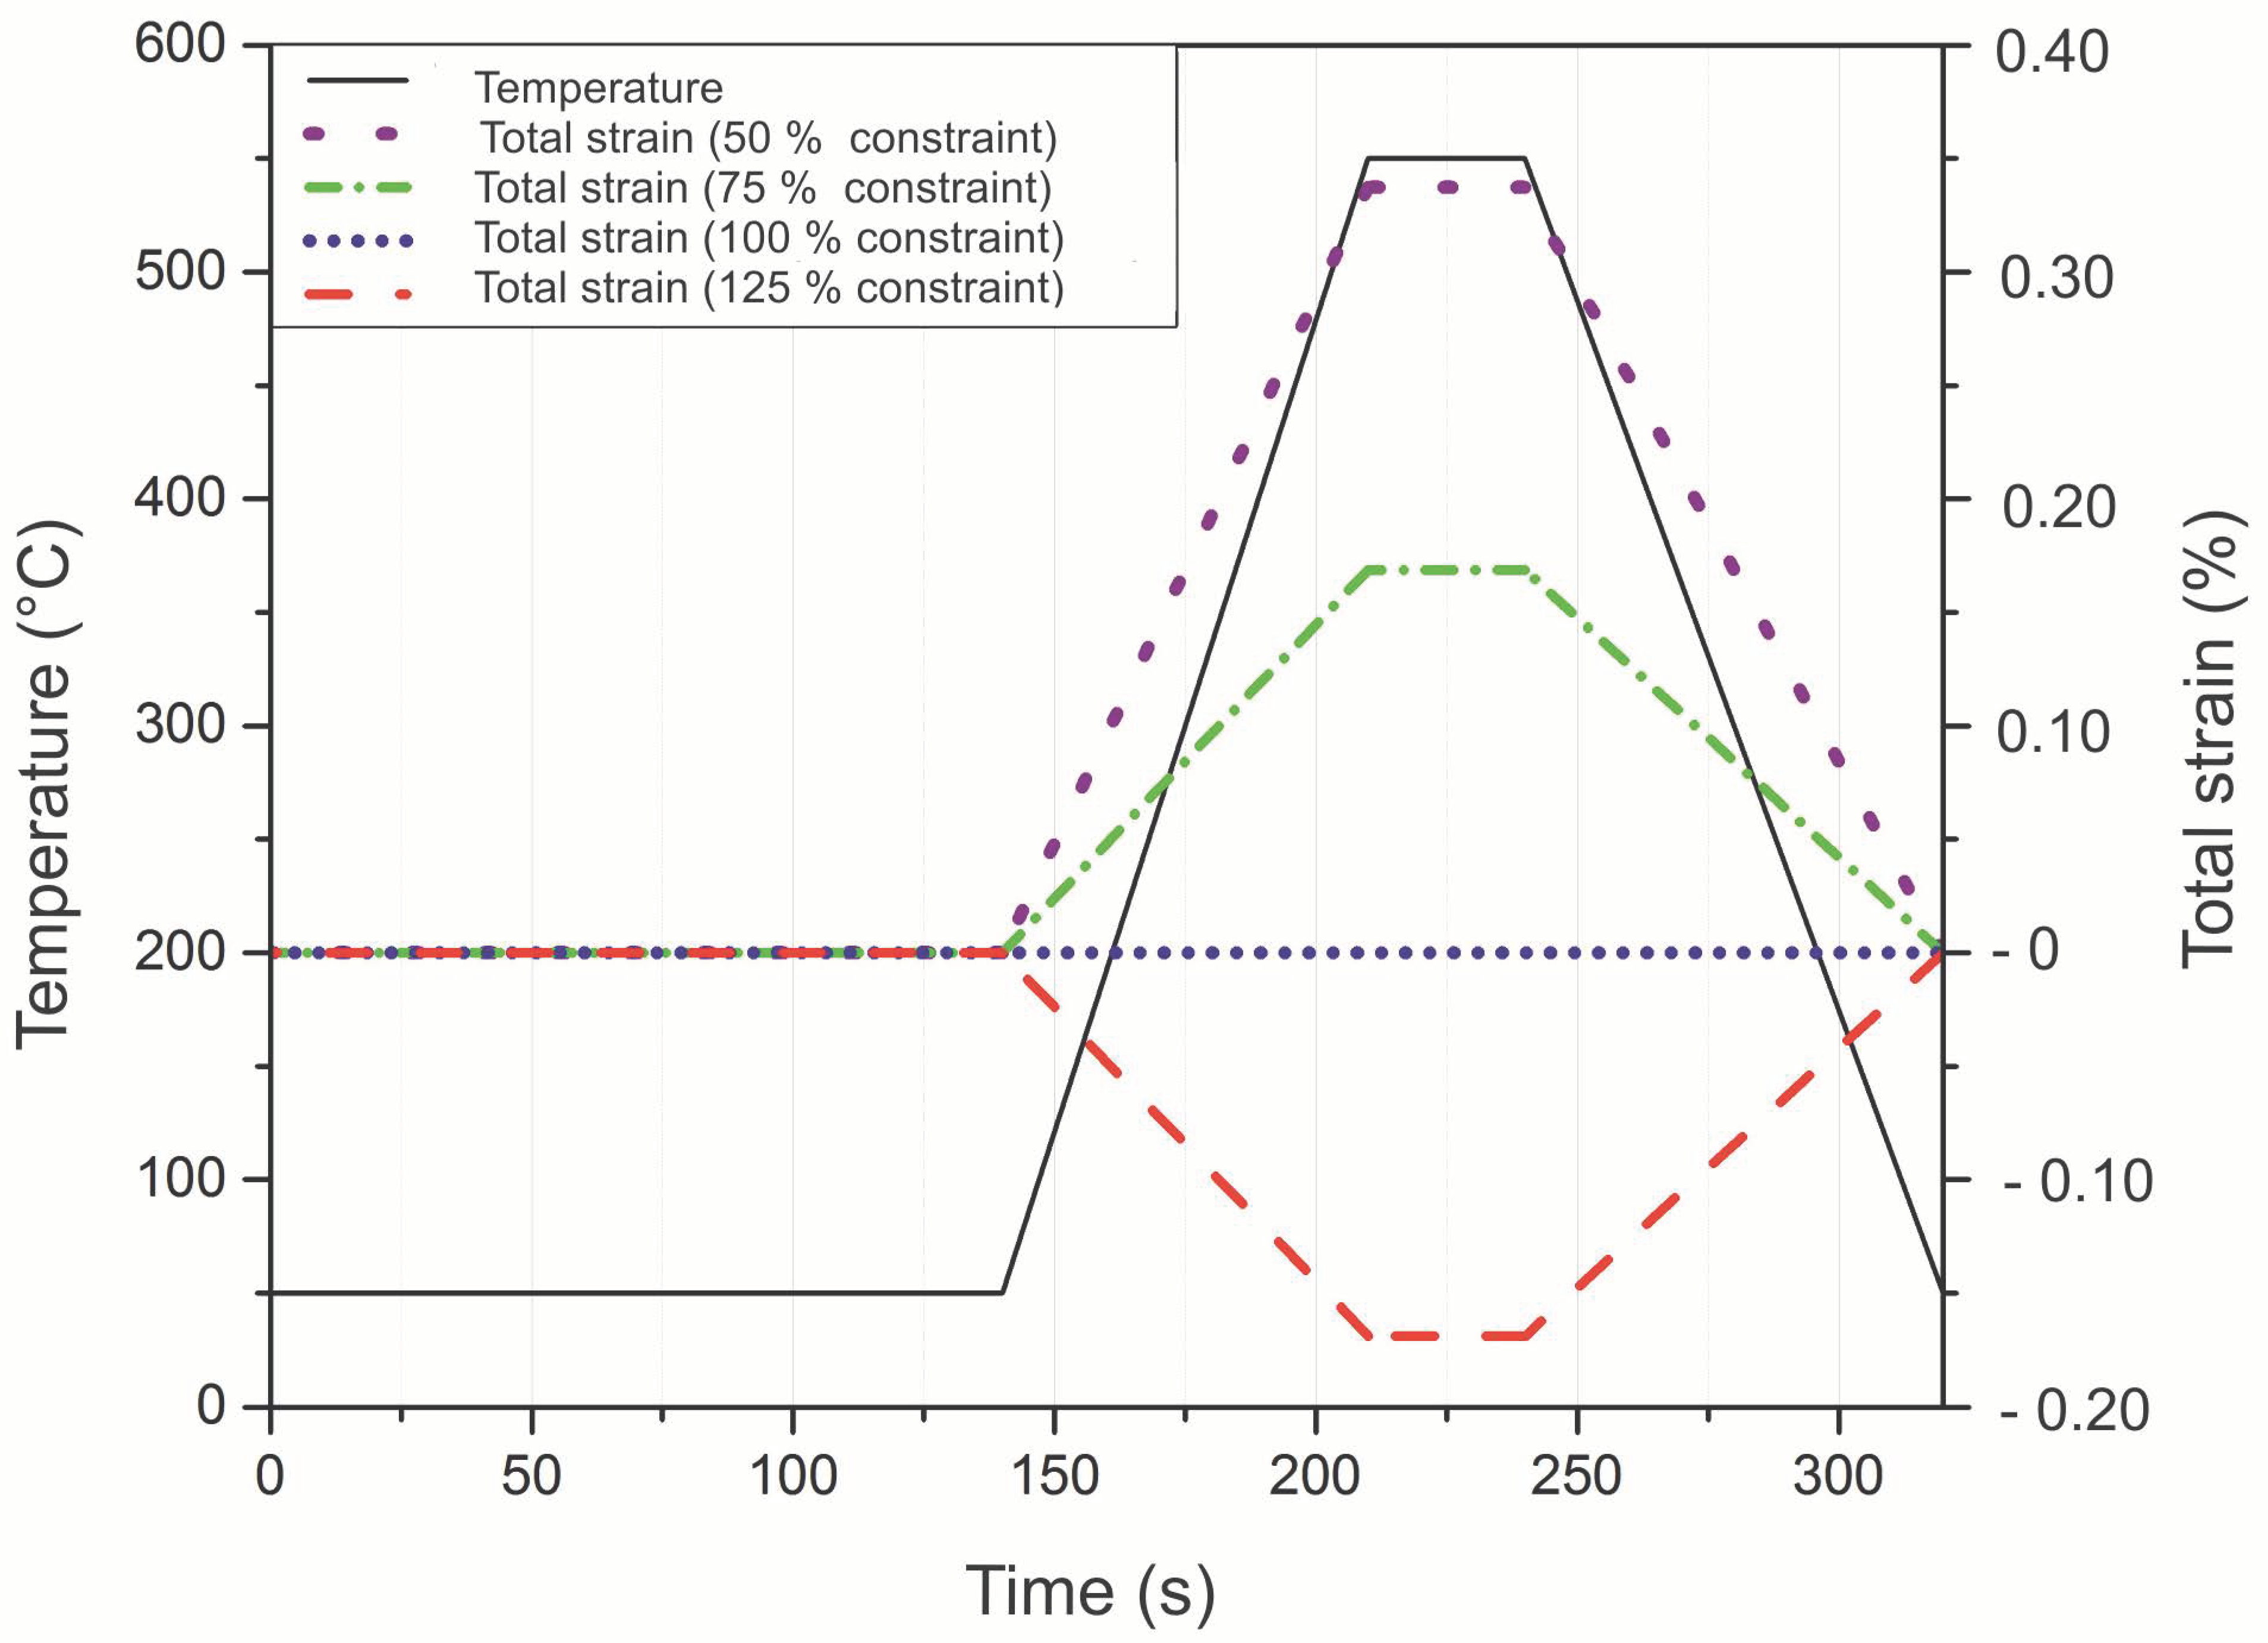
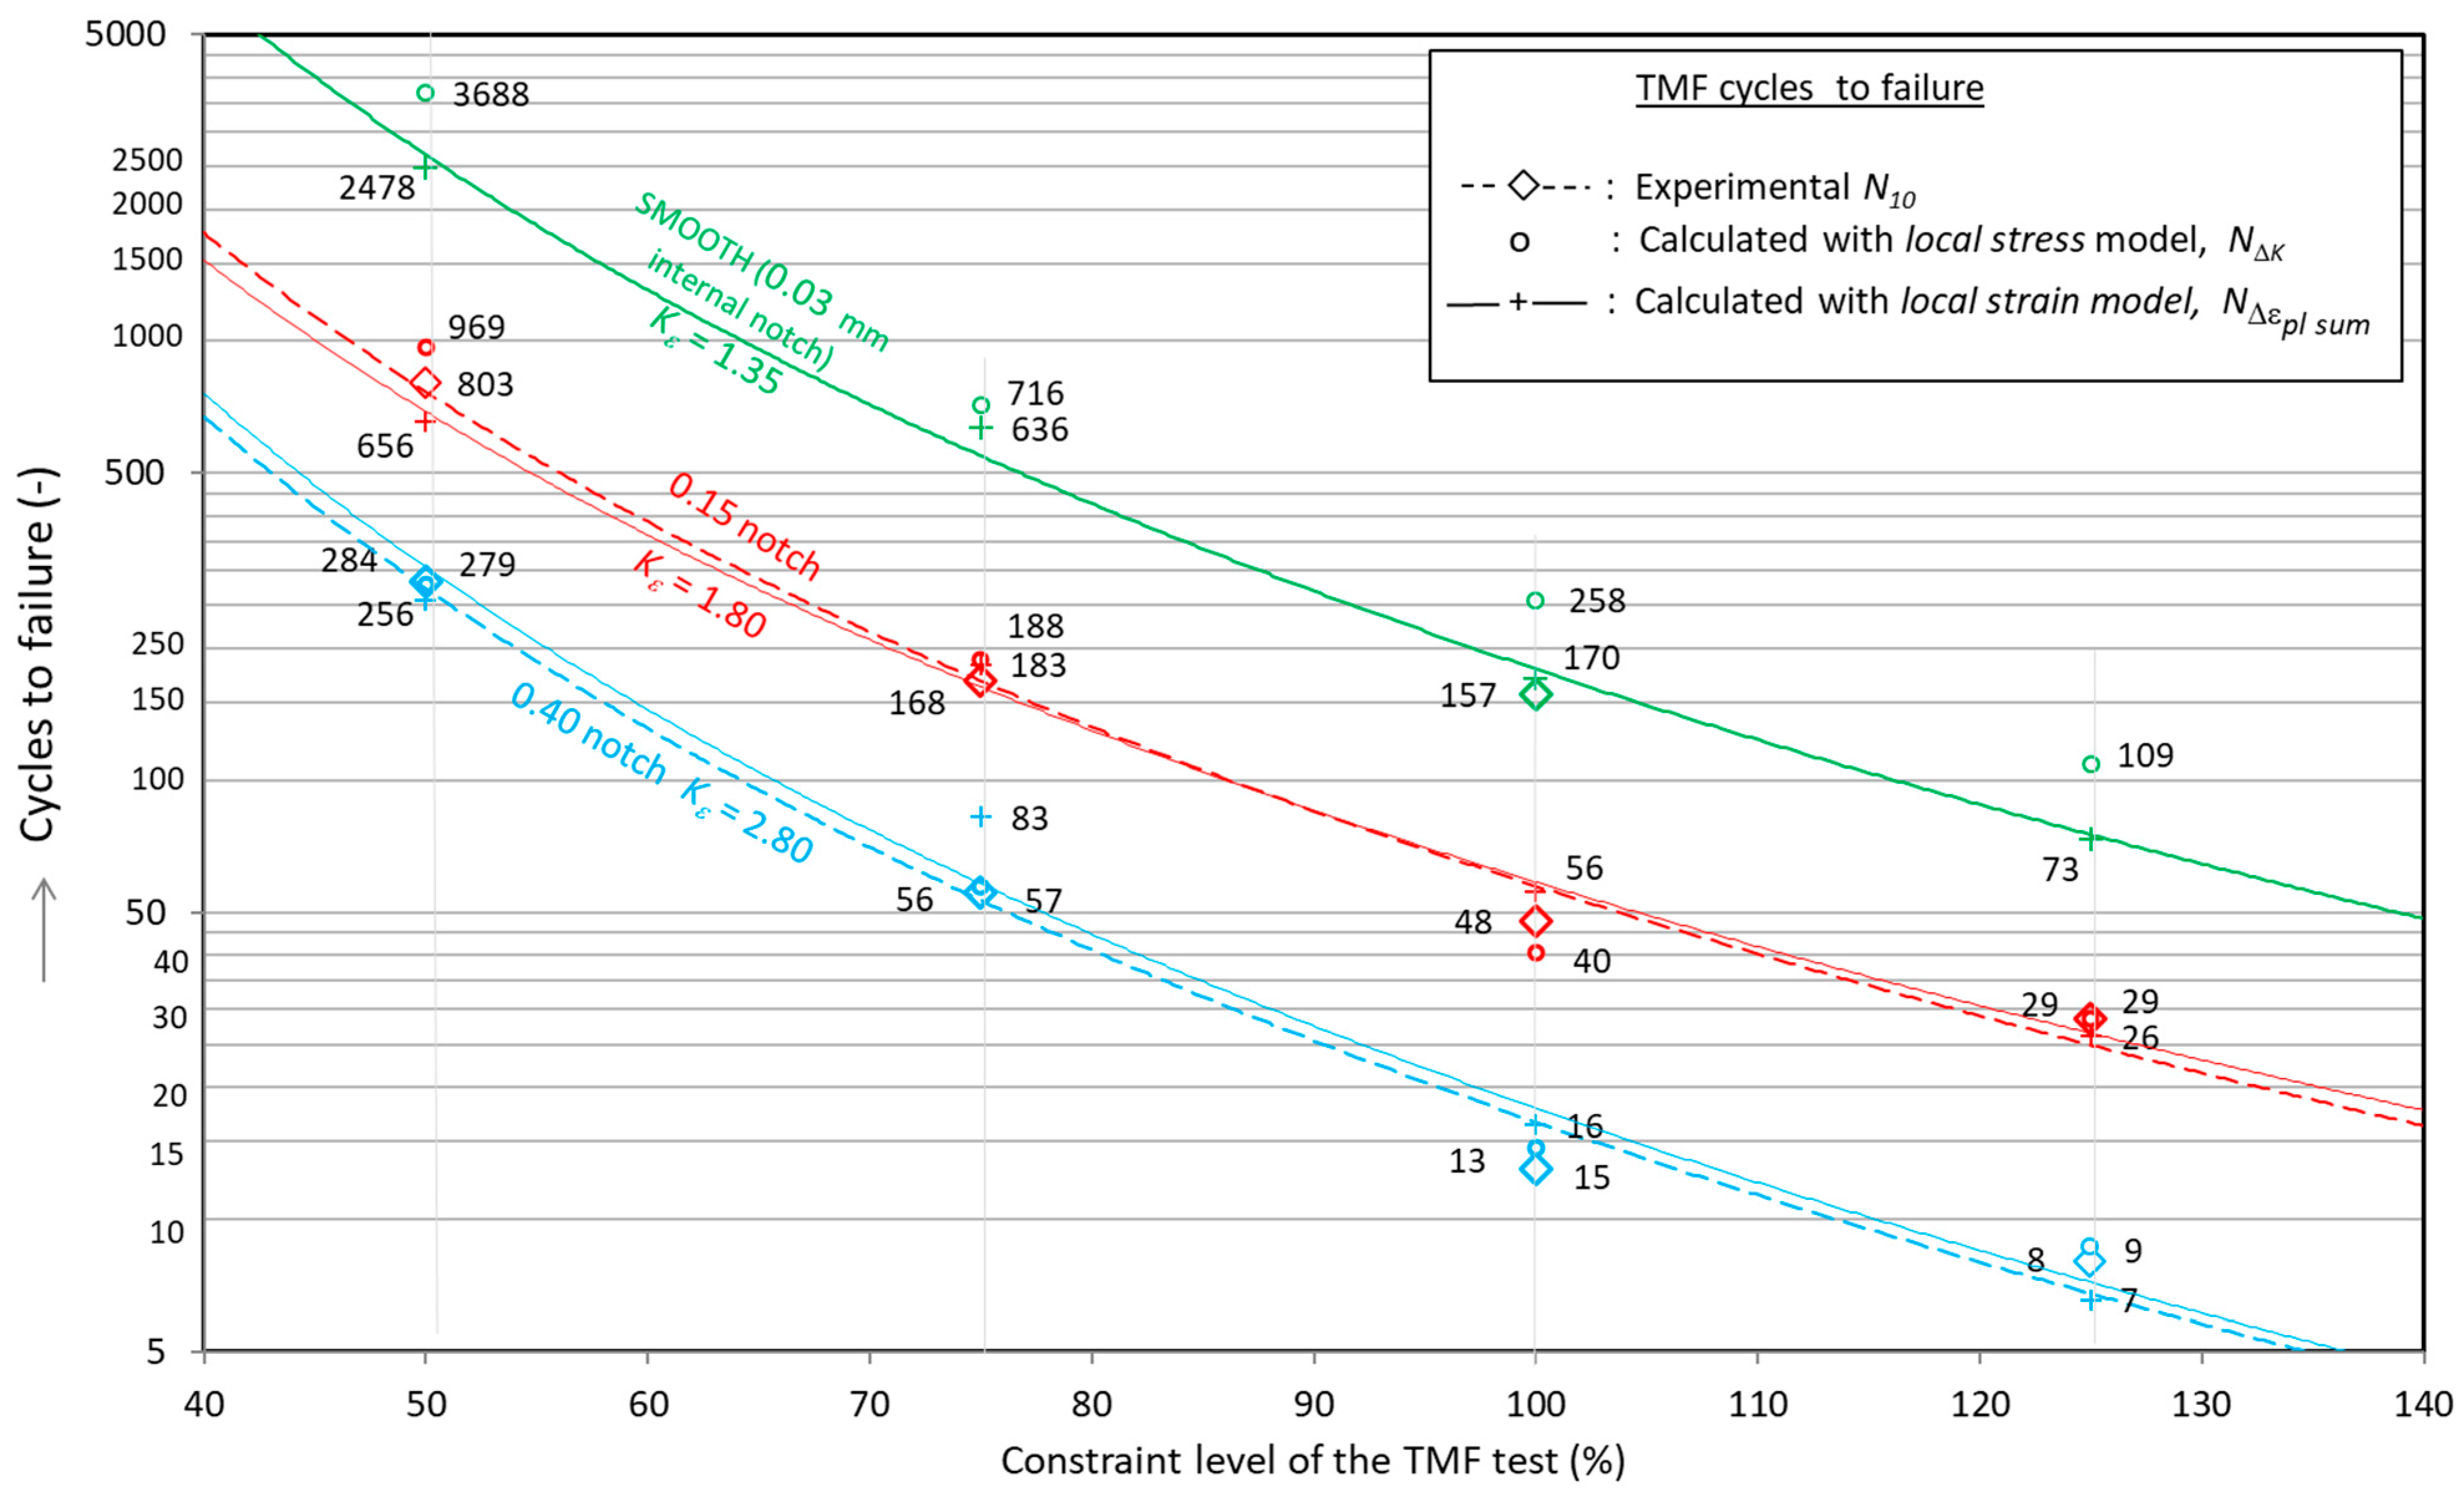
2.4. TMF Test Constraint Levels and TMF Lifetime

The following constraint test conditions were applied in this work: (i) partial constraint, (ii) total constraint, and (iii) over-constraint. The amount of constraint can be defined as the amount of thermal strain ( e t h ) that is converted into mechanical strain ( e m e c h ) , according to Equation (1). It is noted that e and S are respectively used for bulk strain and bulk stress levels, while ε   and   σ are used respectively for local strain and stress values, at the crack-tip level. The mechanical strain is defined as
e m e c h = γ · e t h ,
where γ is the amount of constraint. The range of values for γ for the aforementioned constraint conditions are   0 < γ < 1 (partial constraint), γ = 1 (total constraint), and γ > 1 (over-constraint) [9].
Thus, the thermal strain is partially, totally, or excessively converted into mechanical strain under partial, total, or over-constraint conditions respectively.
For a uniaxial case, the total strain ( e t o t a l ), as could be measured by an extensometer, can be obtained by making use of the Equations (1)–(3), resulting in Equation (4).
e t o t a l = e t h + e m e c h
where e t h can be calculated using the values for the coefficient of thermal expansion ( α ) and the temperature difference ( Δ T ) (see Equation (3)).
e t h = α · Δ T
From Equations (1)–(3), the following relationship is obtained between total strain, amount of constraint, and temperature (Equation (4)):
e t o t a l = ( 1 γ ) α Δ T
The amount of constraint ( γ ) is commonly also designated as a percentage, for instance, a situation of total constraint ( γ = 1 ) is equivalently denoted as 100% constraint.
The experimentally determined TMF lifetimes are denoted as N 10 , signifying the number of cycles at which σ m a x drops by 10% relative to the maximum value; the reason for having this criterion was explained in Appendix C of Reference [4].

3. TMF Crack-Growth Models

This work studies the influence of TMF constraint levels on TMF lifetime using two crack-growth models. Both models consider cyclic damage at the crack-tip level to control crack growth. The first model is based on Paris’ fatigue crack-growth law and was successfully used in earlier work on CGI [3]. The second model is developed as an extension of the first model by considering the effect of TMF constraint levels on a more fundamental level. As argued subsequently, these models are designated as the local stress (or Paris’ law) model and the local strain model, respectively. The term local refers to the crack tip, either sharp or blunt.

3.1. The Local Stress Crack-Growth Model

The Paris law equation establishes a relationship between the crack-growth rate d a d N and a fracture-mechanical parameter, the stress-intensity range Δ K (see Equation (5)).
d a d N = C P a r i s ( Δ K ) m ,
where a is the crack size, N is the number of load cycles, while coefficient C P a r i s and exponent m are material-dependent parameters. Since stress intensity characterizes the stress distribution ahead of a crack tip, the Paris model can also be designated as the local stress model.

3.1.1. Calculating TMF Lifetime by Numerical Integration (Local Stress Model)

The cyclic lifetime N Δ K is obtained from Equation (5) by performing numerical integration by incrementing the crack size with small steps of, e.g., 0.001 mm. It is assumed that a crack initiates immediately from the machined notch or from a graphite particle in the case of an un-notched specimen. Assuming specific values for the Paris parameters C P a r i s and m, the number of cycles is calculated as needed for the first 0.001 mm of crack growth around the entire circumference of the specimen. This process is repeated for subsequent steps of 0.001 mm, adjusting ∆K in each step in accordance with the increased crack length, until a final crack length value. The chosen final crack length for the iteration process is 2 mm, but this value was not found to be critical for the calculated number of cycles to failure. As shown in Section 4, relatively high TMF crack growth rates are found for crack length values above 1 mm, i.e., the final crack growth stage does not represent a significant portion of the TMF lifetime.
For smooth specimens, the average size of graphite particles (30 μm) is considered as the initial crack size. For notched specimens, the cracks originate from the graphite particle location at or near the notch tip. Thus, the effective initial crack length in the case of notched specimens is constituted by the size of the notch. For calculating ΔK, the K solution for mode I loading in a cylindrical specimen with a circumferential crack, reported in Reference [10], is used (see Equation (6)).
K I = S π a 1 ( 1 a r ) 3 2 ( 1.122 1.302 a r + 0.988 ( a r ) 2 0.308 ( a r ) 3 ) ,
where r is the radius of the gauge length of the cylindrical test specimen, and S is the nominal (bulk) stress level. To account for crack closure during compression, Δ K   was assumed equal to K m a x in earlier work [3,4,6]. However, a more detailed analysis of test results shows that most of TMF lifetime is consumed during an initial crack extension of about 0.3–0.5 mm (originating from the machined notch). In this situation, i.e., for short cracks growing from the notch, the effect of crack closure is reported to be limited [11,12,13]. This indicates that the crack-tip stress intensity range (i.e., Δ K   = K m a x K m i n ) is more suitable to characterize TMF crack growth of cast iron.
Furthermore, to simplify calculations, the maximum stress range ( Δ S ) developed during each TMF test was taken to calculate ΔK. The coefficient C P a r i s and exponent m are considered as model parameters that are fitted to experimental data, whereby only one specific set of values is accepted as best fit for all notch depths employed at a particular constraint level. For a more detailed description regarding the Paris law calculations, the reader is referred to References [3,4,6,10].

3.2. The Local Strain Crack-Growth Model

In Section 4.1, it is discussed that the local stress model, previously used successfully for CGI, also predicts TMF lifetimes for SGI well. However, each TMF constraint level tested for SGI required an adaption of the C P a r i s parameter value to match calculated and experimental results. The variation in C P a r i s values discounts the general applicability of the local stress model and inspired the development of a local strain crack-growth model.
To better capture the effect of constraint levels on TMF lifetimes, an improvement of the local stress model is proposed. From the literature, the acknowledged strain-life approach considers cyclic bulk strains to govern low cycle fatigue (LCF) lifetimes, with a combined role for cyclic bulk elastic strains and cyclic bulk plastic strains. For instance, the strain-life approach was used successfully to model the fatigue behavior of three types of metal alloys, with a good match between modeled and experimental results, with cycles to failure ranging from 103 to 107 cycles [14]. In the present work, the original strain-life approach is the point of departure to develop a crack-growth model based on local strains, i.e., strains acting at the crack-tip level, and assumed to originate from cyclic bulk strains.
A crack-growth model based on both cyclic bulk elasticity and cyclic bulk plasticity suggests a mechanism to be controlled by a combined LEFM and elastic plastic fracture mechanics (EPFM) damage mechanism. During each TMF cycle, the crack tip blunts during tensioning and sharpens again during compressing. Therefore, the crack tip can be considered to experience a distinct sharp stage and blunt stage during each TMF cycle. It is hypothesized that, during the sharp stage, an LEFM damage mechanism is active, while, during the blunt stage, an EPFM damage mechanism takes over. Most notably, the blunting mechanism can be associated with the EPFM concept of crack-tip opening displacement (CTOD). In References [15,16,17], a model for TMF-lifetime prediction was developed based on a crack-growth law, with the CTOD as main controlling parameter, signifying the relevance of blunting during TMF. However, a sharpening mechanism was not implemented in the referred models. The blunting and sharpening approach proposed here justifies a TMF crack-growth model involving subsequently applying LEFM and EPFM approaches, with a cumulative effect. The blunting/sharpening concept is employed to translate bulk cyclic strains to local cyclic plastic strains, with separate mechanisms acting during the sharp and blunt stages of the crack tip. As a result, the local strain crack-growth model involves an unconventional combination of LEFM and EPFM.

3.2.1. The Blunting and Sharpening Mechanisms

Figure 6 shows a typical series of measured TMF (100% constraint tested example) hysteresis loops, combined with a sketch of an ideal elastic–plastic TMF hysteresis loop i.e., points A–B–C–D. As an example, a machined notch of 0.15 mm is illustrated, from which a TMF crack extends by about 0.2 mm, creating a crack length of 0.35 mm.
Starting at point A (550 °C), the tip of a TMF crack is sharp due to high compressive bulk stress levels, and pronounced plastic deformation in the bulk material during compression is present. Along path A → B, i.e., during the cooling phase, the sharp TMF crack tip is loaded toward a high bulk tensile stress level, where crack-tip plasticity is considered to develop according LEFM principles. Subsequently, along path B → C, the plastic deformation of the bulk material surrounding the crack tip blunts the crack tip, transforming the relatively sharp crack tip (point B) into a blunt crack tip (point C). The plastic bulk strain produced along path B → C causes a crack-tip strain development not related to the previously formed LEFM crack-tip plasticity (path A → B). At point C of the hysteresis loop, the total crack-tip strain is considered a superposition of the two independent contributions discussed above.
Following path C → D → A, i.e., heating up to 550 °C, the blunt crack tip is sharpened again due to the development of both high compressive stresses and pronounced compressive bulk plasticity. After reaching point A, the blunt crack transforms into a sharp crack again, as a starting point for the next TMF cycle.

3.2.2. Modeling Local Cyclic Plastic Strains for the Sharp and Blunt Crack Stage

A new model is proposed that incorporates the following elements: (i) applying the renowned strain-life approach from bulk material to the crack tip, (ii) applying the local stress model (Paris), and (iii) the assumed blunting/sharpening concept associated with the LEFM and EPFM mechanisms.
In the strain-life approach [12,14], cyclic bulk strain levels characterize the fatigue lifetime. For this, both the cyclic plastic bulk strain and the cyclic elastic bulk strain are taken into account. This constitutes the total cyclic bulk strain as a characterizing parameter and, therefore, could be referred to as the total strain-life approach. However, in practice, the model is usually concisely referred to as the strain-life approach, i.e., the term “total” is omitted.
The area surrounding the crack tip is not an isolated region, but is an integral part of the adjacent bulk material. A crack tip experiences a level of cyclic plasticity that is related to that in the surrounding bulk material. Therefore, a crack-growth model should involve a parameter related to cyclic bulk plasticity. In addition, the strain-life approach also incorporates cyclic bulk elastic strain as a parameter controlling fatigue lifetime. A crack-growth model should, therefore, also include a parameter reflecting the effect of bulk elasticity.
The local strain crack-growth model is developed respecting the aspects mentioned above. Where the strain-life approach is based on cyclic bulk strains, this crack-growth model is based on cyclic plastic strains at the crack-tip level. A polynomial relation is postulated, which relates the crack-growth rate (da/dN) to the cyclic crack-tip plastic strain ( Δ ε p l   s u m ), i.e.,
d a d N = B   ( Δ ε p l   s u m ) m ,
where B and m represent material-related constants.
The crack-tip cyclic plastic strain Δ ε p l   s u m is considered to be the superposition of the cyclic crack-tip plastic strain developing during the sharp crack stage of the TMF cycle ( Δ ε p l   s h a r p ), and that developing subsequently during the blunt crack stage of the TMF cycle ( Δ ε p l   b l u n t ), i.e.,
Δ ε p l   s u m = Δ ε p l   s h a r p + Δ ε p l   b l u n t .
The local cyclic plastic strain originating from the blunt crack stage, ( Δ ε p l   b l u n t ), is considered to be related straightforwardly to the cyclic plastic bulk strain, ( Δ e p l   b u l k ), as mentioned before. A blunt crack can also be perceived as a highly loaded notch, for which a strain concentration factor can be used to define the notch root strain level. Even in the case of full bulk plasticity, the principle of strain concentrations is documented to be still relevant [18]. Therefore, a strain concentration factor ( K ε ) is used for estimating the cyclic crack-tip plastic strain, ( Δ ε pl   blunt ), during the blunt crack stage (see Equation (10)). For clarity, it is mentioned that the cyclic plastic bulk strain, ( Δ e p l   b u l k ) , is taken straightforwardly as the width of the stabilized hysteresis loop at a zero-stress level (see Figure 4).
The local cyclic plastic strain contribution for the sharp crack stage ( Δ ε pl   sharp ) is hypothesized to be related to the stress intensity range ( Δ K   ), i.e., the cyclic stress distribution ahead of the sharp crack tip is assumed to also characterize the cyclic strain distribution, within the plastic zone. The value of Δ ε p l   s h a r p should be considered a characteristic (or average) cyclic plastic strain near the crack tip, affecting TMF crack growth. Its value is assumed to be linearly related to Δ K   using a proportionality factor A (see Equation (9)).
To summarize, in the local strain model, crack growth is controlled by cyclic plasticity at the crack-tip level ( Δ ε p l   s u m ), with its value being a superposition of the local cyclic plasticities produced during the sequence of the sharp stage and the subsequent blunt stage of each TMF cycle, i.e., Δ ε p l   s h a r p and Δ ε p l   b l u n t , respectively. The sharp crack-stage contribution is related to cyclic bulk elasticity, while the blunt crack-stage contribution originates from cyclic bulk plasticity. Therefore, the strain-life approach and the local strain model share the same controlling cyclic bulk parameters.
The new local strain model is built-up with the following model equations:
Δ ε p l   s h a r p = A × Δ K   ,   i . e . ,   based   on   LEFM ;
Δ ε p l   b l u n t = K ε × Δ e p l   b u l k   ,   i . e . ,   based   on   EPFM .
Combining Equations (7)–(10) gives the overall representation of the local strain crack-growth model as follows:
d a d N = B   ( Δ ε p l   s u m ) m = B   ( Δ ε p l   s h a r p + Δ ε p l   b l u n t ) m =   B   ( A × Δ K + K ε × Δ e p l   b u l k ) m .
It can be seen from Equation (11) that the local strain model implicitly incorporates a role for the local stress model (see Equation (5)). For instance, at a 50% constraint level, the amount of cyclic bulk plasticity is negligible ( Δ e p l   b u l k ≈ 0) and, therefore, the local stress model and the local strain model coincide, i.e.,
d a d N = C P a r i s ( Δ K ) m   =   B   ( A × Δ K ) m .
For a 50% constraint level, the local stress model parameter C P a r i s , and the local strain parameter combination B   A m should match, which is covered in Section 4.3.
In Equations (7)–(12), the local cyclic plastic strains produced during the sharp and blunt crack tip stage are represented by Δ ε pl   sharp (m/m) and Δ ε p l   b l u n t (m/m), respectively. The total local cyclic plastic strain produced during each TMF cycle is Δ ε p l   s u m (m/m), the cyclic plastic bulk strain is Δ e p l   b u l k (m/m), the crack length is a (m), the number of TMF cycles elapsed is N and the stress intensity range is Δ K   ( MPa m ), defined in Section 3.1.1. The units of the local strain model parameters A, B, and m can be deduced from Equations (9) and (11).

3.2.3. Calculating TMF Lifetime by Numerical Integration (Local Strain Model)

For the local strain model, TMF lifetimes are calculated numerically in a similar manner as described for the local stress-based model. Assuming specific values for the model parameters B, A, K ε , and m, the number of cycles is calculated for the first 0.001 mm of crack extension around the entire circumference of the specimen (see Equations (7) and (11)). This process is repeated for subsequent steps of 0.001 mm, adjusting the values of Δ ε p l   s h a r p in each step in accordance with the increased crack length (the value of Δ ε p l   b l u n t is constant). Summing the results of all steps gives the total number of cycles to failure, N Δ ε p l   s u m A detailed account of all calculations and model parameters involved is given in Appendix A.

4. Results and Discussion

The results of the TMF tests performed are listed in Table 2 and Table 3, with calculated lifetimes using the local stress and local strain crack-growth models, respectively. The tables share the same underlying experimental data, but Table 2 is organized around the constraint level (first column), while Table 3 is structured around the machined notch depth (first column). From the experimental results, a clear decrease in TMF lifetimes is found for higher constraint levels (see Table 2) and larger notch depth values (see Table 3).
In the following sections, it is presented that, by using notched specimens, both local stress and local strain crack-growth models are found to predict TMF lifetimes well for SGI, for all constraint levels tested, within a short testing time and with reduced scatter, while still being representative for TMF behavior of unnotched specimens. The local stress model does not directly address the effect of cyclic bulk plasticity, but accounts for the effect of bulk plasticity by adjusting the values of the (elastic) local stress model parameters. Therefore, the local stress model can be considered useful as a straightforward method to predict TMF lifetimes for a certain TMF constraint level, but does not identify or quantify the underlying contribution of cyclic bulk plasticity as is done in the local strain model.

4.1. Results of the Local Stress Crack-Growth Model

Results for the local stress crack-growth model (i.e., Paris), are presented in Table 2 and Figure 7. A good match between experimental results ( N 10 ) and calculated results ( N Δ K ) is found. For smooth specimens (i.e., without machined notch), the average graphite particle size of 30 μm was taken as initial crack length.
As a starting point, the values of the model parameters C P a r i s and m were roughly estimated, using a straightforward method (see Appendix B). Subsequently, the values of C P a r i s and m were implemented in the numerical procedure, with values of C P a r i s and m further optimized, to match calculated and measured TMF lifetimes. A uniform value was found for the local stress parameter m = 3.58, for all constraint levels. However, the values of C P a r i s needed to be adjusted per constraint level. Therefore, this approach does not completely capture the influence of the constraint level on TMF lifetimes. For instance, at a 50% constraint level and a 125% constraint level, the constant C P a r i s increased by a factor of five, from a value of 1.8 × 10⁻¹¹ to a value of 9.0 × 10⁻¹¹. A clarification for the increase of C P a r i s at higher constraint levels is given in Section 4.3.

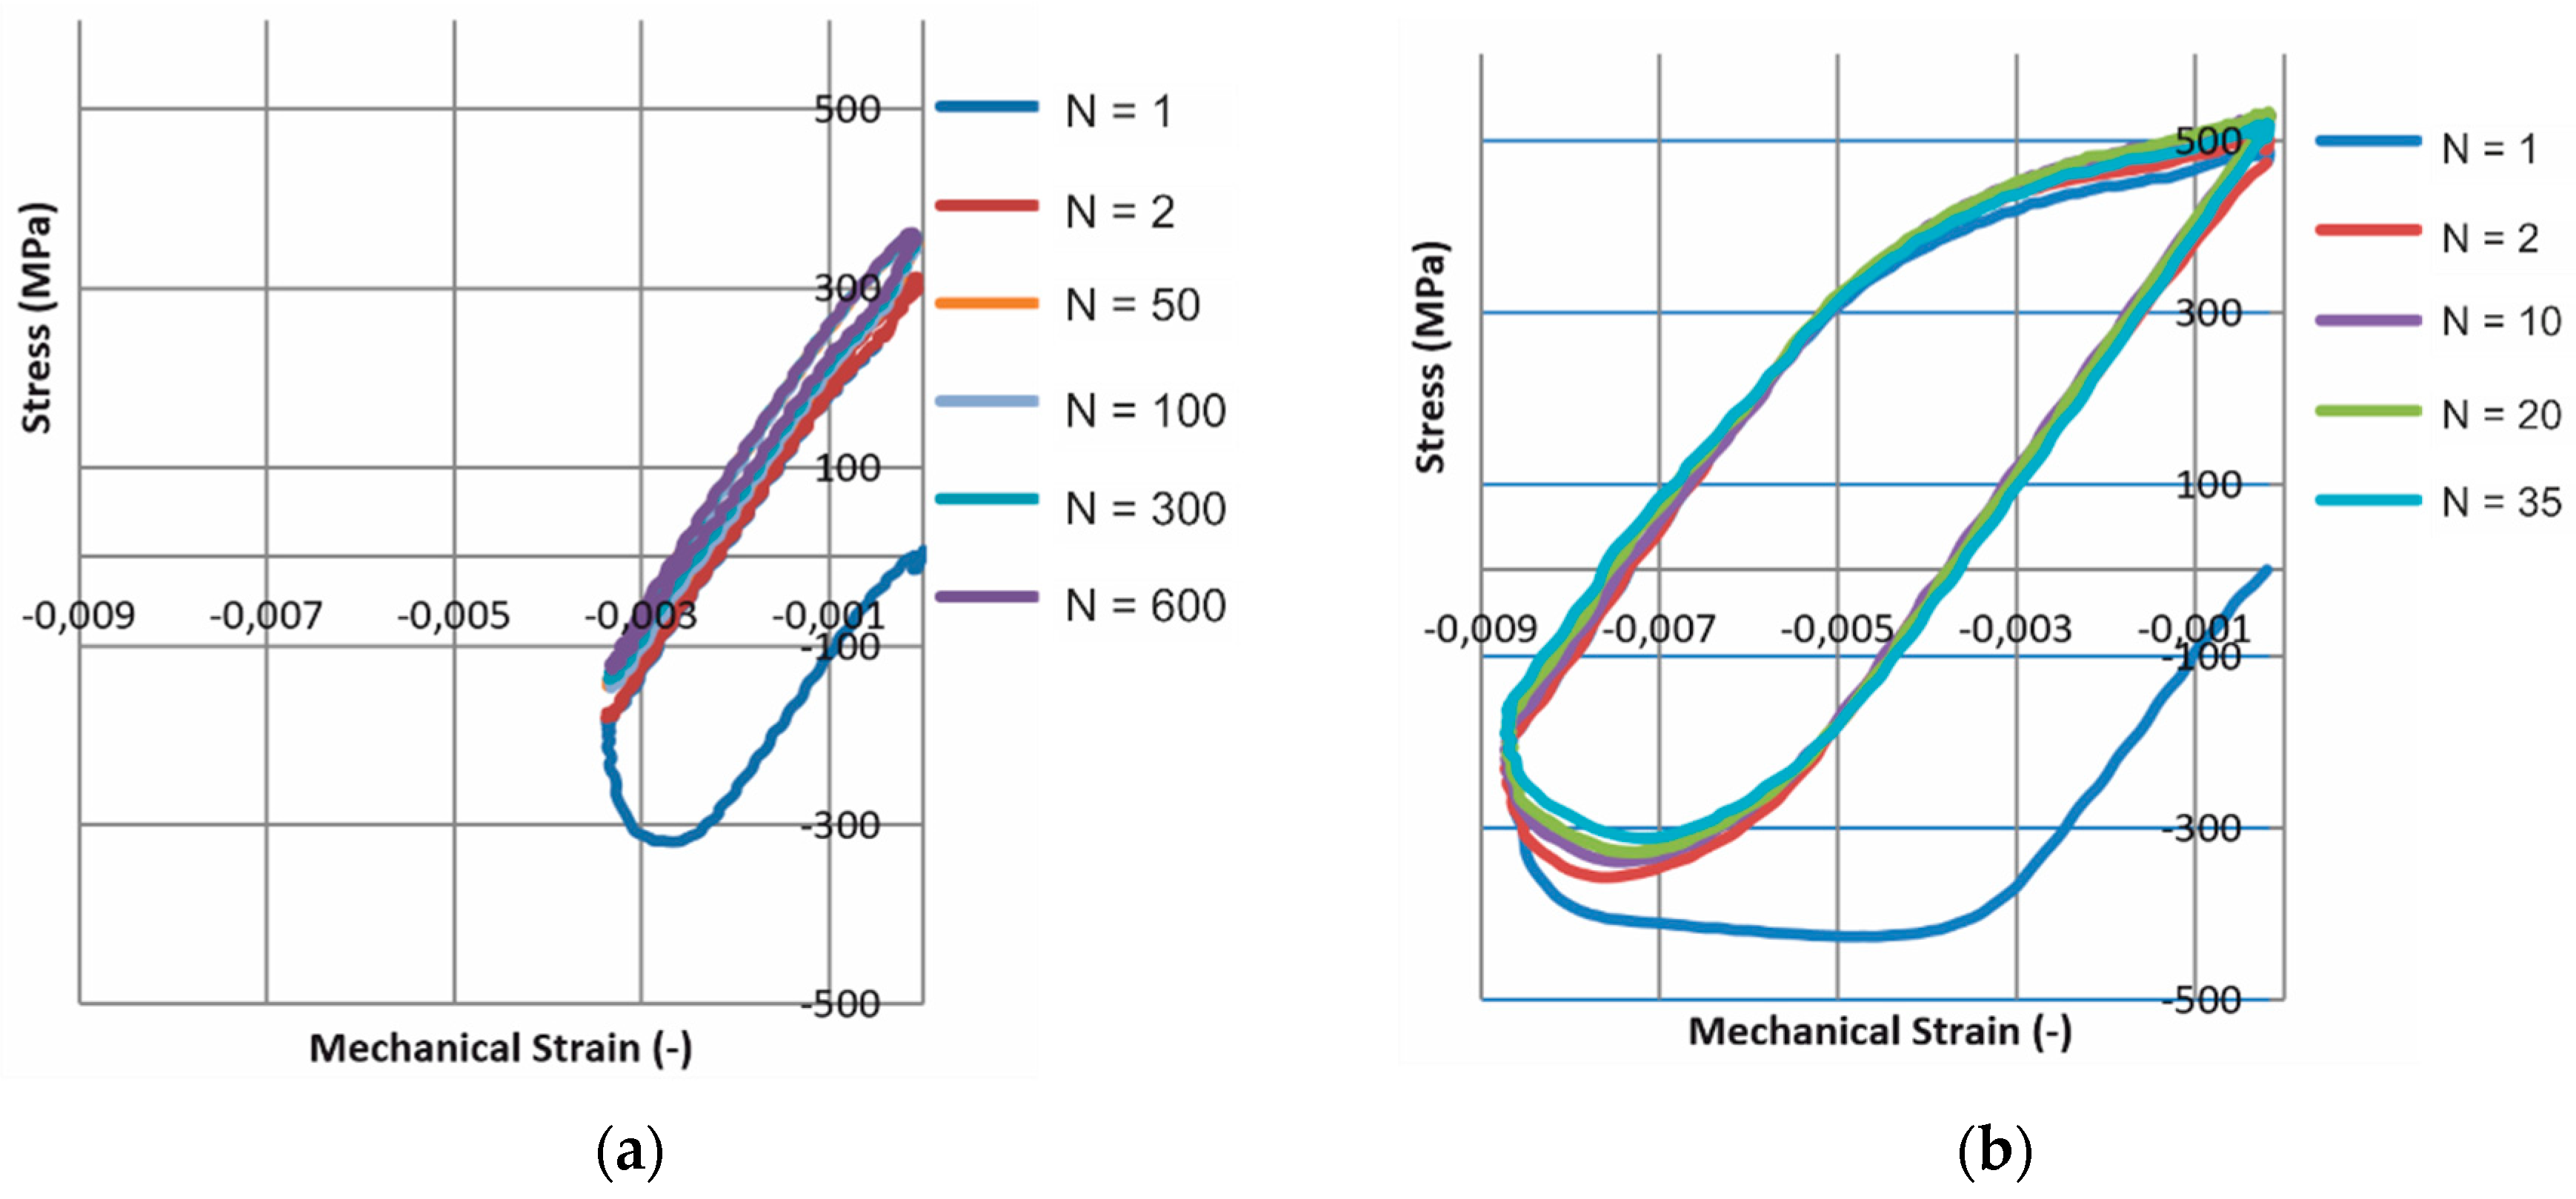
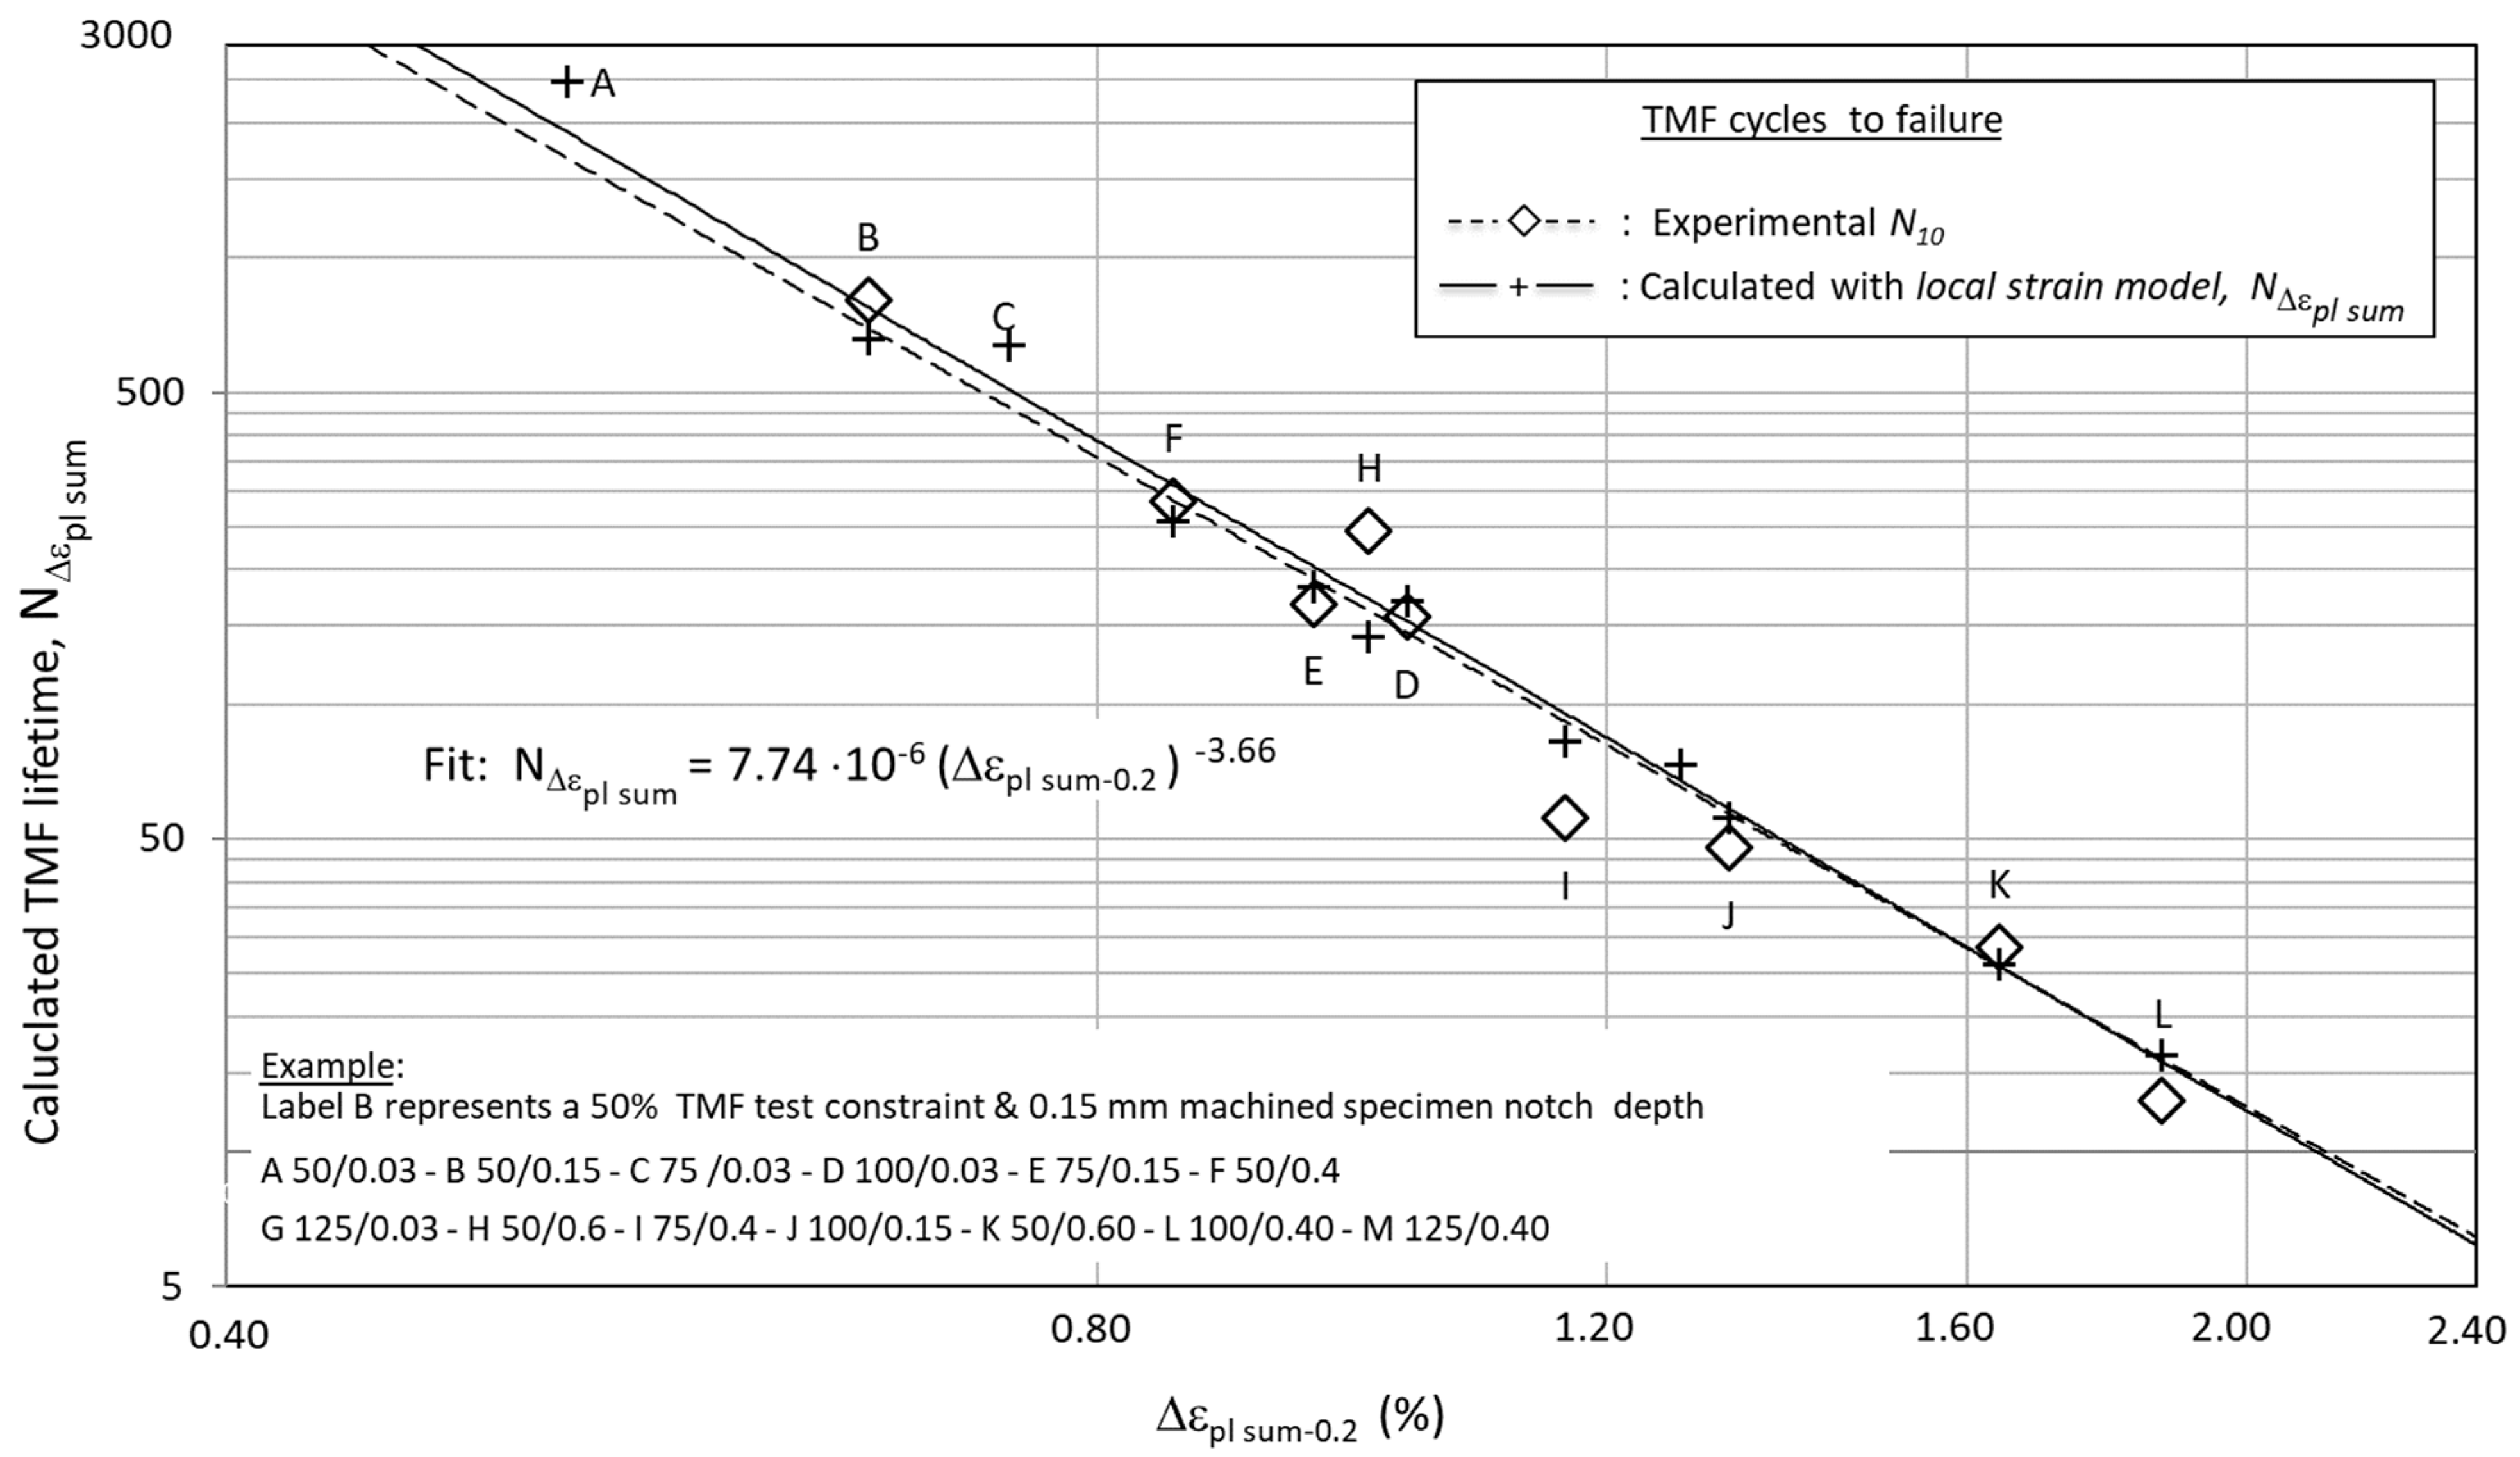
4.2. Results of the Local Strain Crack-Growth Model

Results for the local strain crack-growth model are presented in Table 3 and Figure 7 and Figure 8, revealing a good match between measured and calculated lifetimes for all constraint levels using a fixed set of three model parameters. For smooth specimens (i.e., without machined notch), the average graphite particle size of 30 μm was taken as initial crack length. Model parameter m was copied from the local stress model, signifying the coherence between two approaches.
The values of model parameters A and B were initially estimated using assumptions explained in Appendix C. Using the estimated values as a starting point, the parameter values of A and B were optimized in the numerical lifetime model to match the experimental results. Values of A = 3.00   ×   10 4 and B = 62.0 were found to give the best results.
An estimated value for the fourth model parameter, the strain concentration factor K ε , would ideally be found using Neuber’s Equation (12).
K σ K ε = K t 2 .
In Neuber’s equation, K σ and K ε represent the ratios of the local notch stress/strain levels and the remote nominal stress/strain levels, respectively. The symbol K t represents the stress concentration factor, for a pure elastic case, having a value depending on notch depth and notch root radius. In view of the extended bulk plasticity, during TMF, the value of K σ is likely to approach unity ( K σ ≈ 1), and K ε would equal K t 2 . A problem, however, is that the radius of the blunt crack is not known and K t , therefore, cannot be determined analytically. Apart from depending on the (unknown) blunt crack-tip radius, the value of K t also depends on the notch depth and, for small notch depths (i.e., smooth specimens), a value K t ≈ 1 is reasonable to assume, i.e., K ε ≈ 1 also. Implementing a value K ε = 1 in the numerical calculations for smooth specimens already gave a reasonable match between calculated and measured lifetimes. However, a value of K ε = 1.35 was found to give the best match for smooth specimens. For notched specimens, the value of K ε can be expected to rise, since K t increases with notch depth, and, according to Neuber’s equation, K ε would also increase. For notch depths of 0.15 and 0.40 mm, implementing values for K ε of 1.85 and 2.80, respectively, proved to give the best match between calculated and measured TMF lifetimes.
In the recent work of Besel and Breitbarth [19], plastic zone strain levels were quantified using finite element calculations and digital image correlation techniques. From this work, it was recognized that strain values vary within the plastic zone of a crack tip, with the highest values near the crack tip. In this respect, the value of Δ ε p l   s u m (Equation (8)) should be interpreted as an average (or representative) crack-tip plastic strain range, controlling TMF crack growth. However, the levels of local strain at distinct Δ K   values (see Table 3) were found to be of the same order of magnitude as reported in the literature for metals [19,20]. It is acknowledged that TMF lifetimes are also successfully determined as a function of plastic CTOD, with TMF crack growth rates found to be approximately linear with plastic CTOD values [15,16,17]. Both the plastic CTOD parameter and the Δ ε p l   s u m parameter (used in Equation (7)) characterize a degree of cyclic plasticity at the crack tip. The plastic CTOD is defined for one specific position, being the exact location of the crack tip (this also holds for its associated plastic strain). However, Δ ε p l   s u m   (Equations (7) and (8)) constitutes a more averaged level of plasticity, within the crack-tip plastic zone as a whole. Considering the different backgrounds of the plastic CTOD parameter and the Δ ε p l   s u m parameters, their role in controlling crack growth cannot be compared directly.
Figure 7 gives a straightforward and useful overview on how TMF lifetimes are affected by constraint levels. However, constraint levels are not the direct physical TMF damaging mechanism, but constitute boundary conditions. Representing TMF lifetimes as a function of the crack-tip cyclic plastic strain ( Δ ε p l   s u m ) should give more fundamental information about the TMF crack-growth mechanism. However, Δ ε p l   s u m is a crack-tip parameter, increasing in value during crack growth and, therefore, complicating a straightforward characterization. From the numerical results, the development of crack length with the number of elapsed cycles is known, revealing that 80% of TMF lifetime is consumed during a limited crack extension of only 0.4–0.5 mm. Also, the early stage of crack growth should be associated with low crack-growth rates. In other words, the values of Δ ε p l . s u m , present during the early stage of crack growth, dominate the overall TMF lifetimes.
Figure 8 is an alternative of Figure 7, with TMF lifetimes given as a function of a newly defined crack-tip parameter, designated as Δ ε p l   s u m 0.2 . The new crack-tip parameter ( Δ ε p l   s u m 0.2 ) represents the total local cyclic plastic strain ( Δ ε pl   sum ), as calculated to be present at a crack extension of 0.2 mm (i.e., ahead of the machined notch). According to Figure 8, the TMF lifetimes can be well approximated by a polynomial function of Δ ε p l   s u m 0.2 , qualifying the Δ ε p l   s u m 0.2 crack-tip parameter as a representative condition during crack growth, apparently able to characterize TMF lifetimes. In the final paragraph of Appendix A, an example for calculating the value of Δ ε pl   sum 0.2 is given.

4.3. Comparing the Local Stress and the Local Strain Models

In previous sections, it was observed that for SGI both the local stress and the local strain models predict TMF lifetimes well, for all constraint levels under consideration. The good match for the local strain model can be ascribed to its incorporated Δ ε p l   b l u n t parameter, which is a function of cyclic bulk plasticity. In contrast, the local stress model (Paris) does not contain a dedicated parameter involving cyclic bulk plasticity; however, paradoxically, it is still capable of predicting satisfactory TMF lifetimes for all constraint levels. The reasoning below can shed some light on this paradox.
In general, fatigue lifetime largely depends on the initial crack-growth rate, since the first phase of crack growth is slow and, thus, consumes most part of fatigue lifetime. In this study, the initial crack-growth rates in the local stress model (Paris) and the local strain model were found to be of the same order of magnitude. Therefore, the two models produced comparable calculated TMF lifetimes. The local stress model adjusts the initial crack-growth rate by choosing the C P a r i s parameter such that calculated results match experimental results. Therefore, the variation of C P a r i s for different levels of constraint does not have a physical background, but only expresses the effect of constraint on TMF lifetime. In contrast, the local strain model captures the effect of the constraint level on TMF lifetime with a clear physical parameter, i.e., the local cyclic plastic strain at the crack-tip level ( Δ ε p l   s u m ).
The local stress model and the local strain models are, in principle, developed separately. Consequently, the values of the parameters of both models are also determined independently, without obvious interrelation. However, in the case of the 50% constraint TMF tests, the near lack of cyclic bulk plasticity observed enabled a direct comparison between both models, as discussed before in Section 3.2.2, considering Equation (12). Using the values found for the local strain model parameters A , B , and m, the parameter combination ( B   A m ) constitutes a value of 1.51 × 10⁻¹¹. For the 50% TMF constraint levels, the local stress model parameter C P a r i s is determined to assume a value of 1.80 × 10⁻¹¹. Therefore, for the 50% TMF constraint level, both models predict a TMF crack growth rate of the same order of magnitude, validating the coinciding of both models (for 50% constraint levels).

4.4. The Balance between LEFM and EPFM Mechanisms during TMF (Local Strain Model)

As covered in Section 3.2, the local strain crack-growth model is based on a cyclic blunting/sharpening mechanism of the crack tip during each TMF cycle. As a result, in the local strain approach, crack growth originates from contributions produced separately during the sharp and blunt crack-tip stages. These separate crack-growth contributions are based on distinct principles of LEFM (sharp stage) and EPFM (blunt stage), and originate from cyclic bulk elasticity and cyclic bulk plasticity, respectively.
The separate roles of LEFM and EPFM during TMF can be quantified by considering the ratio of Δ ε p l   b l u n t and Δ ε p l   s u m for each TMF condition tested, reflecting the contribution of the blunt crack stage to the overall TMF lifetime. This strain ratio, Δ ε p l   b l u n t / Δ ε p l   s u m , is designated as R E P F M . An R E P F M value of unity indicates the case that TMF is dominated by EPFM crack-growth mechanisms, while a zero value reflects domination by the LEFM mechanism.
Table 3 shows R E P F M for all TMF tests performed. With constraint levels increasing from 50% to 125%, R E P F M was found to consistently increase, ranging from a value of 0.10 to 0.64, respectively. Clearly, an EPFM mechanism gradually takes over TMF crack growth at higher constraint levels due to the associated increased cyclic plastic bulk strain levels. However, it is striking that, even at the maximum 125% constraint level (with only a few cycles to failure), according to the local strain model, TMF is still controlled considerably by an LEFM crack-growth contribution and the associated cyclic bulk elasticity. The considerable role of LEFM, found for pronounced TMF conditions, contradicts the classical Manson–Coffin relationship approach, where LCF/TMF is predominantly attributed to cyclic bulk plasticity [12,18].
Considering Equations (9) and (11), at increased notch depths (i.e., longer initial crack lengths), the related higher initial Δ K   values would suggest a transition toward the sharp crack stage mechanism (increase in Δ ε pl   sharp ). However, on average, per distinct constraint level, similar values for the R E P F M parameter were found for all notch depths. For instance, for the 125% TMF constraint tests, for notch depths of 0.03 mm, 0.15 mm, and 0.40 mm, respective R E P F M values of 0.64, 0.51, and 0.52 were found (see Table 3). The R E P F M ≈ 0.5 values found for both the 0.15-mm and 0.40-mm notches reflect similar roles for the blunt and sharp crack stages, independent of notch depth. It can be reasoned that, with an increase in notch depth, not only does the value of the initial Δ K   level increases (i.e., sharp crack stage), but the strain concentration K ε also becomes larger (i.e., blunt crack stage, increase in Δ ε pl   blunt ; see Equation (11)). The increases in both Δ K   and K ε with notch depth are probably in balance, keeping the sharp and blunt crack stage contributions in equilibrium independent of notch depth.

5. Summary and Conclusions

In the present paper, the lifetime was measured and numerically calculated in thermo-mechanical fatigue (TMF) tests under various constraint levels on spheroidal graphite cast iron (SGI) with temperatures cycling between 50 and 550 °C. The tested constraint levels were employed to predict TMF lifetimes more in line with actual service conditions of heavy-duty diesel engines.
For SGI, the fracture mechanical Paris law approach worked well to predict lifetimes for all TMF constraint levels. However, a different C P a r i s parameter value was found for each TMF constraint level. Therefore, this approach does not completely capture the influence of the constraint level on TMF lifetimes. As this model is based on cyclic crack-tip stress distributions (characterized by Δ K ), the Paris model was addressed as the local stress approach.
A second crack-growth model was proposed here, based on cyclic plastic strains at the crack-tip level. This model, which was labeled the local strain model, was found to predict TMF lifetimes well for all constraint levels, using a fixed set of four model parameters. The local strain model postulates a cyclic blunting and sharpening of the crack tip during each TMF cycle, involving contributions of both linear elastic fracture mechanics (LEFM) and elastic plastic fracture mechanics (EPFM) principles. The LEFM contribution is associated with the stress intensity range ( Δ K ) and, therefore, is largely controlled by cyclic elastic bulk deformation (i.e., cyclic bulk stress levels). The EPFM contribution is related directly to cyclic plastic bulk strain levels. This means that, in the local strain model, crack growth is induced by both cyclic bulk elasticity (LEFM) and cyclic bulk plasticity (EPFM). Therefore, the local strain crack-growth model and the established strain-life approach share TMF-controlling bulk parameters, demonstrating a coherence between the local strain model and the established strain-life approach. The coherence, however, is weakened for high TMF constraint levels, where the local strain model still involves a considerable role for cyclic bulk stress levels (contradicting the strain-life approach).
Although both the local stress model and the local strain model predict TMF lifetimes satisfactorily, the local strain model can be considered to have a clear physical basis, being the local cyclic plastic strain at the crack tip ( Δ ε p l   s u m ). In contrast, the local stress model can be considered a useful fitting method for a distinct TMF constraint level, but it does not physically account for the effect of constraint levels. The local cyclic plastic strain, as calculated to be present 0.2 mm ahead of the initial crack length (i.e., the machined notch depths), was found to be a suitable characterizing parameter to determine TMF lifetimes.

Author Contributions

The work presented in this paper results from a truly shared effort of all authors and originates from the PhD research of S.G. on TMF in Compacted Graphite Iron. In a subsequent MSc graduation project, A.K. validated the work of S.G. for Spheroidal Graphite Iron and additionally designed test methods for different TMF test constraint levels, with interpretation of test results. T.A.C.R. supported the experimental and theoretical work of S.G. and A.K. L.A.I.K. supervised the work of S.G. throughout and critically reviewed the manuscript. More in detail, A.K., S.G. and T.A.C.R. were in charge of the conceptualisation and the methodology. The experimental work was carried out in large part by A.K. The first draft of the paper was written by A.K. and then thoroughly reviewed and extended by S.G. and T.A.C.R. after joint discussion of the experimental results and joint analysis by all co-authors.

Funding

No external funding was provided, however, materials were supplied by DAF Truck N.V.

Acknowledgments

The authors would like to thank DAF Trucks Central Lab., Eindhoven, the Netherlands, for their contributions and provision of materials for this research. Also, the authors are grateful for the valuable contribution of Michael Janssen and Roel Marissen, who provided us with constructive advice during the progress of writing.

Conflicts of Interest

The authors declare no conflict of interest.

Abbreviations and Symbols

aTMF crack length
AProportionality constant, linking Δ K   to cyclic (sharp) crack-tip plasticity; see Equation (9)
αCoefficient of thermal expansion
a o Depth of a machined notch, also being the assumed initial crack length
BProportionality constant in the local strain crack-growth model; see Equation (7)
C 1 A combination of parameters in the analytical solution for TMF lifetime, for crack growth according to local stress model (i.e., Paris’ law)
C P a r i s Proportionality constant in the local stress crack-growth law (i.e., Paris’ law); see Equation (5)
C 2 see C 1
CGICompacted graphite iron
CTECoefficient of thermal expansion
da/dNTMF crack-growth rate
e t o t a l Bulk strain, as measured by the extensometer (i.e., total strain)
e m e c h Bulk strain, resulting from stress (i.e., mechanical strain)
e t h Bulk strain, resulting from thermal expansion (i.e., thermal strain)
Δ e p l   b u l k Cyclic plastic bulk strain, i.e., the width of the hysteresis loop
Δ ε p l   s h a r p Local cyclic plastic strain at the crack tip, produced during the sharp crack stage of the local strain model; see Equation (9) (mechanical strain)
Δ ε p l   b l u n t Local cyclic plastic strain at the crack tip, produced during the blunt crack stage of the local strain model; see Equation (10) (mechanical strain)
Δ ε p l   s u m The cumulative local cyclic plastic strain at the crack tip; see Equation (8) (mechanical strain)
Δ ε p l   s u m ( a o ) The value of Δ ε pl   sum at the initial crack length a o , being the depth of the machined notch (a similar notation is used for initial values of Δ ε pl   sharp and Δ ε pl   blunt )
Δ ε p l   s u m 0.2 The value of Δ ε p l s u m , at a crack length of ( a o + 0.2   mm ) , characterizing TMF lifetime
EPFMElastic plastic fracture mechanics
R E P F M The relative contribution on TMF of the blunt crack stage (local strain crack-growth model)
γRelative degree of thermal constraint during a TMF test
K ε Strain concentration factor (local strain/nominal strain)
K t Geometrical stress concentration factor (defined for elastic strains only)
K σ Stress concentration factor (local stress/nominal stress)
K m i n Minimum value of the stress concentration factor during TMF
K m a x Maximum value of the stress concentration factor during TMF
Δ K Stress-intensity range = ( K m a x K m i n )
Δ K a o Initial stress-intensity range, with the machined notched depth ( a o ) taken as initial crack length. For unnotched specimens, the average graphite particle size is taken as initial crack length.
Δ K Δ a = 0.2 The value of Δ K , at a crack length of ( a o + 0.2   mm )
LCFLow cycle fatigue
LEFMLinear elastic fracture mechanics
N 10 Number of cycles at a 10% load drop in a TMF test (i.e., experimental cycles to failure)
N Δ K Number of TMF cycles to failure, calculated by numerical integration of the local stress crack-growth model (i.e., Paris’ law)
N Δ K a n . Number of TMF cycles to failure, given by the analytical solution of the local stress crack-growth model (i.e., Paris’ law)
Δ N Number of TMF cycles elapsed
N Δ ε p l   s u m Number of TMF cycles to failure, calculated by numerical integration of the local strain crack-growth model
rRadius of the cylindrical gauge length of the TMF test specimen
S Bulk stress
Δ S Nominal (bulk) stress range
SGISpheroidal graphite iron
SiMoCast iron with silicon and molybdenum as major alloying elements
Δ T TMF cycle temperature range
TMFThermo-mechanical fatigue
ZNumber of replicate TMF tests

Appendix A. Example Calculations of TMF Lifetimes, Using the Local Strain Model

Example Calculation for 100% Constraint TMF Test Results, for a 0.15-mm Machined Notch

Averaging TMF test results of three replicate tests (Z = 3) resulted in a representative (measured) bulk cyclic stress level Δ S of 772 MPa, and a representative measured bulk cyclic plastic strain level ( Δ e p l   b u l k ) of 0.23%.
At the crack-tip level, the value of the total local cyclic plastic strain ( Δ ε p l   s u m ) is calculated below to be 0.99% This result consists of two contributions, being the cyclic crack-tip plastic strain for the sharp crack stage ( Δ ε p l   s h a r p ) and the (additional) cyclic crack-tip plastic strain developed during the blunt crack stage ( Δ ε p l   b l u n t ). These two contributions are calculated below under (i) and (ii), respectively.
  • The initial value of Δ K   value ( Δ K a o ) is calculated according to Equation (6), i.e., Δ K a o   = F ( a o / r ) · Δ S π a o considering the notch depth as initial crack length i.e., 0.15 mm), resulting in Δ K a o   = F ( 0.15 / 3 ) · 772 · π · 0.00015 = 19.17   MPa m (see Table 3). Using Equation (9), Δ ε p l   s h a r p = A × Δ K , and, using the determined value of constant A = 3 × 10 4 ,   Δ ε p l   s h a r p = A × Δ K = 3 × 10 4   × 19.2 × 100 % = 0.58 % . It should be noted that the value of A is taken as a constant for all TMF tests performed.
  • Using Equation (10), Δ ε p l   b l u n t = K ε × Δ e p l   b u l k   , with a value of K ε = 1.80 and Δ e b u l k = 0.23% results in Δ ε p l   b l u n t = 1.80 × 0.23 = 0.41%. It should be noted that the value of K ε = 1.80 is identical for all TMF tests performed using a 0.15-mm notch depth.
    Superposition of contributions (i) and (ii), according to Equation (8), gives
    Δ ε p l   s u m = Δ ε p l   s h a r p + Δ ε p l   b l u n t   = 0.58 + 0.41 = 0.99 % ,
    which is reported as
    Δ ε p l   s u m Δ ε p l   b l u n t Δ ε p l   s h a r p   i . e .   0.99   0.41   0.58 .
The initial value of Δ ε pl   sum of 0.99%, according to Equation (7) (or Equation (11)), using values of local strain-model constants B and m of 62 and 3.58, respectively, gives an initial crack-growth rate.
d a d N = B   ( Δ ε p l   s u m ) m = 62 × ( 0.0099 ) 3.58 = 4.14 × 10   6 m cycle .
It should be noted that the local strain model constants B and m are identical for all TMF lifetimes calculations, being 62 and 3.58, respectively.
For subsequent discrete steps of 0.001 mm of crack growth, the number of cycles is calculated needed to cover this growth. For instance, for the first iteration step, covering a crack length interval from 0.150 to 0.151 mm, the following is found:
Δ a Δ N = 4.13 × 10   6 m cycle o r   Δ N = Δ a 4.13 × 10   6   with   Δ a = 10 6   m ,   Δ N = 0.242   cycle   /   0.001   mm .  
Due to the small step size, the results of the second calculated iteration step, being the crack-length increment from 0.151 to 0.152, are almost similar to those of the first step.
Adding the Δ N values of all iteration steps gives a numerically calculated TMF lifetime N Δ ε p l   s u m of 56 cycles.
As an example, the situation of the iteration step 0.2 mm ahead of the machined notch tip is considered, i.e., from a crack length of 0.350 mm to 0.351 mm. In this step, due to the longer crack, the value of Δ K   raised to a value of 30.31 MPa m leads to a value of
Δ ε p l   s h a r p = A × Δ K = 3 × 10 4   × 30.31 × 100 % = 0.91 % .
The blunt crack-stage contribution ( Δ ε pl   blunt ) is independent of crack length, i.e., 0.41%, as calculated above under (ii). Therefore, at a crack length a = 0.35 mm, the local cyclic plastic strain ( Δ ε pl   sum ) can be reported as   1.32   0.41   0.91   . The new crack-growth rate is calculated as 1.27 × 10   5   m / cycle , while the increment from 0.350 mm to 0.351 mm consumes a number of cycles Δ N = 0.079   cycle / 0.001   mm .
The calculation for a specific crack extension of 0.2 mm was chosen because, in this case, the value of Δ ε pl   sum also constitutes the value of Δ ε p l   s u m 0.2 , as discussed in Section 4.2. The value of Δ ε p l   s u m 0.2 = 1.32% can also be observed for label J in Figure 8.

Appendix B. Initial Estimation of the Local Stress Model Parameters

The Local Stress Model Parameters

Considering the local stress model, d a d N = C P a r i s ( Δ K ) m   (Equation (5)), the preliminary values for the parameters C P a r i s and m are evaluated by considering an estimation of the analytical solution of the local stress crack-growth law. As simplification, the geometrical function F ( a o r ) , as defined in Equation (6), is taken as a constant value, being the initial value for a crack length equal to the machined notch depth. The analytical solution, with the bulk stress range ( Δ S ) given in MPa, can now be derived from Paris’ law, and is also reported in the literature [12].
N Δ K a n . =   1 C 1 C 2 [ ( a f ) C 2   ( a o ) C 2 ]   with C 1 = [ C p a r i s ( π ) 1 2 m ] { F ( a o r ) · Δ S } m ; C 2 =   ( 1 1 2 m ) .
Using the 50% constraint test results for 0.15-mm and 0.40-mm notched specimens, experimental results are summarized below. The 50% constraint test results are chosen specifically, because, at 50% constraint, the experiments showed a virtual absence of cyclic bulk plasticity, typical for Paris fatigue crack growth behavior.
0.15-mm machined notch: ( Δ S ) 0.15 = 490 MPa, ( N 10 ) 0.15 = 803 cycles, F ( 0.15 3 ) = 1.144 .
0.40-mm machined notch: ( Δ S ) 0.40 = 480 MPa, ( N 10 ) 0.40 = 284 cycles, F ( 0.40 3 ) = 1.196 .
Implementing the experimental lifetimes in the analytical solution (Equation (A6)) is achieved by equating the ratio of experimental lifetimes with the ratio of the analytical lifetimes, as shown below for the 0.15-mm and 0.40-mm machined notches, respectively.
( N 10 ) 0.15 ( N 10 ) 0.40 =   ( N Δ K a n . ) 0.15 ( N Δ K a n . ) 0.40 .
For the analytical solution, the effect of the final crack length (af) can be omitted, since the slow crack growth at initial crack length (ao) dominates the TMF lifetime, which results in the following:
( N 10 ) 0.15 ( N 10 ) 0.40 =   ( F ( 0.40 3 ) ( Δ S ) 0.40 ) m ( F ( 0.15 3 ) ( Δ S ) 0.15 ) m ·   [ 0.15   ] ( 1 1 2 m ) [ 0.40 ] ( 1 1 2 m ) ,
2.827   =   ( 1.024 ) m × ( 0.375 ) ( 1 1 2 m ) ,
log ( 2.827 ) =   log   ( 1.024 ) m   +   log ( 0.375 ) ( 1 1 2 m ) ,
0.451   =   m × log ( 1.024 ) +   ( 1 1 2 m ) × log ( 0.375 ) ,
=   0.010 m     0.426   +   0.213 m ,
resulting in the estimation m = 3.932 .
The estimated value of C P a r i s is found by substituting the estimated value of m = 3.932 in Equation (A6), using the experimental results of the 0.15-mm notch, being ( Δ S ) 0.15 = 490 MPa, ( N 10 ) 0.15 = 803 cycles and F ( 0.15 3 ) = 1.144 .
C 1 = [ C p a r i s ( π ) 1 2 m ] { F ( a o r ) · Δ S } m = C p a r i s × 9.493 × { 1.144 × 490 } 3.932 = 6.095 × 10 11 × C P a r i s ;
C 2 =   ( 1 1 2 m ) =   0.966 ;
N Δ K a n . =   1 C 1 C 2 [ ( a f ) C 2   ( a o ) C 2 ] 1 C 1 C 2 [   ( a o ) C 2 ] C 1 =   1 N Δ K a n .   · C 2 [   ( a o ) C 2 ] ;
With C 1 = 6.095 × 10 11 × C P a r i s ; C 2 = 0.966   ;   a o = 0.00015   m ,   and   N Δ K a n . = 803   cycles   yields :   6.095 × 10 11 × C P a r i s =   1 803     0.966 [ 0.00015 ] 0.966 C P a r i s = 1.05 × 10 11 .
The estimated values of C P a r i s = 1.05 × 10 11 and m = 3.932 were implemented as initial values in the numerical lifetime calculation for the 50% constraint experiments, as discussed in Section 3.1. By adjusting the parameter values incrementally (i.e., by trial and error), the numerical lifetime results were found to match all experimental results optimally for parameter values C P a r i s = 1.80 × 10 11 and m = 3.58 .

Appendix C. Initial Estimation of the Local Strain Model Parameters

As discussed in Section 3.2.2, in the local strain model the crack-growth rate is given by
d a d N = B   ( A × Δ K + K ε × Δ e p l   b u l k ) m .
Preliminary values for the parameters A and B were evaluated by considering the local strain model to be equivalent to the local stress model, for the case of 50% constraint. Also, it was hypothesized that ratios of lifetimes found reflect ratios of initial crack-growth rates, since initial crack-growth rates can be expected to dominate TMF lifetimes.
Considering 50% and 100% constraint tests for 0.15 mm-notched specimens, the following can be found:
50% constraint case (0.15-mm notch): ( N 10 ) 0.15 = 803 cycles,   ( Δ K ) 50 % = 12.0   MPa m (see Table 3);
100% constraint case (0.15-mm notch) : ( N 10 ) 0.15 = 48 cycles, ( Δ K ) 100 % = 19.0   MPa m and ( Δ e p l   b u l k ) 100 % = 0.0023   ( m / m ) (see Table 3);
( d a d N ) 50 % ( d a d N ) 100 % = 48 803 = 6.00 × 10 2   = B   ( A × Δ K 50 % ) m B   ( A × Δ K 100 % + · Δ e p l   b u l k ,   100 % ) m = ( A × Δ K 50 % ) m   ( A × Δ K 100 % + · Δ e p l   b u l k ,   100 % ) m . To summarize, with ( Δ K ) 50 % = 12.0   MPa m , ( Δ K ) 100 % = 19.0   MPa m   , and ( Δ e p l   b u l k ) 100 % = 0.0023   ( m / m ) and m = 3.58, a value for parameter A is estimated as 3.16 × 10 4 . The value of parameter B is estimated by considering the local stress and local strain models to coincide for the 50% constraint level, as is discussed in Section 4.3 i.e. ( C P a r i s ) 50 % = B A m . With values of ( C P a r i s ) 50 % = 1.80 × 10 11 , parameter A = 3.16 × 10 4 and parameter m = 3.58, the value of parameter B is estimated as 61.2.
The provisionally estimated values of A = 3.16 × 10 4 and B = 61.2 were implemented as initial values in the numerical lifetime calculation for the 50% constraint experiments, as discussed in Section 3.2.3. By gradually adjusting these estimated parameter values of A and B (i.e., by trial and error), the numerical lifetime results were found to match all experimental results optimally for parameter values   A = 3.00 × 10 4 and B = 62.0 . Therefore, the estimated and final values found for parameters A and B are in good agreement.

References

  1. Gocmez, T.; Awarke, A.; Pischinger, S. A new low cycle fatigue criterion for isothermal and out-of-phase thermomechanical loading. Int. J. Fatigue 2010, 32, 769–779. [Google Scholar] [CrossRef]
  2. Rémy, L.; Haddar, N.; Alam, A.; Koster, A.; Marchal, N. Growth of small cracks and prediction of lifetime in high-temperature alloys. Mater. Sci. Eng. A 2007, 468–470, 40–50. [Google Scholar] [CrossRef]
  3. Ghodrat, S.; Riemslag, A.C.; Janssen, M.; Sietsma, J.; Kestens, L.A.I. Measurement and characterization of thermo-mechanical fatigue in compacted graphite iron. Int. J. Fatigue 2013, 48, 319–329. [Google Scholar] [CrossRef]
  4. Ghodrat, S. Thermo-Mechanical Fatigue of Compacted Graphite Iron in Diesel Engine Components. Ph.D. Thesis, Delft University of Technology, Delft, The Netherlands, 10 June 2013. [Google Scholar]
  5. Ghodrat, S.; Riemslag, A.S.; Kestens, L.A.I.; Petrov, R.H.; Janssen, M.; Sietsma, J. Effects of Holding Time on Thermo-Mechanical Fatigue Properties of Compacted Graphite Iron through Tests with Notched Specimens. Metall. Mater. Trans. A 2013, 44, 2121–2130. [Google Scholar] [CrossRef]
  6. Ghodrat, S.; Kestens, L. Microstructural dependence of tensile and fatigue properties of compacted graphite iron in diesel engine component. Steel Res. Int. 2016, 87, 772–779. [Google Scholar] [CrossRef]
  7. Norman, V.; Calmunger, M. On the micro- and macroscopic elastoplastic deformation behaviour of cast iron when subjected to cyclic loading. Int. J. Plast. 2019, 115, 200–215. [Google Scholar] [CrossRef]
  8. Norman, V.; Skoglund, P.; Leidermark, D.; Moverare, J. The transition from micro- to macrocrack growth in compacted graphite iron subjected to thermo-mechanical fatigue. Eng. Fract. Mech. 2017, 186, 268–282. [Google Scholar] [CrossRef]
  9. Kalra, A. Thermo-Mechanical Fatigue-Lifetime Determination of Diesel Engine Exhaust Manifolds. Master’s Thesis, Delft University of Technology, Delft, The Netherlands, 30 August 2016. [Google Scholar]
  10. Tada, H.; Paris, P.; Irwin, G. The Stress Analysis of Cracks Handbook, 2nd ed.; Paris Productions INC: Wilmington, MA, USA, 1985. [Google Scholar]
  11. Vor, K.; Gardin, C.; Sarrazin-Baudoux, C.; Petit, J. Wake length and loading history effects on crack closure of through-thickness long and short cracks in 304L: Part I–Experiments. Eng. Fract. Mech. 2013, 99, 266–277. [Google Scholar] [CrossRef]
  12. Fuchs, H.O.; Stephens, R.I. Metal Fatigue in Engineering, 2nd ed.; John Wiley and Sons: Hoboken, NJ, USA, 2001; Volume 186–234, pp. 103–110. ISBN 978-0-471-51059-8. [Google Scholar]
  13. Ding, F.; Feng, M.; Jiang, Y. Modelling of fatigue crack growth from a notch. Int. J. Plast. 2007, 23, 1167–1188. [Google Scholar] [CrossRef]
  14. Jiang, Y.; Ott, W.; Baum, C.; Vormwald, M.; Nowack, H. Fatigue life predictions by integrating EVICD fatigue damage model and an advanced cyclic plasticity theory. Int. J. Plast. 2009, 25, 780–801. [Google Scholar] [CrossRef]
  15. Seifert, T.; Riedel, H. Mechanism-based thermomechanical fatigue life prediction of cast iron, Part I: Models. Int. J. Fatigue 2010, 32, 1358–1367. [Google Scholar] [CrossRef]
  16. Seifert, T.; Maier, G.; Uihlein, A.; Lang, K.-H.; Riedel, H. Mechanism-based thermomechanical fatigue life prediction of cast iron. Part II: Comparison of model predictions with experiments. Int. J. Fatigue 2010, 32, 1368–1377. [Google Scholar] [CrossRef]
  17. Antunes, F.V.; Rodrigues, S.M.; Branco, R.; Camas, D. A numerical analysis of CTOD in constant amplitude fatigue crack growth. Theor. Appl. Fract. Mech. 2016, 85, 45–55. [Google Scholar] [CrossRef]
  18. Manson, S.S.; Halford, G.R. Fatigue and Durability of Structural Materials; ASM International: Geauga County, OH, USA, 2006; Volume 179–200, pp. 54–74. ISBN 0-87170-825-6. [Google Scholar]
  19. Besel, M.; Breitbarth, E. Advanced analysis of crack tip plastic zone under cyclic loading. Int. J. Fatigue 2016, 93, 92–108. [Google Scholar] [CrossRef]
  20. Ghodrat, S.; Riemslag, A.; Kestens, L. Measuring Plasticity with Orientation Contrast Microscopy in Aluminium 6061-T4. Metals 2017, 7, 108. [Google Scholar] [CrossRef]
Figure 1. Typical microstructure of the material under consideration.
Metals 09 01068 g001
Figure 2. Geometry of thermo-mechanical fatigue (TMF) dog-bone specimen for (a) the case of unnotched (smooth) specimens, and (b) for circumferentially notched specimens with notch depth of 0.2 mm (as example) and a 0.04-mm notch-tip radius (dimensions are given in mm).
Metals 09 01068 g002
Figure 3. Temperature and total strain profiles for the out-of-phase TMF tests. For all constraint levels, temperature was varied from 50 °C to 550 °C in 70 s, and from 550 °C to 50 °C in 80 s. Holding times of 30 s and 80 s were introduced at 550 °C and 50 °C, respectively.
Metals 09 01068 g003
Figure 4. A typical tested TMF test stress–strain response for a 75% TMF test constraint level as an example.
Metals 09 01068 g004
Figure 5. Strain hysteresis loops obtained from TMF tests performed on samples with a notch depth of 0.15 mm (a) at 50% partial constraint, and (b) at 125% total constraint. Total strain is defined as zero at room temperature. N depicts the number of TMF cycles.
Metals 09 01068 g005
Figure 6. Development of bulk and local plasticity during the different stages of a TMF hysteresis loop. Note: For clarity, strain levels at the crack tip and notch root are illustrated in terms of dimensions of the resulting plastic zones. It is recognized that this representation is valid schematically only.
Metals 09 01068 g006
Figure 7. TMF lifetimes calculated according to both the local stress model and local strain model, as a function of constraint level.
Metals 09 01068 g007
Figure 8. TMF lifetimes plotted as a function of Δ ε p l   s u m 0.2 , with Δ ε p l   s u m 0.2 being the cumulative local cyclic plastic strain at the crack tip (i.e., Δ ε pl   sum ), calculated according to the local strain model for a crack length extension of 0.2 mm (ahead of the start crack length, i.e., ahead of the machined notch depth).
Metals 09 01068 g008
Table 1. Chemical composition (in wt%) of the spheroidal cast iron under consideration.
CSiMoMnSPFe
3.404.200.800.500.050.02Balance
Table 2. Typical values for thermo-mechanical (TMF) crack-growth parameters for all TMF tests performed, with calculated lifetimes according to the local stress model (Paris), with the C P a r i s coefficient based on units for d a d n and Δ K of m (cycle)−1 and MPa   m 0.5 , respectively.
γ (%) a o (mm)Z(1)Experimental ValuesLocal Stress Model Calculations (Paris’ Law)
S(2) (MPa) N 10 (2) (–)Δemech (%) N Δ K (2) (–) C paris m (–)
1250.153836 ± 3%29 ± 41%0.8424 ± 12%9.0 × 10−113.58
0.402808 ± 3%8 ± 0%8 ± 12%
1000.036718 ± 1%157 ± 55%0.67287 ± 4%8.5 × 10−113.58
0.153772 ± 3%48 ± 23%41 ± 10%
0.402710 ± 2%13 ± 8%14 ± 7%
750.153654 ± 4%168 ± 19%0.51193 ± 16%3.3 × 10−113.58
0.402631 ± 0%56 ± 7%55 ± 0%
500.153480 ± 2%803 ± 28%0.34990 ± 8%1.8 × 10−113.58
0.404480 ± 7%284 ± 20%276 ± 21%
0.603453 ± 2%244 ± 14%144 ± 7%
(1) Number of replicate tests; (2) standard deviation (SD), given as a percentage of the average value.
Table 3. Values for TMF crack-growth parameters for all TMF tests performed, with calculated lifetimes based on the local strain model.
a o ; K ε Z(1)S ± SD (2) Δ e p l   b u l k N 10 ± SD (2) N Δ ε p l   s u m ± SD (2) Δ (3) Δ ε p l   s u m (4) R E P F M (5) Δ K a o
(mm);(–)(%)(–)MPa(%)(–)(–)(%)(%)(–) MPa m
0.03; 1.35125-8360.37-73- 0.77   0.49   0.27 0.649.1
100 6718 ± 3%0.26157 ± 56%170 ± 7%+8 0.59   0.35   0.24 0.607.9
75-6540.10-636- 0.35   0.14   0.21 0.397.1
50 -4900.05-2478- 0.20   0.07   0.16 0.305.4
0.15; 1.80125 3836 ± 3%0.3729 ± 42%26 ± 7%−9 1.28   0.66 0.62 0.5121
1003772 ± 3%0.2348 ± 22%56 ± 8%+17 0.99   0.41 0.58 0.4219
753654 ± 4%0.10168 ± 19%183 ± 13%+9 0.67   0.18 0.49 0.2716
503490 ± 2%0.05803 ± 28%656 ± 7%−18 0.45   0.09 0.36 0.2012
0.40; 2.901252808 ± 3%0.408 ± 0.5%7 ± 6%−18 2.15   1.13 1.03 0.5234
1002710 ± 2%0.2513 ± 11%16 ± 5%+26 1.61   0.71 0.90 0.4430
752631 ± 0%0.0556 ± 6%83 ± 0%+49 0.93   0.13 0.80 0.1327
504480 ± 7%0.02284 ± 56%256 ± 19%−10 0.68   0.07 0.61 0.0720
(1) Number of replicate tests; (2) standard deviation (SD), given as a percentage of the average value; (3) relative difference of the calculate lifetime (local strain model), with the experimental lifetime; (4) superscripts and subscripts are the calculated local cyclic plastic ranges for the sharp and blunt crack stages, i.e., Δ ε p l   s h a r p and Δ ε p l   b l u n t , respectively. The values represent calculated results for the initial crack length a o . (5) Example: For a o = 0.15 mm, in 100% constraint, values of Δ ε p l   s h a r p = 0.58% and Δ ε p l   b l u n t = 0.41% are calculated (see Appendix A). Therefore, Δ ε p l   s u m = (0.58 + 0.41) = 0.99%. R E P F M = 0.41/0.99 = 0.42. Note: The italic and underlined fonts, for the “smooth” specimens, are based on calculations only, using the values of cyclic bulk stress/strain ranges of the 0.15 notched experiments, in order to estimate TMF test conditions, for tests not actually performed.

