Abstract
This study delineates a novel finite element model to consider a pattern of process parameters affecting the forward slip in micro flexible rolling, which focuses on the thickness transition area of the rolled strip with thickness in the micrometre range. According to the strip marking method, the forward slip is obtained by comparison between the distance of the bumped ridges on the roll and that of the markings indented by the ridges, which not only simplifies the calculation process, but also maintains the accuracy as compared with theoretical estimates. The simulation results identify the qualitative and quantitative variations of forward slip with regard to the variations in the reduction, rolling speed, estimated friction coefficient and the ratio of strip thickness to grain size, respectively, which also locate the cases wherein the relative sliding happens between the strip and the roll. The developed grain-based finite element model featuring 3D Voronoi tessellations allows for the investigation of the scatter effect of forward slip, which gets strengthened by the enhanced effect of every single grain attributed to the dispersion of fewer grains in a thinner strip with respect to constant grain size. The multilinear regression analysis is performed to establish a statistical model based upon the simulation results, which has been proven to be accurate in quantitatively describing the relationship between the forward slip and the aforementioned process parameters by considering both correlation and error analyses. The magnitudes of each process parameter affecting forward slip are also determined by variance analysis.
1. Introduction
Strip rolling technology has been further developing rapidly in recent decades thanks to the wide application of its products in a variety of fields, including manufacturing, construction and energy, wherein higher quality and productivity have been of great interest to the researchers and engineers in the field of metal forming [1,2,3]. For instance, Jiang et al. [3,4] investigated the rolling force, intermediate force, roll edge contact force and wear condition, as well as the shape, profile and surface roughness of the rolled strip in response to various process parameters like reduction, rolling speed, initial strip thickness, using a combined numerical and experimental approach. Xie et al. [5] carried out analytical and experimental investigations to identify the edge crack initiation and propagation during cold rolling of low carbon steel strip with the aid of Atomic Force Microscopy and Scanning Electron Microscopy, from which they found a lower friction coefficient, as well as a finer surface finish, would not only prevent the microcracks, but delay the crack-initiation process in rolled strip. Jiang et al. [6] simulated the cold strip rolling process with consideration of friction variation along the rolling and transverse directions based on finite element method, whereof the numerical results had revealed the significant influence of friction on the rolling force, rolled strip shape and profile, which were confirmed by the measured values that the developed approach was capable of improving the accuracy of the conventional rolling model. Moreover, an elastic-plastic finite element model was established by Jiang and Tieu [7] to analyse the strip deformation in the roll bite zone taking tension into account, which was of great help to quantify the effects of tension and rolling speed on the hump value at elastic entry zone, as well as determining the mixed lubricating film in the roll bite and the elastic recovery of final rolled strips. Nonetheless, the forward slip is also a common phenomenon during strip rolling, which reflects the difference between the strip speed and the roll speed at the exit of roll bite. It is always a significant parameter that helps understand and determine the friction, and also assists in tension control, as well as in preventing the occurrence of skidding [8].
The forward slip is normally analytically predictable or can be measured in both industrial and experimental circumstances [9,10]. For instance, Heydari vini and Farhadipour [11] computed the forward slip as a function of process parameters and strip geometry in cold rolling. Pawelski [12] introduced an explicit analytical method for determining the forward slip during cold strip rolling, which reproduced most predictions of classic strip theory, except for extreme cases, such as in the foil rolling regime or for skin pass rolling. Bayoumi [13] developed a kinematic analytical approach to predict the forward slip in hot strip rolling based on formulating a velocity field in the roll bite zone that considers the effect of interfacial friction on the distribution of the axial velocity and longitudinal stresses across the strip thickness. This method could yield accurate results, compared with those of the finite element simulation, and was suitable for use in online control because of the drastic reduction in computational time. On the other hand, Tieu, Jiang et al. [14] discussed two promising experimental methods, which are the strip marking method and the laser Doppler method, respectively, and Liu [10] applied these two methods to measure the forward slip in cold rolling of aluminium alloy under lubricated condition, while the results successfully verified the effectiveness of both methods for determining the forward slip in the laboratory rolling mill. Li et al. [8] analysed the uncertainty of forward slip measurement using the laser Doppler method and proposed an improved laser Doppler velocimetry system by mixing the Doppler signals with a reference frequency signal before feeding them to the signal processors. Rolling tests of mild steel strips using the improved system showed a fivefold accuracy enhancement of forward slip measurements under different rolling conditions and surface roughness. Yuen [15] described an alternative approach to determine the forward slip in hot strip rolling, which instead compared the distance the head end of the workpiece had travelled with that the periphery of the work roll had travelled during the same time period.
Extensive investigations have shown variability in forward slip under different reductions, rolling speeds, roll diameters, tensions, lubrication, etc., however, the microstructural effects still remain to be identified, particularly with the micro-thin strips. Among most studies, the microstructural effects have been characterised by the ratios of specimen thickness (T) to grain size (D) to find their interactive relationship with the micro deformation behaviours. For example, according to Fang et al. [16], the plastic deformation behaviour along with the fracture mode of the material produces an obvious change when the value of the T/D ratio varies around 1. Lee et al. [17] revealed that both the maximum blank holder force and the limit drawing ratio increased with increasing T/D ratio during micro deep drawing of 304 stainless steel foils. They also recommended that the T/D ratio be greater than 10 for better formability and steady deep drawing behaviour. In addition, Anand and Kumar [18] demonstrated the influence of T/D ratio on both yield stress and flow stress using ultra-thin brass sheets, which emphasises on the modification in conventional constitutive equations when applied for ultra-thin sheets. Raulea et al. [19] conducted a series of uniaxial tensile tests to identify variation in the yield and tension strength when polycrystalline and single crystal aluminium sheets were adopted respectively, as well as a sequence of blanking experiments to analyse the variation in product shape and process force for both cases.
In such an engineering problem, forward slip can be considered as a dependent variable, which typical value changes for when any one of the independent variables, i.e., process and material parameters, is altered. To estimate the relationships between these variables, regression analysis can be carried out to explore the forms of these relationships, and this methodology has been applied in a wide variety of prediction and forecasting situations [20]. For instance, Vorkov et al. [21] employed multiple linear regression with workpiece and tooling dimensions as the independent variables to deliver the prediction of contact points position between the punch and the workpiece in large radius air bending using high-strength steels. Schmid et al. [22] predicted both major and minor strains based on ultimate elongation and thickness of the material by linear regression so as to further determine the whole forming limit curve geometry by performing the interpolation. Strano and Colosimo [23] also conducted the empirical determination of forming limit diagram in sheet metal processes utilising logistic regression model, which allowed the deduction of the probability of failure as a function of both the principal planar strains by taking into account both the failed and safe experimental data points in the analysis. Additionally, Hubbard et al. [24] established a two-parameter Weibull regression model to estimate strain intensity in different strain modes using surface roughness data, which suggested the critical strain localisation and/or failure, as well as the active deformation mechanisms in sheet metal forming of aluminium alloy 5754.
Moreover, flexible rolling technology has been devised by Kopp et al. [25,26] to meet the increasing demand for lightweight structures in the automotive industry, which alters the roll gap during the rolling passes to obtain the part with varied thickness distribution along its length direction as per the load requirements at respective locations. Liu et al. [27,28] also utilised finite element method to analyse the influences of process parameters, such as reduction, friction coefficient and workpiece horizontal velocity on the rolling force, forward slip and workpiece thickness profile so as to advance the numerical investigation of flexible rolling. Therefore, the conventional strip marking method cannot be simply applied to determine the forward slip in this newly developed technique as rolling phase may change prior to one circumferential rotation of the roll; alternatively, two parallel ridges have been conceived to ensure that two line markings fall within either thickness transition zone or rolling phase with an invariable thickness, so that the forward slip can be evaluated effectively by comparing the distances between the pairs of markings and ridges with respect to each rolling phase.
In this context, both analytical and numerical methods are utilised to determine the forward slip of thin strips, which occurs within the thickness transition area during micro flexible rolling. The novel finite element model developed based on strip marking method is capable of producing numerical estimates of forward slip of mimicked aluminium alloy 5052 strips in an efficient and accurate manner as compared with theoretical estimates obtained from the mathematical model. The variation of forward slip in response to the variations in different process variables, such as reduction, rolling speed, estimated friction coefficient and the T/D ratio is identified with a qualitative evaluation of the scatter centred around it, which is due to the anisotropic nature of individual grains constructed using 3D Voronoi tessellation technique. The relative slip between the strip and the roll caused by the relocation of a neutral point outside the roll bite is also discovered during the rolling phase with thinner thickness, together with an estimated friction coefficient of 0.08 or T/D ratio of 2. Furthermore, the multilinear regression analysis followed by correlation and error estimations has been employed to derive an equation model so as to generate reasonably accurate forecasts of forward slip of thin aluminium alloy 5052 strips within the thickness transition zone in micro flexible rolling with different process parameters. At last, analysis of variance is utilised to assess the significance of each process parameter and quantify their respective contributions to the forward slip.
2. Analytical Modelling of Forward Slip in Micro Flexible Rolling
2.1. Determination of Neutral Angle
Figure 1 depicts the forces acting on a unit width of the workpiece during the micro flexible rolling phases to form transition zones with thicker and thinner thicknesses, respectively, wherein the work rolls are assumed not to sustain any elastic deformation. This study is focusing on force analysis within thickness transition zones, which represent the main characteristics in flexible rolling. Therefore, Figure 1a,b just compare forces that act on the unit width of the workpiece during micro flexible rolling phases to form the transition zones with thicker and thinner thicknesses, respectively, while rolling phase with an invariable thickness is not considered in the current study, as it is the same as the flat rolling process.
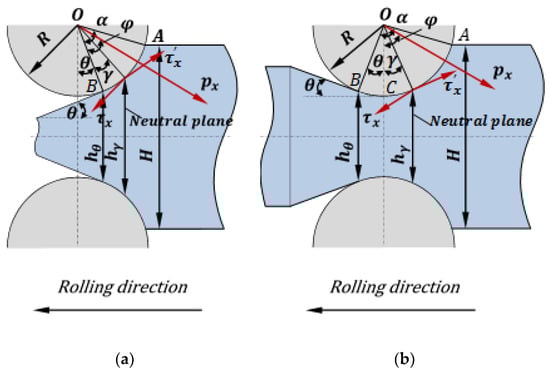
Figure 1.
Forces acting on the unit width of the workpiece within thickness transition zones: (a) Rolling phase to form transition zone with thicker thickness; and (b) rolling phase to form transition zone with a thinner thickness (for the deformation area below arc AC) [32].
The neutral angle can be determined by considering the horizontal forces acting on the workpiece of unit width, as well as neglecting the lateral spreading in the deformation zone. This is because according to [29], the rolling process can be treated as a two-dimensional deformation when the workpiece has a very large width compared with its thickness; this suits our case so that we have neglected the lateral deformation of the material.
According to [30,31], the following equations can be obtained by solving the horizontal forces on the unit width of the workpiece in equilibrium.
For the rolling phase with thicker thickness,
where x refers to the horizontal axis of the two-dimensional figure in Cartesian coordinates, is the radial pressure, and are the tangential pressures in the forward and backward slip zones, respectively, R is the roll radius, φ is the arc at arbitrary contact point and H denotes the initial strip thickness. As can be seen from Figure 1, point C is the intersection of the circular arc of the upper roll and the central line of the rolls. Thus, tangential pressures are not perpendicular to OC, but directed tangent to the circular arc at which the neutral plane meets.
Suppose (1) stress is uniformly distributed along the arc of contact between the rolls and the rolled workpiece, namely is regarded as a constant, and (2) friction coefficient µ remains invariable along the arc of contact and friction between the rolls and the workpiece obeys the Coulomb’s law given by [32]. Then upon integration and rearrangement, Equation (1) yields the following,
where α is the angle of bite, θ is the tilt angle for thickness transition area, γ is the arc at the neutral plane and µ defines the estimated friction coefficient along the arc of contact.
For the rolling phase with thinner thickness,
After integration and rearrangement, this equation becomes,
2.2. Determination of Forward Slip
It is postulated that the volume rates of material flow are the same at the exit of the roll bite and the neutral plane. Thus, there exists the relationship,
where , are the horizontal velocities and , are the thicknesses of the workpiece at the exit and the neutral plane, respectively.
Using
and
The following equation can be obtained,
where D is the roll diameter, while v is the circumferential velocity of the roll.
Then the forward slip can be calculated by,
3. Numerical Estimation of Forward Slip in Micro Flexible Rolling Based on Strip Marking Method
In most finite element simulations of sheet material forming processes, constitutive modelling plays a significant role in determining the stress and strain distributions, as well as their variation with respect to different locations in the formed part, which includes the mechanical behaviour of the material, yield criterion, hardening rule, flow rule and so forth [33,34]. In the current engineering application of micro flexible rolling, the material is assumed to be elastoplastic and undergo isotropic hardening after it yields according to von Mises criterion, the flow rule being modelled by Levy-Mises with normality condition. Moreover, this problem can be considered as plane-strain state as the workpiece is assumed to be very wide compared with its thickness [29].
A half symmetry 3D finite element model has been developed in ABAQUS/CAE (also known as Complete Abaqus Environment, which is a backronym with a root in Computer-Aided Engineering) to numerically estimate the forward slip in micro flexible rolling in accordance with the strip marking method, as displayed in Figure 2. The roll was simplified as a rigid cylindrical shell in order to eliminate its elastic deflection and save computational resources, and a finer mesh was assigned to the strip than that for the roll so that the bumped ridges on the roll would leave an image on the strip, rather than penetrating into it after the simulation process was completed [35]. Then the average forward slip may be worked out by Equation (10) [10],
where l’ and l are the distances between the pairs of markings and ridges, respectively.
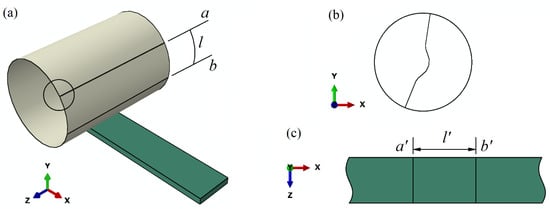
Figure 2.
Schematic of strip marking method for numerical estimation of forward slip in micro flexible rolling: (a) Finite element analysis model with two parallel ridges running axially along roll surface; (b) enlarged profile view of the ridge; and (c) rolled strip with two line markings indented by the ridges.
As this study intends to reveal the variation of forward slip in the thickness transition area when process variables like reduction, rolling speed, friction coefficient, as well as the ratio of strip thickness to grain size change, a frictional interface has been defined between the outer surface of the roll and the top surface of the strip, and the 3D Voronoi tessellation has also been applied in the strip to mimic the polycrystalline structure of the material to be rolled.
The rolling speed is a process parameter in our work, while the numerical model has been set to contain general, static analysis steps, namely initial contact, one type of reduction, thickness transition and another type of reduction. The boundary conditions for different analysis steps are listed in Table 1, where RP refers to the geometric centre of the roll, s refers to the bottom surface of the workpiece, vx, vy and vz are the velocity components in directions x, y and z, respectively, ωx, ωy and ωz are the angular velocity components of the roll rotating around the axes x, y and z, respectively, Δh is the reduction amount, d is the diameter of the roll and lc is the length of the zone of contact between the roll and the workpiece [36].

Table 1.
Boundary conditions for different analysis steps.
The bilinear isotropic hardening material model was selected for the workpiece in which the basic material data were referred to Reference [37], namely aluminium alloy 5052 with Young’s modulus E of 70 GPa, initial yield stress σs0 of 195 MPa and tangent modulus ETAN of 292 MPa; however, different heterogeneity coefficients have been employed to alter the tangent modulus to obtain different types of mechanical properties. Figure 3a presents seven types of mechanical properties distinguished by dissimilar heterogeneity coefficients, which have been assigned to Voronoi polyhedrons to substantially reflect the inhomogeneity of individual grains that constitute the strip, as exhibited in Figure 3b. Note that ξ, ETAN and σs0 in Figure 3a denote heterogeneity coefficient, tangent modulus and initial yield stress for the selected material, respectively.
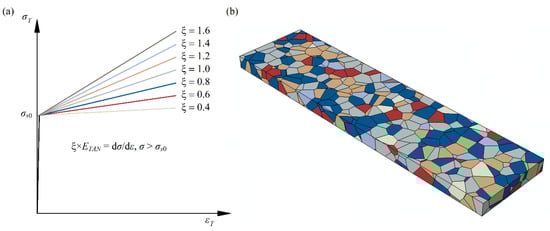
Figure 3.
Voronoi tessellation-based 3D construction of the strip with consideration of grained inhomogeneity: (a) Bilinear stress-strain curves with different tangent moduli governed by corresponding heterogeneity coefficient; and (b) mimicked microstructure of the strip where grains are equipped with various mechanical properties.
According to [35], the concise instructions to create a Voronoi tessellated strip and subsequently associate its internal grains with a variety of properties are as follows:
- (1)
- The strip is divided into several unit cubes, each containing a single nucleus.
- (2)
- The 3D Voronoi function in computational software MATLAB is in use to create Voronoi polyhedrons that take those nuclei as their mass centres.
- (3)
- Different types of mechanical properties are assigned to the Voronoi polyhedrons by means of MATLAB code to reflect the grained inhomogeneity in a real material.
- (4)
- MATLAB finally generates a Python file containing all the geometrical and topological information of the generated Voronoi tessellation together with property attribution of each individual polyhedron.
- (5)
- The Python script is imported to ABAQUS/CAE to complete the setup of grain aggregate with a range of mechanical properties.
The strip was meshed with 10-node modified quadratic tetrahedron elements (C3D10M) with a fine mesh size of 0.04 mm to ensure a good convergence, as well as improving the mesh quality near grain boundaries, whilst the roll was coarsely meshed with 4-node 3D bilinear rigid quadrilateral elements (R3D4) by utilising mesh size of 0.16 mm in such a way as to prevent the nodes on the roll surface from penetrating into the workpiece [35,38].
In general, the optimised model setting includes the simplification of the roll as a rigid cylindrical surface and the determination of mesh sizes for both roll and strip, in order to reduce the model complexity, save the computational time and boost both computational accuracy and efficiency.
4. Results and Discussion
Figure 4 presents the micro flexible rolled strip with a reduction of 20% to 50%, wherein red dots indicate the locations of the marks transferred from the roll within the thickness transition area. Furthermore, the strip was rolled at a speed of 20 cm/min and under dry friction (with an equivalent friction coefficient of 0.13 [38]), and both initial strip thickness and average grain size were set as 250 µm, which gives the T/D ratio of 1 for this case. In the current study grain size of 250 µm has been used, due to two main reasons, whereof one is that three types of T/D ratio can be considered, which means the scattering effect resulted from the difference between properties of single grains can be evaluated and compared when approximately one (T/D ratio is less than or equal to 1) or two layers of grains (T/D ratio is equal to 2) constitute the strip; and the other is that a bigger grain size is helpful to lessen the computation time for creating the Voronoi tessellation and performing the simulation tasks, while the grained inhomogeneity which is a key factor leading to scattering effect can still be reflected in spite of a large grain size.
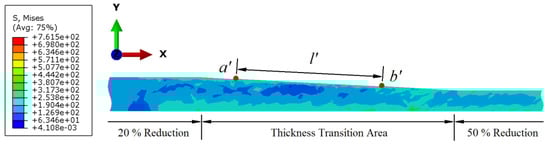
Figure 4.
Profile of the micro flexible rolled sample with a reduction of 20% to 50%.
It is clear from Figure 4 that the effective stress distribution on the profile exhibits a highly non-uniform pattern because of the coexistence of both elastic and plastic states of stress in the inhomogeneous granular material subjected to the applied rolling force [39].
Based on Equations (4) and (9), the theoretical value of the forward slip in this case is equal to 2.94%, whereas the numerical estimate turns out to be 3.16% (averaged result from three repeated trials to improve the accuracy of length measurement after rolling) in accordance with Equation (10), which error is 7.48% with respect to the theoretical estimate and can be calculated as follows:
As the developed finite element model is capable of evaluating the forward slip by simple calculations with measurements which produce a reasonable level of accuracy, it is utilised to identify how different process parameters affect the forward slip within the thickness transition area in micro flexible rolling.
4.1. Effect of Reduction
Reduction combinations of 20% to 40%, 20% to 45%, and 20% to 50% have been selected for the rolling phase with thinner thickness, and likewise, 50% to 30%, 50% to 25%, and 50% to 20% for the rolling phase with thicker thickness by maintaining the length of thickness transition area, but altering the tilt angle θ. Figure 5 represents the relationship between the forward slip and the reduction for the rolling phase with thinner thickness. It is evident that the forward slip increases as the reduction increases, due to the fact that the increasing reduction gives rise to the increase in the displacement volume in the thickness direction, which consequently leads to the growth of material flow in the rolling direction, and thus, the increase in forward slip [40].
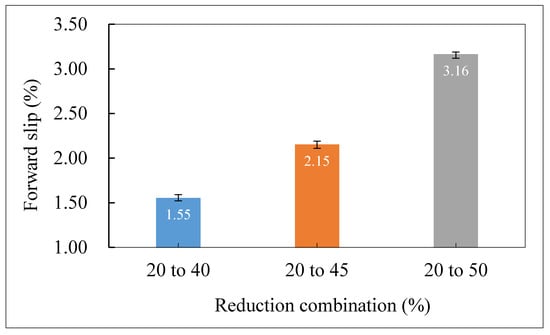
Figure 5.
Forward slip versus reduction for the rolling phase with thinner thickness.
In Figure 6, the reduction combination is located on the abscissa, while the forward slip is given on the ordinate for the rolling phase with thicker thickness. As can be seen, the forward slip undergoes a decline because of progressively reduced material flow in the rolling direction with the decreasing reduction. Compared with Figure 5, forward slip in this stage presents generally higher values probably because the reduction starts with a greater value of 50%, which introduces a larger amount of forward slip at the beginning of this stage. Moreover, the scatter of average forward slip has been noted for each reduction combination in Figure 5 and Figure 6. This being the case the strip comprises of approximately a single layer of grains; consequently, the property of each individual grain has a prominent effect on the overall deformation of the whole strip, which results in the scatter effect of forward slip with respect to different grain compositions.
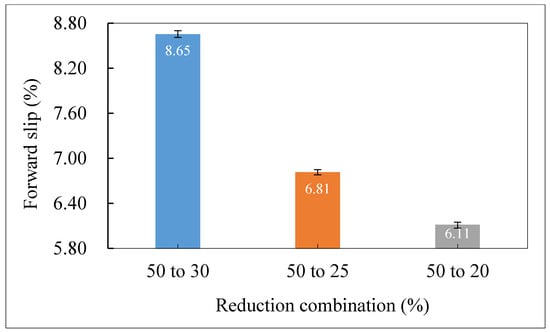
Figure 6.
Forward slip versus reduction for the rolling phase with thicker thickness.
4.2. Effect of Rolling Speed
The effects of rolling speed on forward slip are depicted in Figure 7 and Figure 8 for the rolling phases with reduction combinations of 20% to 50% and 50% to 20%, respectively, wherein the friction coefficient is 0.13 and T/D ratio remains 1 for all cases.
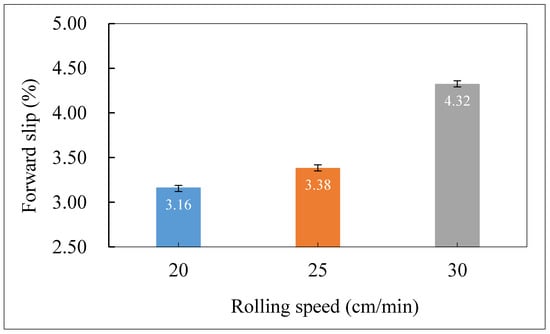
Figure 7.
Variation of forward slip with rolling speed for the rolling phase with thinner thickness.
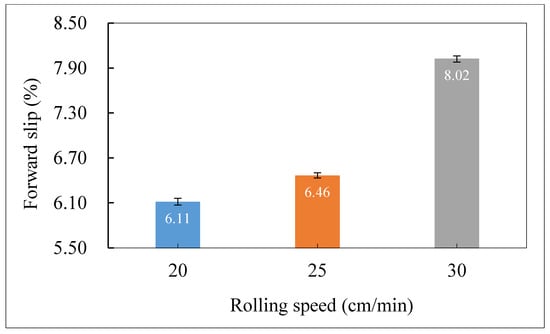
Figure 8.
Variation of forward slip with rolling speed for the rolling phase with thicker thickness.
As can be noticed in both figures that the increase in rolling speed can lead to the increase in forward slip, regardless of the rolling phase with thinner or thicker thickness, which is primarily due to the fact that a higher rolling speed results in a larger residual friction force regarding a constant friction coefficient in the stable rolling stage, which, therefore, speeds up the plastic flow of the material in the rolling direction, causing an increase in forward slip eventually [40]. Furthermore, the scatter effect of forward slip resulted from the inhomogeneous microstructure throughout the strip has also been observed, whereof the average value varies from 6.11% to 8.02% for the rolling phase starting with a bigger reduction of 50% as the rolling speed increases from 20 to 30 cm/min (Figure 8). This change is generally greater than that of 3.16% to 4.32% for the rolling phase starting with a smaller reduction of 20% (Figure 7), which indicates once again that the reduction affects the forward slip in a significant manner.
4.3. Effect of Estimated Friction Coefficient
To examine how lubrication condition affects the forward slip in micro flexible rolling four types of estimated friction coefficients have been selected to represent dry friction (with estimated friction coefficients of 0.13, 0.18, and 0.23, respectively) and rolling with lubrication (with estimated friction coefficient of 0.08) in accordance with previous investigations conducted by Qu et al. [36,38]. In this section, all cases were performed with rolling speed of 20 cm/min and T/D ratio of 1.
As can be seen in Figure 9, the average value of forward slip has undergone an overall decline from 7.86% to −3.42% as the estimated friction coefficient decreases from 0.23 to 0.08, and where this fact can be explained by the reduced residual friction force owing to the decrease in estimated friction coefficient, which brings a continued drop in forward slip, provided all other variables remain unchanged [40]. It is also quite noticeable that the forward slip experiences a significant decrease or can even be thought of as reversing from positive value of 3.16% to negative value of −3.42% when the mimicked condition varies from dry rolling to that with the presence of lubricant; this phenomenon occurs because the neutral point has taken relocation outside the roll bite, which means the strip sliding takes place to a certain extent even though it succeeds to feed in the roll bite.
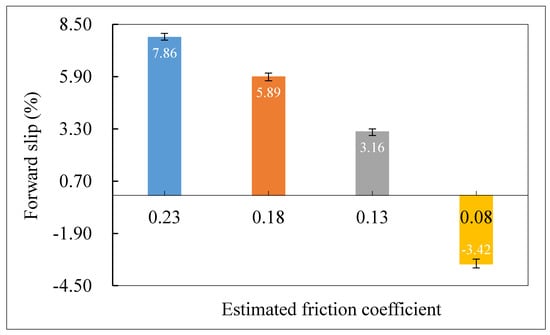
Figure 9.
Dependence of forward slip on estimated friction coefficient for the rolling phase with thinner thickness.
For the rolling phase with reduction of 50% to 20% (Figure 10), the forward slip displays an almost identical downward trend, but stays positive, indicating that the strip sliding no longer exists during the rolling phase with thicker thickness in spite of the low friction coefficient of 0.08 reached. As is also found through comparison of Figure 9 and Figure 10, the forward slip starts to decline from similarly high levels of 7.86% and 9.01%, respectively, which reveals that the contribution of high friction coefficient to forward slip overwhelms that of increased reduction.
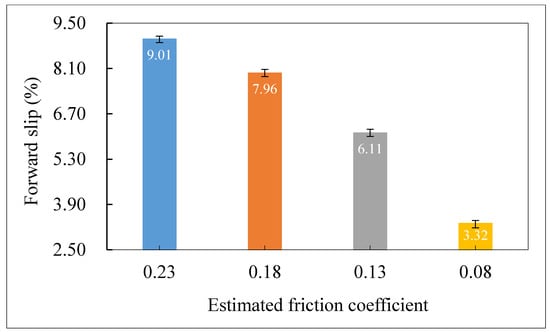
Figure 10.
Dependence of forward slip on estimated friction coefficient for the rolling phase with thicker thickness.
4.4. Effect of Initial Strip Thickness (or T/D Ratio)
Figure 11 and Figure 12 exhibits the tendency of forward slip to decrease with increasing initial strip thickness, but with a constant rolling speed of 20 cm/min and friction coefficient of 0.13 for the rolling phases with thinner (reduction of 20% to 50%) and thicker (reduction of 50% to 20%) thicknesses, respectively. Firstly, as is clearly seen in Figure 11 that the increasing initial strip thickness has driven a drastic decline in the forward slip of 3.16% to −6.89%, wherein the negative value indicates that the neutral point has moved outside the roll bite again for a larger initial strip thickness of 500 µm during the rolling phase with thinner thickness; the strip keeps feeding in the roll bite, along with a certain amount of sliding though.
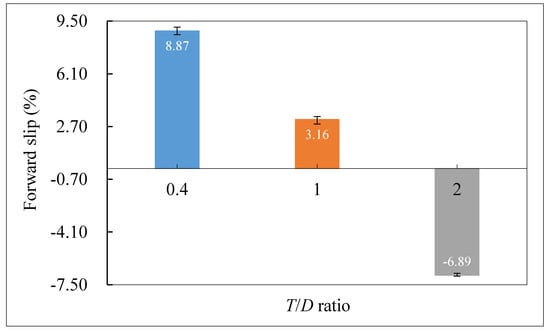
Figure 11.
Tendency of forward slip with T/D ratio for the rolling phase with thinner thickness.
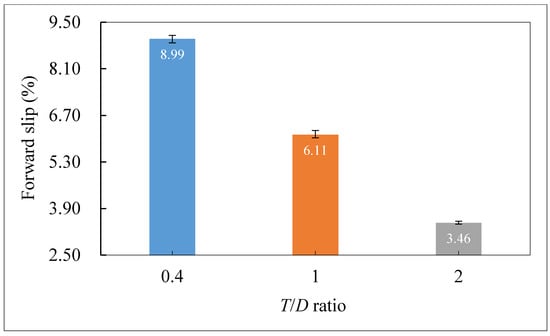
Figure 12.
Tendency of forward slip with T/D ratio for the rolling phase with thicker thickness.
While in the case with thicker thickness, as illustrated in Figure 12, there is a progressive and approximate linear decrease in forward slip from 8.99% to 3.46% as initial strip thickness increases from 100 to 500 µm during this rolling phase without strip sliding; the primary reason for the observed trends is that the elongation of the material in the rolling direction decreases with increasing strip thickness, which is equivalent to decreasing the reduction that reduces the material flow along rolling direction, and the forward slip is then declined as a result [41]. In addition, a smaller initial strip thickness exerts a greater influence on the forward slip than that of the reduction, since it reaches quite close values of 8.87 and 8.99 for the rolling phases with thinner and thicker thickness, respectively, no matter whether the reduction starts at 20% or 50% in relation to the initial strip thickness of 100 µm.
Another noticeable finding observed from both Figure 11 and Figure 12 is that the scatter of average forward slip is smaller at the initial strip thickness of 500 µm than that for both smaller strip thicknesses of 100 and 250 µm, which is attributable to approximately two layers of grains dispersed in the thicker strip of 500 µm (with respect to the average grain size of 250 µm, namely the T/D ratio reaches 2), weakening the effect of each single grain and leading to a more uniform deformation within the material, as compared with the other two types of thinner strips (with T/D ratio less than or equal to 1) that produce larger discrepancies across simulation results.
4.5. Development of Prediction Model for forward Slip in Micro Flexible Rolling Based on Regression Analysis
The multilinear regression analysis is a powerful technique for establishing a statistical model to predict the unknown value of a dependent variable from the known values of a set of independent variables in a quantitative manner [35]. In the present study, the forward slip is taken as the dependent variable y that is influenced by four types of process parameters taken as the independent variables x1–x4, to wit, reduction, rolling speed, estimated friction coefficient and the ratio of initial strip thickness to average grain size, respectively.
According to [35,42], the multilinear regression prediction model can be constructed as follows:
where n is the number of observations, is the intercept term, namely the predicted value of the dependent variable when all of the independent variables xi1–xi4 is equal to zero, are the regression coefficients estimated by least-squares method and ei is the difference between the observed value yi and predicted value , which is normally distributed with mean 0 and variance σ, i.e., , and where σ can be calculated as,
where p is used for the number of independent variables.
In a regression model, the effects of lower-order terms become conditional ones, not main effects by adding interaction terms, which means that the effect of one variable is conditional on the value of the other and it goes into full effect only when the other term in the interaction equals 0. Therefore, the interaction terms have not been taken into account in the current regression prediction model so as to make quantitative estimation of the main effects of reduction, rolling speed, estimated friction coefficient and T/D ratio on forward slip, respectively, since the value changes of these process parameters are independent of each other.
In order to maintain the integrity of data, simulation results from both cases with thinner and thicker thicknesses have been utilised jointly to establish one single model, wherein input variable x1, viz. reduction, takes positive sign for the case with thinner thickness and negative for the other one. Thus, based upon 60 groups of values of independent and dependent variables, the regression model can be written in the following form,
Equation (14) gives the quantitative definition of the prediction model of forward slip as a function of independent variables. For instance, the first observation of values of x11–x14 is 0.2, 20, 0.13 and 1, respectively, and the difference ε1 is −1.328 obtained from the prediction model. By substituting the values of x11–x14 and ε1 into Equation (14), the predicted forward slip is calculated to be 2.848%. This procedure can be applied to predict the forward slip for the other observations of values of x11–x14.
Moreover, the fitted regression model has also been validated by evaluating the strength of the relationship between the simulated and predicted values of forward slip under different process conditions, as well as assessing its prediction reliability in terms of Pearson correlation coefficient (r) and root mean square error (RMSE), which are defined according to [43,44], as,
where N is the number of paired data, y is the simulated forward slip, is the predicted forward slip, and are the mean values of y and , respectively. In accordance with Ref. [45], the relationship between two groups of data can be considered strong, provided that their r value is greater than 0.7; therefore, as is noted from Figure 13 that a good correlation with r of 0.9106 exists between the simulated and predicted data. Furthermore, the equation between simulated and predicted forward slip can be written based on the fitting of the data plotted in Figure 13, as follows:
y = 0.8205x + 0.8586.
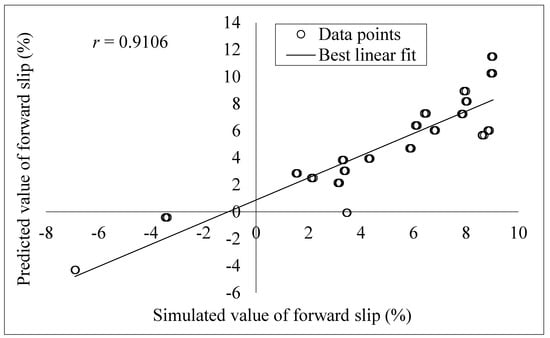
Figure 13.
Correlation between the simulated and predicted values of forward slip under different process conditions.
In addition, the root mean square error was calculated to be 1.7383, which indicates that the developed regression model has reasonable capability and accuracy in predicting the forward slip during micro flexible rolling of aluminium alloy 5052 strips with regard to a range of reduction combinations, rolling speeds, friction coefficients and T/D ratios.
Finally, in order to investigate the magnitudes of each process parameter affecting forward slip, variance analysis has been carried out in accordance with [38], and the results are listed in Table 2.
Table 2.
Variance analysis for identification of significance of each variable.
S, df and V in Table 2 denote the sum of squared deviation, degree of freedom and variance, respectively, and F value is the ratio of variance of each variable to that of the error (e) between the simulated and predicted forward slip which is 3.296 in the present study. According to the size of F value, the ratio of strip thickness to grain size is believed to be the factor that has the most significant influence on forward slip.
Based on the value of Contribution in Table 2 which is defined as the ratio of sum of squared deviation for each factor to the total sum of squared deviation, the ratio of strip thickness to grain size is ranked first among the four process parameters, with most contribution of 33.26% to the forward slip, which is followed by the reduction with its contribution of 25.82%. The next influential parameter is the estimated friction coefficient with the contribution of 22.93%, while the rolling speed has little significant influence on the forward slip with the contribution of only 1.24%.
5. Conclusions
This study aims to identify the influence of process parameters on forward slip within thickness transition zone in micro flexible rolling of submillimetre thick strips based on the finite element method, through which numerical estimations of forward slip for a range of process conditions can be obtained in an intuitive and accurate manner as compared with theoretical calculations. A summary of the main points in the present study is presented as follows:
- In view of the force equilibrium condition, as well as the material flow characteristics within the roll bite, the 2D analytical models are established to determine the neutral angle and consequently the forward slip of the thin workpiece during micro flexible rolling phases with thicker and thinner thicknesses, respectively; the theoretical results obtained from mathematical models indicate that an increase of reduction, rolling speed or estimated friction coefficient leads to an increase of the forward slip, while a larger initial strip thickness suggests a smaller value of it.
- In order to provide a more intuitive and practical evaluation of forward slip, a novel 3D finite element model with bumped ridges on the roll is created based upon strip marking method to mimic the rolled strip with two line markings indented by the ridges within the thickness transition zone; meantime, the 3D Voronoi tessellation polyhedrons equipped with different mechanical properties are employed to represent the inhomogeneous grain structure in the material, through which the qualitative and quantitative estimation of the microstructural effect on the forward slip can be conducted in terms of the ratio of strip thickness to grain size, namely that the forward slip decreases as the initial strip thickness increases with regard to a constant average grain size within thickness transition zones; however, for the rolling phase with thinner thickness, the forward slip shows a negative value of −6.89% when the T/D ratio is 2, which suggests a relative sliding between the strip and the roll.
- Numerical simulations are performed with regard to the mechanical properties of aluminium alloy 5052, whereof the results are found to have reasonable accuracy by comparison with the theoretical estimates, viz. that the difference between the numerical and theoretical results ranges from 5.95% to 10.92% among all cases, which reveals that the newly developed finite element model is suitable to analyse the forward slip and its influential factors respecting the thickness transition area in micro flexible rolling.
- The variation of simulated forward slip in response to the variations in process parameters is in reasonable agreement with theoretical results, to wit, that for either rolling phase with thinner or thicker thickness, the forward slip generally exhibits an increasing trend along with increased reduction, rolling speed or estimated friction coefficient, whereas it shows a decrease in response to rising T/D ratio; nevertheless, negative values of forward slip are observed for cases with estimated friction coefficient of 0.08 and T/D ratio of 2, respectively, during the rolling phase with thinner thickness, namely that the neutral point no longer resides within the roll bite, and the relative sliding between the strip and roll is incurred under these conditions.
- The scatter effect of forward slip is qualitatively assessed taking advantage of 3D Voronoi modelling which highlights the heterogeneous nature of the material, viz. that each individual grain contributes more to the macro deformation of a thinner strip consisting of fewer grains, leading to a larger scatter of material flow in the rolling direction and consequently a bigger difference during determination of forward slip in the thickness transition zone, and vice versa.
- A multilinear regression prediction model is constructed based on simulation results obtained from both cases with thinner and thicker thicknesses, which is afterwards validated through both correlation and error analyses, since a good correlation with r of 0.9106 exists between the simulated and predicted data, and the root mean square error is estimated to be 1.7383; the developed statistical model displays reasonable capability and accuracy, and can, therefore, be utilised to reasonably predict the forward slip of thin aluminium alloy 5052 strips under various process conditions during micro flexible rolling phase with a variable strip thickness.
- According to the analysis of variance, the ratio of strip thickness to grain size is regarded to be the most significant factor with its contribution of 33.26% to the forward slip, which is followed by the reduction with the contribution of 25.82% and the estimated friction coefficient with that of 22.93%, whilst the rolling speed hardly significantly influences the forward slip with the contribution of only 1.24%.
Author Contributions
F.Q.: Conceptualization, Formal analysis, Investigation, Methodology, Validation, Writing—original draft; J.X.: Supervision, Writing—review and editing; Z.J.: Funding acquisition, Project administration, Supervision, Writing—review and editing.
Funding
This study received grants from the Australian Research Council (FT120100432, DP190100738) and National Natural Science Foundation of China under Grant No. 51474127.
Acknowledgments
The authors would like to express their sincere appreciation to the University of Wollongong, Australian Research Council (FT120100432, DP190100738) and National Natural Science Foundation of China under Grant No. 51474127 for their support to this study.
Conflicts of Interest
The authors declare that there is no conflict of interests.
References
- Hot and cold rolled strips in aluminium for industrial applications. Available online: https://aludium.com/industrial-strips/ (accessed on 13 August 2019).
- Common uses for cold rolled strip steel. Available online: https://www.meadmetals.com/blog/common-uses-for-cold-rolled-strip-steel (accessed on 13 August 2019).
- Jiang, Z.Y.; Wei, D.; Tieu, A.K. Analysis of cold rolling of ultra thin strip. J. Mater. Process. Technol. 2009, 209, 4584–4589. [Google Scholar] [CrossRef]
- Jiang, Z.Y.; Zhu, H.T.; Tieu, A.K. Mechanics of roll edge contact in cold rolling of thin strip. Int. J. Mech. Sci. 2006, 48, 697–706. [Google Scholar] [CrossRef]
- Xie, H.B.; Jiang, Z.Y.; Yuen, W.Y.D. Analysis of friction and surface roughness effects on edge crack evolution of thin strip during cold rolling. Tribol. Int. 2011, 44, 971–979. [Google Scholar] [CrossRef]
- Jiang, Z.Y.; Xiong, S.W.; Tieu, A.K.; Wang, Q.J. Modelling of the effect of friction on cold strip rolling. J. Mater. Process. Technol. 2008, 201, 85–90. [Google Scholar] [CrossRef]
- Jiang, Z.Y.; Tieu, A.K. Elastic-plastic finite element method simulation of thin strip with tension in cold rolling. J. Mater. Process. Technol. 2002, 130–131, 511–515. [Google Scholar] [CrossRef]
- Li, E.B.; Tieu, A.K.; Yuen, W.Y.D. Forward slip measurements in cold rolling by laser Doppler velocimetry: Uncertainty analysis and accuracy improvement. J. Mater. Process. Technol. 2003, 133, 348–352. [Google Scholar] [CrossRef]
- Wang, Q.Y.; Zhu, Y.; Zhao, Y. Friction and forward slip in high-speed cold rolling process of aluminum alloys. Appl. Mech. Mater. 2012, 229–231, 361–364. [Google Scholar] [CrossRef]
- Liu, Y.J. Friction at Strip-Roll Interface in Cold Rolling. Ph.D. Thesis, University of Wollongong, Wollongong, Australia, 2002. [Google Scholar]
- Vini, M.H.; Farhadipour, P. Analytical modified model of cold rolling process and investigation of the effect of work roll flattening on the rolling force. J. Mod. Process. Manuf. Prod. 2017, 6, 5–13. [Google Scholar]
- Pawelski, H. An analytical model for dependence of force and forward slip on speed in cold rolling. Steel Res. 2003, 74, 293–299. [Google Scholar] [CrossRef]
- Bayoumi, L.S. A kinematic analytical approach to predict roll force, rolling torque and forward slip in thin hot strip continuous rolling. Ironmak. Steelmak. 2007, 34, 444–448. [Google Scholar] [CrossRef]
- Tieu, A.K.; Jiang, Z.Y.; Lu, C.; Kosasih, B. Friction and asperity contact in strip rolling. In Proceedings of the 3rd Symposium on Advanced Structural Steels and New Rolling Technologies, Shenyang, China, 3–6 November 2005; pp. 49–64. [Google Scholar]
- Yuen, W.Y.D. Determination of friction from measured forward slip and its applications in hot strip rolling. In Proceedings of the First Australasian Congress on Applied Mechanics, Melbourne, Australia, 21–23 February 1996; pp. 927–932. [Google Scholar]
- Fang, Z.; Jiang, Z.; Wang, X.; Zhou, C.; Wei, D.; Liu, X. Grain size effect of thickness/average grain size on mechanical behaviour, fracture mechanism and constitutive model for phosphor bronze foil. Int. J. Adv. Manuf. Technol. 2015, 79, 1905–1914. [Google Scholar] [CrossRef]
- Lee, R.S.; Chen, C.H.; Gau, J.T. Effect of thickness to grain size ratio on drawability for micro deep drawing of AISI 304 stainless steel. In Proceedings of the Ninth International Conference on the Technology of Plasticity, Gyeongju, Korea, 7–11 September 2008; pp. 7–11. [Google Scholar]
- Ananda, D.; Kumar, D.R. Effect of thickness and grain size on flow stress of very thin brass sheets. Procedia Mater. Sci. 2014, 6, 154–160. [Google Scholar] [CrossRef]
- Raulea, L.V.; Goijaerts, A.M.; Govaert, L.E.; Baaijens, F.P.T. Size effects in the processing of thin metal sheets. J. Mater. Process. Technol. 2001, 115, 44–48. [Google Scholar] [CrossRef]
- Regression analysis. Available online: https://en.wikipedia.org/wiki/Regression_analysis (accessed on 27 July 2018).
- Vorkov, V.; Aerens, R.; Vandepitte, D.; Duflou, J.R. Two regression approaches for prediction of large radius air bending. Int. J. Mater. Form. 2019, 12, 379–390. [Google Scholar] [CrossRef]
- Schmid, M.; Hackl, B.; Pauli, H.; Grünsteidl, A. A linear regression model to predict FLCs from tensile test data and sheet thickness. In Proceedings of the 5th Forming Technology Forum, Zurich, Switzerland, 5–6 June 2012; pp. 57–62. [Google Scholar]
- Strano, M.; Colosimo, B.M. Logistic regression analysis for experimental determination of forming limit diagrams. Int. J. Mach. Tools Manuf. 2006, 46, 673–682. [Google Scholar] [CrossRef]
- Hubbard, J.B.; Stoudt, M.R.; Possolo, A.M. Topographic analysis and Weibull regression for prediction of strain localisation in an automotive aluminium alloy. Mater. Sci. Technol. 2011, 27, 1206–1212. [Google Scholar] [CrossRef]
- Kopp, R.; Böhlke, P.; Hohmeier, P.; Wiedner, C. Metal forming of lightweight structures. In Proceedings of the Fifth ESAFORM Conference, Kraków, Poland, 14–17 April 2002; pp. 13–22. [Google Scholar]
- Kopp, R.; Wiedner, C.; Meyer, A. Flexibly rolled sheet metal and its use in sheet metal forming. Adv. Mater. Res. 2005, 6–8, 81–92. [Google Scholar] [CrossRef]
- Liu, X.H. Prospects for variable gauge rolling: Technology, theory and application. J. Iron Steel Res. Int. 2011, 18, 1–7. [Google Scholar] [CrossRef]
- Zhang, G.J.; Liu, X.H.; Hu, X.L.; Zhi, Y. Horizontal velocity of variable gauge rolling: Theory and finite elements simulation. J. Iron Steel Res. Int. 2013, 20, 10–16. [Google Scholar] [CrossRef]
- Prakash, R.S.; Dixit, P.M.; Lal, G.K. Steady-state plane-strain cold rolling of a strain-hardening material. J. Mater. Process. Technol. 1995, 52, 338–358. [Google Scholar] [CrossRef]
- Ginzburg, V.B.; Ballas, R. Flat Rolling Fundamentals; Marcel Dekker, Inc.: New York, NY, USA, 2000. [Google Scholar]
- Tarnovskii, I.Y.; Pozdeyev, A.A.; Lyashkov, V.B. Deformation of Metals during Rolling; Elsevier: Amsterdam, The Netherlands, 2013. [Google Scholar]
- Qu, F.J.; Jiang, Z.Y.; Wei, D.B.; Chen, Q.Q.; Lu, H.N. Study of micro flexible rolling based on grained inhomogeneity. Int. J. Mech. Sci. 2017, 123, 324–339. [Google Scholar] [CrossRef]
- Modeling of Sheet Metal—The “Known Unknowns”. Available online: http://formingworld.com/constitutive-modeling-of-sheet-metal-the-known-unknowns/ (accessed on 9 September 2019).
- Bhattacharyya, D. Composite Sheet Forming, 1st ed.; Elsevier: Amsterdam, The Netherlands, 1997. [Google Scholar]
- Qu, F.J.; Jiang, Z.Y.; Lu, H.N. Analysis of micro flexible rolling with consideration of material heterogeneity. Int. J. Mech. Sci. 2016, 105, 182–190. [Google Scholar] [CrossRef]
- Qu, F.J.; Xie, H.B.; Jiang, Z.Y. Finite element method analysis of surface roughness transfer in micro flexible rolling. MATEC Web Conf. 2016, 80, 04002. [Google Scholar] [CrossRef]
- Properties of aluminum alloy AA 5052. Available online: http://www.efunda.com/Materials/alloys/aluminum/show_aluminum.cfm?ID=AA_5052&show_prop=all&Page_Title=AA%205052 (accessed on 25 June 2018).
- Qu, F.J.; Jiang, Z.Y.; Xia, W.Z. Evaluation and optimisation of micro flexible rolling process parameters by orthogonal trial design. Int. J. Adv. Manuf. Technol. 2018, 95, 143–156. [Google Scholar] [CrossRef]
- Qu, F.J.; Jiang, Z.Y.; Wang, X.G.; Zhou, C.L. Analysis of springback behaviour in micro flexible rolling of crystalline materials. Adv. Mater. Sci. Eng. 2018, 2018, 5287945. [Google Scholar] [CrossRef]
- Wang, T.T.; Qi, K.M. Plastic Forming of Metals: Principles and Technology of Rolling, 2nd ed.; Metallurgical Industry Press: Beijing, China, 2001. [Google Scholar]
- The forward slip and backward slip in rolling process. Available online: https://wenku.baidu.com/view/a4324dbd65ce050876321350 (accessed on 9 July 2019).
- Multiple linear regression. Available online: http://www.stat.yale.edu/Courses/1997-98/101/linmult.htm (accessed on 12 July 2019).
- Pearson correlation coefficient. Available online: https://en.wikipedia.org/wiki/Pearson_correlation_coefficient (accessed on 29 July 2019).
- Samui, P.; Roy, S.S.; Balas, V.E. Handbook of Neural Computation, 1st ed.; Academic Press: London, UK, 2017. [Google Scholar]
- Moore, D.S.; Notz, W.I.; Fligner, M.A. The Basic Practice of Statistics, 6th ed.; W.H. Freeman: New York, NY, USA, 2013. [Google Scholar]
© 2019 by the authors. Licensee MDPI, Basel, Switzerland. This article is an open access article distributed under the terms and conditions of the Creative Commons Attribution (CC BY) license (http://creativecommons.org/licenses/by/4.0/).