Article

Surface Modification of Rusted Rebar and Enhanced Passivation/Anticorrosion Performance in Simulated Concrete Pore Solutions with Different Alkalinity

1
College of Mechanics and Materials, Hohai University, Nanjing 210098, China
2
Suqian Research Institute, Hohai University, Suqian 223800, China
3
Nantong Research Institute of Materials Engineering, Nanjing University, Nantong 226000, China
4
Dongying Zhubo Architectural Science and technology consulting center, Dongying 257000, China
5
School of Material Science and Engineering, Southeast University, Najing 211100, China
*
Authors to whom correspondence should be addressed.
Metals 2019, 9(10), 1050; https://doi.org/10.3390/met9101050
Submission received: 23 July 2019 / Revised: 11 September 2019 / Accepted: 20 September 2019 / Published: 27 September 2019

Abstract

:
Naturally exposed rusted rebar has been widely used for the production of reinforced concrete. However, rusted rebar is prone to corrosion under chloride ion (Cl) contamination and/or at a low alkalinity of concrete. This study employed two surface modification methods, sand blasting and wire brushing, to augment the corrosion resistance of naturally exposed rusted rebar. Electrochemical tests revealed that the surface-modified rebar displayed a significant improvement of passivation in the concrete alkaline environment and anticorrosion performance in both the Cl free and Cl-containing simulated concrete pore solutions of different alkalinity. The enhanced performance was mainly due to the elimination of the rust layer and the direct exposure of the fresh metallic surface to the alkaline medium. Moreover, the effect of surface nanograins on the intensified passive film led to the best passivation performance of the wire-brushed rebar. The overall findings demonstrate that the two developed methods were conducive to the passivation and anticorrosion performance of the rusted rebar and thereby hold great promise for improving the service life of the reinforced concrete structures.

1. Introduction

Rebar corrosion is a major cause of the deterioration of reinforced concrete structures (RCS). It has been known that rebar corrosion is mainly induced by chloride ion (Cl) erosion and carbonization-induced reduction of the concrete alkalinity [1,2,3,4,5]. They both adversely cause the localized or general dissolution of the passive film and subsequent corrosion propagation in the rebar substrate. The coverage concrete layer provides the alkaline environment for the passivation of rebar. However, the concrete pore structure, especially the concrete pore diameters, strictly affects the transmission of corrosive medium in the concrete layer, as well as the quality of concrete/rebar interface, which finally influences the passivation and corrosion of the rebar in the RCS structure [6]. Once the corrosive medium reaches the concrete/rebar interface and accumulates to a certain concentration, the breakdown of passivation and corrosion nucleation occurs to the rebar. Thus, improving the corrosion resistance of rebar holds the key to extending the service life of RCS [7,8,9,10]. It is generally believed that the passive film of the rebar is formed on its surface, while the corrosion of the rebar also initiates from the surface and gradually extends into the matrix [11,12,13,14]. Thus, the surface state of the rebar significantly affects its passivation and anticorrosion performance, especially under the contamination of Cl [15,16,17].
Extensive studies have examined the independent or collective effects of the Cl erosion and carbonation of concrete on rebar corrosion and the related RCS durability [7,8,18]. However, scant attention has been paid to the effect of the initial surface state of the rebar on its passivation and corrosion process in the concrete [19,20,21]. During the actual construction of RCS projects, a large amount of rebars are stored outdoors and thereby exposed directly to the wet environment. Therefore, it is quite common that rebars have suffered a varying degree of pre-rusting before they are embedded into the concrete. As a result, the pre-formed rust layer further influences the rebar corrosion and RCS durability. Unfortunately, in recent decades, no definitive conclusions about the influence of pre-rusting of rebar on the subsequent rebar corrosion and RCS durability have been reached, and some research results were even contradictory [19,22,23]. J.A. González investigated the effect of electrochemically reactive rust layers on the corrosion of steel in a Ca(OH)2 solution and found that the rust layers of the pre-rusted rebar accelerated corrosion both by providing a reducible material for the cathodic reaction and by acting as a porous electrode for the reduction of oxygen [19]. P. Novak also reported that the pre-rusted rebar had a significantly faster corrosion rate in the concrete blocks compared to the rebars with scaled surfaces and machine-cleaned surfaces. The main reason is that the rust acts as a barrier for alkaline solution from concrete and also as a crevice in which corrosion simulating anions concentrate by migration to anodic sites [22]. However, some researchers indicated that initial pre-rusting of the rebars did not affect its corrosion at the core of the concrete and that this could even be beneficial [24,25]. M. Maslehuddin reported that the corrosion rate of reinforcement corrosion in concrete specimens prepared with corroded steel bars exposed to atmosphere for 12 months and salt spray was lower than that of the unexposed regular rebar (fabricated via hot rolling) bars. One latest study reported that the existence of a thick rust layer on the rebar surface was highly likely to lead to a substantial decrease in the service life of RCS due to more serious rebar corrosion [16]. Therefore, it is of practical engineering significance to eliminate the rust layer of the rebar.
In the present study, the naturally corroded rebar (designated as rusted rebar) obtained from long-term outdoor exposure was treated by surface modification via two quasi-industrialized processes. The macro and micro surface states of the rusted rebar and surface-modified rebar as well as their passivation and corrosion behavior in the Cl-free/Cl-containing simulated concrete pore solutions (SCPSs) of different alkalinity were systematically studied.

2. Experiment

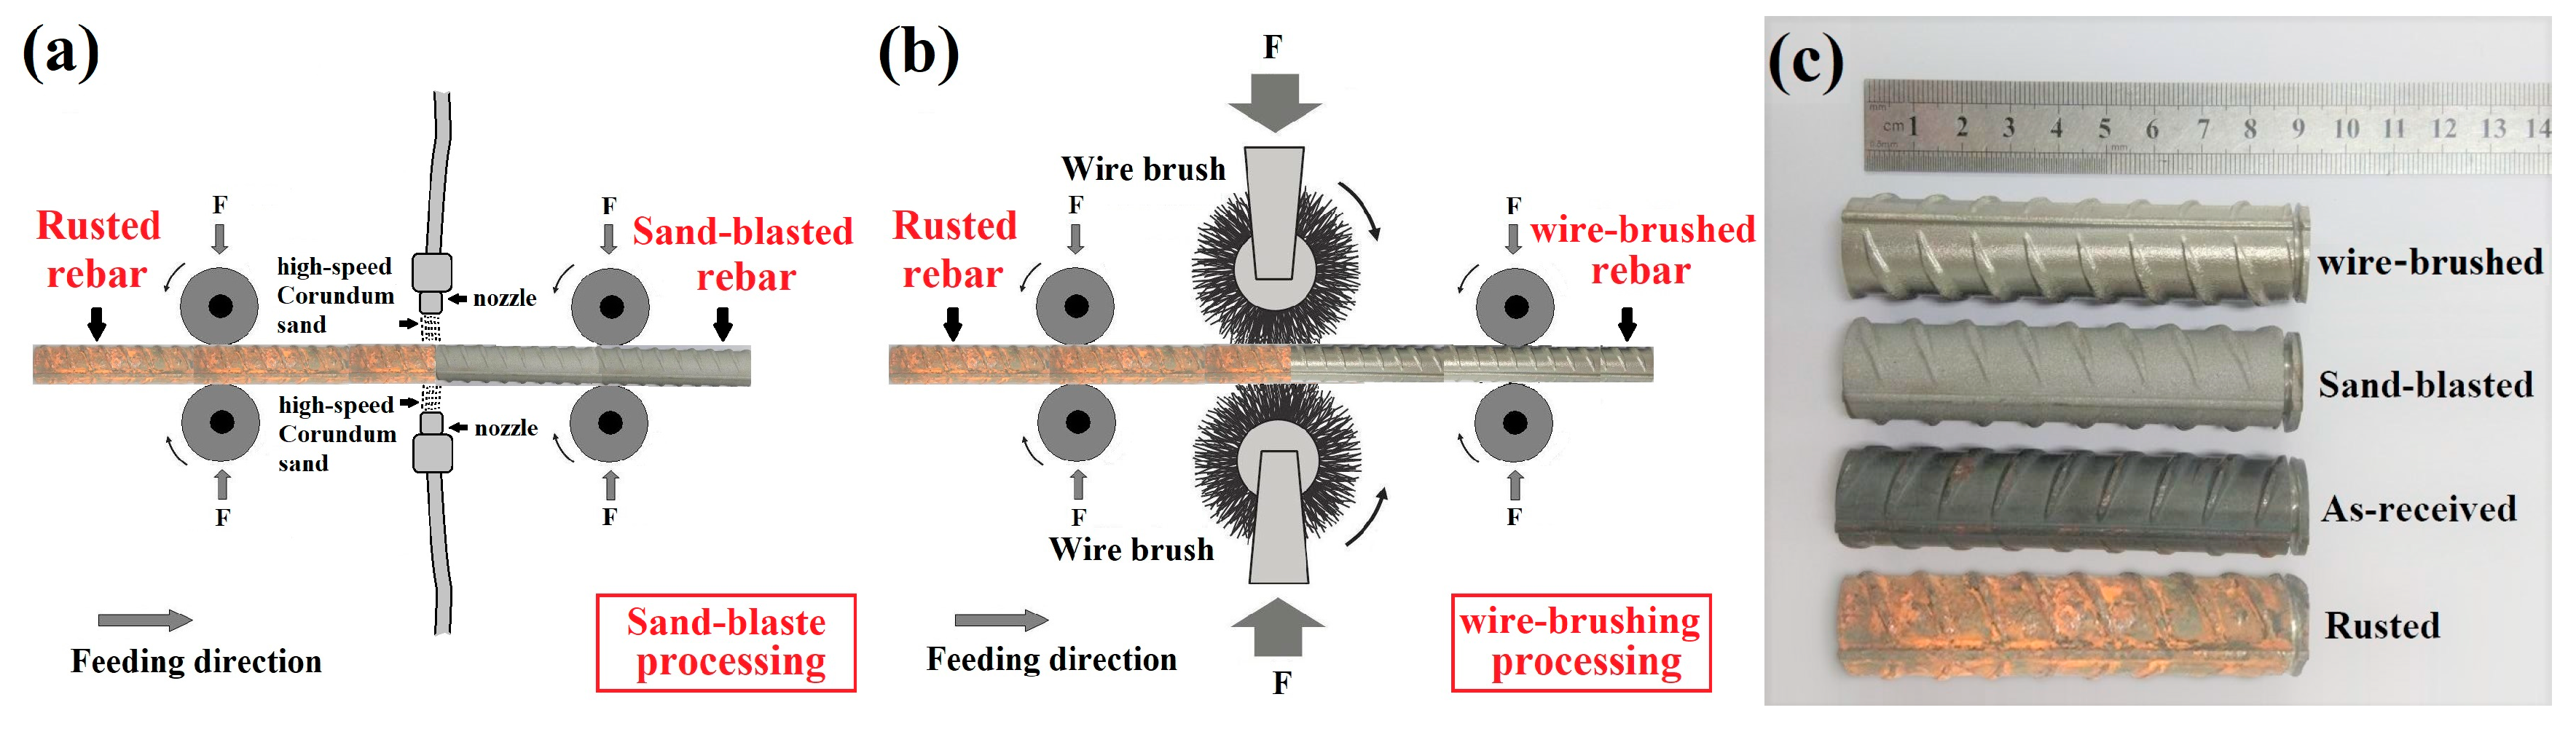
2.1. Raw Materials and Surface Modification Processes

In this study, a used common carbon-steel rebar (20 MnSiV, Chinese standard HRB 400) with a diameter of 20 mm was obtained from the Jiangsu Shagang group of China. The chemical composition of the rebar was examined by a photoelectric direct reading emission spectrometer (Spectro Max, Berlin, Germany) and listed in Table 1. The naturally exposed rusted rebar was selected as the original rebar, which was exposed to the outdoor environment of Nanjing city (China) for 6 months and named as rusted rebar briefly. The rusted rebar was further treated by two surface-modification processes, including sand blasting and wire brushing. The as-received rebar with complete mill scale was also selected for comparison.
Figure 1 gives a schematic illustration of the sand blasting and wire brushing processes of the rebar. During the sand blasting process (driven by the compressed air at three atmospheric pressures), 60 mesh corundum sands were sprayed on the rebar surface at a high speed via two nozzles. Under the fast impact of corundum sands, the surface rust layer of the rebar was completely removed. The rusted rebar after sand blasting treatment was named sand-blasted rebar. During the wire brushing process, the rusted rebar surface was scraped repeatedly by two high-speed rotating wire brushes to completely remove the rust layer. The stress was loaded on the wire brushes to keep the wires in contact with the rebar surface appropriately during the processing. A proper rotating speed of the wire brush was set at 8000 r·min−1, which was driven and controlled by an electric motor. The rusted rebar after the wire brushing treatment was named wire-brushed rebar. It should be noted that feeding wheels were used in both sand blasting and wire brushing processes to provide enough stiffness to the rebar and convey the rebar with an appropriate speed. Based on the pre-experimental results, the feeding speeds of the sand blasting process and wire brushing process were both set to 5 mm∙s−1. Figure 1c shows the physical images of the rebars with different surface states. Clearly, the as-received rebar was typically black in color whereas the rusted rebar was yellow-brown due to the coverage of the rust layer. After surface modification, the rust layer was completely removed, leading to a typical metallic luster of the sand-blasted and wire-brushed rebar. To avoid potential corrosion of the surface-modified rebar in the moist air, the surface-modified rebars were stored in a drying chest until they were used and the storage time did not exceed one week.

2.2. Electrochemical Testing

The passivation and corrosion behavior of the rebar in SCPS of different alkalinity levels were systematically investigated by electrochemical tests. Three types of SCPS were used and their detailed compositions are listed in Table 2. The SCPS with pH a value of 13.6 (pH–13.6 SCPS) represents a high alkaline environment of the ordinary Portland cement concrete. The SCPS with a pH value of 12.5 (named pH–12.5 SCPS) represents a medium alkaline environment of the mineral admixture blended concrete. The SCPS with a pH value of 11 (named pH–11 SCPS) represents a low alkaline environment of the carbonated concrete. pH–11 SCPS was prepared by adding an appropriate NaHCO3 solution to the saturated Ca(OH)2 solution to obtain the proper pH value of the target SCPS. An amount of 0.05 mol∙dm−3 NaCl was added into these three different SCPS, and the resulting Cl-containing SCPS was used to study the corrosion behavior of the rebar in different alkaline concrete environments. All the SCPSs with/without NaCl were prepared using deionized water. For the long-term exposure experiments, each rebar was immersed individually in a plastic container with about 5 L SCPS. In view of the low alkalinity and the potential carbonization in air, all the pH–11 SCPSs with/without Cl were replaced once a day to maintain a stable alkalinity. The other SCPSs were replaced every five days.
Electrochemical tests were conducted by a PARSTAT 2273 potentiostat (Princeton, Oak Ridge, TN, USA) with a three-electrodes system, which included a Pt counter electrode, a saturated calomel electrode (SCE), and a working electrode. In view of the large surface area of the working electrode (i.e., the tested rebar), a large-size Pt counter electrode with size of 20 × 30 × 0.2 mm3 was used. Considering the inevitable Cl exchange between the SCE and SCPS and its potential influence on the electrochemical testing results, SCE was only immersed in the SCPS during the electrochemical testing to limit the Cl exchange to a minimum level. Rebar samples with lengths of 9.5 cm were used for electrochemical tests. The two ends of the rebar were tightly covered with epoxy resin and one end was connected by a copper wire, leaving the length of 7.5 cm and the cylindrical surface of about 47 cm2 of the tested rebar exposed to the electrolyte. Three electrochemical tests, including open circuit potential (OCP), electrochemical impedance spectroscopy (EIS), and potentio-dynamic polarization (PDP), were conducted. The PDP tests were performed at a scan rate of 1 mV∙s−1. The frequency of EIS tests ranged from 10 kHz to 10 mHz and the amplitude of the sinusoidal potential signal was 5 mV with respect to the OCP. At least five parallel samples for each kind of testing method were tested to obtain the average values of the electrochemical parameters.

2.3. Surface Characterization

The macro and micro surface states of the rebar before and after corrosion were carefully characterized. The macro surface morphologies of the rebar were recorded via a digital camera. The top-view and cross-sectional view of micro surface morphologies of the rebar were observed via scanning electron microscopes (SEM, FEI Quanta 3D FEG, Hillsboro, OR, USA and Hitachi S3400N, Tokyo, Japan). For the cross-sectional view characterization, the rebar sample was cut by electrospark wire-electrode cutting, molded in epoxy resin, and gradually polished by abrasive papers and polishing powder suspension to a mirror-like finishing. Prior to the SEM observation, the samples were etched by 4% nital solution for about 5 s to reveal the microstructure features. For a better observation, all the SEM samples were treated by gold spraying to increase the conductivity of the sample. For the wire-brushed rebar, its detailed surface microstructure characteristics were further observed by transmission electron microscopy (TEM, Tecnai G2 F20, FEI, Hillsboro, OR, USA).

3. Results and Discussion

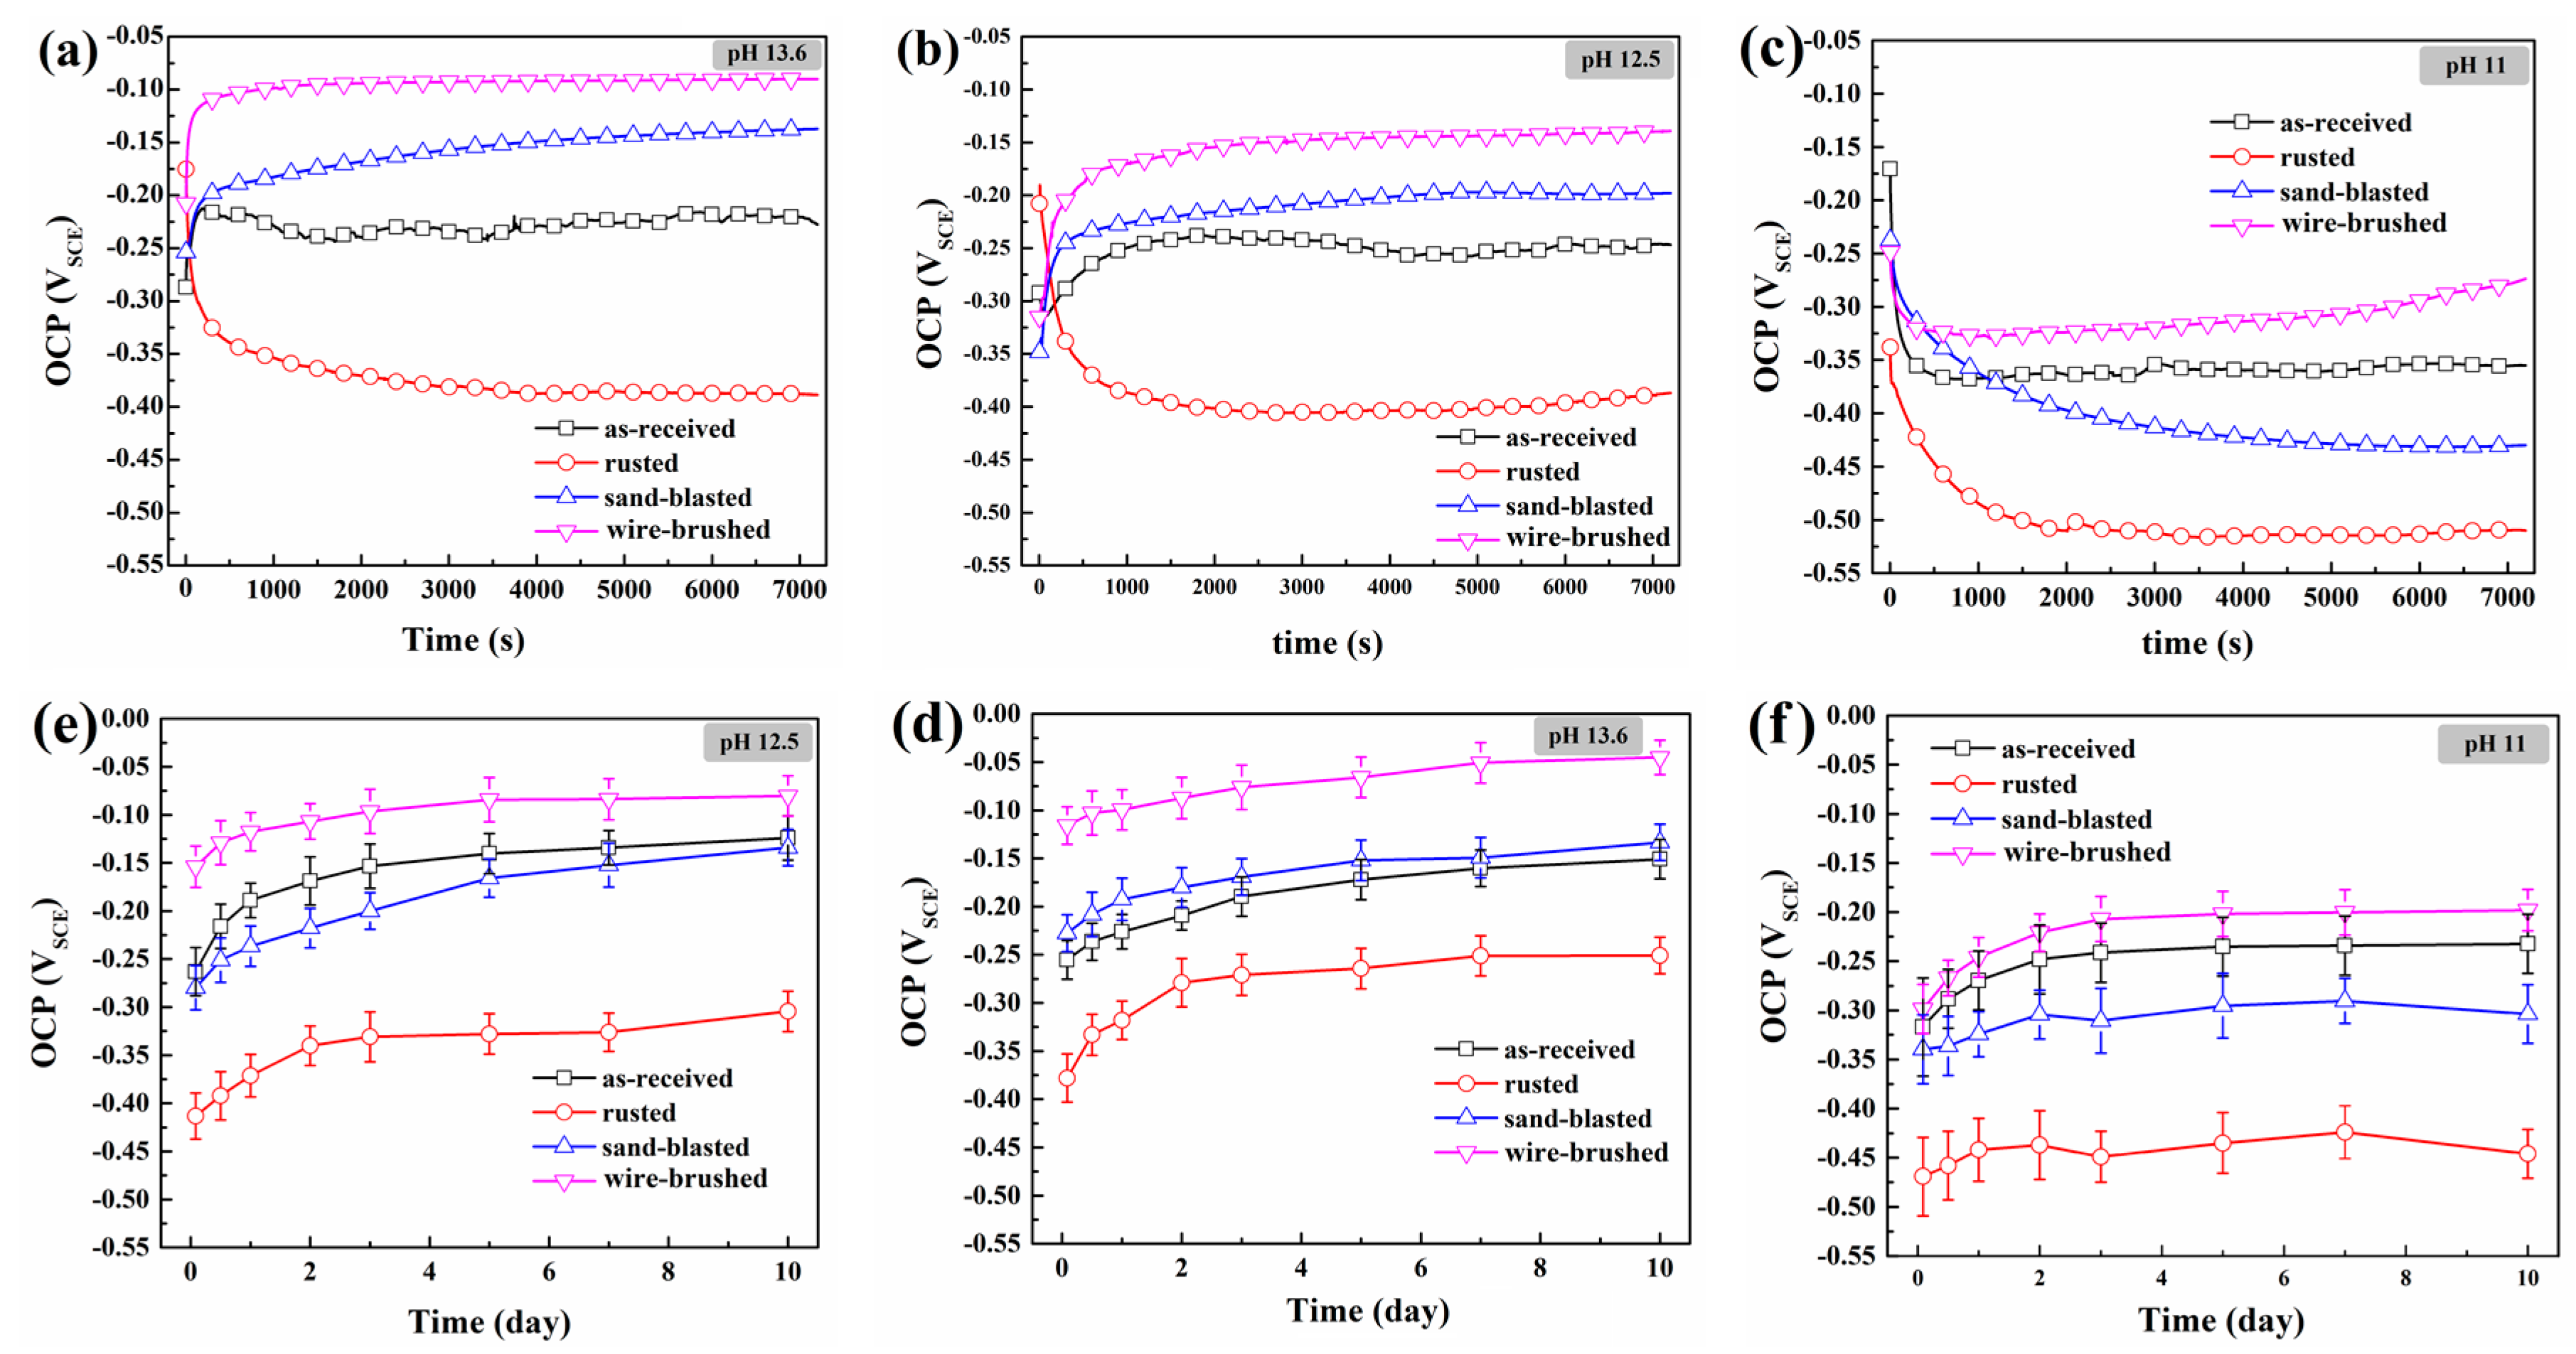
3.1. Passivation Behavior of Rebar in the Cl-Free SCPS of Different Alkalinity

The OCP is the mixed electrode potential in a given corrosion environment, which is mainly determined by the material of the electrode and the environmental medium. Moreover, the OCP is also greatly influenced by the surface state of the electrode. When the rebar is immersed in the SCPS, the passivation immediately occurs. With the effect of alkalinity and dissolved oxygen of the SCPS, passive film forms on the rebar surface [14,26]. Thus, the OCP has a close relationship with the integrity and density of the rebar’s passive film. The nobler the OCP value, the better the passivation state of the rebar, with a more complete and denser passive film.
Figure 2 shows the OCP time variation curves of different rebars in the Cl-free SCPS of different alkalinity and Figure 2a–c are the continuous OCP curves obtained from the initial passivation immersion for 2 h. In the pH–13.6 SCPS, the as-received rebar, the sand-blasted rebar, and the wire-brushed rebar experienced an increase in OCP. Within the first 250 s, they all underwent a similar rapid OCP increasing stage. Thereafter, they showed a different OCP evolution. Among them, the wire-brushed rebar garnered the most noble OCP (about −0.1 V), which became relatively stable after a rapid increasing stage. The sand-blasted rebar possessed the second noblest OCP and displayed a continuous increasing trend after the rapid increasing stage. The as-received rebar had the least noble OCP and experienced fluctuations in OCP. In stark contrast, the rusted rebar had the most noble OCP value (about −0.175 V) at the beginning of the test but underwent a rapid decrease in OCP in the first 250 s, followed by an attenuated decreasing trend. The high beginning OCP value of the rusted rebar may be closely related to its rust layer. The OCP evolution behaviors of the four different rebars in the pH–12.5 SCPS were similar to those in the pH–13.6 SCPS (Figure 2b). However, they all had a relatively lower OCP values compared with their counterparts in the pH–13.6 SCPS. A dramatic change in the OCP evolution of all the rebars occurred when they were immersed in the pH–11 SCPS: all the rebars suffered a sharp decrease in OCP at the early stage of immersion (within 500 s) and then displayed a continuous but more attenuated decrease in OCP (except for the wired-brushed rebar). This change is likely to have been induced by the much lower alkalinity of the pH–SCPS, which failed to provide enough OH for the passivation of the rebar.
Figure 2d–f are the OCP curves obtained via the periodic detection of the rebars during a 10–day continuous immersion. In general, all the rebars presented gradually elevated OCP values during the whole passivation immersion period in all the three SCPSs, except for the rusted rebar in the pH–11 SCPS. Among all the rebars, the wire-brushed rebar had not only the most noble OCP but also the most rapid rate of OCP increase, suggesting the best passivation. Meanwhile, in both the pH–13.6 SCPS and pH–12.5 SCPS, the OCP value of the sand-blasted rebar was higher than that of the as-received rebar. However, the OCP values of the sand-blasted and as-received rebars were reversed in the pH–11 SCPS. These findings demonstrate that compared with the as-received rebar, the sand-blasted rebar had a stronger passivation in high and medium alkalinity environments but a weaker passivation in low alkalinity environments. The rusted rebar showed both the lowest OCP and the slowest rate of increase, indicating the weakest passivation. The fluctuating OCP values around −0.45 V in Figure 2f indicate that there was no sufficient passivation of the rusted rebar in the pH–11 SCPS.
EIS was used to further study the passivation behaviors of the rebars in Cl-free SCPS of different alkalinity, and the EIS Nyquist plots tested after immersion for 2 h and 10 days are shown in Figure 3. The Nyquist plot of all the rebars was dominated by a capacitive arc. It has been widely accepted that the capacitive arc diameter of Nyquist plots is qualitatively related to the corrosion resistance. In other words, the larger the diameter, the better the corrosion resistance [27,28,29]. In the passivation system of the rebar, larger capacitive arc diameters indicate a better passivation of the rebar. Evidently, all the rebars presented decreased capacitive arcs in the SCPS with a lower alkalinity. This phenomenon can be ascribed to the obviously decreased OH concentration of the SCPS. However, in each SCPS, all the rebars presented enlarged capacitive arcs after a 10-day immersion, reflecting an effective passivation. The wire-brushed rebar and rusted rebar always had, respectively, the largest and smallest capacitive arcs. The sand-blasted and as-received rebar had, respectively, the second and third largest capacitive arcs in both the pH–13.6 SCPS and pH–12.5 SCPS. However, their capacitive arc order was reversed in the pH–11 SCPS. It is noteworthy that the EIS experimental results corresponded well to the OCP results.
For a better explanation of the passivation behavior of the tested rebar, the experimental impedance data were simulated by the equivalent circuit via ZSimpwin commercial software (V3.60, Echem Software, Ann Arbor, MI, USA). Two equivalent circuits were obtained, including the modified Randles circuits with/without a Warburg (W) diffusion element [30,31,32]. In the equivalent circuits, the Rs and Rt represent the electrolyte resistance of the SCPS and the charge transfer resistance of the rebar, respectively. Considering the non-ideality of the interface of the SCPS and the rebar electrode, the constant element (Qdl), instead of the pure double-layer capacitor (Cdl), was selected. Meanwhile, the Warburg element was added according to the linear-rising feature of the Nyquist plots of the rebar after passivation immersion in Cl-free pH–12.5 and pH–13.6 SCPS for 10 days. Rt can characterize the corrosion resistance of the tested materials: a larger Rt value usually indicates a better corrosion resistance. Thus, the fitted Rt value was used to quantitatively characterize the rebar passivation, which is shown in Figure 4. Overall, the Rt values are a proxy for the capacitive arc diameter. When the as-received rebar was regarded as the standard, the rusted rebar had minimum Rt values in all SCPS, especially in the pH–11 SCPS, demonstrating the extremely weakened passivation. The two surface-modified rebars delivered drastically enhanced passivation compared with both the as-received rebar and the rusted rebar. After passivation for 10 days, the Rt value of the wire-brushed rebar was about 1.8 times and 1.5 times higher than that of the as-received rebar in the pH–13.6 SCPS and in both the pH–12.5 SCPS and pH–11 SCPS, respectively. Meanwhile, the wire-brushed rebar was superior to the rusted rebar in passivation. For example, the Rt value of the wire-brushed rebar was about six times higher than that of the rusted rebar in the pH–11 SCPS. The sand-blasted rebar also had a good passivation, but its Rt value was always slightly lower than that of the wire-brushed rebar. It should be pointed out that compared with the as-received rebar, the sand-blasted rebar had a better passivation in highly alkaline CSPS, a similar performance in medium alkaline SCPS, but a worse performance in low alkaline CSPS. This indicated that the passivation of the sand-blasted rebar was more sensitive to the alkalinity of the SCPS compared with the as-received rebar.
Based on the above OCP and EIS results, it can be concluded that the rusted rebar obviously limited passivation in all the SCPSs. The surface modification of the rusted rebar greatly augmented its passivation. Interestingly, the surface-modified rebar even delivered a better passivation performance than the as-received rebar. The wire-brushed rebar always performed best in passivation in all SCPS. Meanwhile, the sand-blasted rebar also experienced an enhanced passivation performance, which, however, was more sensitive to the alkalinity of the SCPS.

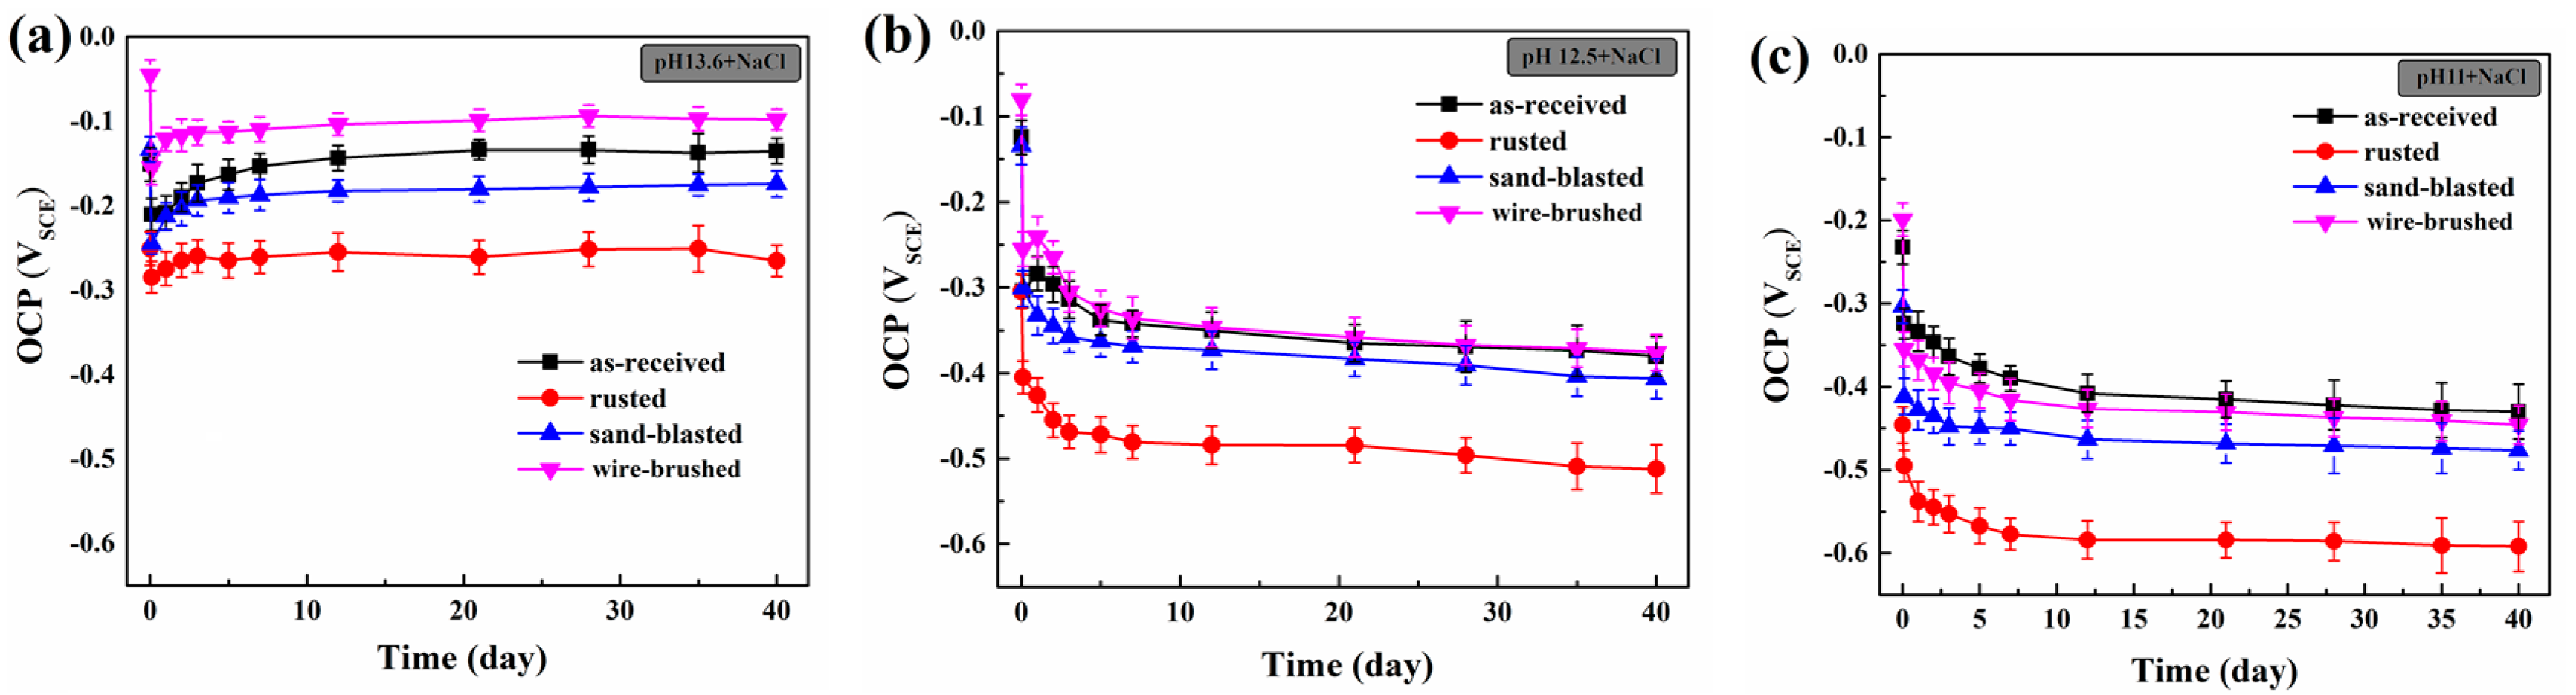
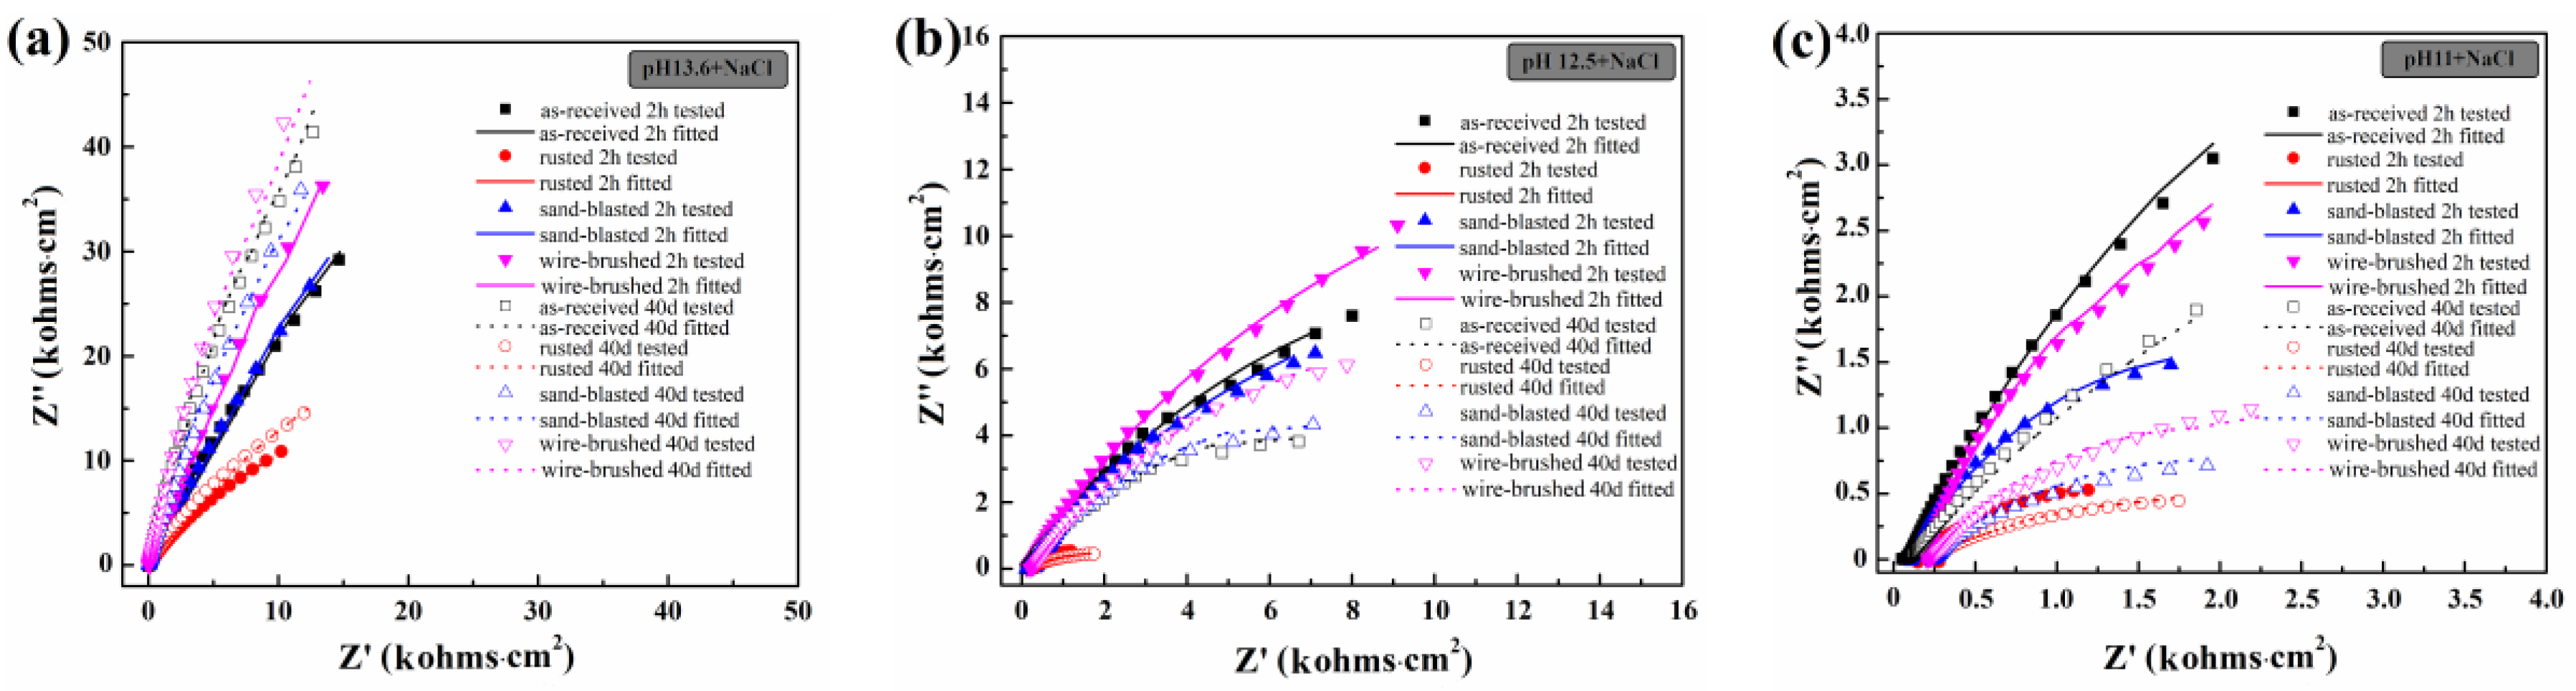
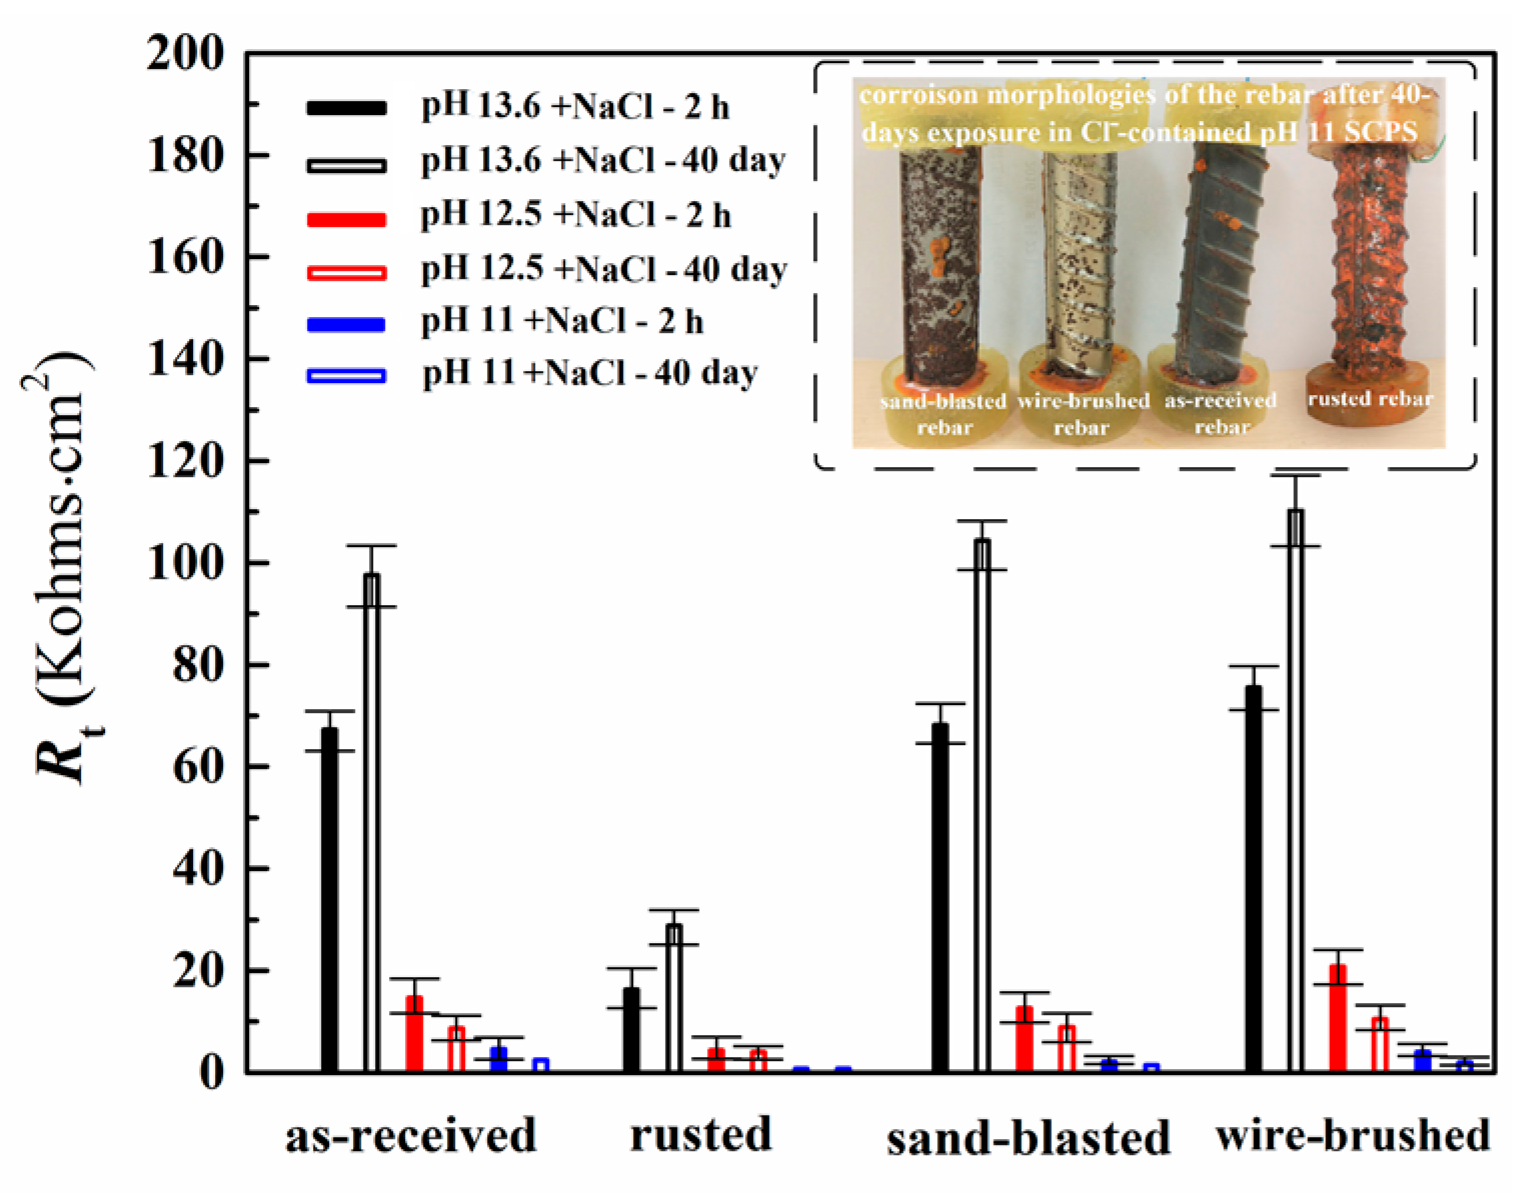
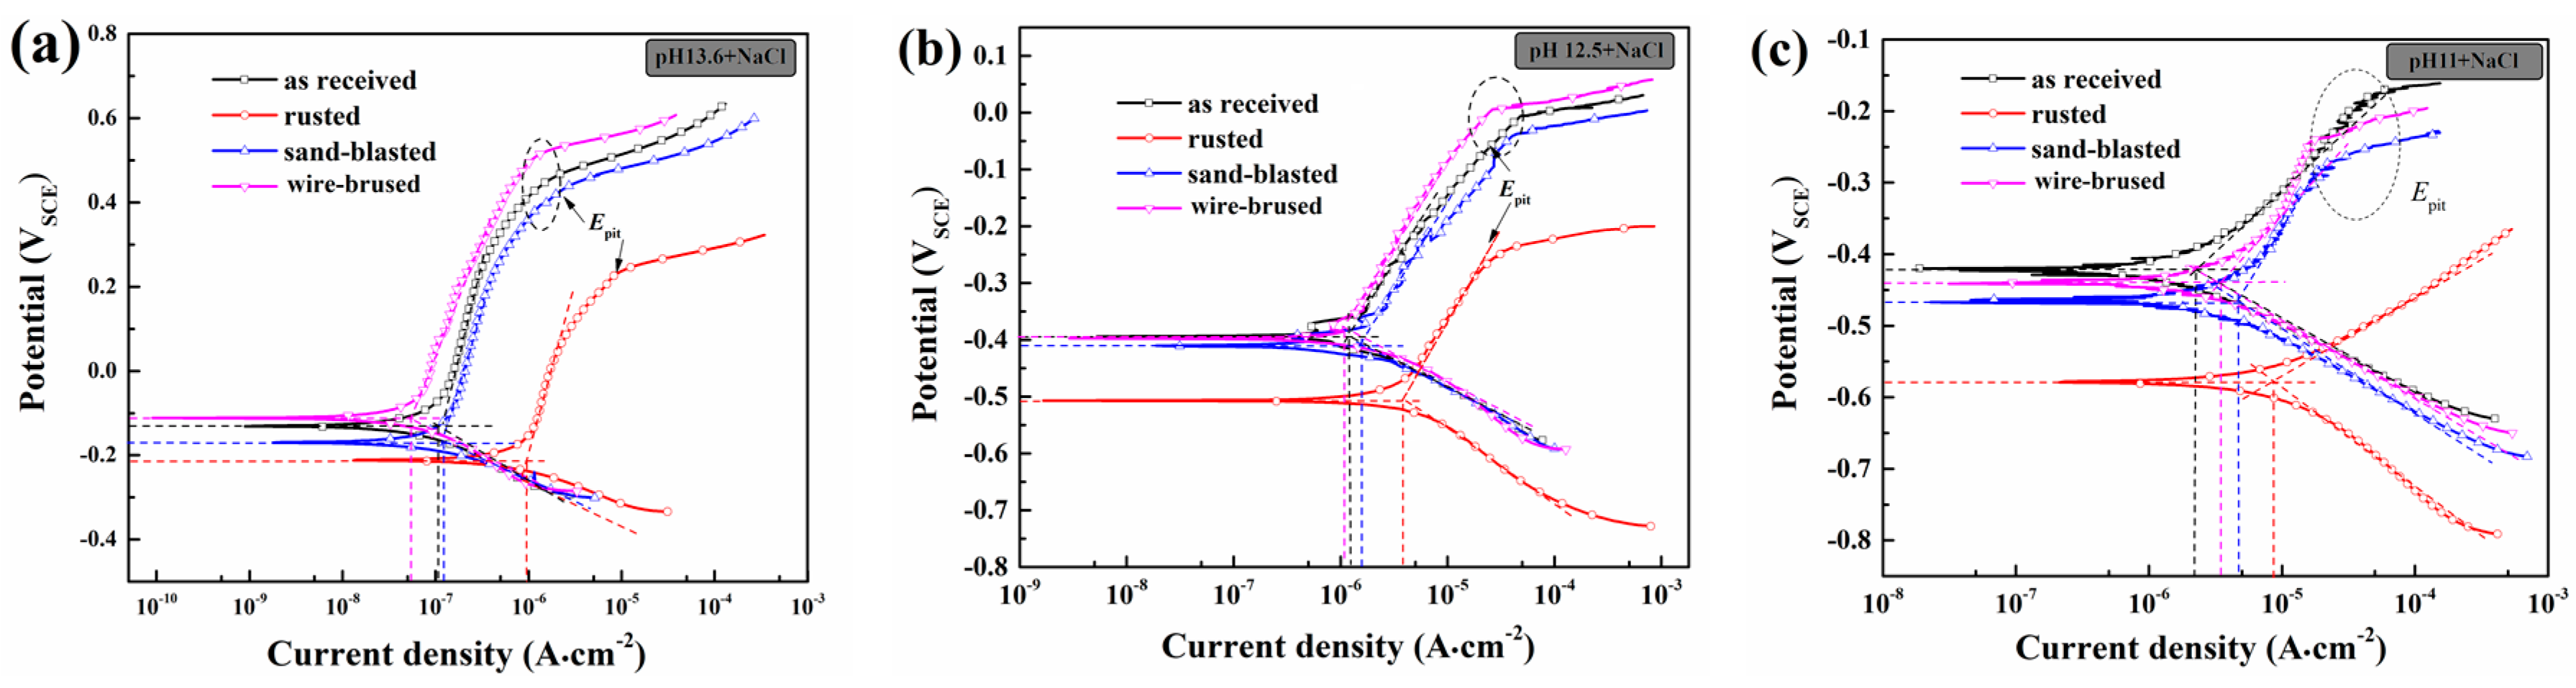
3.2. Corrosion Behavior of Rebar in the Cl-containing SCPS of Different Alkalinity

Figure 5 shows the OCP evolution curves of the rebar immersed in the Cl-containing SCPS of different alkalinity levels. In general, the addition of chloride ions caused a significant drop in the initial OCP value of all the rebars, with a more significant decrease in the pH–12.5 and pH–11 SCPS. In the pH–13.6 SCPS, the OCP of the rebar first increased slowly and then became stable. It should be noted that the stable OCP of all the rebars was nobler than −0.3 V, indicating sufficient passivation of the rebar under continuous Cl attack. On the contrary, in the Cl contained pH–12.5 SCPS and pH-11 SCPS, the OCP of the rebar first decreased slowly and then remained stable. After 40–day corrosion, the OCP of all the rebars decreased to −0.35 to −0.6 V, reflecting different degrees of de-passivation and even the occurrence of corrosion damages. For example, in the pH–11 SCPS, all the OCP values were below −0.4 V. In the pH–13.6 SCPS, the wire-brushed rebar had the most noble OCP, followed by the as-received rebar and sand-blasted rebar. However, when the alkalinity decreased (in the pH–12.5 SCPS and pH–11 SCPS), the better corrosion resistant performance of the wire-brushed rebar was compromised, reflected by a similar OCP value to that of the as-received rebar.
Figure 6 shows the EIS Nyquist plots of the rebar in the Cl-containing SCPS of different alkalinity. Like the passivation in the Cl-free SCPS, the EIS Nyquist plots were also dominated by a capacitive arc. Thus, the modified Randle circuits were also used to fit the EIS plots, and the fitted Rt values are shown in Figure 7. The attack of Cl significantly decreased both the capacitive arc diameter and the Rt values of all the rebars compared to those tested in the passivation situation. In the pH–12.5 SCPS and pH–11 SCPS, the capacitive arc diameter and Rt values of the rebars were further decreased after exposure to Cl for 40 days. This was likely caused by the breakdown and dissolution of the passive film and the subsequent corrosion in the rebar matrix. In the pH–13.6 SCPS, however, the capacitive arc diameter and Rt values of the rebar were increased after exposure to Cl for 40 days. This may have been due to the strong repassivation of the rebars induced by the high alkalinity (pH–13.6). It should be pointed out that the two modified rebars always presented an obviously larger capacitive arc diameter and higher Rt values than that of the rusted rebar, thereby showing an enhanced anticorrosion performance. Compared with the as-received rebar, the wire-brushed rebar possessed a better corrosion resistance for the whole exposure duration in the Cl-containing pH–13.6 SCPS. However, in the Cl-containing pH–12.5 SCPS, it only showed a better corrosion resistance for a short exposure duration and had a similar corrosion resistance after a long-duration exposure. Meanwhile, in all the SCPSs, the corrosion resistance of the sand-blasted rebar was slightly lower than that of the as-received rebar but was better than that of the rusted rebar.
The optical macro corrosion morphologies of the rebar after a 40-day exposure to Cl-containing pH-11 SCPS were recorded and are shown in the upper right corner of Figure 7. All the rebars suffered varying degrees of corrosion damages after continuous Cl erosion in such low-alkaline SCPS. Clearly, the corrosion damage of the rusted rebar was the most serious. Compared with the rusted rebar, the two surface-modified rebars suffered significantly lighter corrosion damages (the wire-brushed rebar performed much better). However, compared with the as-received rebar, the two surface-modified rebars seemed to suffer more serious corrosion damages (the sand-blasted rebar was even worse).
A potentio-dynamic polarization test was conducted to evaluate the corrosion rate of the rebar. Figure 8 shows the potentio-dynamic curves of the rebar after exposure to Cl-containing SCPS for 40 days. The corrosion potential (Ecorr), pitting potential (Epit), corrosion current density (icorr), and corrosion rate were fitted and calculated from the PDP curves, which are also summarized in Table 3. Generally, Ecorr can be used to characterize the corrosion thermodynamics. A nobler Ecorr indicates a lower thermodynamic tendency of the tested sample for corrosion. Epit can be used to characterize the pitting corrosion resistance of the sample. A nobler Epit indicates a better pitting corrosion resistance. As marked by the dash line ellipses, the Epit values were measured as the potential corresponding to the turning point of the anodic curves where the current suddenly increases with the increase of voltage. icorr is a typical parameter reflecting the corrosion dynamics. A lower icorr indicates a lower corrosion rate and a better corrosion resistance. The icorr value of each rebar can be obtained by the Tafel extrapolation of both the cathodic and anodic branch of the polarization curves. Meanwhile, the icorr value can also be used to quantitatively calculate the corrosion rate by Equation (1) [33].
corrosion   rate   = 3.27   ×   i corr   ×   M n F ρ
where icorr is the corrosion current density, M is the molar mass of the metal, n is the number of electrons exchanged in corrosion reaction, F is the Faraday constant, and ρ is the metal density.
As Figure 8a shows, all the rebars showed intensive anodic polarization in the PDP curves, reflecting effective passivation of the rebar in the Cl-containing pH–13.6 SCPS. The wire-brushed rebar delivered the best anticorrosion performance, reflected by the most noble Ecorr and Epit, but the lowest icorr and corrosion rate. The rusted rebar showed the worst anticorrosion performance. It can be clearly seen that there was a big difference in the corrosion rate between the rusted rebar and the other three types. For example, the corrosion rates of the wire-brushed rebar and the sand-blasted rebar were, respectively, about 1/17 and 1/7 of that of the rusted rebar.
Figure 8b showed that all the rebars still retained relatively obvious anodic polarization in the PDP curves after exposure to the Cl-containing pH–12.5 SCPS for 40 days, although their intensity was weakened compared with that of the samples immersed in the Cl-containing pH–13.6 SCPS. Due to the decreased alkalinity of the SCPS, the rebars displayed a significantly weakened anticorrosion performance, reflected by lower Ecorr and Epit and higher icorr and corrosion rate.
When the pH of the SCPS further decreased to 11, the rusted rebar presented typical weak anodic polarization, showing the typical active dissolution with a very high current density and corrosion rate. In this situation, no Epit could be characterized for the rusted rebar. In contrast, the other three types of rebars still presented some characteristics of passivation. However, the significantly decreased anodic polarization rate (βa) and passivation-maintaining potential interval pointed to the very fragile passivation of the rebars after 40 days of exposure to the Cl-containing pH–11 SCPS. It should be noted that the wire-brushed and sand-blasted rebar presented a slightly higher corrosion rate compared with the as-received rebar. The results were in good agreement with the OCP and EIS results. As Figure 8c shows, one special phenomenon worth noting is that there was no typical intensive anodic polarization and no obvious turning point in the anodic curve of the rusted rebar in Cl-containing pH–11 SCPS. Thus, this rebar presented the typical rapid anodic dissolution, and no Epit value can be given in this situation.
The above comprehensive analysis of OCP, EIS, and PDP results demonstrates that the rusted rebar possessed the worst corrosion resistance and the fastest corrosion rate in all the Cl-containing SCPSs. The surface modification of the rusted rebar greatly augmented the anticorrosion resistance. The wire-brushed rebar even delivered a better anticorrosion performance than the as-received rebar in the Cl-containing SCPS with a high and medium alkalinity.

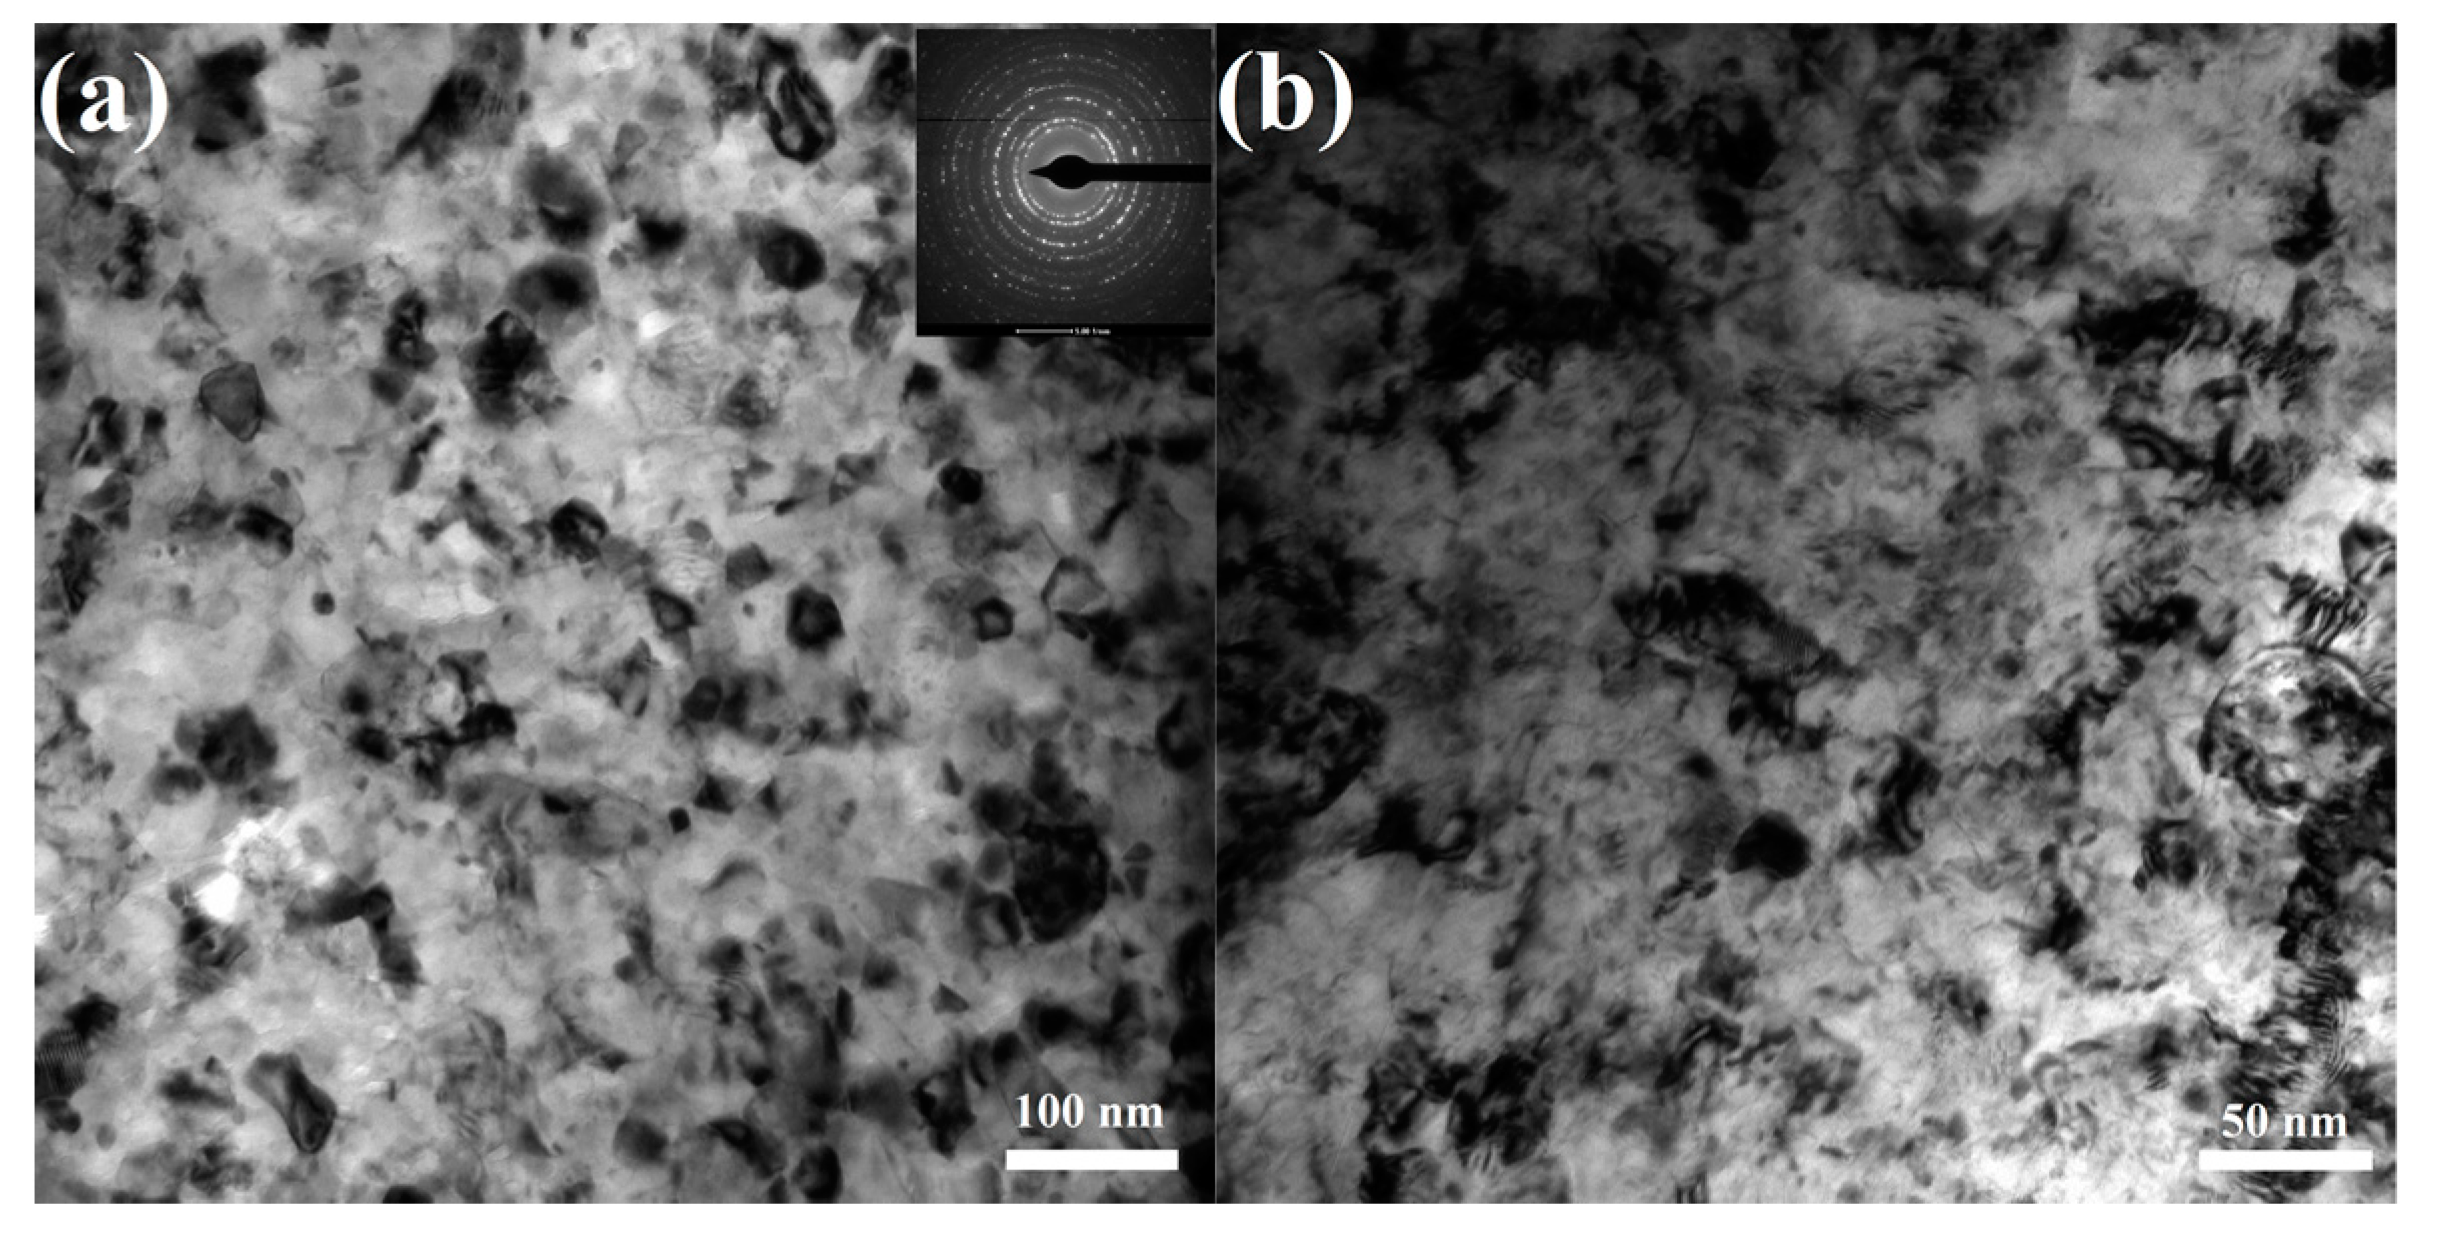
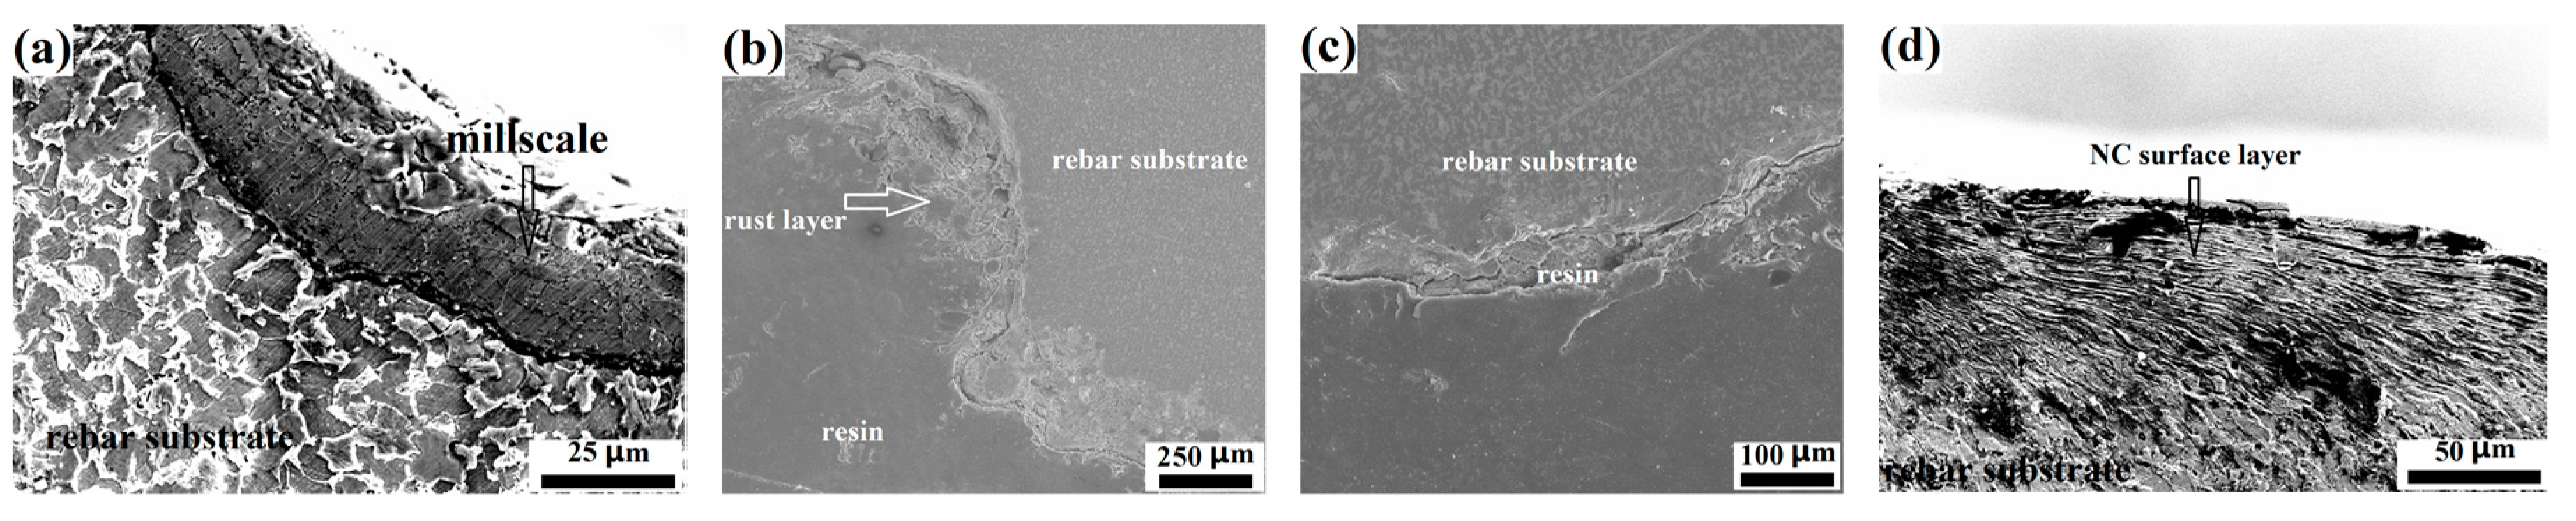
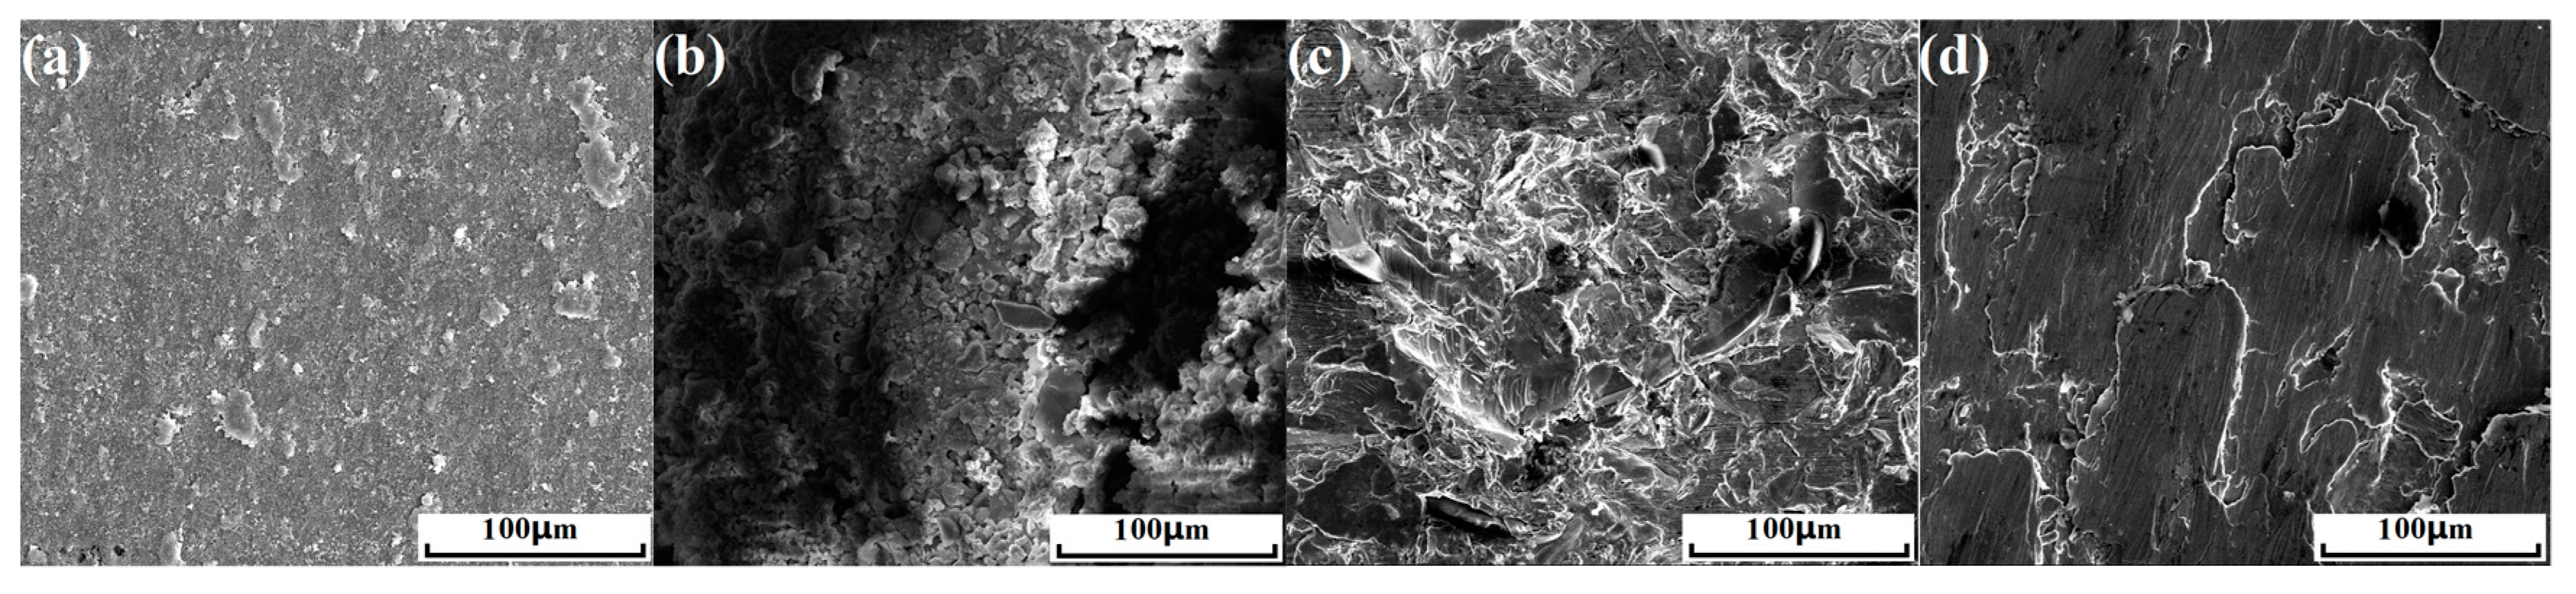
3.3. Surface Microstructure and its Effect on Corrosion Resistance of Rebar

The electrochemical tests clearly revealed the significant difference in the passivation and corrosion behavior of the four types of rebars with different surface states. For the same type of rebar substrate in a fixed environment, its passivation and corrosion behaviors were dependent on the surface state, including the surface chemical components, microstructures, and roughness. Remarkable differences in the macro surface state of the rebars were revealed by macro optical images in Figure 1c. SEM observations were further conducted to examine their detailed micro surface states. Figure 9 shows the SEM images of the cross-sectional surface microstructure of the rebars. As seen in Figure 9a, the surface of the as-received rebar had two distinct parts: the substrate and the mill scale. The rebar substrate had a typical low-carbon steel microstructure, including the ferrite phase and pearlite phase. The mill scale on the rebar surface was the high-temperature oxidation product during the formation process via hot rolling. According to the references [34,35,36], the mill scale was chemically composed of FeO, Fe2O3, and Fe3O4. The coverage of the mill scale on the as-received rebar gave rise to a black (instead of metallic luster) surface. The existence of the mill scale on the rebar surface inevitably affects the passivation and corrosion behavior of the rebar [37]. Meanwhile, the integrity, thickness, and compactness of the mill scale also exerts a certain impact on the rebar’s corrosion behavior. It has been reported that a thick and compact mill scale served as an efficient barrier against the medium transmission [34].
Figure 9b shows the SEM images of the rusted rebar, which was composed of the rebar substrate and the thick rust layer with a non-uniform thickness of 50–250 μm. The rust layer of a carbon steel rebar was reported to be mainly composed of iron hydrate oxide and ferric hydroxide, and its exact composition varied dramatically depending on the different concrete protective layers, aggressive environment, as well as the rebar corrosion cycle life. Most of the rust layers have a porous microstructure, which also affects the medium transmission of the rebar/concrete interface [38,39,40]. Figure 9c and d provide the SEM images of the sand-blasted and wire-brushed rebars, respectively. Clearly, after the surface modifications, the rust layer of the rusted rebar was completely removed. The sand-blasted rebar had a similar substrate microstructure characteristic to that of the as-received and rusted rebars. On the other hand, the wire-brushed rebar had a quite different microstructure. The periphery of the substrate microstructure had typical fibrous features. The thickness of this modified surface layer was about 40–45 μm, which was typical for the deformed substrate microstructures of the rebar, induced by the repeated scratch of the high-speed rotated wire brush. Given the big differences in the histomorphology of the modified surface layer, it may have unique characteristics compared with the normal substrate microstructure, which may in turn lead to distinct performances in the passivation and corrosion behavior of the wire-brushed rebar.
TEM was applied to observe the detailed characteristics of the modified surface layer of the wire-brushed rebar. The corresponding TEM images are shown in Figure 10a,b. The microstructure of the modified surface layer showed the typical nano-scaled grains with an average grain size of 40~50 nm. The selected electron diffraction pattern of the deformed grains showed a distinct ring, which was referred to as high-angle grain boundaries (HAGB) of the nanograins [41]. As shown in Figure 10b, the nanograins also stored many intragranular dislocations, presenting a high density of dislocation tangles. It should be pointed out that HAGB and intragranular dislocations are typical non-equilibrium microstructures, which endows the nanograins with much higher internal energies [42]. Based on the TEM observation, the modified surface layer of the wire-brushed rebar presented a typical nanocrystalline (NC) microstructure. Thus, this modified surface layer can be named the NC surface layer. It is noteworthy that this NC surface layer is the most exterior part of the substrate with special nanograins, which has the same chemical composition the other parts of the rebar substrate.
The SEM top-view surface microstructures of the rebar are shown in Figure 11. As seen in Figure 11a, the rebar mill scale had a good integrity and smoothness. In Figure 11b, the surface of the rusted rebar was covered with irregular rust products. Although there were certain similarities in compositions between the rust layer and the rebar mill scale, the rust layer presented a non-compact stacking structure. Meanwhile, the SEM image of the rusted rebar showed very uneven brightness. This observation may be directly caused by the height difference of the rust layer, reflecting a high surface roughness of the rusted rebar. In Figure 11c,d, no mill scale or rust layer was observed on the surface of the sand-blasted and wire-brushed rebar. However, there was a clear difference in the surface morphologies of the two surface-modified rebars. The sand-blasted rebar had a much higher surface roughness, displaying a large amount of impacted micro-fractures. This surface characteristic was incurred by the high-speed impact of the corundum particles. On the other hand, the wire-brushed rebar had a much smoother surface, although there were some scratch traces on the top surface, which were caused by the repeated scratch of the high-speed rotated wire brush.
In view of the dramatic difference in the observed micro surface sates, one can deduce that the passivation and anticorrosion performance of the rebars were significantly influenced by their surface state. For the rusted rebar, the pre-rusting condition contributed to its worst passivation, which failed to provide a fresh metallic surface to passivation and brought the least passivation ability. The significantly enhanced passivation of the two surface-modified rebars was attributed to the elimination of the negative effect of the rust layer and the regaining of the fresh metallic surface. Interestingly, the surface-modified rebar even showed better passivation than the as-received rebar, especially in the Cl-free SCPS with a high or medium alkalinity. This was closely related to the direct contact of the metallic surface of the surface-modified rebar with the SCPS, while the as-received rebar had a barrier of mill scale on its surface. However, one exception was that the sand-blasted rebar presented slightly weaker passivation compared with the as-received rebar in the Cl-free pH–11 SCPS. It has been accepted that in an environment of limited OH, the passivation of the rebar will be predominantly influenced by the negative effect of the high surface roughness, leading to the weaker passivation of the sand-blasted rebar in the Cl-free pH–11 SCPS. Surprisingly, the wire-brushed rebar still had the best passivation of all the Cl-free SCSP. Its NC surface layer played a critical role in the formation of the passive film. Generally, the passive film (oxide film and/or hydrated oxide film) is prone to nucleate at the surface crystalline defects [43,44]. The nanograins with a large amount of high-energetic crystalline defects of the wire-brushed rebar surface provided it with more nucleation sites to stimulate the faster formation of more stable passive film. As a result, the dependence of the rebar passivation on the alkalinity was reduced. Thus, the unique surface nanocrystalline microstructures endowed the wire-brushed rebar with the best passivation.
In the Cl-containing SCPS, the corrosion rate of the rebar was dominated by both the stability of the passive film and the corrosion propagation in the substrate. The rusted rebar still delivered the worst anticorrosion performance. It was apparent that its pre-corroded surface facilitated the direct corrosion initiation. Coupled with the worst passivation, the rusted rebar had the fastest corrosion rate of all the Cl-containing SCPS. Surface modification completely eliminated the above-mentioned unfavorable factors. Therefore, the sand-blasted and wire-brushed rebars experienced a greatly decreased corrosion rate and thereby showed an enhanced anticorrosion performance. However, the relationship between the two surface-modified rebars and the as-received rebar was complicated. The as-received rebar had the lowest corrosion rate of all the three Cl-containing SCPS compared with the sand-blasted rebar. However, it only performed slightly better in the Cl-containing pH-11 SCPS compared with the wire-brushed rebar. This was because the coverage of the mill scale on the surface of the as-received rebar effectively prevented direct contact between the Cl and the metallic surface. When the mill scale is intact and compact, it plays a positive role in anticorrosion. Moreover, given the better passivation of the surface-modified rebar, the change in the Cl-containing SCPS is highly likely to have been caused by the direct exposure of the metallic surface to the Cl and the negative effect of a higher surface roughness.
Overall, the experimental results well demonstrate that the two surface-modified rebars (the wire-brushed and sand-blasted rebars) performed better in the passivation and anticorrosion, thereby holding great potential for increasing the service life of the reinforced concrete structures. It is of great interest and significance to investigate their passivation and anticorrosion performance in concrete under more complex corrosion conditions. Thus, a more systematic study of these surface-modified rebars imbedded in concrete will be conducted in the future.

4. Conclusions

Based on the findings from this study, the following main conclusions can be drawn:
(1)
The surfaces of the as-received rebar and the rusted rebar were covered with the mill scale and rust layers, respectively. Surface modification via sand blasting and wire brushing completely removed the rust layer, providing a fresh metallic surface to the treated rebars. The sand-blasted rebar had a modified surface with an abundance of impacted micro-fractures, presenting a higher roughness. The wire-brushed rebar had a modified surface layer with special nanograins, which restored a large amount of crystal defects and internal energies.
(2)
The surface modification greatly improved the rebar passivation. Complete removal of the rust layer and subsequent revealing of a fresh metallic surface dominated the enhanced passivation of the two surface-modified rebars. In addition, the wire-brushed rebar delivered the fast formation of the stable passive film and the best passivation of all the SCPSs due to its surface nanograins. However, due to a high surface roughness, the sand-blasted rebar presented slightly lower passivation in the pH-11 SCPS than the as-received rebar.
(3)
The surface modification of the rusted rebar greatly improved the anticorrosion resistance of the rusted rebar against Cl due to the elimination of the pre-corroded surface and improvement of the passivation. However, due to the direct exposure of the metallic surface to the Cl without a barrier of mill scale and the higher surface roughness, the wire-brushed rebar presented slightly lower corrosion resistance than the as-received rebar in the Cl-containing pH–11 SCPS, whereas the sand-blasted rebar presented a lower corrosion resistance in all three Cl-containing SCPSs.

Author Contributions

D.S., M.G. and J.J. conceived and designed the experiments; F.Y., J.H., and Z.C. contributed to the sample preparation and corrosion behavior testing; S.Z., J.S. and Y.X. contributed to the data analysis; D.S. and M.G. wrote the paper.

Funding

This research was financial support from Natural Science Foundation of China (51878246), Fundamental Research Funds for the Central Universities of Hohai University (2018B57714), National Basic Research Program of China (2015CB655105), Six Talent Peaks Project in Jiangsu Province (2016-XCL-196), Science and Technology Support Program funded project of Suqian City (Industrial H201817), Applied Fundamental Research Foundation of Nantong City (JC2018110).

Acknowledgments

The authors acknowledge the financial support from Natural Science Foundation of China (51878246), Fundamental Research Funds for the Central Universities of Hohai University (2018B57714), National Basic Research Program of China (2015CB655105), Six Talent Peaks Project in Jiangsu Province (2016-XCL-196), Science and Technology Support Program funded project of Suqian City (Industrial H201817), Applied Fundamental Research Foundation of Nantong City (JC2018110).

Conflicts of Interest

The authors declare no conflict of interest.

References

  1. Angst, U.; Elsener, B.; Larsen, C.K.; Vennesland, Ø. Critical chloride content in reinforced concrete–A review. Cem. Concr. Res. 2009, 39, 1122–1138. [Google Scholar] [CrossRef]
  2. Moser, R.D.; Shingh, P.M.; Kahn, L.F.; Kurtis, K.E. Chloride-induced corrosion resistance of high-strength stainless steels in simulated alkaline and carbonated concrete pore solutions. Corros. Sci. 2012, 57, 241–253. [Google Scholar] [CrossRef]
  3. Ahmad, S. Reinforcement corrosion in concrete structures, its monitoring and service life prediction–a review. Cem. Concr. Compos. 2003, 25, 459–471. [Google Scholar] [CrossRef]
  4. Tang, S.W.; Yao, Y.; Andrade, C.; Li, Z.J. Recent durability studies on concrete structure. Cem. Concr. Res. 2015, 78, 143–154. [Google Scholar] [CrossRef]
  5. Shi, X.M.; Xie, N.; Fortune, K.; Gong, J. Durability of steel reinforced concrete in chloride environments: An overview. Constr. Build. Mater. 2012, 30, 125–138. [Google Scholar] [CrossRef]
  6. Glass, G.K.; Buenfeld, N.R. The presentation of the chloride threshold level for corrosion of steel in concrete. Corros. Sci. 1997, 39, 1001–1013. [Google Scholar] [CrossRef]
  7. Cao, Y.; Gehlen, C.; Angstc, U.; Wang, L.; Wang, Z.D.; Yao, Y. Critical chloride content in reinforced concrete—An updated review considering Chinese experience. Cem. Concr. Res. 2019, 117, 58–68. [Google Scholar] [CrossRef]
  8. Stefanoni, M.; Angst, U.; Elsener, B. Corrosion rate of carbon steel in carbonated concrete–A critical review. Cem. Concr. Res. 2018, 103, 35–48. [Google Scholar] [CrossRef]
  9. Liu, M.; Cheng, X.Q.; Li, X.G.; Zhou, C.; Tan, H.L. Effect of carbonation on the electrochemical behavior of corrosion resistance low alloy steel rebars in cement extract solution. Constr. Build. Mater. 2017, 130, 193–201. [Google Scholar] [CrossRef]
  10. Alonso, M.C.; Luna, F.J.; Criado, M. Corrosion behavior of duplex stainless steel reinforcement in ternary binder concrete exposed to natural chloride penetration. Constr. Build. Mater. 2019, 199, 385–395. [Google Scholar] [CrossRef]
  11. Williamson, J.; Isgor, O.B. The effect of simulated concrete pore solution composition and chlorides on the electronic properties of passive films on carbon steel rebar. Corros. Sci. 2016, 106, 82–95. [Google Scholar] [CrossRef]
  12. Ai, Z.Y.; Jiang, J.Y.; Sun, W.; Jiang, X.L.; Yu, B.; Wang, K.; Zhang, Z.F.; Song, D.; Ma, H.; Zhang, J.C. Enhanced passivation of alloy corrosion-resistant steel Cr10Mo1 under carbonation–Passive film formation, the kinetics and mechanism analysis. Cem. Concr. Compos. 2018, 92, 178–187. [Google Scholar] [CrossRef]
  13. Liu, M.; Cheng, X.Q.; Li, X.G.; Jin, Z.; Liu, H.X. Corrosion behavior of Cr modified HRB400 steel rebar in simulated concrete pore solution. Constr. Build. Mater. 2015, 93, 884–890. [Google Scholar] [CrossRef]
  14. Ghods, P.; Isgor, O.B.; Carpenter, G.J.C.; Li, J.; McRae, G.A.; Gu, G.P. Nano-scale study of passive films and chloride-induced depassivation of carbon steel rebar in simulated concrete pore solutions using FIB/TEM. Cem. Concr. Res. 2013, 47, 55–68. [Google Scholar] [CrossRef]
  15. Imperatore, S.; Rinaldi, Z.; Drago, C. Degradation relationships for the mechanical properties of corroded steel rebars. Constr. Build. Mater. 2017, 148, 219–230. [Google Scholar] [CrossRef]
  16. Martinez-Echevarria, M.J.; Lopez-Alonso, M.; Romero, D.C.; Montero, J.R. Influence of the previous state of corrosion of rebars in predicting the service life of reinforced concrete structures. Constr. Build. Mater. 2018, 188, 915–923. [Google Scholar] [CrossRef]
  17. Gonzalez, J.A.; Ramírez, E.; Bautista, A.; Feliu, S. The behaviour of pre-rusted steel in concrete. Cem. Concr. Res. 1996, 26, 501–511. [Google Scholar] [CrossRef]
  18. Sun, X.Y.; Kong, H.T.; Wang, H.L.; Zhang, Z.C. Evaluation of corrosion characteristics and corrosion effects on the mechanical properties of reinforcing steel bars based on three-dimensional scanning. Corros. Sci. 2018, 142, 284–294. [Google Scholar] [CrossRef]
  19. González, J.A.; Miranda, J.M.; Otero, E.; Feliu, S. Effect of electrochemically reactive rust layers on the corrosion of steel in a Ca(OH)2 solution. Corros. Sci. 2007, 49, 438–448. [Google Scholar] [CrossRef]
  20. Bensabra, H.; Azzouz, N. Study of rust effect on the corrosion behavior of reinforcement steel using impedance spectroscopy. Metall. Mater. Trans. A 2013, 44, 5703–5710. [Google Scholar] [CrossRef]
  21. Miranda, J.M.; González, J.A.; Cobo, A.; Otero, E. Several questions about electrochemical rehabilitation methods for reinforced concrete structures. Corros. Sci. 2006, 48, 2172–2188. [Google Scholar] [CrossRef]
  22. Novak, P.; Mala, R.; Joska, L. Influence of pre-rusting on steel corrosion in concrete. Cem. Concr. Compos. 2001, 31, 589–593. [Google Scholar]
  23. Papadopoulos, M.P.; Apostolopoulos, C.A.; Zervaki, A.D.; Haidemenopoulos, G.N. Corrosion of exposed rebars, associated mechanical degradation and correlation with accelerated corrosion tests. Constr. Build. Mater. 2011, 25, 3367–3374. [Google Scholar] [CrossRef]
  24. AI-Tayyib, A.J.; Shamim Khan, M.; Allam, I.M.; AI-Mana, A.I. Corrosion behavior of pre-rusted rebars after placement in concrete. Cem. Concr. Res. 1990, 20, 955–960. [Google Scholar] [CrossRef]
  25. Maslehuddin, M.; Al-Zahrani, M.; Al-Dulaijan, M.; Abdulquddus, S.U.; Rehman, S.; Ahsan, S.N. Effect of steel manufacturing process and atmospheric corrosion on the corrosion-resistance of steel bars in concrete. Cem. Concr. Compos. 2002, 24, 151–158. [Google Scholar] [CrossRef]
  26. Abd El Haleem, S.M.; Abd El Aal, E.E.; Abd El Wanees, S.; Diab, A. Environmental factors affecting the corrosion behaviour of reinforcing steel: I. The early stage of passive film formation in Ca(OH)2 solutions. Corros. Sci. 2010, 52, 3875–3882. [Google Scholar]
  27. Duarte, R.G.; Castela, A.S.; Neves, R.; Freire, L.; Montemor, M.F. Corrosion behavior of stainless steel rebars embedded in Concrete: an electrochemical impedance spectroscopy study. Electrochim. Acta 2014, 124, 218–224. [Google Scholar] [CrossRef]
  28. Asunción, B.; Velasco, F.; Manuel, T.C. Influence of the Alkaline Reserve of Chloride-containing Mortars on the 6-Year Corrosion Behavior of Corrugated UNS S32304 and S32001 Stainless Steels. Metals 2019, 9, 686. [Google Scholar]
  29. Shi, T.; Zheng, L.W.; Xu, X.C. Evaluation of alkali reactivity of concrete aggregates via AC impedance spectroscopy. Constr. Build. Mater. 2017, 145, 548–554. [Google Scholar] [CrossRef]
  30. Vedalakshmi, R.; Palaniswamy, N. Analysis of the electrochemical phenomenon at the rebar-concrete interface using the electrochemical impedance spectroscopic technique. Mag. Concr. Res. 2010, 62, 177–189. [Google Scholar] [CrossRef]
  31. Dong, B.Q.; Shi, G.Y.; Dong, P.; Ding, W.J.; Teng, X.J.; Qin, S.F.; Liu, Y.Q.; Xing, F.; Hong, S.X. Visualized tracing of rebar corrosion evolution in concrete with x-ray micro-computed tomography method. Cem. Concr. Compos. 2018, 92, 102–109. [Google Scholar] [CrossRef]
  32. Dong, B.Q.; Fang, G.H.; Liu, Y.Q.; Dong, P.; Zhang, J.C.; Xing, F.; Hong, S.X. Monitoring reinforcement corrosion and corrosion-induced cracking by X-ray microcomputed tomography method. Cem. Concr. Res. 2017, 100, 311–321. [Google Scholar] [CrossRef]
  33. Lee, H.S.; Yang, H.M.; Singh, J.K.; Prasad, S.K.; Yoo, B. Corrosion mitigation of steel rebars in chloride contaminated concrete pore solution using inhibitor: An electrochemical investigation. Constr. Build. Mater. 2018, 173, 443–451. [Google Scholar] [CrossRef]
  34. Wei, J.; Dong, J.H.; Ke, W. The influence of cooling processes on the corrosion performance of the rebar scale. Constr. Build. Mater. 2010, 24, 275–282. [Google Scholar] [CrossRef]
  35. Sun, W.; Tieu, A.K.; Jiang, Z.; Lu, C.; Zhu, H. Surface characteristics of oxide scale in hot strip rolling. J. Mater. Process Technol. 2003, 140, 76–83. [Google Scholar] [CrossRef]
  36. Burke, D.P.; Higginson, R.L. Characterization of multi-component scale by electron back scattered diffraction (EBSD). Scripta Mater. 2000, 42, 277–281. [Google Scholar] [CrossRef]
  37. Zhao, Y.X.; Wu, Y.Y.; Jin, W.L. Distribution of millscale on corroded steel bars and penetration of steel corrosion products in concrete. Corros. Sci. 2013, 66, 160–168. [Google Scholar] [CrossRef]
  38. Song, D.; Sun, W.; Jiang, J.Y.; Ma, H.; Zhang, J.C.; Chen, Z.J. Corrosion Behavior of Cr Micro-alloyed Corrosion-resistant Rebar in Neutral Cl-containing Environment. J. Iron Steel Res. Int. 2016, 23, 608–617. [Google Scholar] [CrossRef]
  39. Zhao, Y.X.; Ren, H.Y.; Dai, H.; Jin, W.L. Composition and expansion coefficient of rust based on X-ray diffraction and thermal analysis. Corros. Sci. 2011, 53, 1646–1658. [Google Scholar] [CrossRef]
  40. Zhao, Y.X.; Yu, J.; Wu, Y.Y.; Jin, W.L. Critical thickness of rust layer at inner and out surface cracking of concrete cover in reinforced concrete structures. Corros. Sci. 2012, 59, 316–323. [Google Scholar] [CrossRef]
  41. Zhua, K.Y.; Vasselb, A.; Brissetc, F.; Lud, K.; Lua, J. Nanostructure formation mechanism of a-titanium using SMAT. Acta Mater. 2004, 52, 4101–4110. [Google Scholar] [CrossRef]
  42. Ralston, K.D.; Birbilis, N.; Davies, C.H.J. Revealing the relationship between grain size and corrosion rate of metals. Scripta Mater. 2010, 63, 1201–1204. [Google Scholar] [CrossRef]
  43. Lv, Y.; Luo, H.Y.; Tang, J.; Guo, J.J.; Pi, J.L.; Ye, K.L. Corrosion properties of phase reversion induced nano/ultrafine grained AISI 304 metastable austenite stainless steel. Mater. Res. Bullet. 2018, 107, 421–429. [Google Scholar] [CrossRef]
  44. Song, D.; Jiang, J.H.; Guan, X.N.; Qiao, Y.X.; Li, X.B.; Chen, J.Q.; Sun, J.P.; Ma, A.B. Effect of Surface Nanocrystallization on Corrosion Resistance of the Conformed Cu–0.4%Mg Alloy in NaCl Solution. Metals 2018, 8, 765. [Google Scholar] [CrossRef]
Figure 1. Schematic illustration of the sand blasting process (a) and the wire brushing process (b) of rebar and physical images of the rebar with different surface states (c).
Metals 09 01050 g001
Figure 2. Open circuit potention (OCP) time variation curves of the steel rebar in the simulated concrete pore solutions of different alkalinity: (ac) The curves obtained from the initial passivation for 2 h. (df) The curves obtained from the continuous immersion for 10 days.
Metals 09 01050 g002
Figure 3. Electrochemical impedance spectroscopy (EIS) Nyquist plots of the rebar in Cl-free simulated concrete pore solutions (SCPS) of different alkalinity: (a) pH 13.6, (b) pH 12.5, and (c) pH 11.
Metals 09 01050 g003
Figure 4. Fitted Rt values of the rebar during passivation in SCPS of different alkalinity for 2 h and 10 days.
Metals 09 01050 g004
Figure 5. OCP evolution curves of the rebar immersed in the Cl-contained SCPS of different alkalinity: (a) pH 13.6, (b) pH 12.5, and (c) pH 11.
Metals 09 01050 g005
Figure 6. EIS Nyquist plots of the rebar in the Cl-containing SCPS of different alkalinity: (a) pH 13.6, (b) pH 12.5, and (c) pH 11.
Metals 09 01050 g006
Figure 7. Fitted Rt values of the rebar in the Cl-containing SCPS of different alkalinity for different times.
Metals 09 01050 g007
Figure 8. Potentio-dynamic curves of the rebar after exposure to Cl-containing SCPS of different alkalinity for 40 days: (a) pH 13.6, (b) pH 12.5, and (c) pH 11.
Metals 09 01050 g008
Figure 9. SEM cross-sectional surface microstructures of different rebars: (a) as-received, (b) rusted, (c) sand-blasted, and (d) wire-brushed.
Metals 09 01050 g009
Figure 10. TEM microstructure characteristics of the wire-brushed rebar: (a) grain morphologies with a low magnification and selected-area electron diffraction and (b) detailed microstructure characteristics of the deformed nanograins with a high magnification.
Metals 09 01050 g010
Figure 11. SEM top-view surface microstructures of different rebars: (a) as-received, (b) rusted, (c) sand-blasted, and (d) wire-brushed.
Metals 09 01050 g011
Table 1. Chemical composition of 20 MnSiV carbon-steel rebar (mass fraction %).
FeCSiMnCrSPNiCuV
Balance0.221.440.020.0220.0250.0250.010.010.038
Table 2. Chemical compositions of the simulated concrete pore solutions.
Simulated Concrete Pore SolutionsConcentration (mol∙dm−3)pH Value
Ca(OH)2NaOHKOHNaHCO3
pH–13.6 SCPS0.0010.20.6013.6
pH–12.5 SCPSsaturated00012.5
pH–11 SCPSsaturated00appropriate11
Table 3. The electrochemical parameters of the potentio-dynamic polarization (PDP) curves.
Rebar Sample and Cl-Containing SCPSEcorr (mVSCE)icorr (μA∙cm−2)Corrosion Rate (μm∙y−1)Epit (mVSCE)
as-receivedpH–13.6–129 ± 60.106 ± 0.0051.229 ± 0.058458 ± 15
pH–12.5–395 ± 101.250 ± 0.00814.495 ± 0.093−8 ± 20
pH–11−420 ± 102.220 ± 0.01025.743 ± 0.116−180 ± 10
rustedpH–13.6−214 ± 80.940 ± 0.00810.900 ± 0.096225 ± 13
pH–12.5−508 ± 134.060 ± 0.02347.078 ± 0.657−258 ± 15
pH–11−577 ± 138.510 ± 0.05598.681 ± 0.638-
sand-blastedpH–13.6−169 ± 50.122 ± 0.0051.415 ± 0.058415 ± 10
pH–12.5−406 ± 101.580 ± 0.00818.325 ± 0.093−35 ± 10
pH–11−467 ± 124.740 ± 0.02154.965 ± 0.244−270 ± 12
wire-brushedpH–13.6−111 ± 50.054 ± 0.0020.626 ± 0.023507 ± 17
pH–12.5−394 ± 101.095 ± 0.00612.697 ± 0.0695 ± 15
pH–11−440 ± 123.485 ± 0.02040.412 ± 0.232−240 ± 18

