Article

Effects of Annealing Temperature on Recrystallization Texture and Microstructure Uniformity of High Purity Tantalum

1
College of Materials Science and Engineering, Chongqing University, Chongqing 400044, China
2
Electron Microscopy Center of Chongqing University, Chongqing University, Chongqing 400044, China
*
Authors to whom correspondence should be addressed.
Metals 2019, 9(1), 75; https://doi.org/10.3390/met9010075
Submission received: 27 December 2018 / Revised: 9 January 2019 / Accepted: 11 January 2019 / Published: 12 January 2019

Abstract

:
One hundred and thirty-five degree clock rolling significantly improves the texture homogeneity of tantalum sheets along the thickness, but a distinctly fragmented substructure is formed within {111} (<111>//normal direction (ND)) and {100} (<100>//ND) deformation grains, which is not suitable to obtain a uniform recrystallization microstructure. Thus, effects of different annealing temperatures on the microstructure and texture heterogeneity of tantalum sheets along the thickness were investigated by X-ray diffraction (XRD), electron backscatter diffraction (EBSD) and transmission electron microscopy (TEM). Results show that the texture distribution along θ-fiber and γ-fiber is irregular and many large grains with {111} orientation develop during annealing at high temperature. However, low-temperature annealing can not only weaken the texture intensity in the surface and the center layer but also introduce a more uniform grain size distribution. This result can be attributed to the subgrain-nucleation-dominated recrystallization mechanism induced by recovery at low temperature, and moreover, a considerable decline of recrystallization driving force resulting from the release of stored energy in the deformation matrix.

1. Introduction

Tantalum is a refractory metal with a series of physical and chemical properties, such as excellent corrosion resistance and outstanding ductility, making it ideal for applications in microelectronics, such as sputtering targets. Recently, Ta sputtering target used in the integrated circuit (IC) industry to fabricate copper diffusion barrier has attracted more and more attention [1,2,3]. Early studies have confirmed that both grain size and crystallographic orientation can play an important role in the sputter deposition properties of Ta [4,5]. The deposition rate of thin film drops with increasing grain size, and the film thickness can be uniform only when the grain size is within a certain range [6]. Furthermore, the sputtering yield is expected to vary with the grain orientation in rank S(110) > S(100) > S(111) in Ta and other body-centered cubic (BCC) metals [5]. Therefore, the inhomogeneous distribution of grain orientation, i.e., texture gradient along the thickness, has an adverse effect on the deposition rate and the film thickness. To improve the uniformity of the deposited film, it is necessary to produce sputtering targets with fine and uniform grain size as well as random crystallographic orientation.
Electron-beam melting (EBM) is quite suitable and common to produce initial Ta ingots with superior purification capacity but contains many coarse columnar grains with cm-range size. Although conventional processing methods, such as cold rolling and forging aided by annealing, are favorable for refining the grain size, severe texture gradient is formed along the thickness [7]. A strong {111}<uvw> texture is formed in the center layer of Ta sheets can be found, while {100}<uvw> texture dominates in the surface layer processed only by the above method. Therefore, great efforts have focused on new processing methods, such as equal channel angular extrusion, to optimize the microstructure of high purity Ta [8,9]. Unfortunately, it is not particularly applicable in industry because of limitation in billet dimensions, especially for materials with a high hardness, e.g., Ta. Rolling has always been convenient and popular in many industrial applications to produce sheet materials. Recently, 135° clock rolling (sequentially changing the rolling direction by 135° around the normal direction), first introduced by Liu et al., can effectively weaken the rolling texture gradient along the thickness [10,11]. However, with regard to the effects of annealing temperature on the subsequent recrystallized texture and microstructure uniformity of Ta sheets, it is regretful that few studies have investigated this perspective [12]. Thus, the purpose of the current work is to explore appropriate annealing temperatures to generate a uniform recrystallization microstructure, i.e., grain size and orientations, along the thickness.

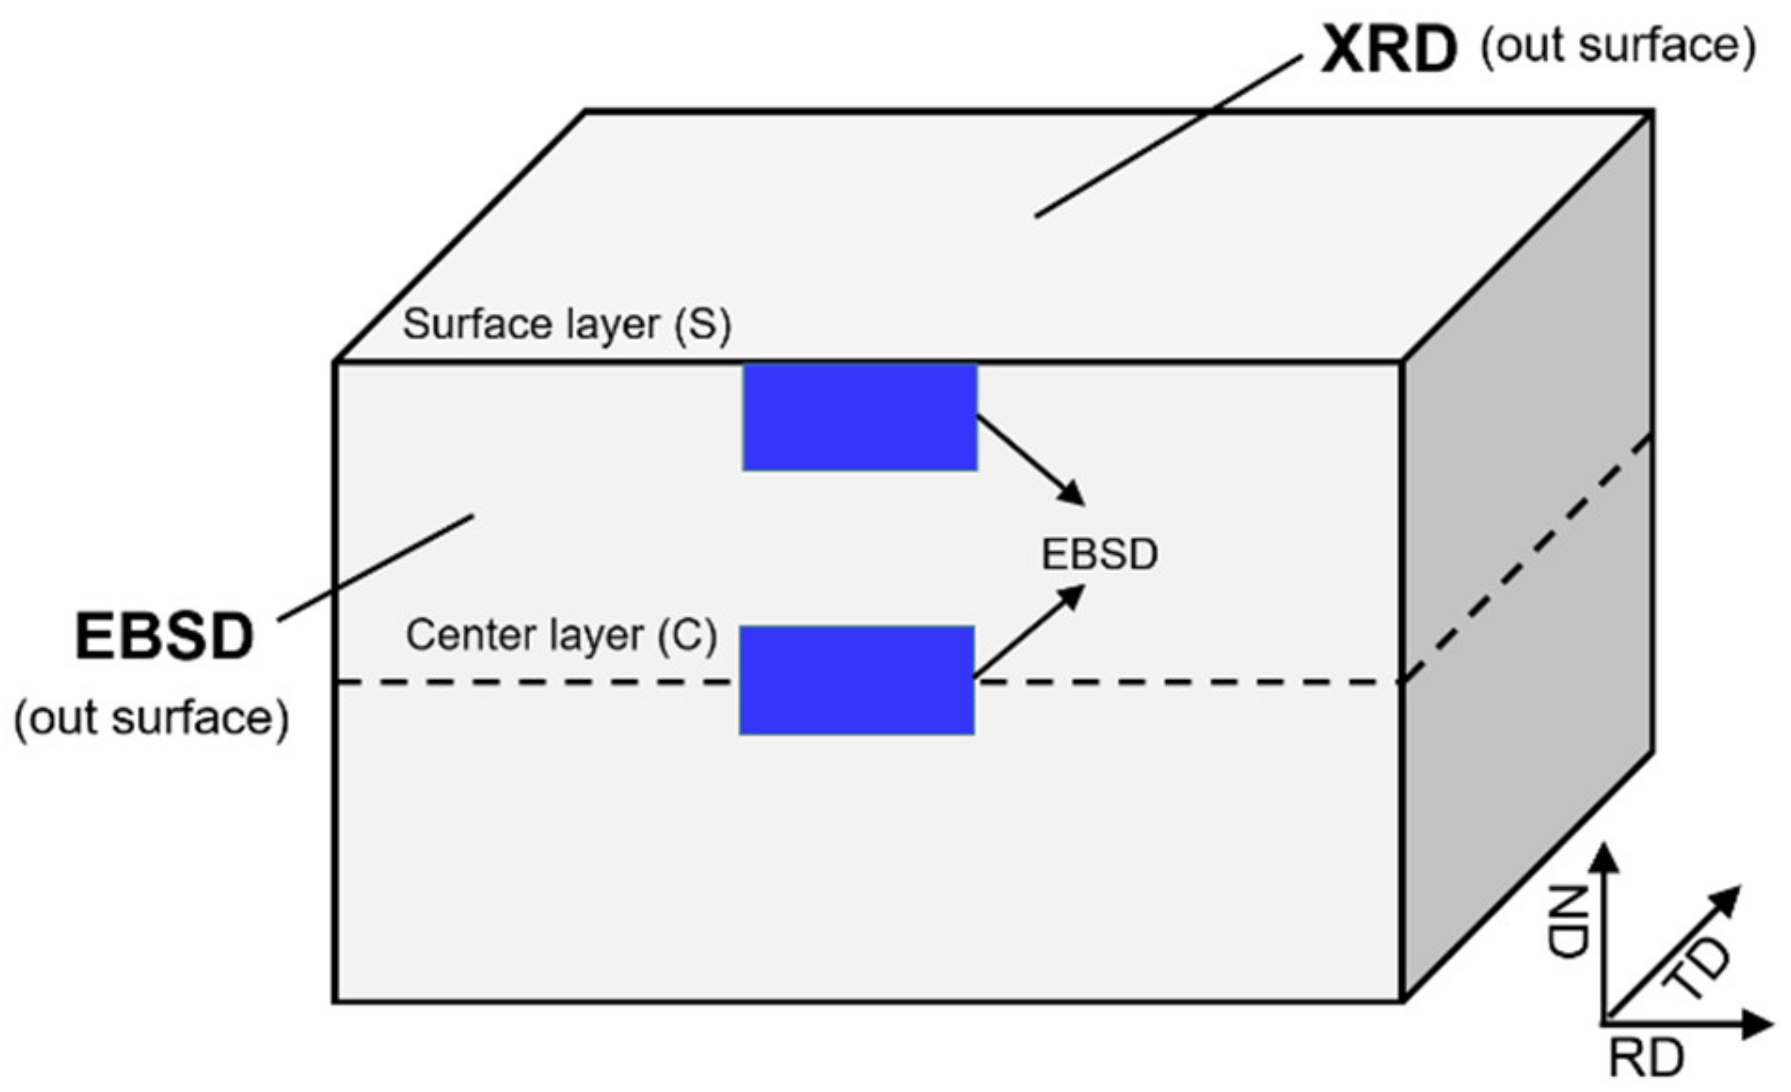
2. Experimental Method

A high purity (99.95 wt.%) tantalum ingot was obtained by EBM, and the chemical composition was determined by glow discharge mass spectrum, shown in Table 1. The initial tantalum ingot was processed by forging to a 20 mm thickness followed by annealing. Samples were 135°-clocked-rolled (CR) to 87% reduction in thickness, in 16 rolling passes. The detailed process and relevant rolling parameters have been described elsewhere [11]. Subsequent heat treatments were executed under vacuum at 1050 °C and 1200 °C for different times to obtain a fully recrystallized microstructure, and then these samples were immediately quenched into cold water.
X-ray diffraction (XRD) (Rigaku, Japan) was used to examine the deformed and recrystallized texture. The four incomplete pole figures {110}, {200}, {211}, and {222} were measured in the range of pole distance angle from 20° to 90° in back reflection mode using Cu Kα radiation. The detection region was in the rolling plane (i.e., plane containing the rolling direction (RD) and the transverse direction (TD)) in the surface (S) and the center layer (C), as shown in Figure 1. The orientation density functions (ODFs) are presented in plots of constant φ2 sections with iso-intensity contours in Euler space defined by the Euler angles φ1, φ and φ2.
Electron backscatter diffraction (EBSD) technique was employed to characterize the local microstructure in the longitudinal plane (i.e., plane containing the RD and normal direction (ND), see Figure 1). Sample preparation consisted of electrochemical polishing with 90 mL H2SO4 and 10 mL HF electrolyte for 9 min at 0.1 A/cm2. An Aztec EBSD system (Oxford instruments, Oxford, England) and an HKL Channel 5 software (5.0.9.0, Oxford, England) were used for data acquisition and analysis, respectively.
The dislocation morphology was observed using a JEOL JEM-2100 transmission electron microscope (TEM) (JEOL, Japan) with an operating voltage 200 kV. The specimens were jet polished in a mixing solution of HF, H2SO4, and CH3OH with a volume ratio of 1:5:94 at 273 K.

3. Results

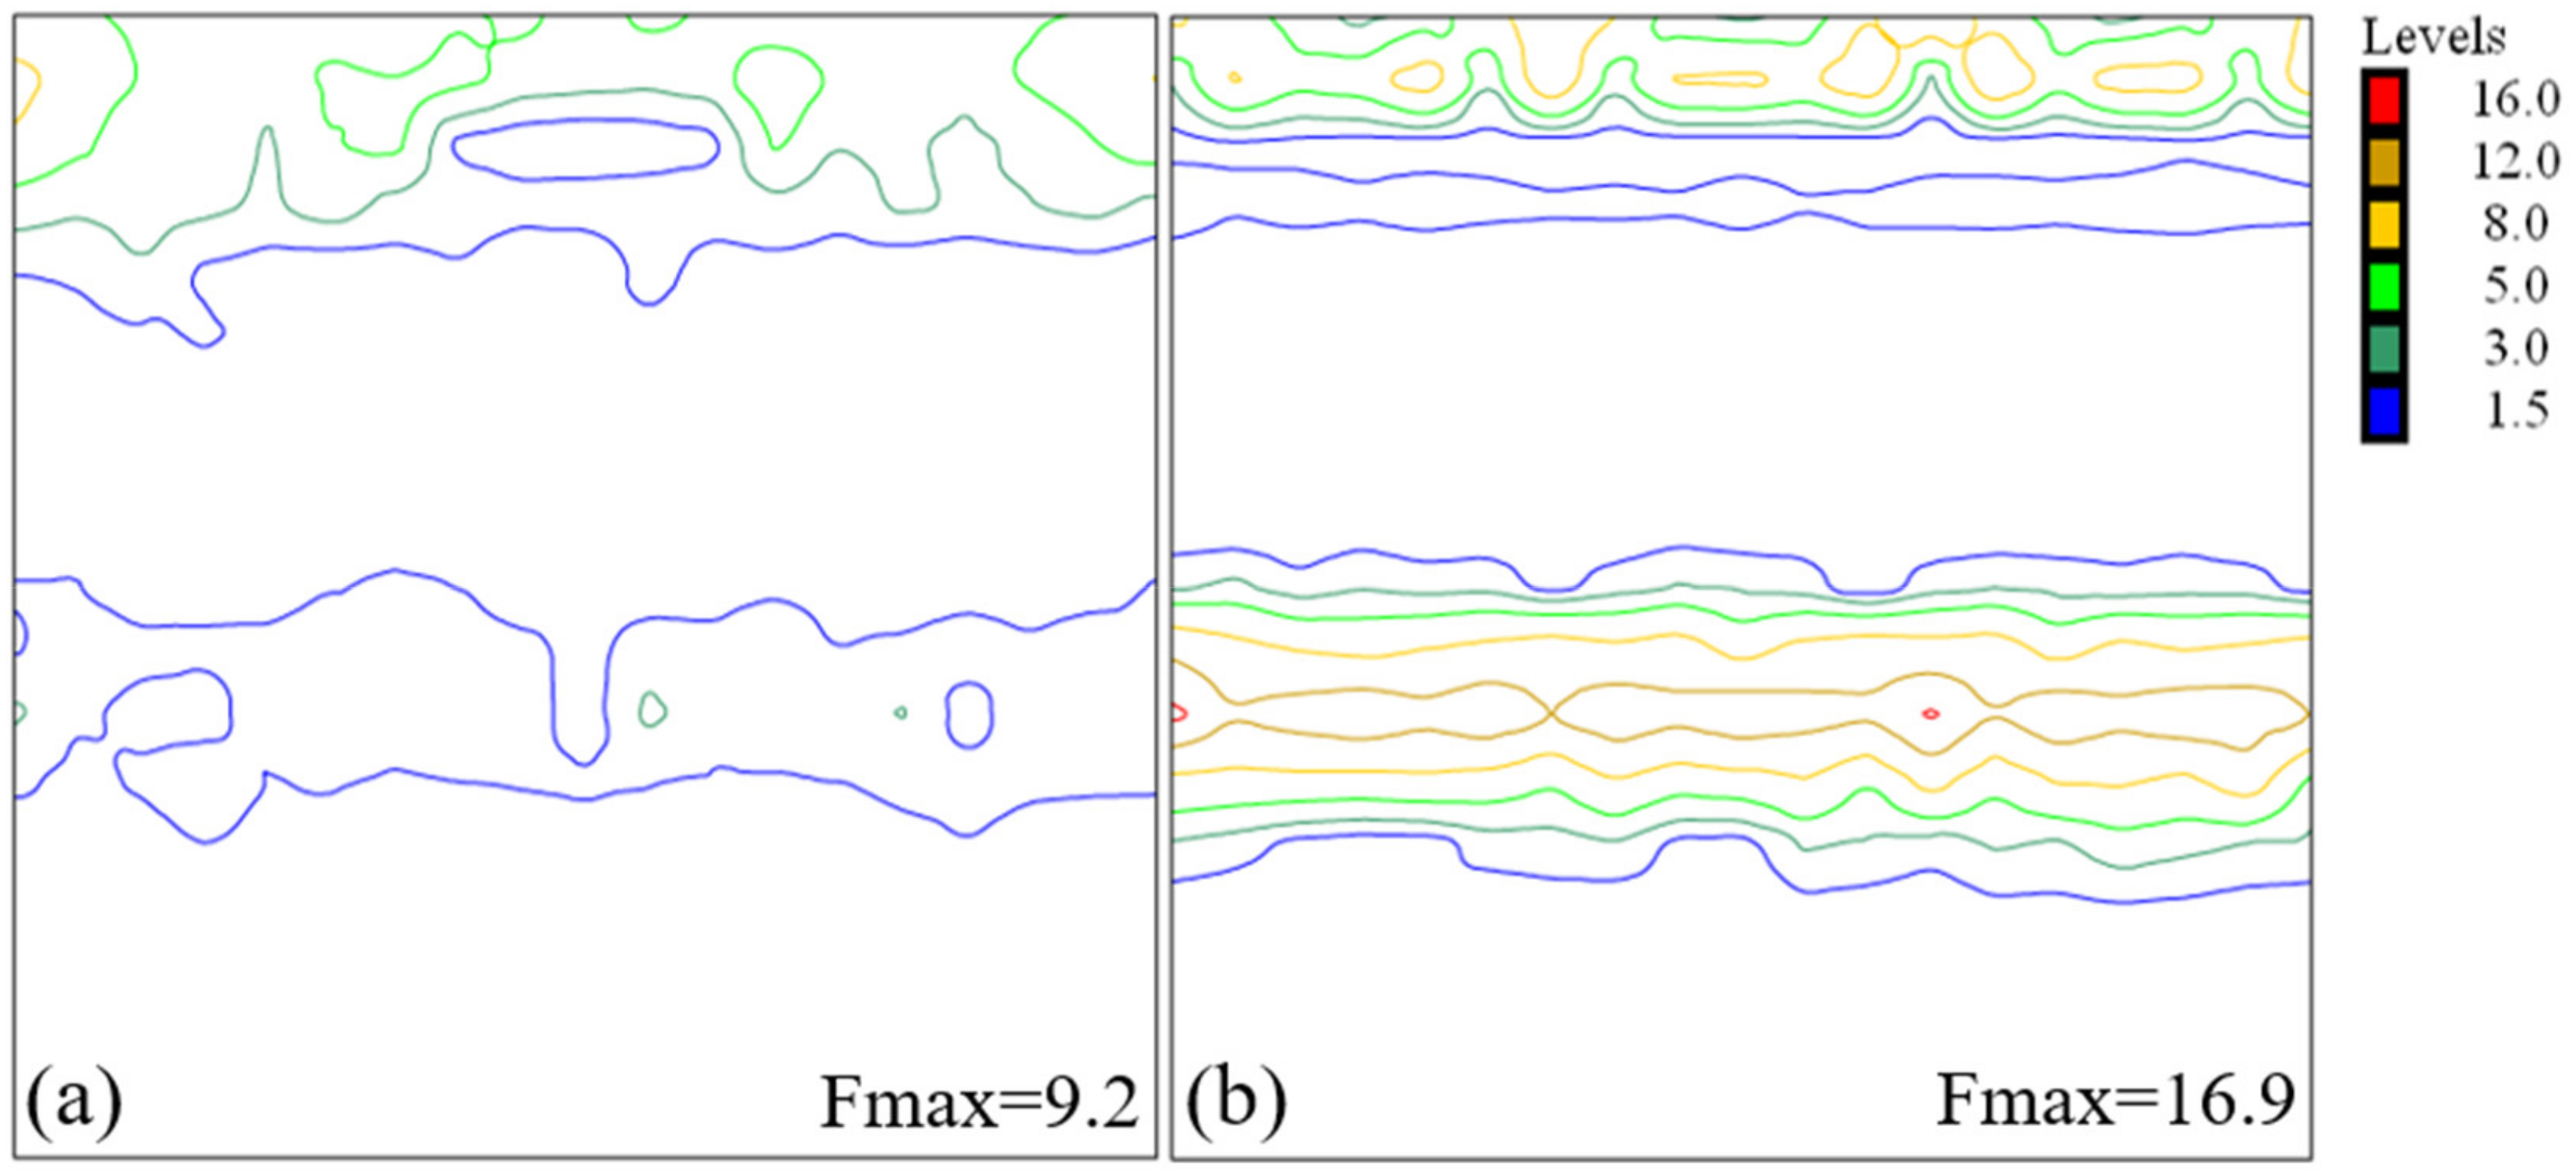
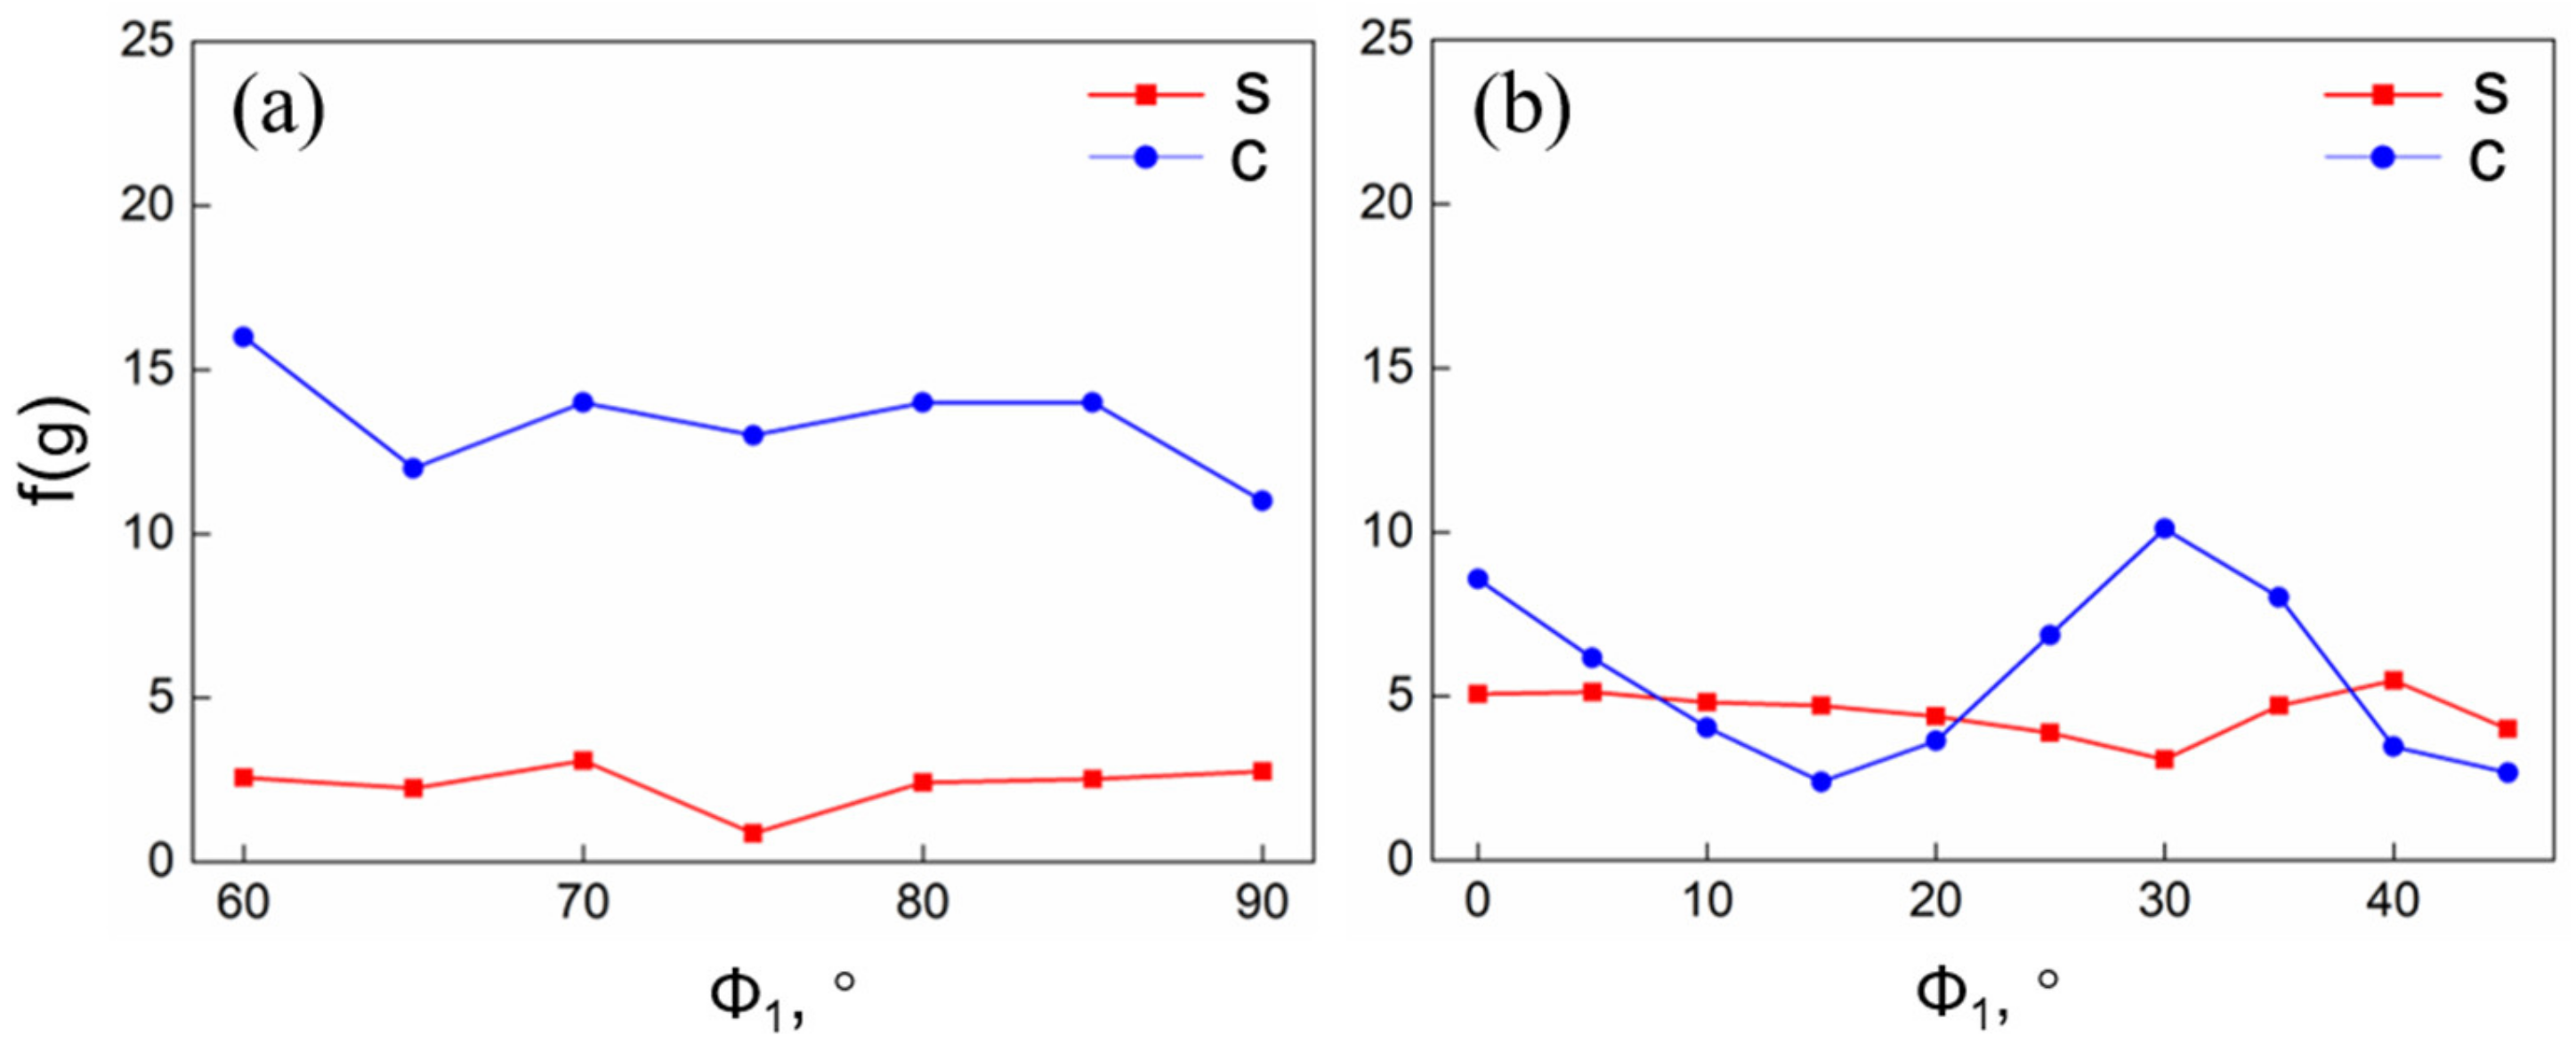
3.1. Deformation Texture

Body-centered cubic (BCC) rolled metals mainly consist of fiber texture, such as α-fiber (<110>//RD), γ-fiber (<111>//ND) and θ-fiber (<100>//ND) [13]. All the orientations within these three fibers can be revealed in the φ2 = 45° section in the Euler space [11]. After 87% reduction in thickness, the center layer of rolled Ta sheets showed a relative strong γ-fiber component, and the maximum intensity (f(g)) reached about 16.9, while the θ-fiber was weak, and the maximum f(g) value was 10.2, as shown in Figure 2a. Compared with the center layer, the surface layer exhibited more homogeneous γ-fiber and θ-fiber (Figure 2b), and the maximum f(g) value between them was approximately 4.8. To clarify the orientation difference along the γ and θ fibers, two orientation lines are displayed in Figure 3a,b. It can be found that the γ-fiber and θ-fiber are complete and the orientation distribution along the fibers is relatively uniform. Note that the initial Ta plate employed in this work was extremely inhomogeneous along the thickness [10]. More accurately, strong {100}<uvw> texture existed in the surface layer, and the maximum f(g) value was about 121.8, while the {111}<uvw> texture dominated in the center layer and the maximum f(g) value reached 54.3. Therefore, 135° clock rolling can effectively weaken the through-thickness texture gradient existing in the starting material, and moreover, homogenize the θ and γ fibers.

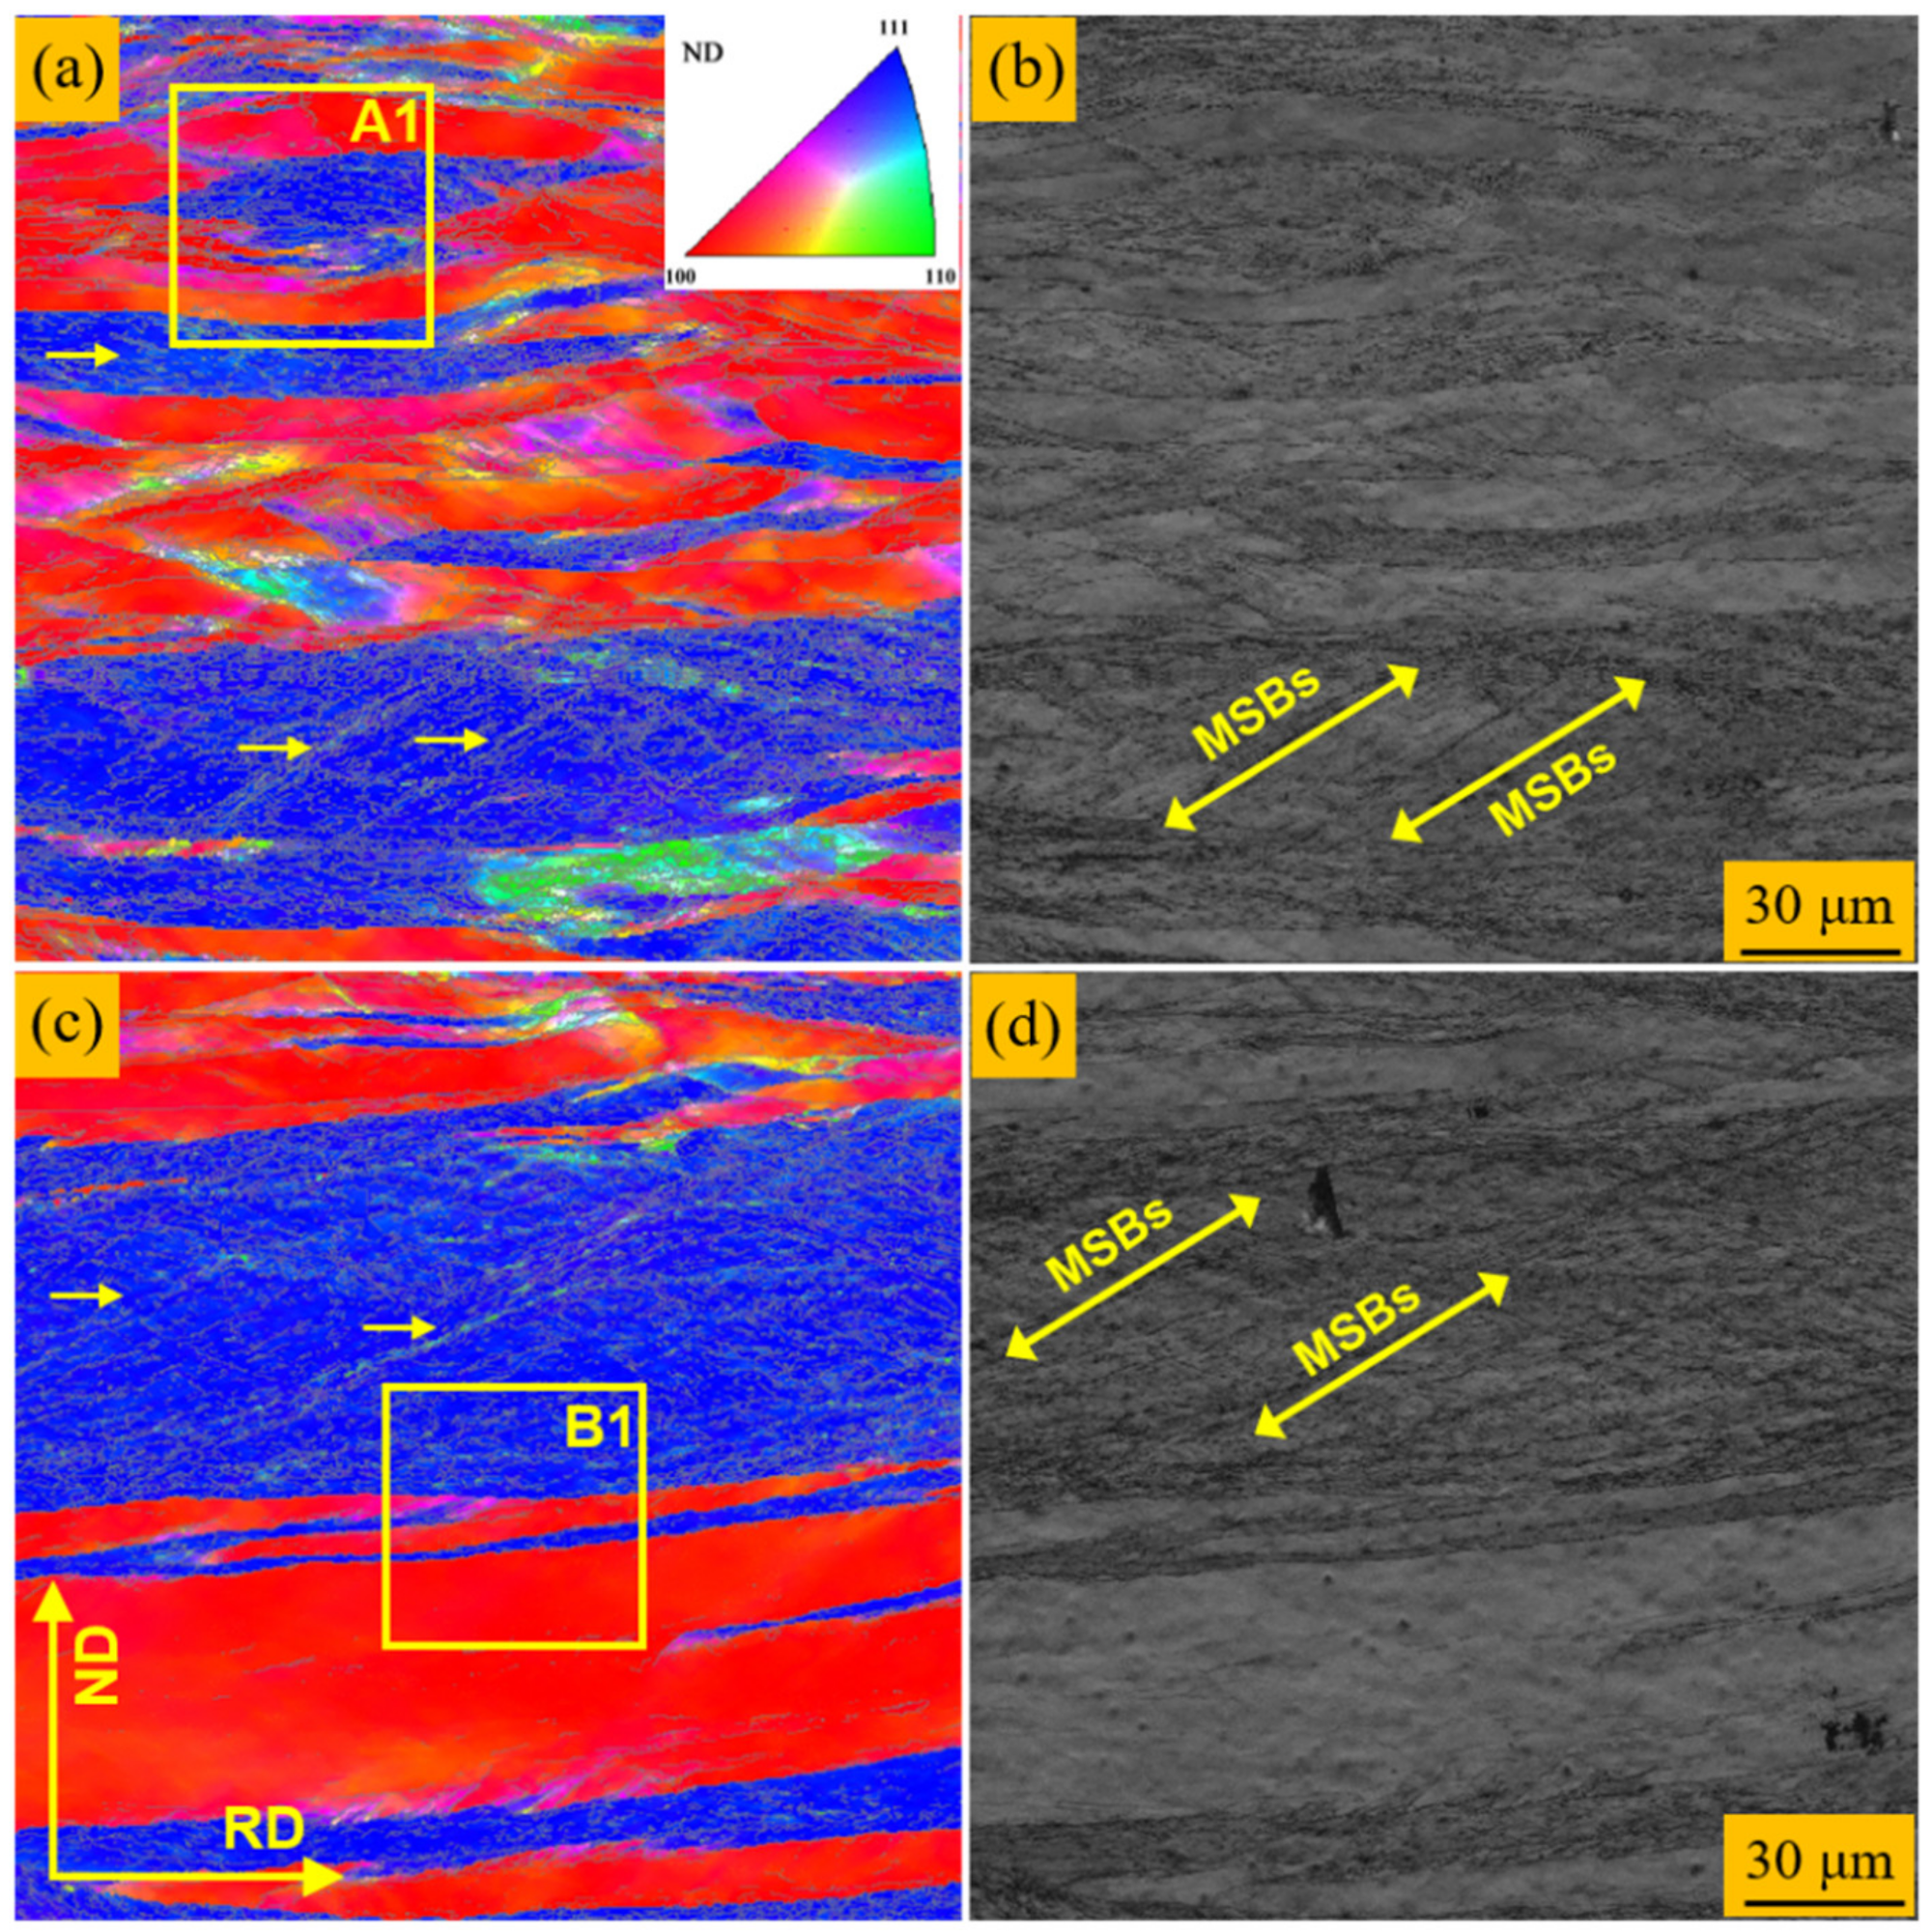
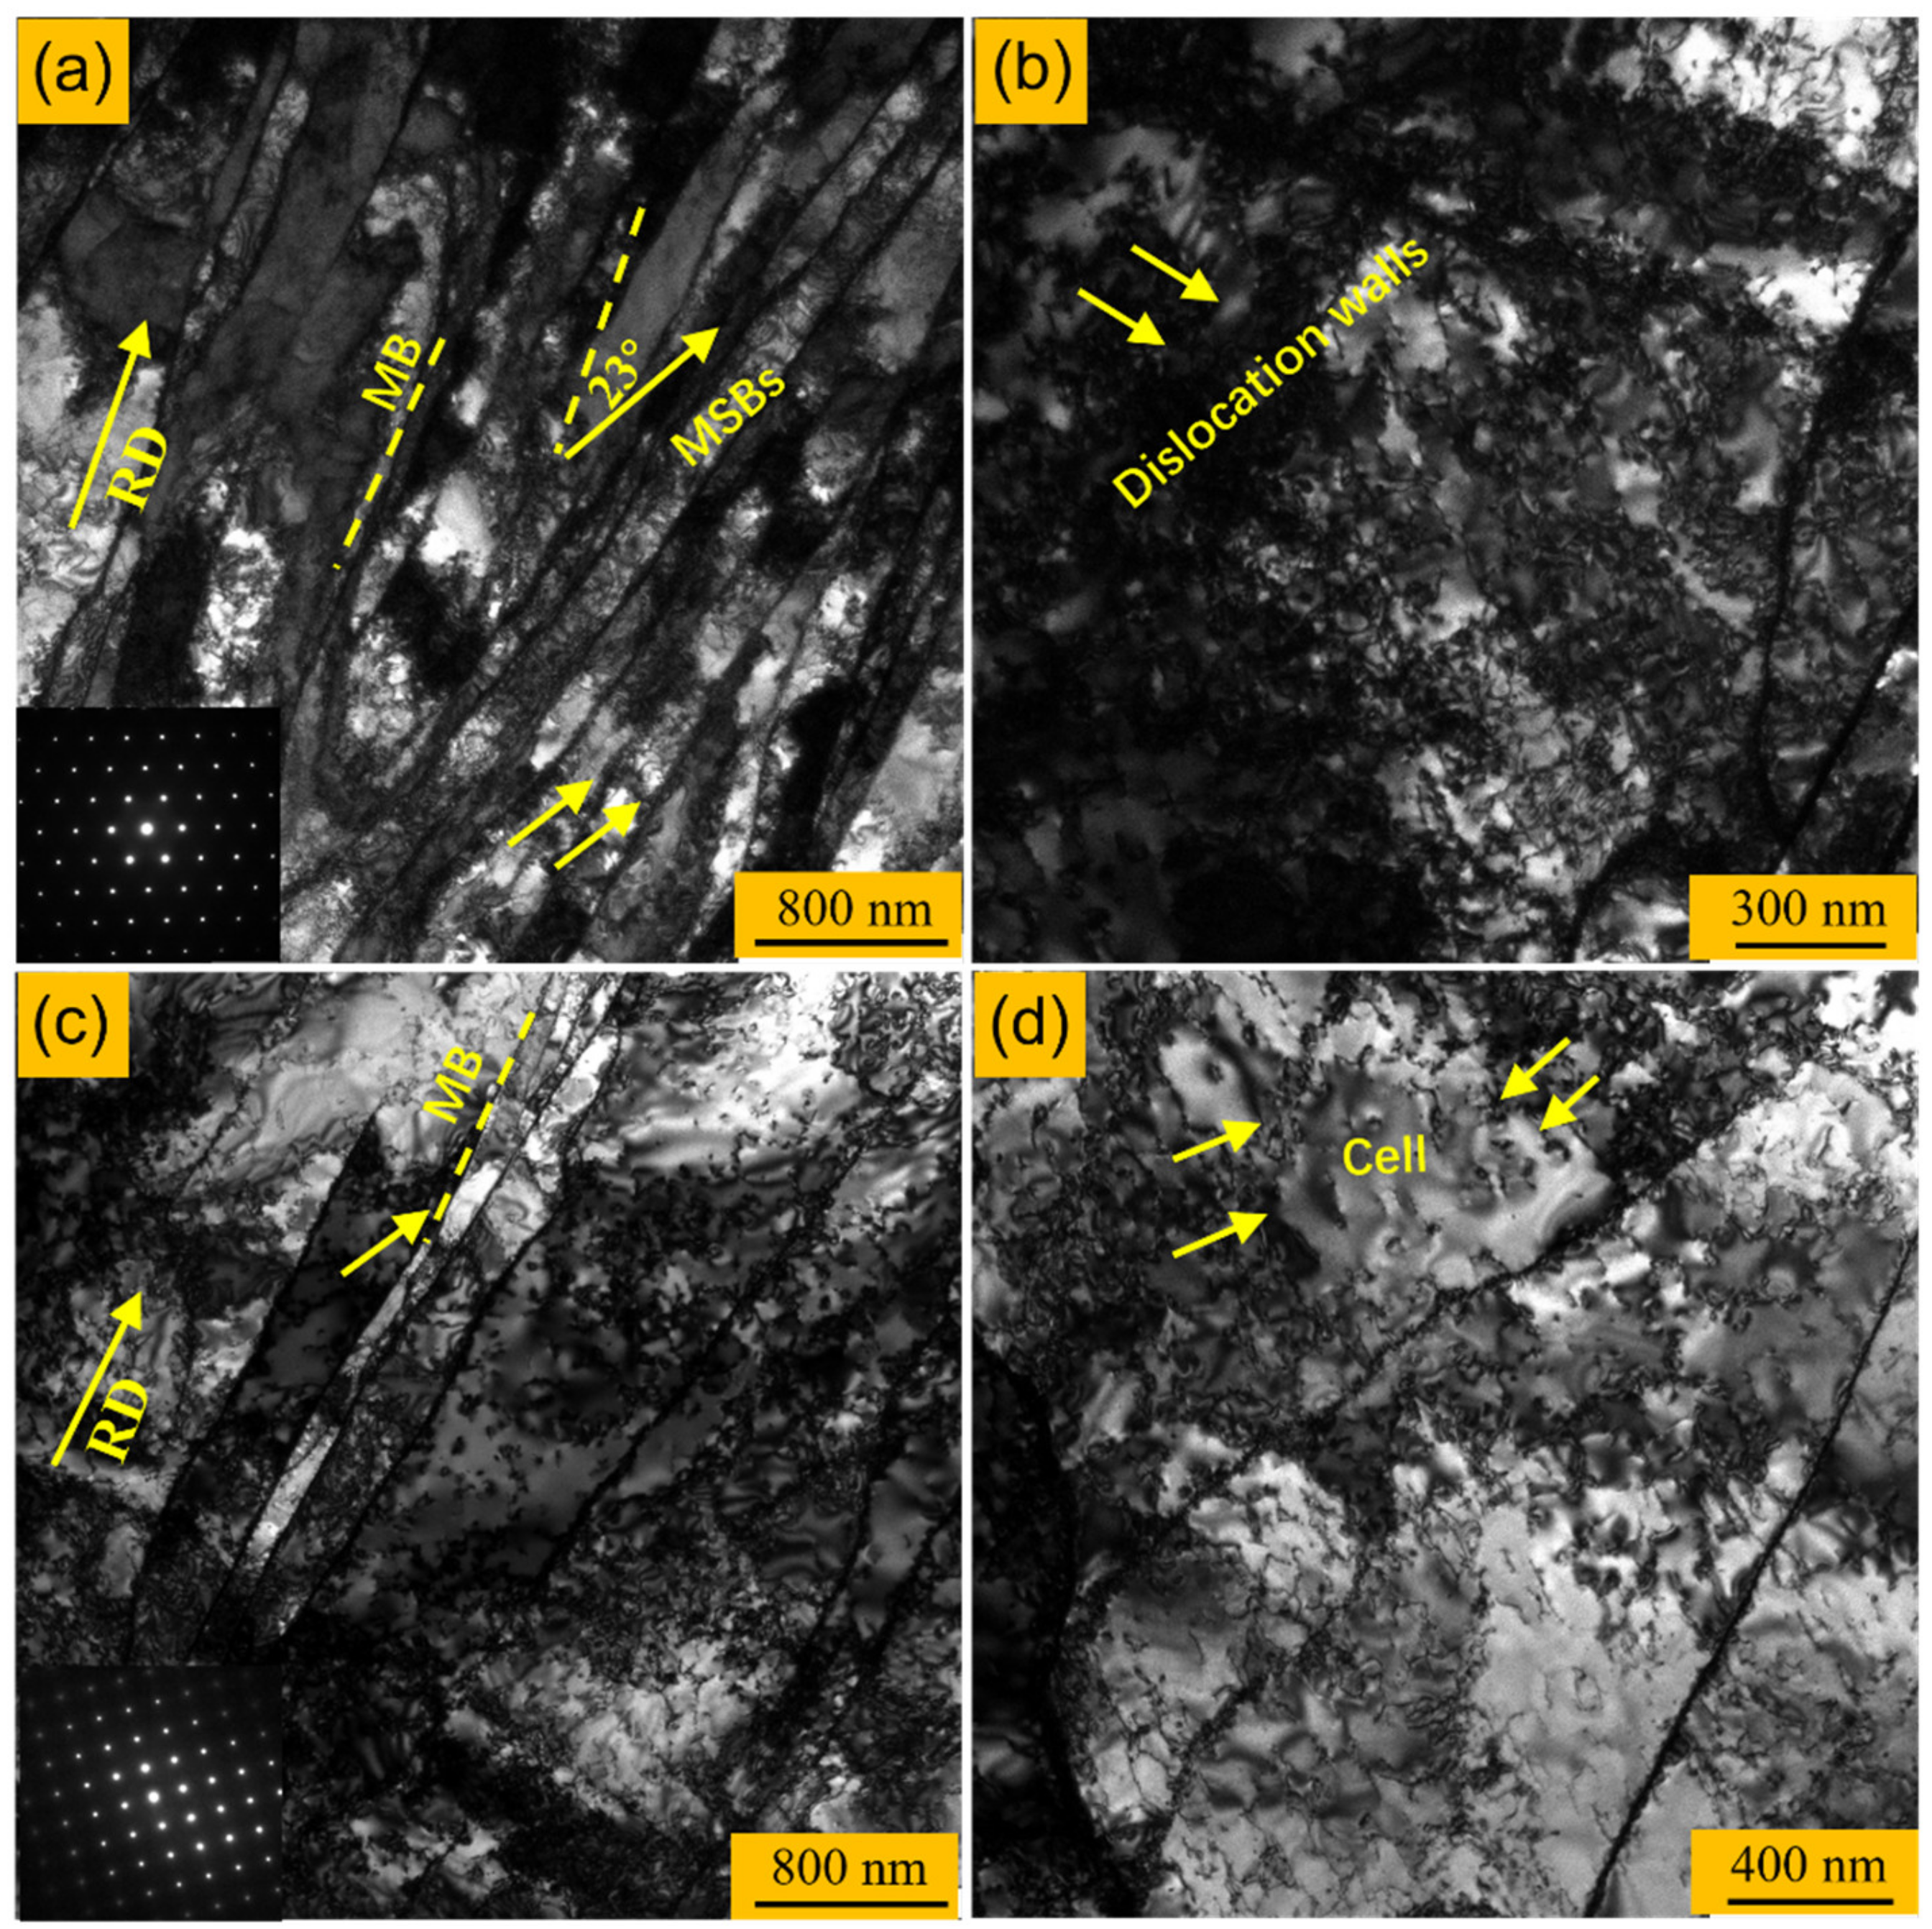
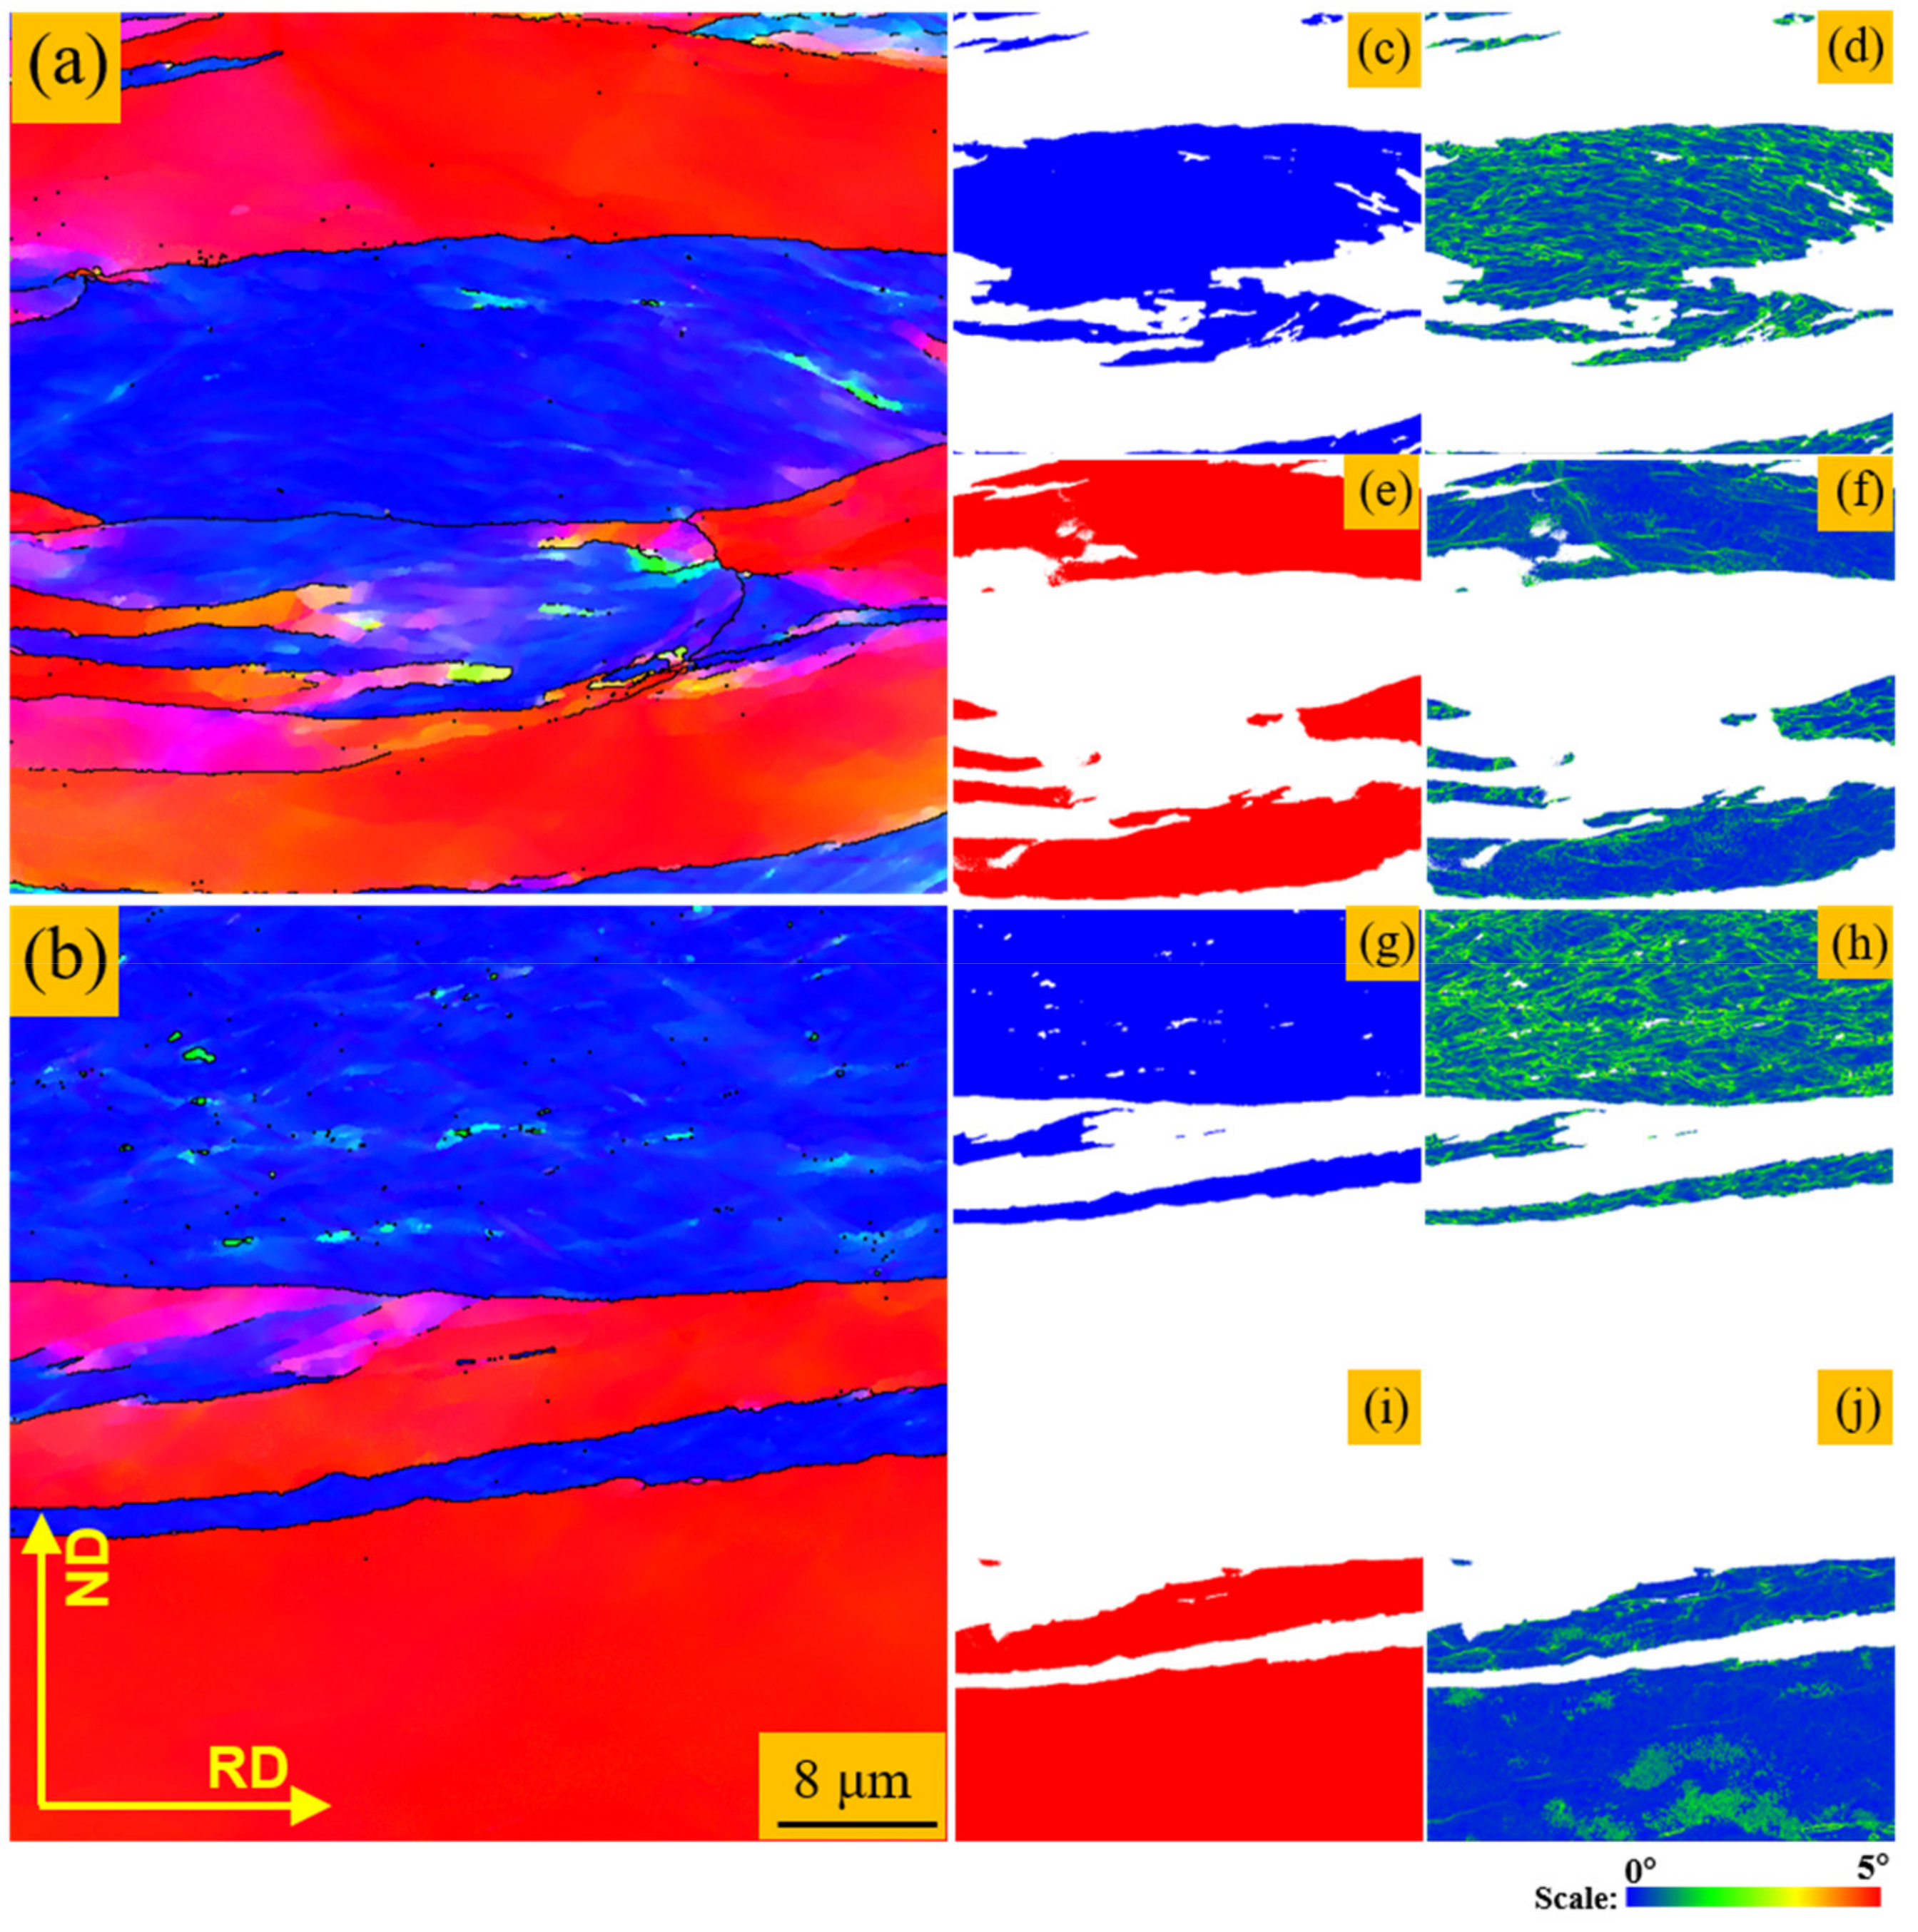
3.2. Deformation Microstructure

The deformation microstructure of 87% CR-Ta in the surface and the center layer are presented by orientation image map (OIM) and image quality in Figure 4. Low angle grain boundaries, or sub-boundaries, with misorientation angles between 2° and 15°, are depicted by solid gray lines. Apparently, the OIM from EBSD results indicate that the {111}<uvw> (<111>//ND) and {100}<uvw> (<100>//ND) are primary texture, which is consistent with the XRD measurements (Figure 2). The {111} and {100} elongated matrix in the center layer are much thicker than that in the surface layer. Moreover, the grain boundary morphology in CR sheets is different from that after conventional rolling. The grains in CR sheets exhibit a moderate bending and fluctuations along the RD direction, and even some {111} to {100} grain boundaries infiltrate and intertwine with each other, while the conventional rolled sample has relative planar grain boundaries [14]. Meanwhile, the deformation substructure within matrix varies greatly with the grain orientation, and many micro shear bands (MSBs), which usually appear as {110} <uvw> (<110>//ND) orientation, delineated by yellow oblique lines (Figure 4), exists within the {111} matrix [15]. Many sub-grain boundaries are easily aggregated near the MSBs, as revealed by yellow arrows in Figure 4. In addition, TEM observations further indicate a significant difference of dislocation morphology and density in the {111} and {100} matrix, as shown in Figure 5. Obviously, many micro shear bands and micro bands (MBs) significantly increase the dislocation density within the {111} matrix.

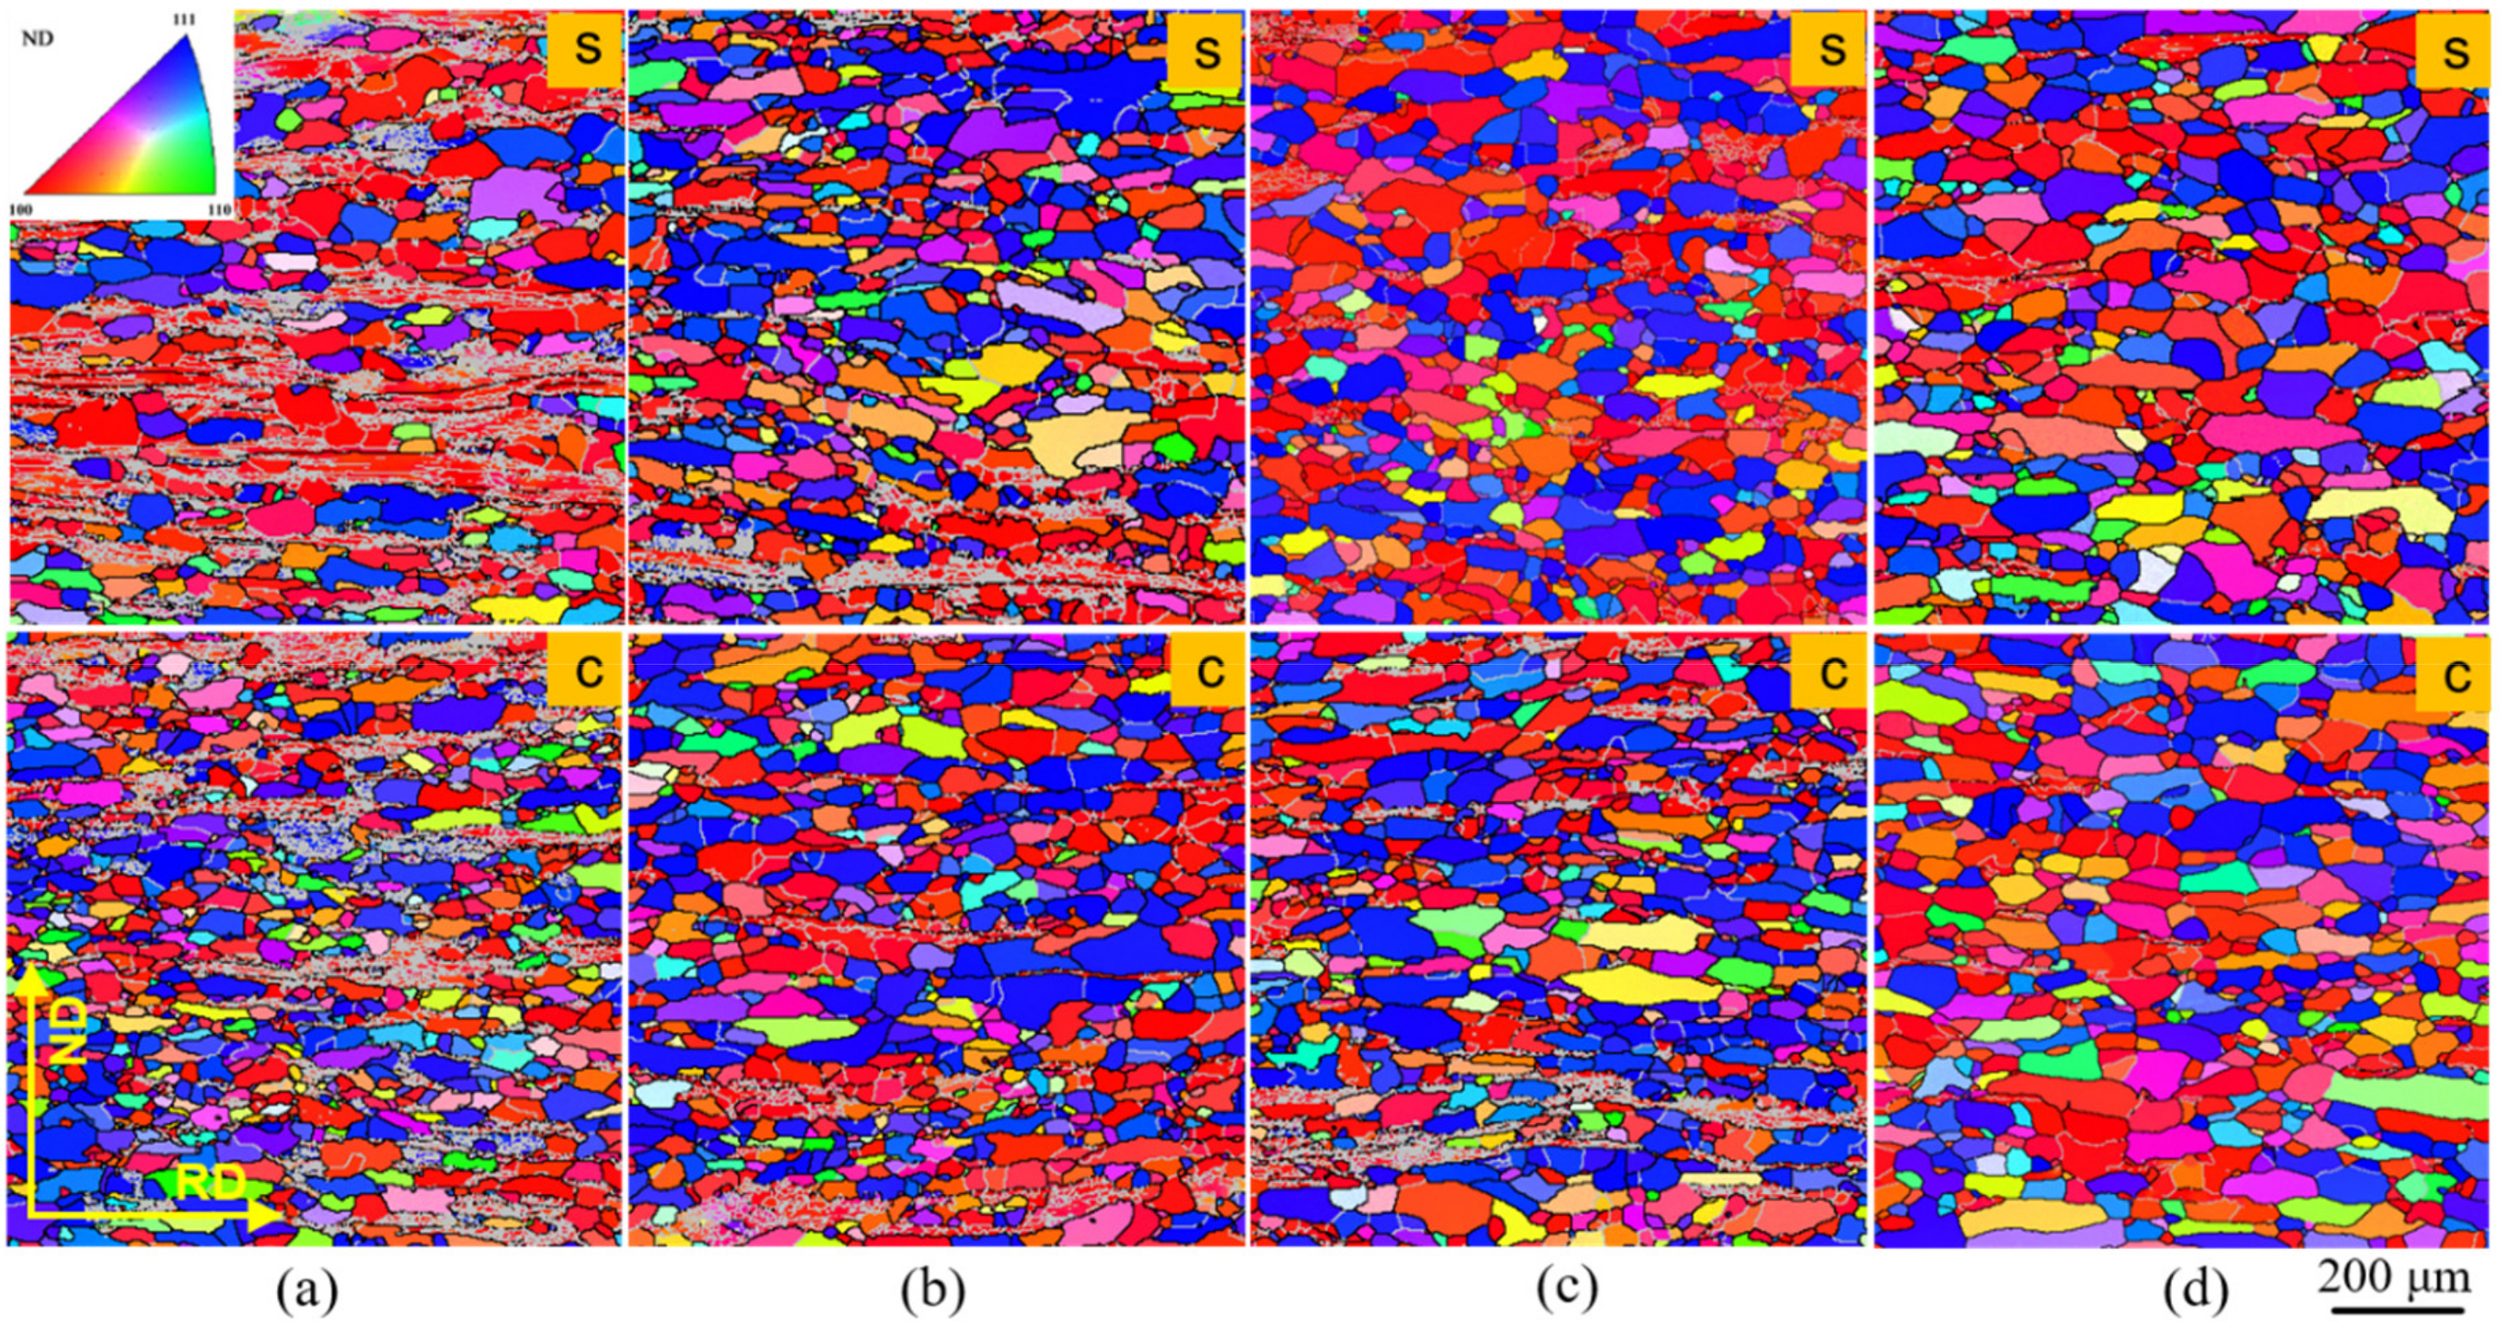
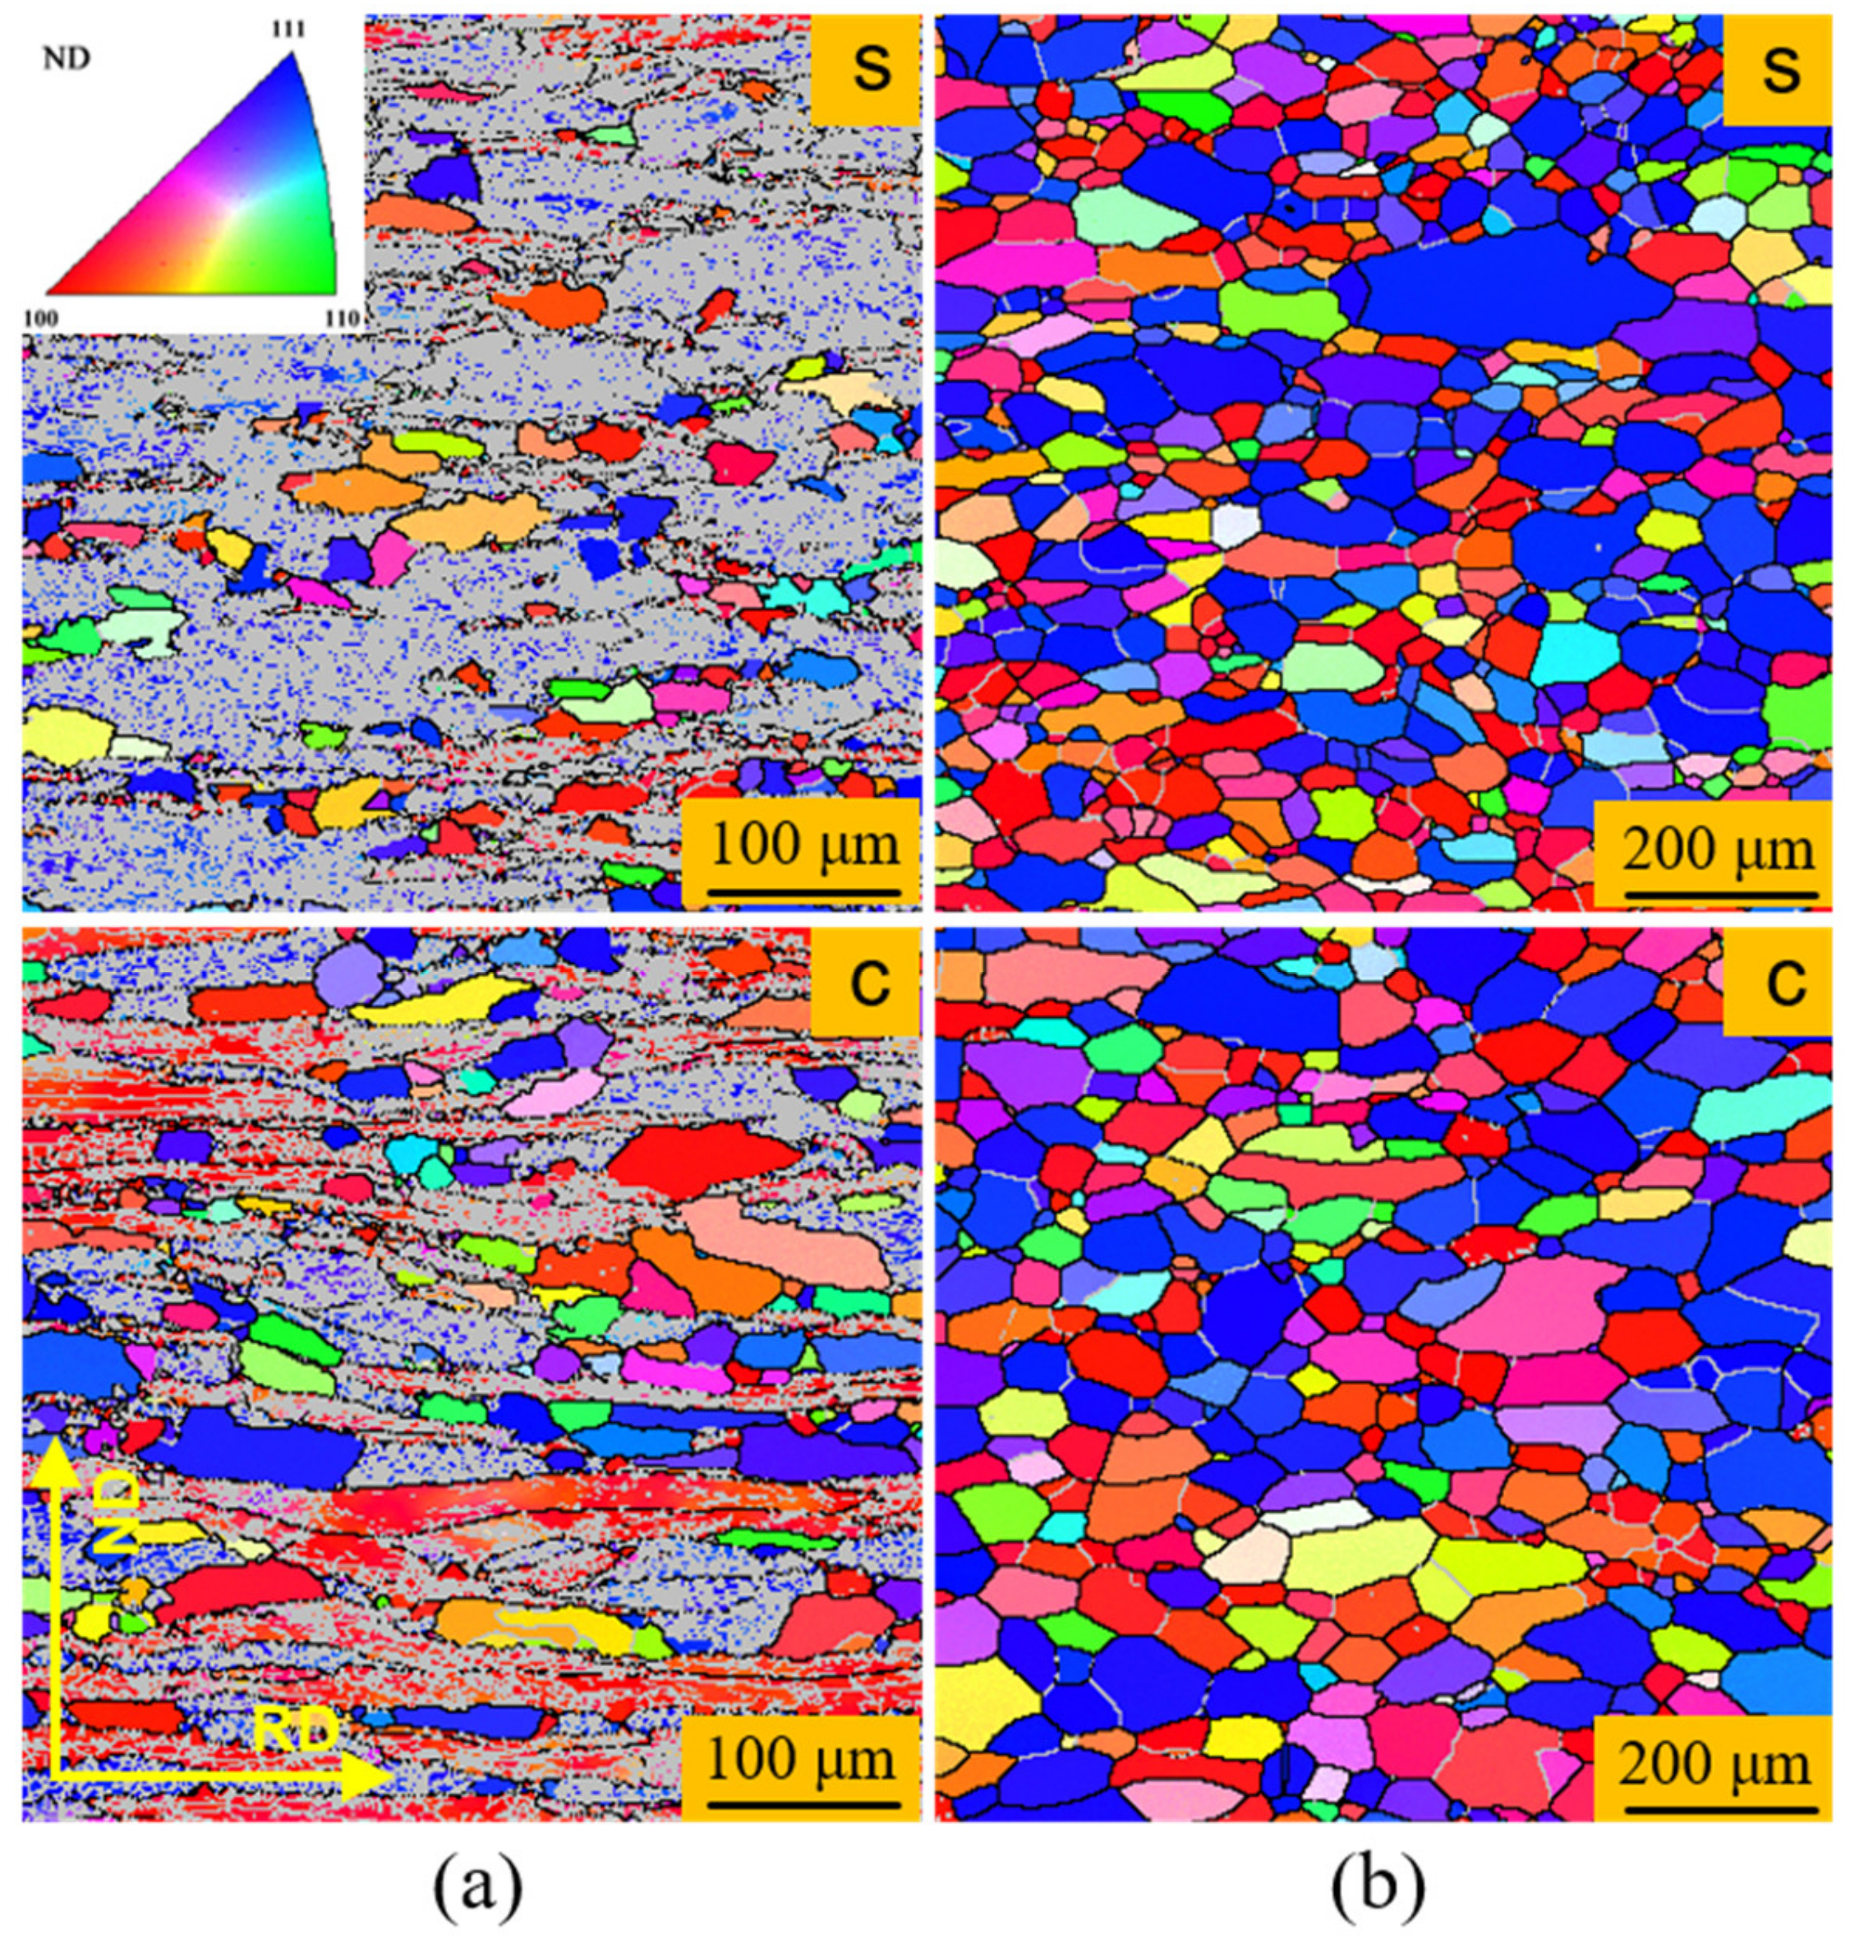
3.3. Microstructure and Texture Distribution of Ta Annealed at 1050 °C

Figure 6 shows the microstructure evolution of 87% CR-Ta annealed at 1050 °C for different times. Note that dark and silver solid lines represent high (>15°) and low (2–15°) angle grain boundaries, respectively. Clearly, recrystallization was still not completed below 30 min annealing time. Significant {100} deformed matrix can be observed in the surface and the center layer. With increasing annealing time, {100} deformed matrix gradually disappears. By extending annealing time to 120 min, the annealed microstructure in the surface and the center layer is fully recrystallized with grains in a relatively random orientation. Figure 7 shows the macro-texture distribution of 87% CR-Ta in the surface and the center layer annealed at 1050 °C for 120 min, and Figure 8 shows the corresponding orientation densities along the γ-fiber and θ-fiber. Apparently, the texture intensity in the surface and the center layer is further weakened, compared to the rolling texture (Figure 2), and the maximum intensity f(g) reduced to 10.8. Orientation line map indicates that the orientation distribution along the γ-fiber and θ-fiber are more homogeneous.

3.4. Microstructure and Texture Distribution of Ta Annealed at 1200 °C

Figure 9 shows the microstructure evolution of 87% CR-Ta annealed at 1200 °C for different times. After annealing for 10 min, many new defect-free grains appeared in the deformation matrix and the size of the recrystallization nuclei in the center layer is higher than that in the surface layer. The sample recrystallizes completely when the annealing time increased to 20 min. ODF map in Figure 10 shows that the strong {111}<uvw> recrystallization texture was formed and the texture distribution in the surface and the center layer is not uniform. Moreover, orientation line map indicates that the grain orientations along the γ-fiber are extremely inhomogeneous, as shown in Figure 11.

4. Discussion

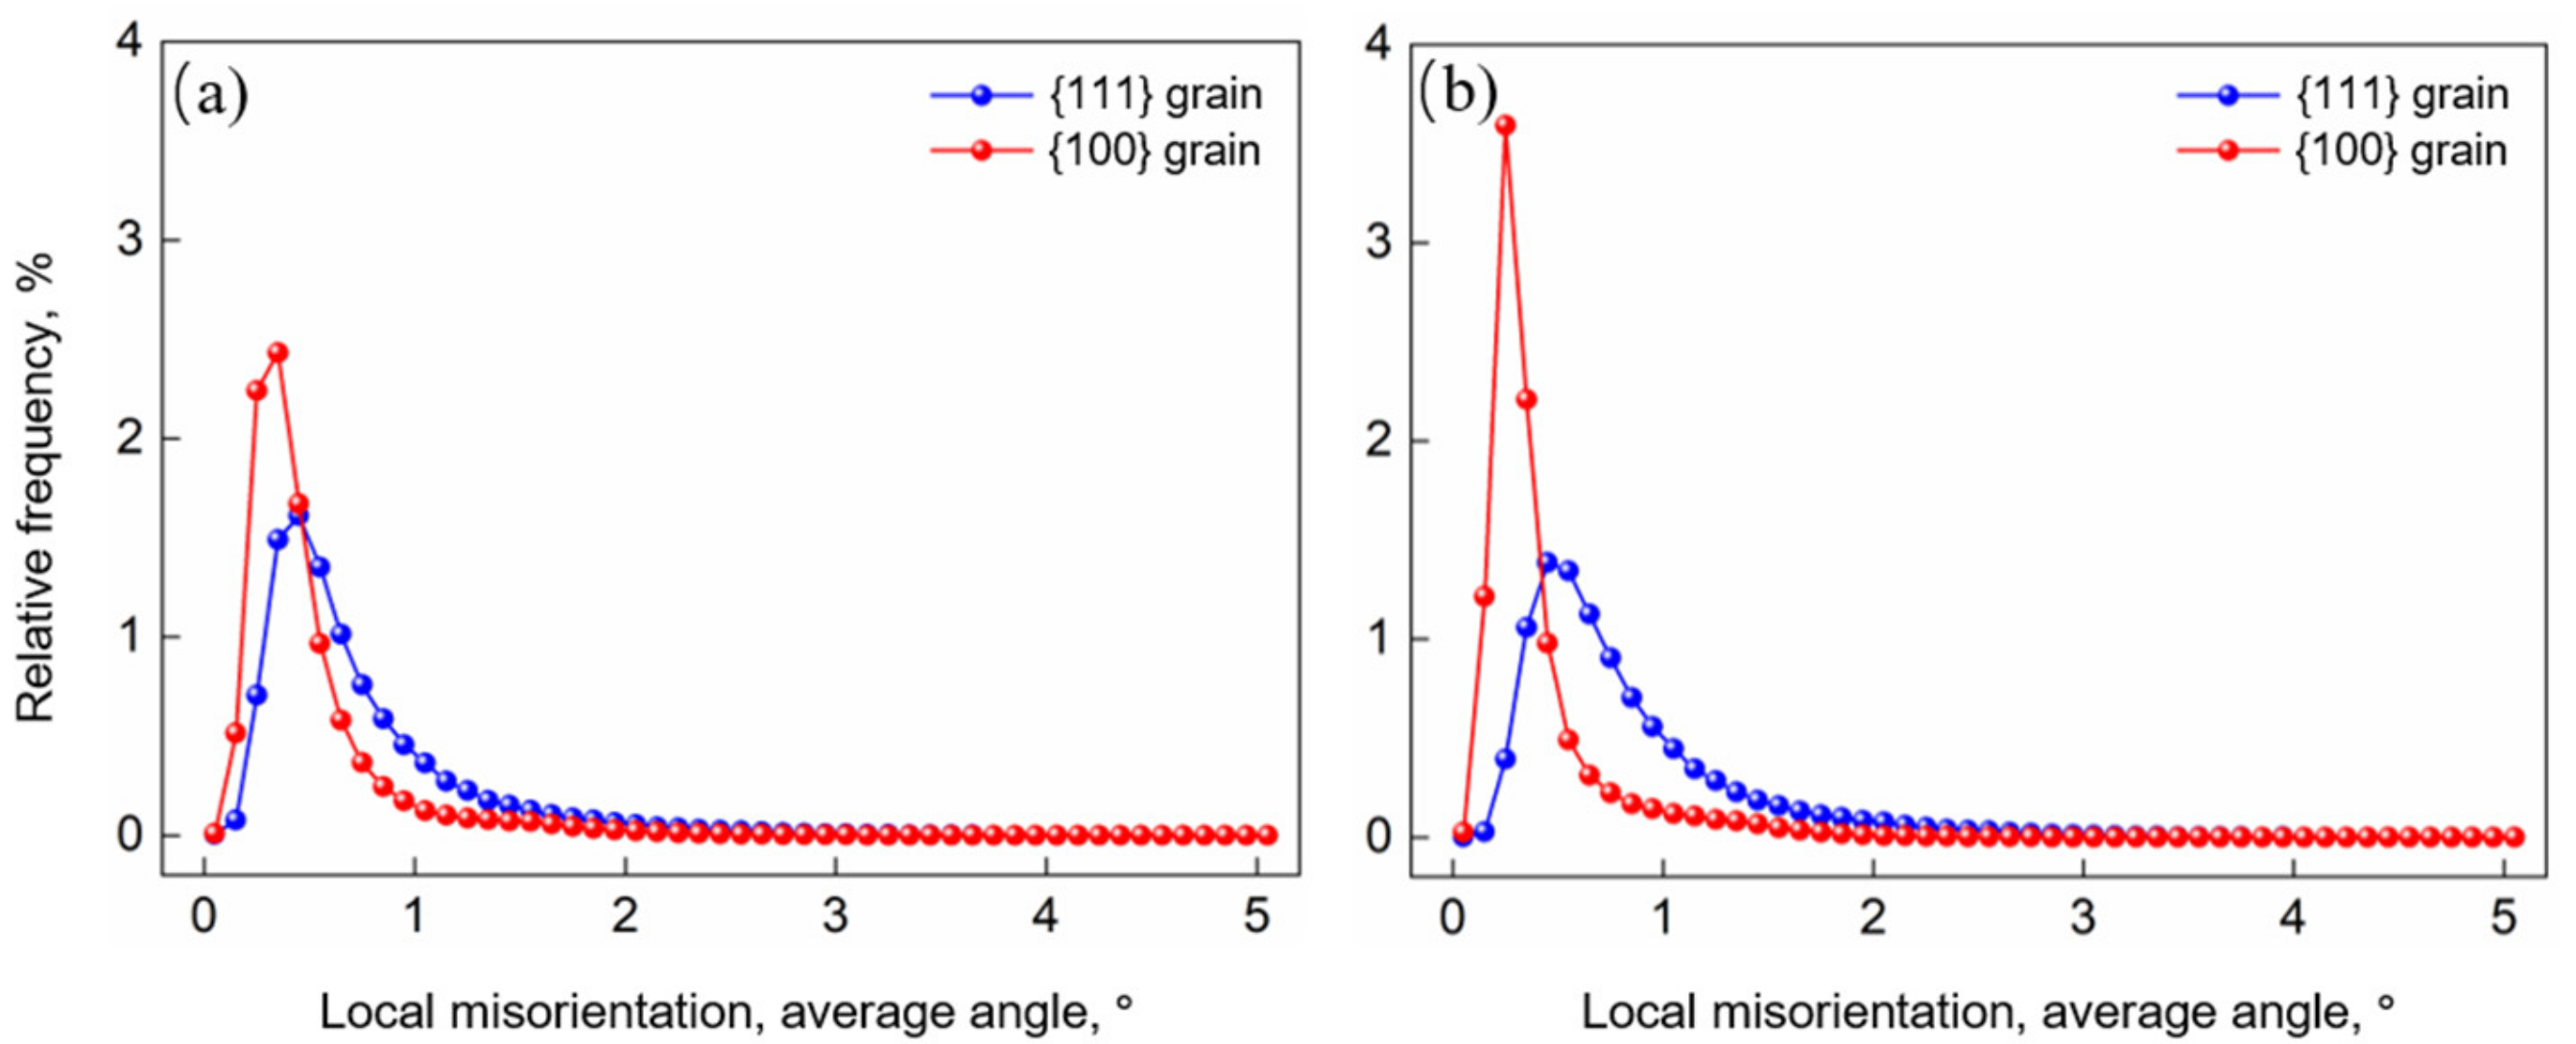
4.1. Orientation-Dependent Deformation Behavior

Although clock rolling significantly improves the texture homogeneity along the thickness, an orientation-dependent deformation substructure is formed, and many parallel MSBs and MBs exist in the {111} matrix. To further analyze the grain deformation behavior, a much finer scanning in region ‘A1′ (surface) and ‘B1′ (center) was adopted, and the {111} and {100} matrix were extracted from the EBSD maps in Figure 12. In addition, the local misorientation maps for the {111} and {100} matrix are shown in Figure 13. The average misorientation between a point on the measurement grid and its nearest neighbor points (a 3 × 3 region) was calculated, and then the average value was assigned to this point. In this process, a misorientation over 5° was discarded, and the closer to blue the color was, the lower the local-misorientation was. The strain distribution in the grain interior can well match with the local-misorientation, depending on the fact that each point in the EBSD scan has its own individual value of local-misorientation, and this technique approaches to fine scanning and high-resolution microscopes. Obviously, a higher local-misorientation value is observed in the {111} matrix, compared with the {100} matrix in Figure 13. In other words, the deformation is more severe in the {111} matrix during rolling process, resulting in the difference in deformed substructure.

4.2. Effect of Recovery on Stored Energy

Point defects are continuously reduced during the recovery, and dislocations annihilation and recombination occur by slip and climb. The driving force for recovery and recrystallization is the release of stored energy in the interior of the deformed matrix. Studies on materials, such as copper and iron, showed that the release of stored energy is mainly completed by recrystallization during annealing, while dislocation climb and cross-slip occur readily in Ta due to its high stack fault energy (SFE) [16], leading to a considerable release of stored energy during recovery [17]. Deng et al. [18] calculated the DSC curve of 87% deformed Ta plate and found that the stored energy release during the recovery accounted for 70% of the total amount. Early studies [19,20] on low-carbon steels with BCC structure found that region with larger stored energy released faster during the recovery. Srinivasan et al. [21] also pointed out that when a niobium single crystal with {111} and {100} orientation experienced sufficient recovery, the hardness difference between them was reduced from 40% before recovery to 20%, and the hardness value was proportional to the stored energy. Obviously, rapid recrystallization at high temperature significantly inhibits recovery, while samples can recover adequately at low temperature for sluggish recrystallization. Therefore, stored energy within the deformed grains is continuously released, and the difference in stored energy between the {111} and {100} matrix is also effectively reduced at low-temperature annealing.

4.3. Temperature-Dependent Recrystallization Mechanism

Recovery, which is a thermally activated process generally occurring at relatively low temperature, influences the microstructure evolution during annealing. Theoretically, recovery primarily affects the nucleation and dislocation activities within deformed grain, without high-angle grain boundaries (HABs) migration [22]. Recovery is even more important for metals with high stack fault energy (SFE) especially, since the dislocation movement is highly related to the SFE and cross slip can occur easily [23,24]. The annihilation and rearrangement of dislocations and the vanishing of point defects during recovery could greatly reduce the magnitude of stored energy and tailor the dislocation arrangement, and can thus affect the nucleation. Sub-grains boundary and HABs migration are two primary nucleation mechanism during annealing. At low-temperature annealing, the sub-grains nucleation mechanism plays a key role since the HABs do not migrate easily. The sub-grains nucleation can be further divided into sub-grains boundary migration nucleation and sub-grains coalescence nucleation. The former means that the recrystallization nucleus is formed by migration of some sub-grain boundaries with high local dislocation density and gradually sweeps into adjacent deformation matrix. While the latter signifies that sub-grains rotate by boundary diffusion processes until adjacent sub-grains have similar orientations and coalesce into a large sub-grain. However, the HABs nucleation refers to the occurrence of recrystallized grain mainly through the migration of HABs. When annealed at high temperature, the HABs move quickly and sweep the deformation substructure inherited from cold working. As shown in Figure 6, when annealed at low temperature, the sample recrystallized slowly and has abundant time to recovery. More accurately, the rearrangement of dislocations or the migration of low-angle boundaries gradually evolves into sub-grains during recovery, which leads to recrystallization dominated by sub-grains nucleation mechanisms. Meanwhile, the difference in stored energy between the {111} and {100} matrix can also be reduced during recovery, resulting in good uniformity of recrystallization grain size in Ta sheets along the thickness. On the contrary, the HABs nucleation mechanism plays a major role in the high-temperature annealing due to insufficient recovery, and the subsequent growth rate of nuclei is closely related to the orientation of surrounding matrix. The nucleus grows faster into the {111} matrix with high stored energy, and slower into the {100} matrix, resulting in poor uniformity of the grain size.

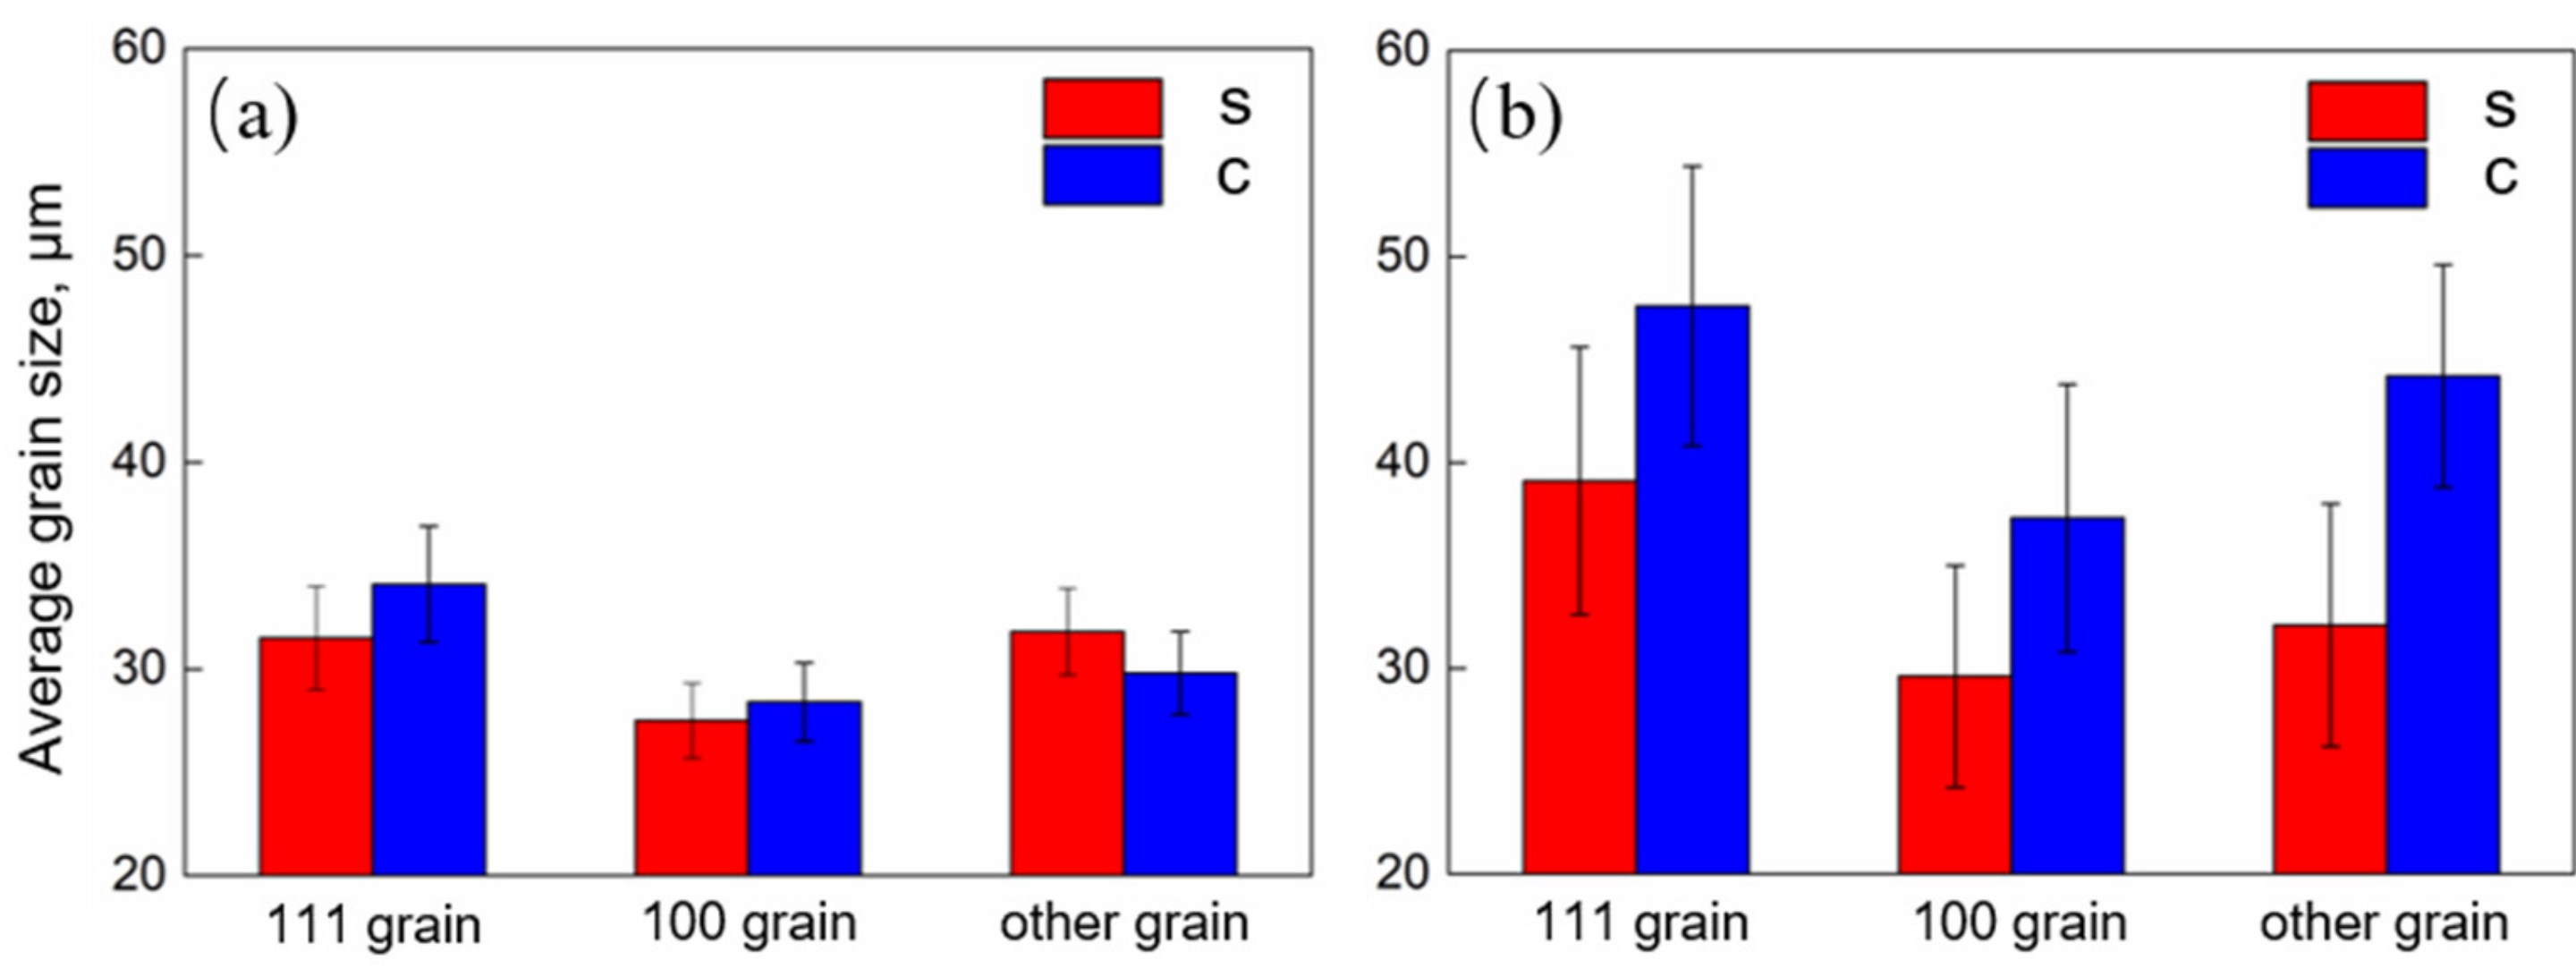
4.4. Effect of Annealing Temperature on Grain Size

As mentioned above, the sub-grain nucleation plays a major role in low-temperature annealing. The number of sub-grains gradually increases. and the former sub-grains continue to grow into effective nuclei with the increase of annealing time. Meanwhile, the release of stored energy in the interior of matrix considerably reduces the driving force of grain growth, and the recrystallization nucleus with different orientation can grow evenly into the surrounding matrix. Furthermore, the neighboring {100} matrix has an inevitable pinning effect on the recrystallization grains because of its lower stored energy, contributing to a more homogeneous recrystallization grain size, as shown in Figure 14a. However, samples annealed at high temperature did not have enough time to experience recovery, so the stored energy distribution within the matrix was relatively heterogeneous. Thus, HABs have enough driving force to generate migration and grain growth rate is fast, leading to considerably uneven grain size distribution in Figure 14b.

4.5. Effect of Annealing Temperature on Texture Evolution

Sub-grains within the deformation matrix gradually evolve into nuclei with increasing annealing time when annealed at low temperature. The energy stored in the {111} matrix was inhomogeneous due to the early stage of recovery. Meanwhile, these initial nuclei were thermodynamically unstable and prefer to adjust their orientations favorably to grow when they encounter non-uniformly distributed energy in deformed grain or {111}-{100} boundaries, which can be attributed to growth selection [7,25], resulting in the appearance of grains with random orientation. However, at high temperature, {111} matrix possessed a much superior recrystallization ability compared with {100} matrix, not only due to the rapid migration of {111} grain boundaries [26] but also because of the high stored energy to drive the migration. The fast migration of {111} grain boundaries can swallow other randomly orientated grains and significantly increase the {111} grain size, causing the increase of {111}<uvw> texture intensity. Thus, low-temperature annealing is beneficial to weaken and homogenize the texture distribution along the thickness, while high-temperature annealing significantly improves the {111}<uvw> texture intensity.

5. Conclusions

High purity Ta plates were 135°-clocked-rolled to an 87% reduction in thickness and then annealed at 1050 °C and 1200 °C to obtain a fully recrystallized microstructure. The principal conclusions can be drawn as follows:
  • 135° clock rolling is effective to weaken and ameliorate the texture distribution along the thickness, but a significant orientation-dependent deformation substructure is formed, and many parallel MSBs and MBs exist within the {111} matrix.
  • Stored energy within the matrix can be effectively released since sample can experience abundant recovery at low-temperature annealing, resulting in fine grains and uniformly distributed texture along the thickness.
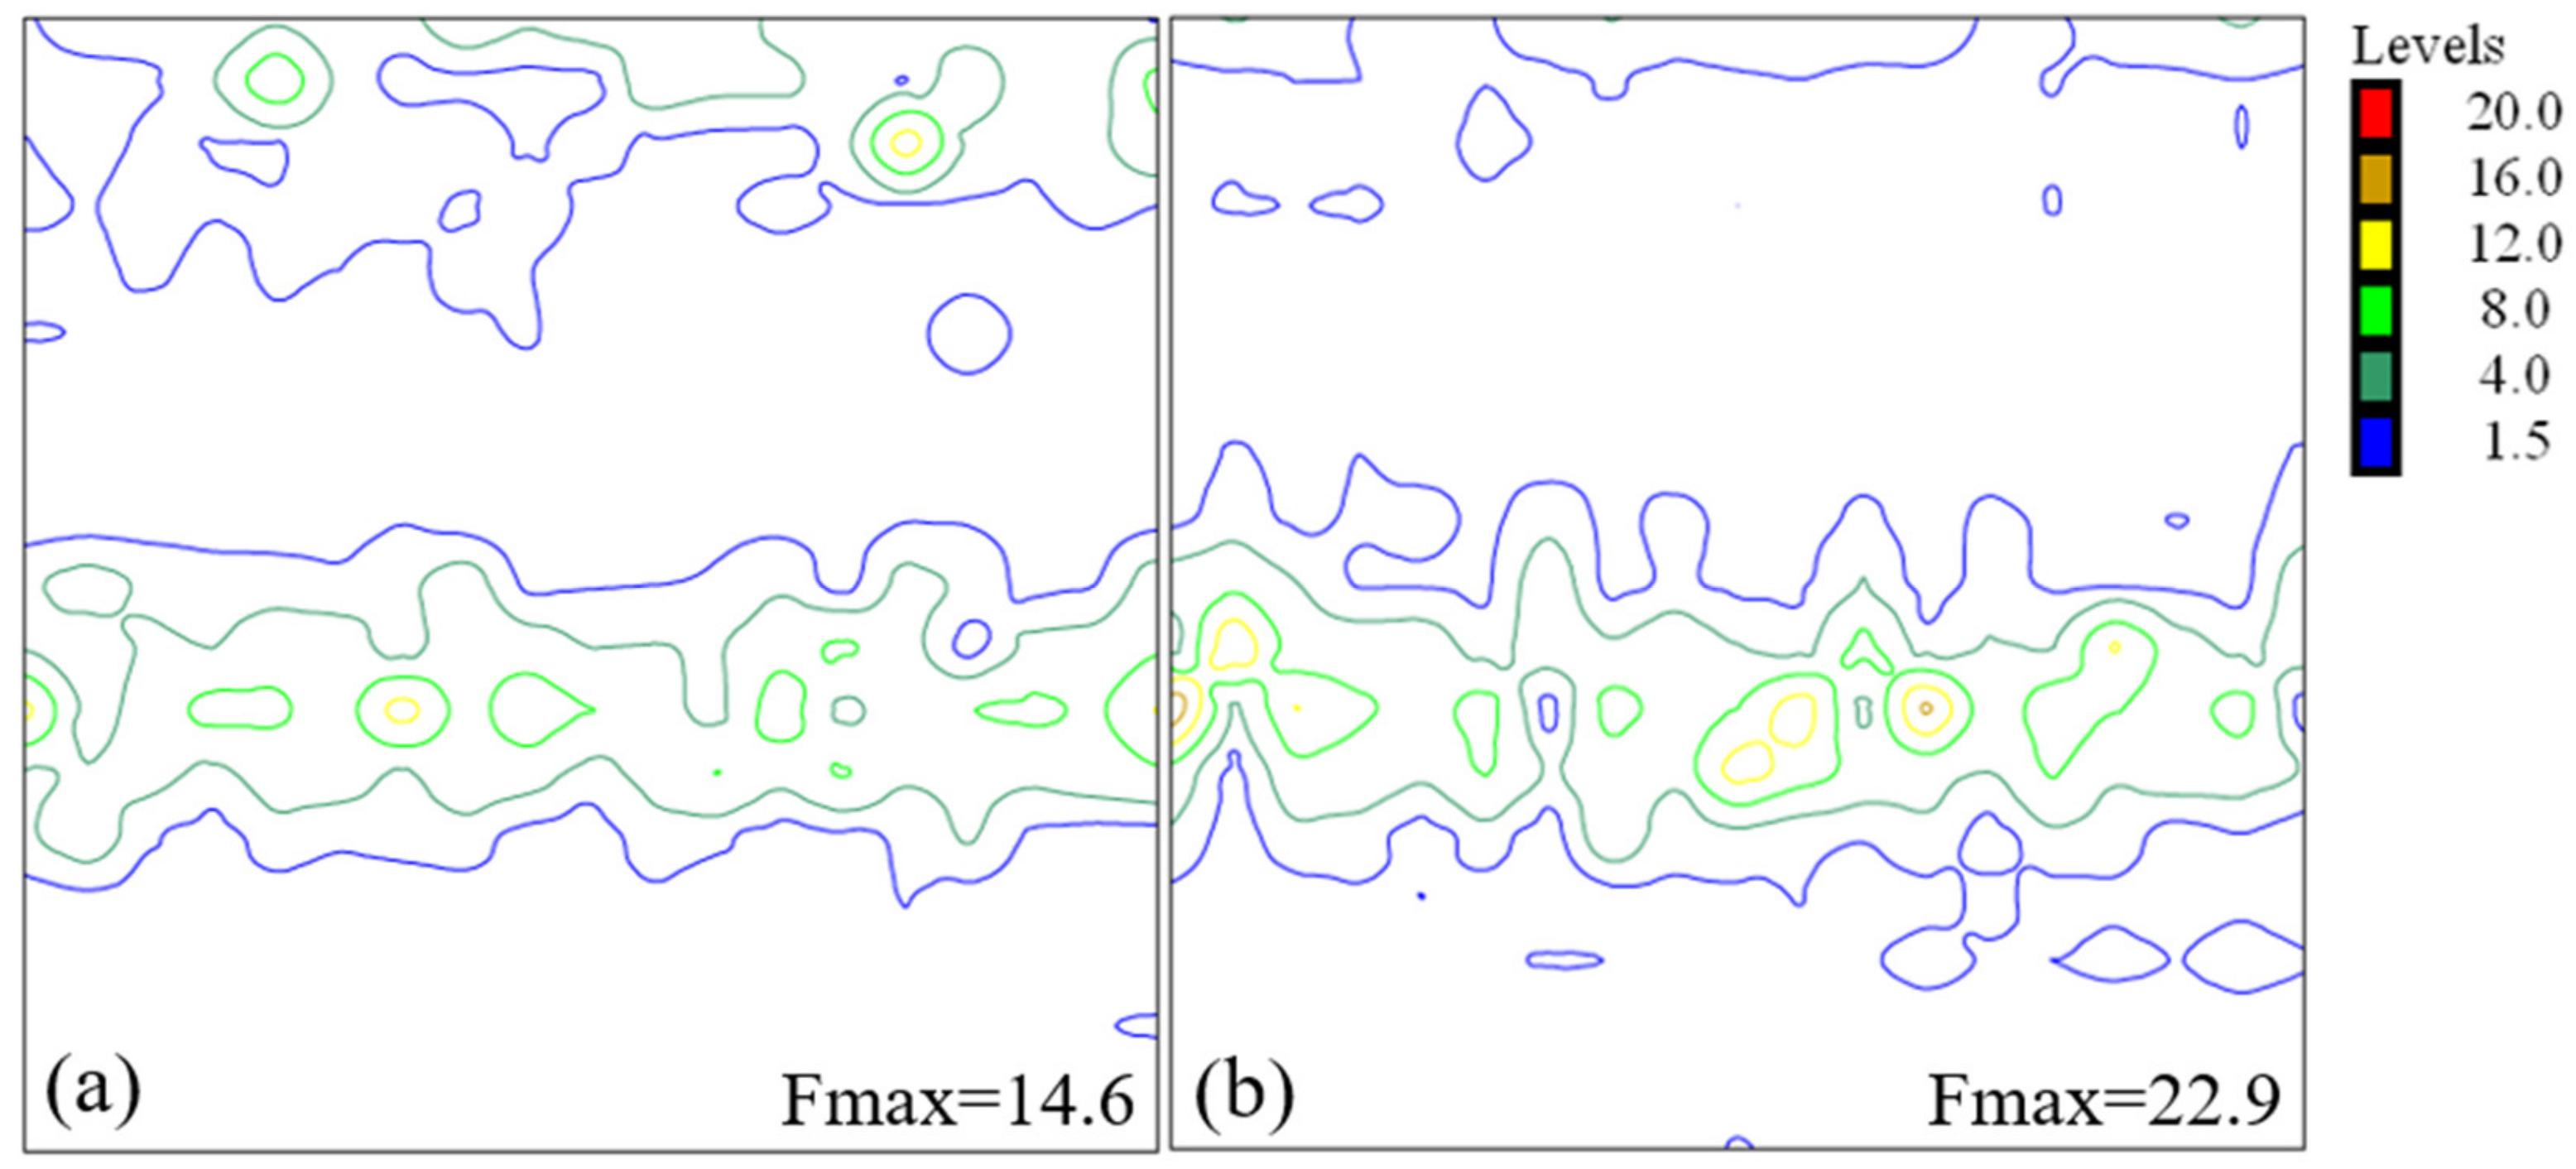
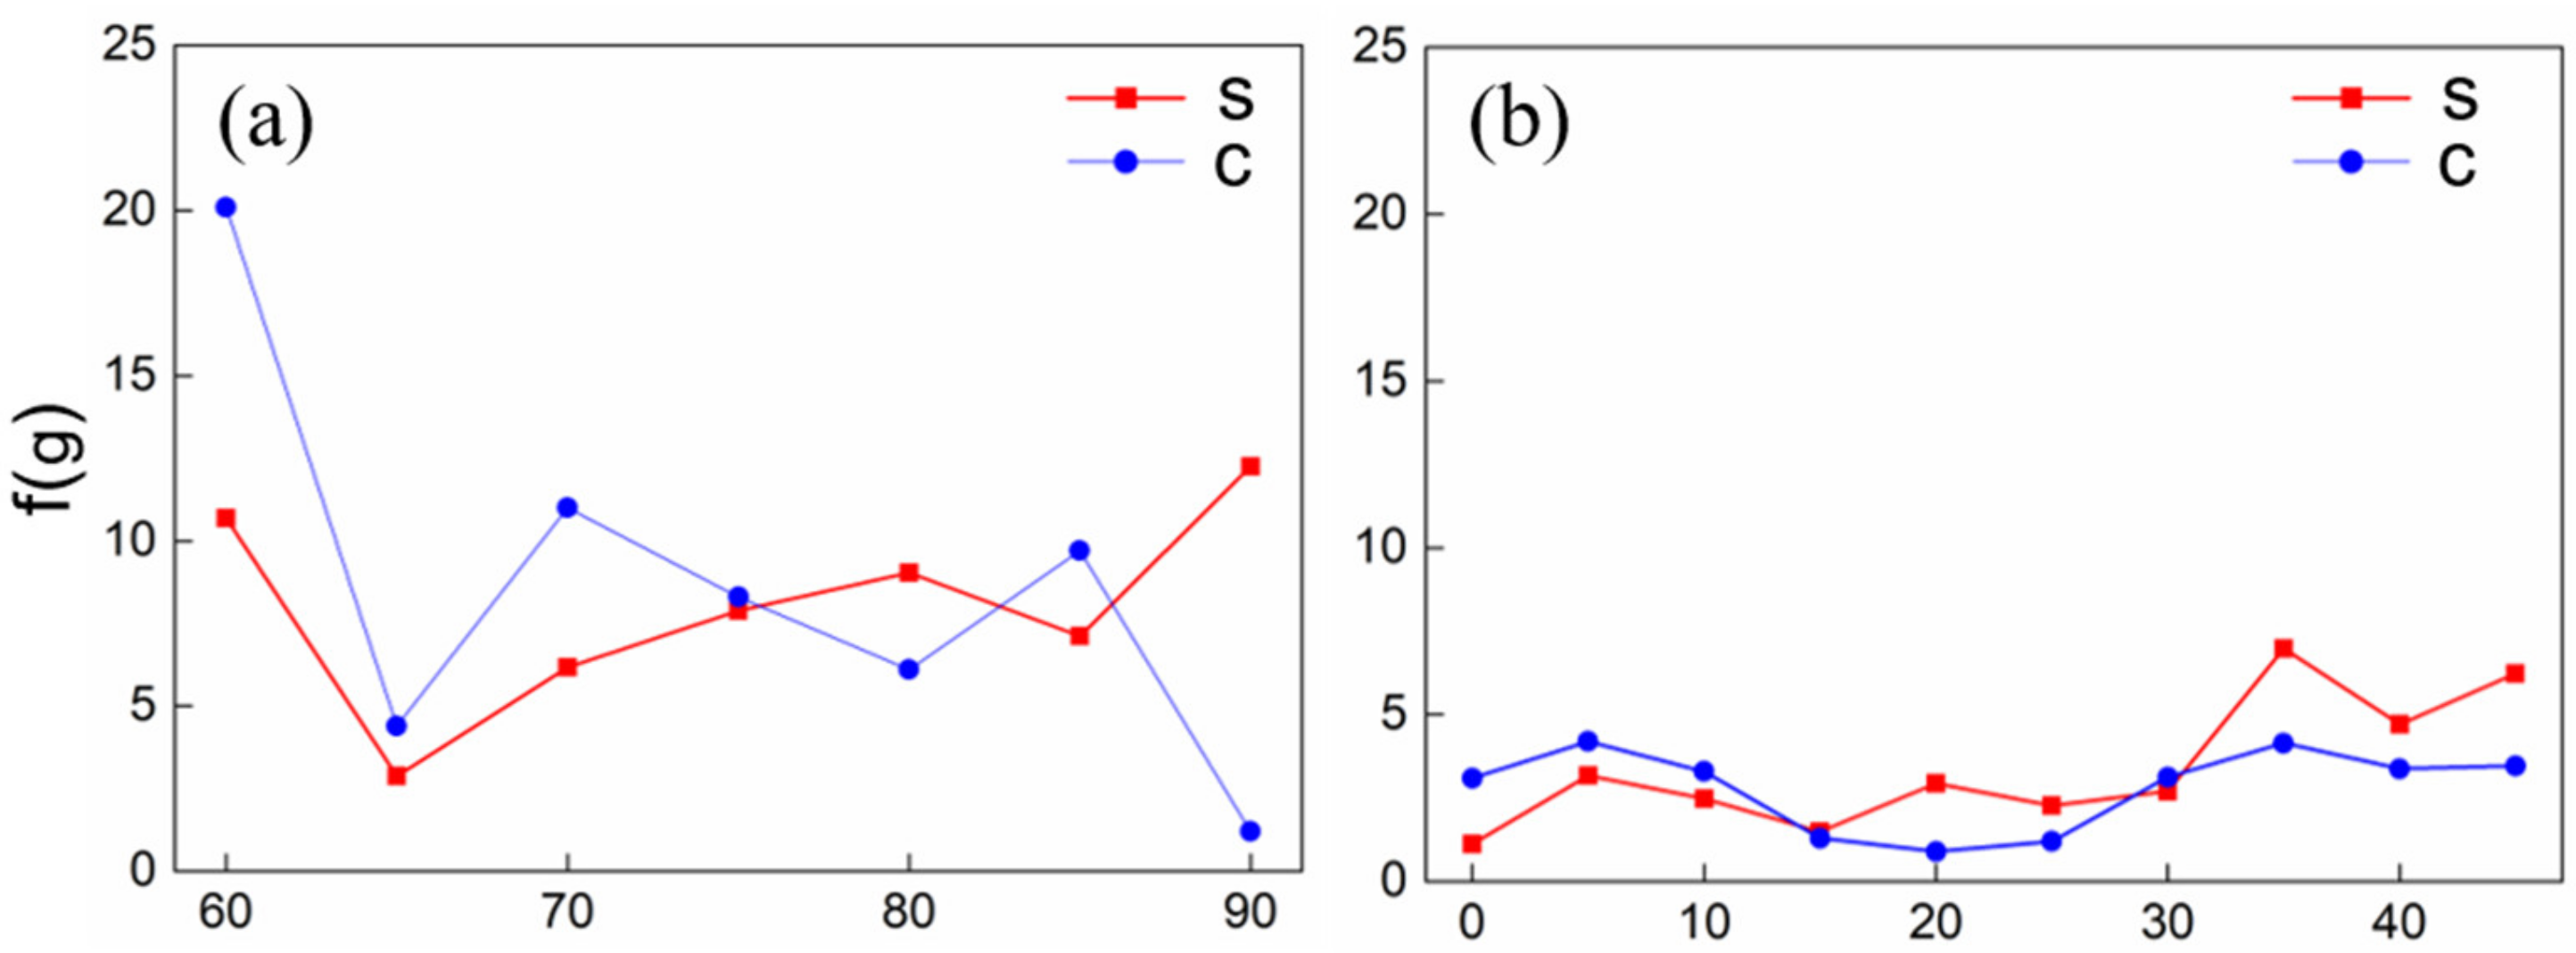
  • The fast migration of {111} grain boundaries is due to high stored energy at high-temperature annealing, which significantly increases the {111} grain size and {111}<uvw> texture intensity.

Author Contributions

Conceptualization, C.D. and S.L.; methodology and investigation, Y.L. and N.L.; data analysis and writing—original draft., J.Z.; funding acquisition, C.D.

Funding

The present work was co-supported by the National Natural Science Foundation of China (Grants 51421001, 51701032 and 51504051), the Chongqing Research program of Basic Research and Frontier Technology (No. cstc2017jcyjAX0094) and the Fundamental Research Funds for the Central Universities (No. 2018CDPTCG0001/5).

Conflicts of Interest

The authors declare no conflict of interest.

References

  1. Cardonne, S.; Kumar, P.; Michaluk, C.; Schwartz, H. Tantalum and its alloys. Int. J. Refract. Met. Hard Mater. 1995, 13, 187–194. [Google Scholar] [CrossRef]
  2. Holloway, K.; Fryer, P.M. Tantalum as a diffusion barrier between copper and silicon. Appl. Phys. Lett. 1990, 57, 1736–1738. [Google Scholar] [CrossRef]
  3. Holloway, K.; Fryer, P.M.; Cabral, C., Jr.; Harper, J.M.E. Tantalum as a diffusion barrier between copper and silicon: Failure mechanism and effect of nitrogen additions. J. Appl. Phys. 1992, 71, 5433–5444. [Google Scholar] [CrossRef]
  4. Michaluk, C.A. Correlating discrete orientation and grain size to the sputter deposition properties of tantalum. J. Electron. Mater. 2002, 31, 2–9. [Google Scholar] [CrossRef]
  5. Wright, S.I.; Field, D.P.; Michaluk, C.A.; Witt, R.A.; Nibur, K.A. Effects of local texture and grain structure on the sputtering performance of tantalum. Mater. Sci. Forum. 2002, 408–412, 1615–1620. [Google Scholar]
  6. Shang, Z.; Jiang, X.; Li, Y.; Yang, Y. Sputtering Targets Used in Integrated Circuit. Rare Met. 2005, 29, 475–477. [Google Scholar]
  7. Raabe, D.; Schlenkert, G.; Weisshaupt, H.; Lücke, K. Texture and microstructure of rolled and annealed tantalum. Mater. Sci. Technol. 1994, 10, 299–305. [Google Scholar] [CrossRef]
  8. Mathaudhu, S.N.; Hartwig, K.T. Processing microstructure property relationships in severely deformed tantalum. Mater. Sci. Eng. A 2007, 463, 94–100. [Google Scholar] [CrossRef]
  9. Hosseini, E.; Kazeminezhad, M. Dislocation structure and strength evolution of heavily deformed tantalum. Int. J. Refract. Met. Hard Mater. 2009, 27, 605–610. [Google Scholar] [CrossRef]
  10. Liu, S.F.; Fan, H.Y.; Deng, C.; Hao, X.B.; Guo, Y.; Liu, Q. Through-thickness texture in clock-rolled tantalum plate. Int. J. Refract. Met. Hard Mater. 2015, 48, 194–200. [Google Scholar] [CrossRef]
  11. Deng, C.; Liu, S.F.; Ji, J.L.; Hao, X.B.; Zhang, Z.Q.; Liu, Q. Texture evolution of high purity tantalum under different rolling paths. J. Mater. Process. Technol. 2014, 214, 462–469. [Google Scholar] [CrossRef]
  12. Fan, H.Y.; Liu, S.F.; Deng, C.; Wu, X.D.; Cao, L.F.; Liu, Q. Quantitative analysis: How annealing temperature influences recrystallization texture and grain shape in tantalum. Int. J. Refract. Met. Hard Mater. 2018, 72, 244–252. [Google Scholar] [CrossRef]
  13. Raabe, D. Simulation of rolling textures of b.c.c. metals considering grain interactions and crystallographic slip on {110}, {112} and {123} planes. Mater. Sci. Eng. A 1995, 197, 31–37. [Google Scholar] [CrossRef]
  14. Deng, C.; Liu, S.F.; Fan, H.Y.; Hao, X.B.; Ji, J.L.; Zhang, Z.Q.; Liu, Q. Elimination of elongated bands by clock rolling in high-purity tantalum. Metall. Mater. Trans. A 2015, 46, 5477–5481. [Google Scholar] [CrossRef]
  15. Liu, Y.H.; Liu, S.F.; Zhu, J.L.; Fan, H.Y.; Deng, C.; Cao, L.F.; Wu, X.D.; Liu, Q. Strain accommodation of <110>-normal direction-oriented grains in micro-shear bands of high-purity tantalum. J. Mater. Sci. 2018, 53, 12543–12552. [Google Scholar] [CrossRef]
  16. Pegel, B. Stacking Faults on {110} Planes in the B.C.C. Lattice. Phys. Stat. Sol. 1968, 28, 603–609. [Google Scholar] [CrossRef]
  17. Humphreys, F.J.; Hatherly, M. Recrystallization and Related Annealing Phenomena, 2nd ed.; Elsevier: Amsterdam, The Netherlands, 2004; Volume 64, pp. 219–224. [Google Scholar]
  18. Deng, C.; Liu, S.F.; Hao, X.B.; Ji, J.L.; Zhang, Z.Q.; Liu, Q. Orientation dependence of stored energy release and microstructure evolution in cold rolled tantalum. Int. J. Refract. Met. Hard Mater. 2014, 46, 24–29. [Google Scholar] [CrossRef]
  19. Every, R.L.; Hatherly, M. Oriented Nucleation in Low-Carbon Steels. Texture 1974, 1, 233–243. [Google Scholar] [CrossRef]
  20. Martínez-de-guerenu, A.; Arizti, F.; Díaz-fuentes, M.; Gutiérrez, I. Recovery during annealing in a cold rolled low carbon steel. Part I: Kinetics and microstructural characterization. Acta Mater. 2004, 52, 3657–3664. [Google Scholar] [CrossRef]
  21. Srinivasan, R.; Viswanathan, G.B.; Levit, V.I.; Fraser, H.L. Orientation effect on recovery and recrystallization of cold rolled niobium single crystals. Mater. Sci. Eng. A 2009, 507, 179–189. [Google Scholar] [CrossRef]
  22. Liu, S.F.; Liu, Y.H.; Li, L.J.; Deng, C.; Fan, H.Y.; Guo, Y.; Cao, L.F.; Liu, Q. Effects of pre-recovery on the recrystallization microstructure and texture of high-purity tantalum. J. Mater. Sci. 2018, 53, 2985–2994. [Google Scholar] [CrossRef]
  23. Ebrahimi, F.; Ahmed, Z.; Li, H. Effect of stacking fault energy on plastic deformation of nanocrystalline face-centered cubic metals. Appl. Phys. Lett. 2004, 85, 3749–3751. [Google Scholar] [CrossRef]
  24. Smallman, R.E.; Green, D. The dependence of rolling texture on stacking fault energy. Acta Mater. 1964, 12, 145–154. [Google Scholar] [CrossRef]
  25. Sidor, J.; Petrov, R.; Kestens, L. Modeling the crystallographic texture changes in aluminum alloys during recrystallization. Acta Mater. 2011, 59, 5735–5748. [Google Scholar] [CrossRef]
  26. Bocos, J.L.; Novillo, E.; Petite, M.M.; Iza-Mendia, A.; Gutierrez, I. Aspects of orientation-dependent grain growth in extra-low carbon and interstitial-free steels during continuous annealing. Metall. Mater. Trans. A 2003, 34, 827–839. [Google Scholar] [CrossRef]
Figure 1. Schematic illustration of test regions for X-ray diffraction (XRD) and electron backscatter diffraction (EBSD).
Metals 09 00075 g001
Figure 2. Texture distribution of 87% 135°-clocked-rolled (CR)-Ta in the surface layer (a) and the center layer (b).
Metals 09 00075 g002
Figure 3. Orientation densities along γ-fiber (a) and θ-fiber (b) of 87% CR-Ta in the surface and the center layer.
Metals 09 00075 g003
Figure 4. Orientation image map (OIM) and image quality (IQ) of 87% CR-Ta along the thickness: (a) OIM and (b) IQ for the surface layer; (c) OIM and (d) IQ for the center layer. Step size 0.5 μm.
Metals 09 00075 g004
Figure 5. Transmission electron microscopy (TEM) images of clock rolled sample: (a) and (b) {111} matrix; (c) and (d) {100} matrix.
Metals 09 00075 g005
Figure 6. OIM of 87% CR-Ta annealed at 1050 °C for different times in the surface and the center region: (a) 30 min, (b) 60 min, (c) 90 min, (d) 120 min.
Metals 09 00075 g006
Figure 7. Texture distribution of 87% CR-Ta annealed at 1050 °C for 120 min in the surface layer (a) and the center layer (b).
Metals 09 00075 g007
Figure 8. Orientation densities along γ-fiber (a) and θ-fiber (b) of 87% CR-Ta annealed at 1050 °C for 120 min in the surface and the center layer.
Metals 09 00075 g008
Figure 9. OIM of 87% CR-Ta annealed at 1200 °C for different times in the surface and the center layer: (a) 10 min, (b) 20 min.
Metals 09 00075 g009
Figure 10. Texture distribution of 87% CR-Ta annealed at 1200 °C for 20 min in the surface layer (a) and the center layer (b).
Metals 09 00075 g010
Figure 11. Orientation densities along γ-fiber (a) and θ-fiber (b) of 87% CR-Ta annealed at 1200 °C for 20 min in the surface and the center layer.
Metals 09 00075 g011
Figure 12. (a) OIM, detailed scan of ‘A1′ in Figure 4, (c) and (e) are {111} and {100} matrix extracted from (a), respectively, (d) and (f) are corresponding local misorientation maps; (b) OIM, detailed scan of ‘B1′. (g) and (i) are {111} and {100} matrix extracted from (b), respectively, (h) and (j) are corresponding local misorientation maps. Step size 80 nm.
Metals 09 00075 g012
Figure 13. Local misorientation distribution of {111} and {100} matrix in the surface (a) and the center layer (b) of sheets.
Metals 09 00075 g013
Figure 14. The average recrystallization grain size of the surface and center layer when annealed at 1050 °C (a) and 1200 °C (b).
Metals 09 00075 g014
Table 1. The chemical composition of original tantalum ingot (in wt. ppm).
CNHONbMoWTiSiFeNiTa
9202306.40.140.61<0.001<0.005<0.005<0.005Bal.

