Article

Inclusion Modification in C104Cr Saw Wire Steel with Different Cerium Content

School of Metallurgy, Northeastern University, Shenyang 110819, China
*
Authors to whom correspondence should be addressed.
Metals 2019, 9(1), 54; https://doi.org/10.3390/met9010054
Submission received: 29 November 2018 / Revised: 20 December 2018 / Accepted: 21 December 2018 / Published: 8 January 2019

Abstract

:
In the present study, the effect of cerium content in the range of 0~0.0676% on oxygen and sulfur content, as well as the quantity, size, distribution, and type of inclusions in C104Cr saw wire steel, were investigated using thermodynamic analysis, metallographic examination, SEM-EDS, and component analysis. The results showed that conducting a vacuum carbon pre-deoxidization process is helpful in preventing the formation of Ce2O3 inclusions in a smelting experiment, and cerium has a beneficial effect in terms of modifying inclusions. When the content of cerium in steel is 0.0136% or 0.0277%, the main inclusions in the steel are Ce2O2S and CeS, and when the content of cerium is 0.0389% or above, the inclusions in the steel are Ce2O2S, CeS, Ce–S–O–P(As), Ce–O–P, and Ce–P(As). The calculation of the segregation model showed that the precipitation of CeP and CeAs in steel takes place at the end of solidification. According to the element mapping distribution diagram of Ce–S–O–P(As) and the layered Ce–O–P inclusions found in steel with high cerium content, two possible mechanisms for the formation of Ce2O3 inclusions distributed in the outer layer of cerium composite inclusions are proposed. The first mechanism suggests that Ce2O3 inclusions are generated from the combination of [Ce] and [O] directly, and the second suggests that Ce2O3 is the product of an oxidization reaction after the formation of CeP.

1. Introduction

Saw wire is generally used to cut silicon wafers for the solar photovoltaic industry, and it is a key consumable material in silicon wafer wire cutting technology [1,2]. Saw wire steels should be manufactured with ultra-high cleanness and high strength in order to achieve a fine diameter, low breaking rate, and other strict requirements. The saw wire market has developed very rapidly, with the diameters varying between 55 and 70 μm and tensile strengths reaching 4500 MPa in the last two years. With the development of the saw wire market, saw wire is predicted to advance towards finer diameters and higher strengths [2]. Therefore, the cleanness of the saw wire steel needs to be rigidly controlled in two respects: Firstly, the total number of inclusions should be as low as possible; secondly, large-sized inclusions should be removed as much as possible [3].
Rare earth (RE) material has a significant effect on the cleanness of steel [4,5,6,7,8,9,10]. Because RE has strong chemical activity, RE is able to fully capture oxygen, sulfur, and harmful residual elements in steel and can also form RE inclusions. When the dynamic conditions are favorable to the inclusions floating on the molten steel surface, the existing inclusions can be sufficiently removed from the steel, thus improving the cleanness of the steel. However, exorbitant RE content will result in a large number of sizeable inclusions [11], and the cleanness of the steel will deteriorate unavoidably. Therefore, it is worthwhile, for the purposes of industrial applications, to study the effect of the RE content on the cleanness of saw wire steel and to determine the optimal cerium content. Additionally, it has been reported that RE composite inclusions (containing RE, O, P, As, and so on) can form in steel with a high addition of RE [12,13]; however, the formation conditions and evolution mechanisms of these RE composite inclusions require further study.
In the current study, cerium was chosen to be added to molten C104Cr saw wire steel using a 30 kg vacuum induction furnace, and the effects of the cerium addition (0 wt %, 0.03 wt %, 0.05 wt %, 0.08 wt %, and 0.10 wt %) on the oxygen and sulfur content, as well as the quantity, size, distribution, and type of inclusions in the C104Cr saw wire steel, were investigated using thermodynamic analysis, metallographic examination, SEM-EDS, and component analysis. Based on the experimental results, the formation conditions and evolution mechanisms of the RE composite inclusions in C104Cr steel are discussed.

2. Experiments

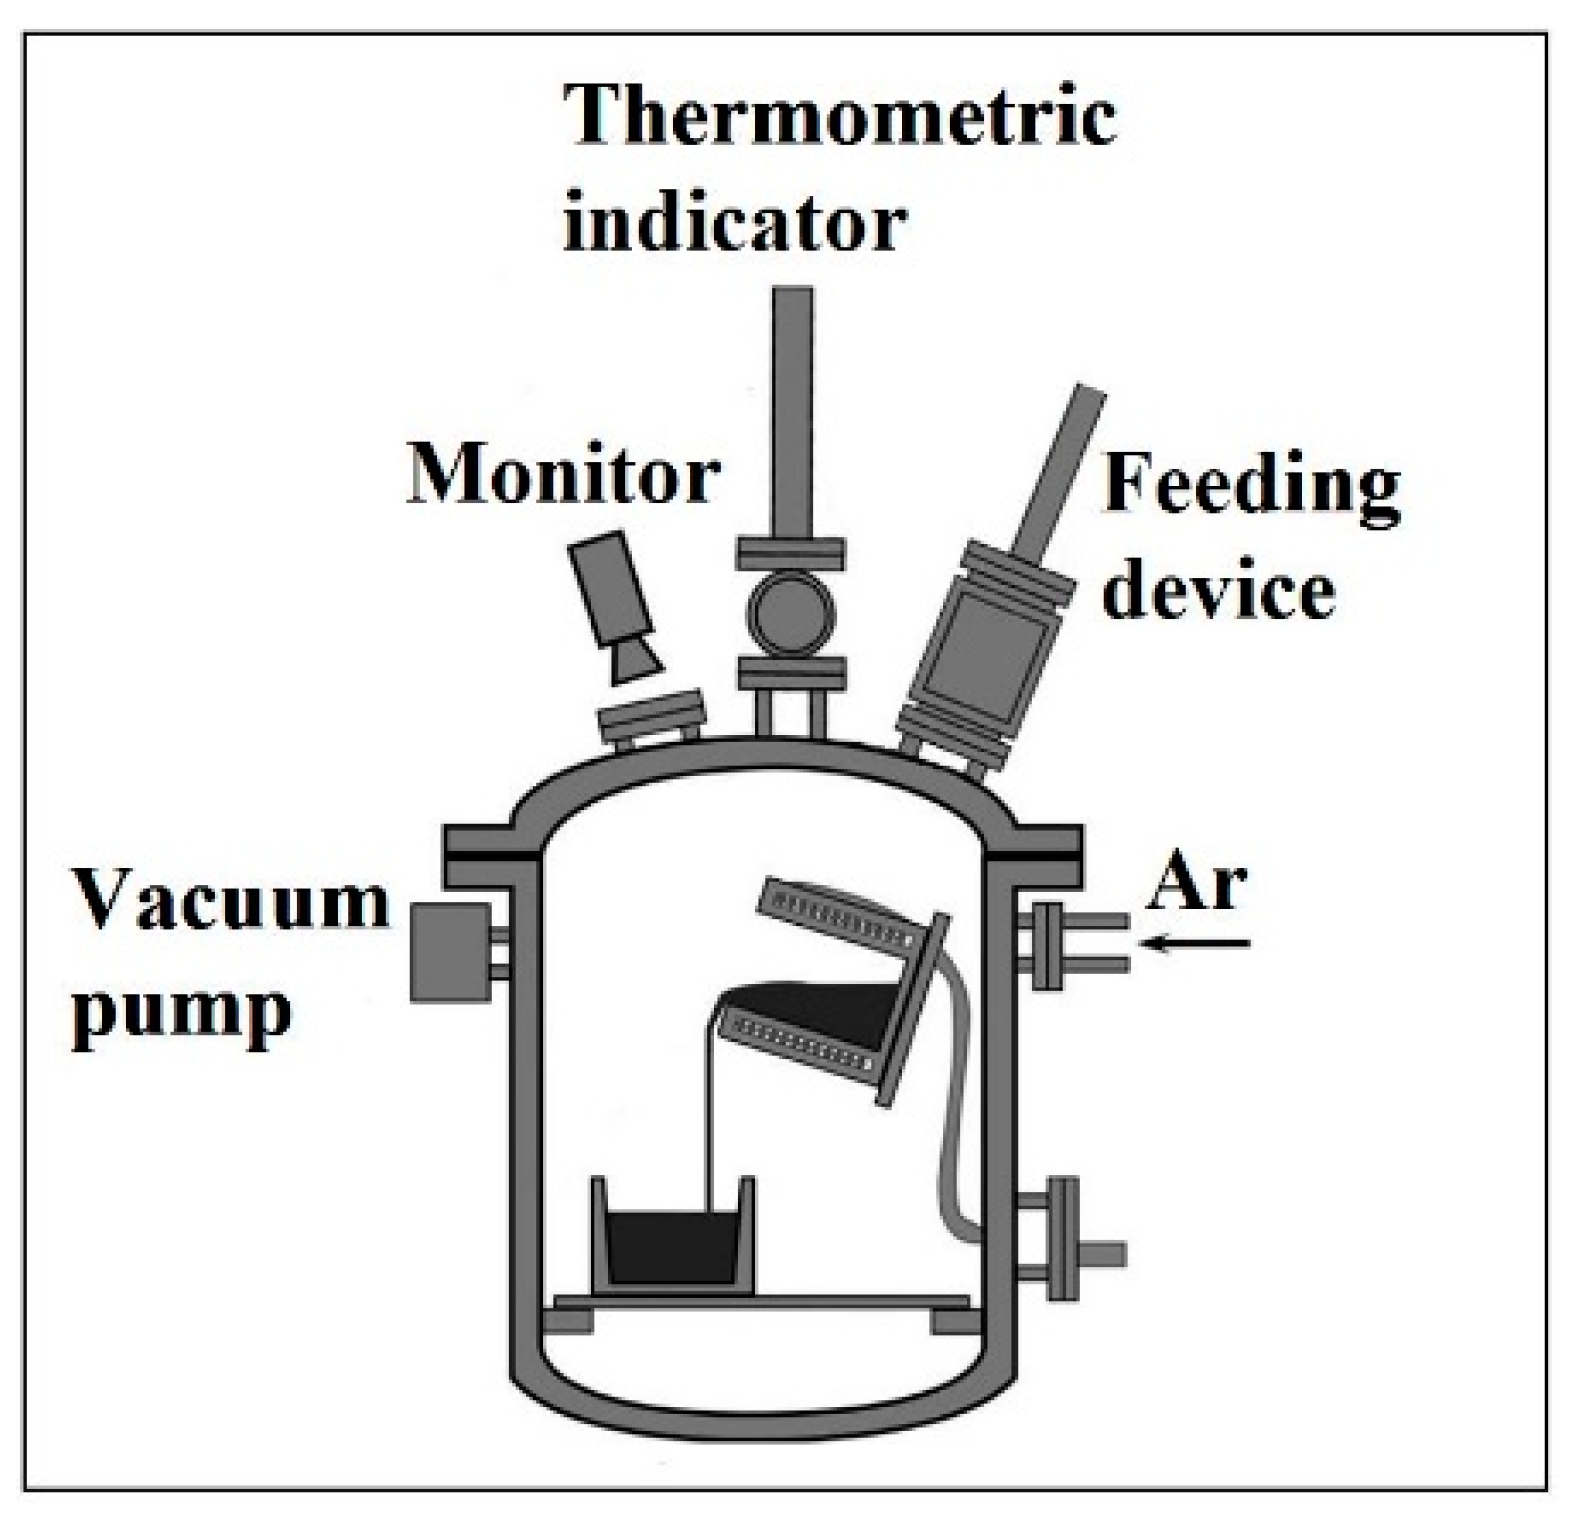
2.1. Experimental Procedure

First, 5 heats of C104Cr saw wire steel with different cerium addition (0 wt %, 0.03 wt %, 0.05 wt %, 0.08 wt %, and 0.10 wt %) were prepared using a 30 kg vacuum induction furnace. After solidification and the subsequent cooling process, the inclusions in the steel were then studied. The schematic diagram of the experimental setup is shown in Figure 1. A MgO·Al2O3 crucible was used in this experiment. The cerium was supplied by IMR (Institute of Metal Research, Chinese Academy of Sciences, Shenyang, China), and pure iron (the main impurity components were as follows: C–0.0017%, Si–0.005%, Mn–0.025%, P–0.0095%, S–0.0064%, Cr–0.014%, N–0.0036%, O–0.0086%, and Al–0.003%), carbon, chromium, silicon, and manganese were prepared before the smelting experiment. During the smelting process, cerium was added after thorough vacuum carbon pre-deoxidization in order to prevent the formation of Ce2O3 inclusions. The smelting process can be summarized as follows: (i) Pure iron, chromium, and carbon (80% of the total mass) were added to the crucible, and the other alloy materials were loaded into hoppers in the order of silicon, carbon (20% of the total mass), manganese, and cerium; (ii) vacuuming was started, and the heating system was turned on; (iii) the pressure in the furnace was maintained at below 5 Pa for 20 min; (iv) the argon was piped into the furnace for testing; (v) when the temperature of the molten steel reached 1873 K (1600 °C), silicon and carbon were added to the molten steel, in turn; (vi) the vacuum pump was started in order to decrease the pressure in the furnace until it reached 1 Pa; (vii) argon was piped into the furnace for production once again; (viii) manganese was added to the molten steel; (ix) by adjusting the power, the temperature was increased to 1833 K~1873 K (1560 °C~1600 °C), and then, cerium was added to the molten steel; and (x) the molten steel was cast into ingots after 3 min.

2.2. Analysis Methods

The mass fraction of O and N in the steel was determined using a Leco TC500 N/O analyzer. The mass fraction of C and S in the steel was measured using an infrared C/S analyzer, and Si, Mn, Cr, Ce, P, and As were detected by an ARL-4460 direct reading spectrometer. The samples for composition analysis were cut from the top, middle, and bottom of the ingots, and the measurements were conducted three times in each sample. The relative standard deviation (RSD) was 0.5%, and the average value was taken as presented in Table 1. The average chemical composition analysis results were shown in Table 1. A JEOL JSM-7800F scanning electron microscope with EDS (Energy Dispersive Spectrometer) and a ZESIS ULTRA PLUS scanning electron microscope with EDS (Energy Dispersive Spectrometer) were used to observe inclusions. An OLYMPUS metallographic microscope equipped with a quantitative metallographic analysis system was applied to study the count and size of the inclusions in each sample. The total observed area for each sample was 0.18 mm2. The samples for inclusion analysis were cut from positions at 0.5R (R = the radius of ingot cross section) and 0.5H (H = the height of ingot) of ingots. The minimum particle size detected in the analysis was 0.463 μm.
In the present study, thermodynamic analysis based on metallurgical physical chemistry was used to study the formation condition of cerium inclusions. The interaction coefficients in the steel at 1873 K are shown in Table 2. According to the Wagner activity model, the activity coefficients of each element are calculated and are shown in Table 3, and the thermodynamic data of some deoxidization reactions used in this research are shown in Table 4.

3. Results and Discussion

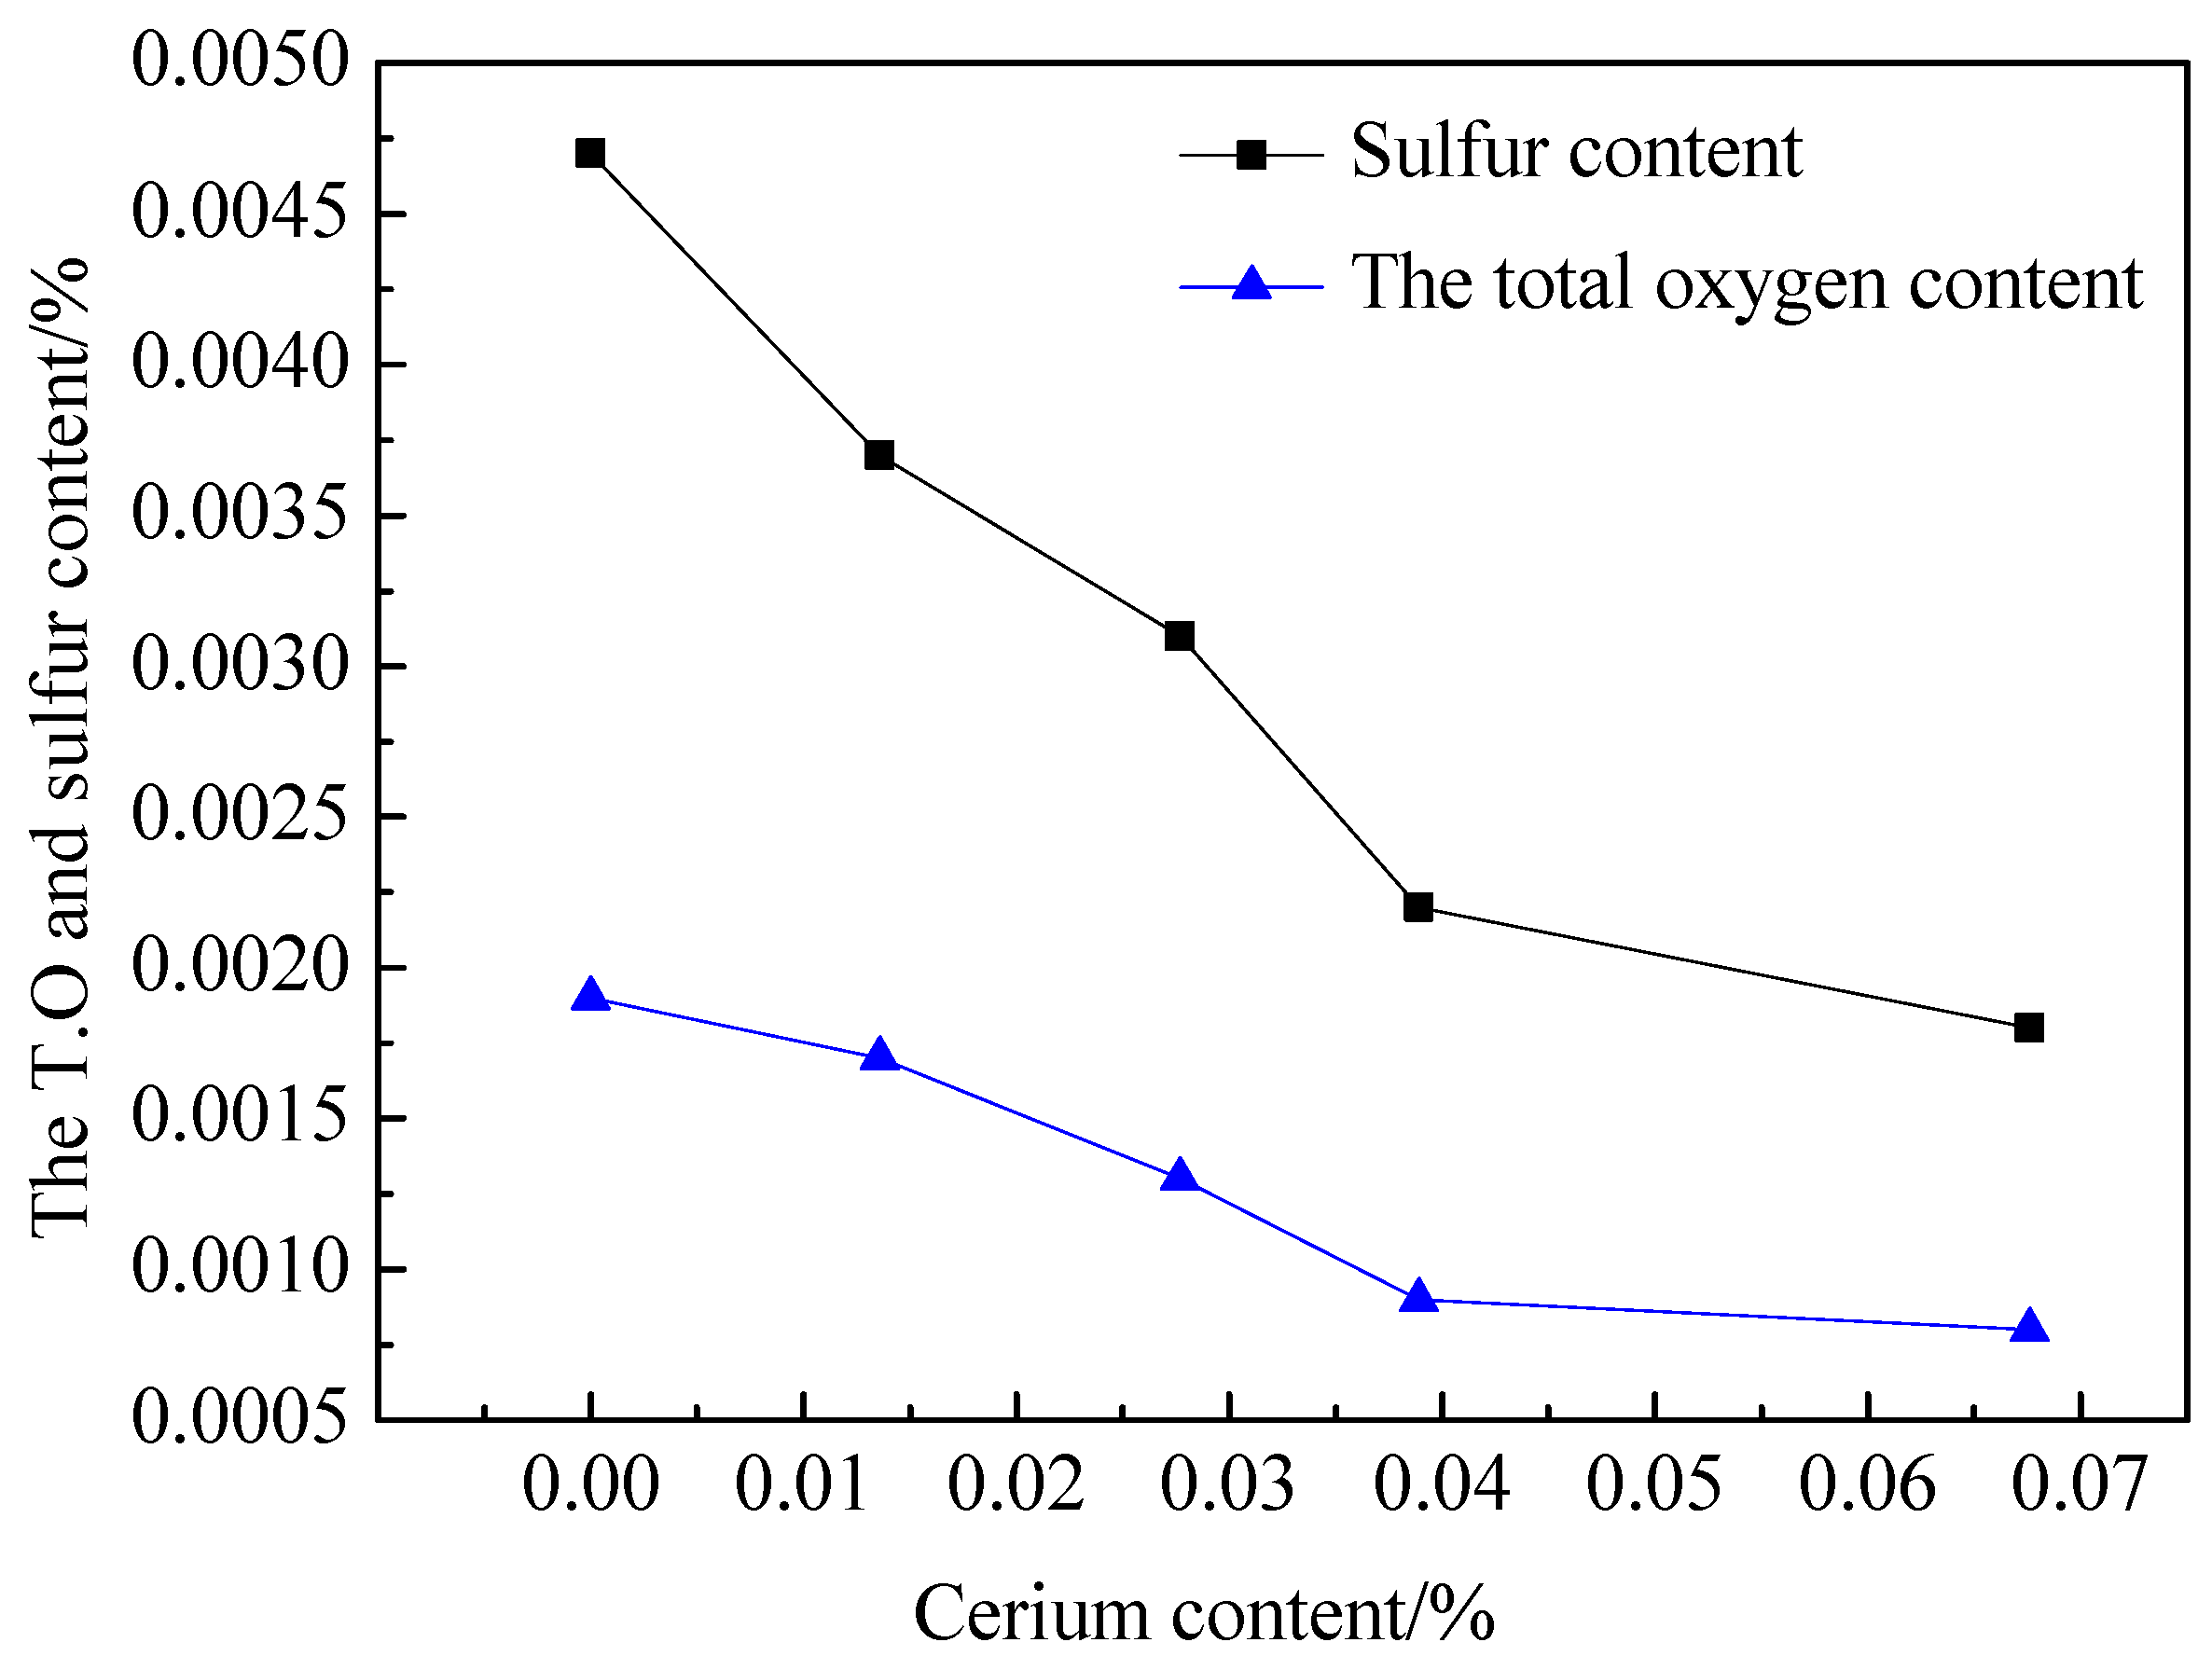
3.1. The Effect of the Cerium Addition on S and Total Oxygen (T.O) Content in C104Cr Steel

The total oxygen content (T.O) is generally considered to indicate the level of oxide inclusions in the steel, and sulfur is a common harmful element in steel. The mass fraction of the total oxygen content and sulfur content of 1#~5# heats are shown in Figure 2, and it is obvious that the total oxygen content and sulfur content in the steel decreases sharply with the increase of cerium content. The lowest total oxygen content can be controlled below 10 × 10−6, and the lowest sulfur content can be controlled below 20 × 10−6. That means cerium can play a role in depth deoxidization and desulfurization on the basis of vacuum carbon pre-deoxidization.

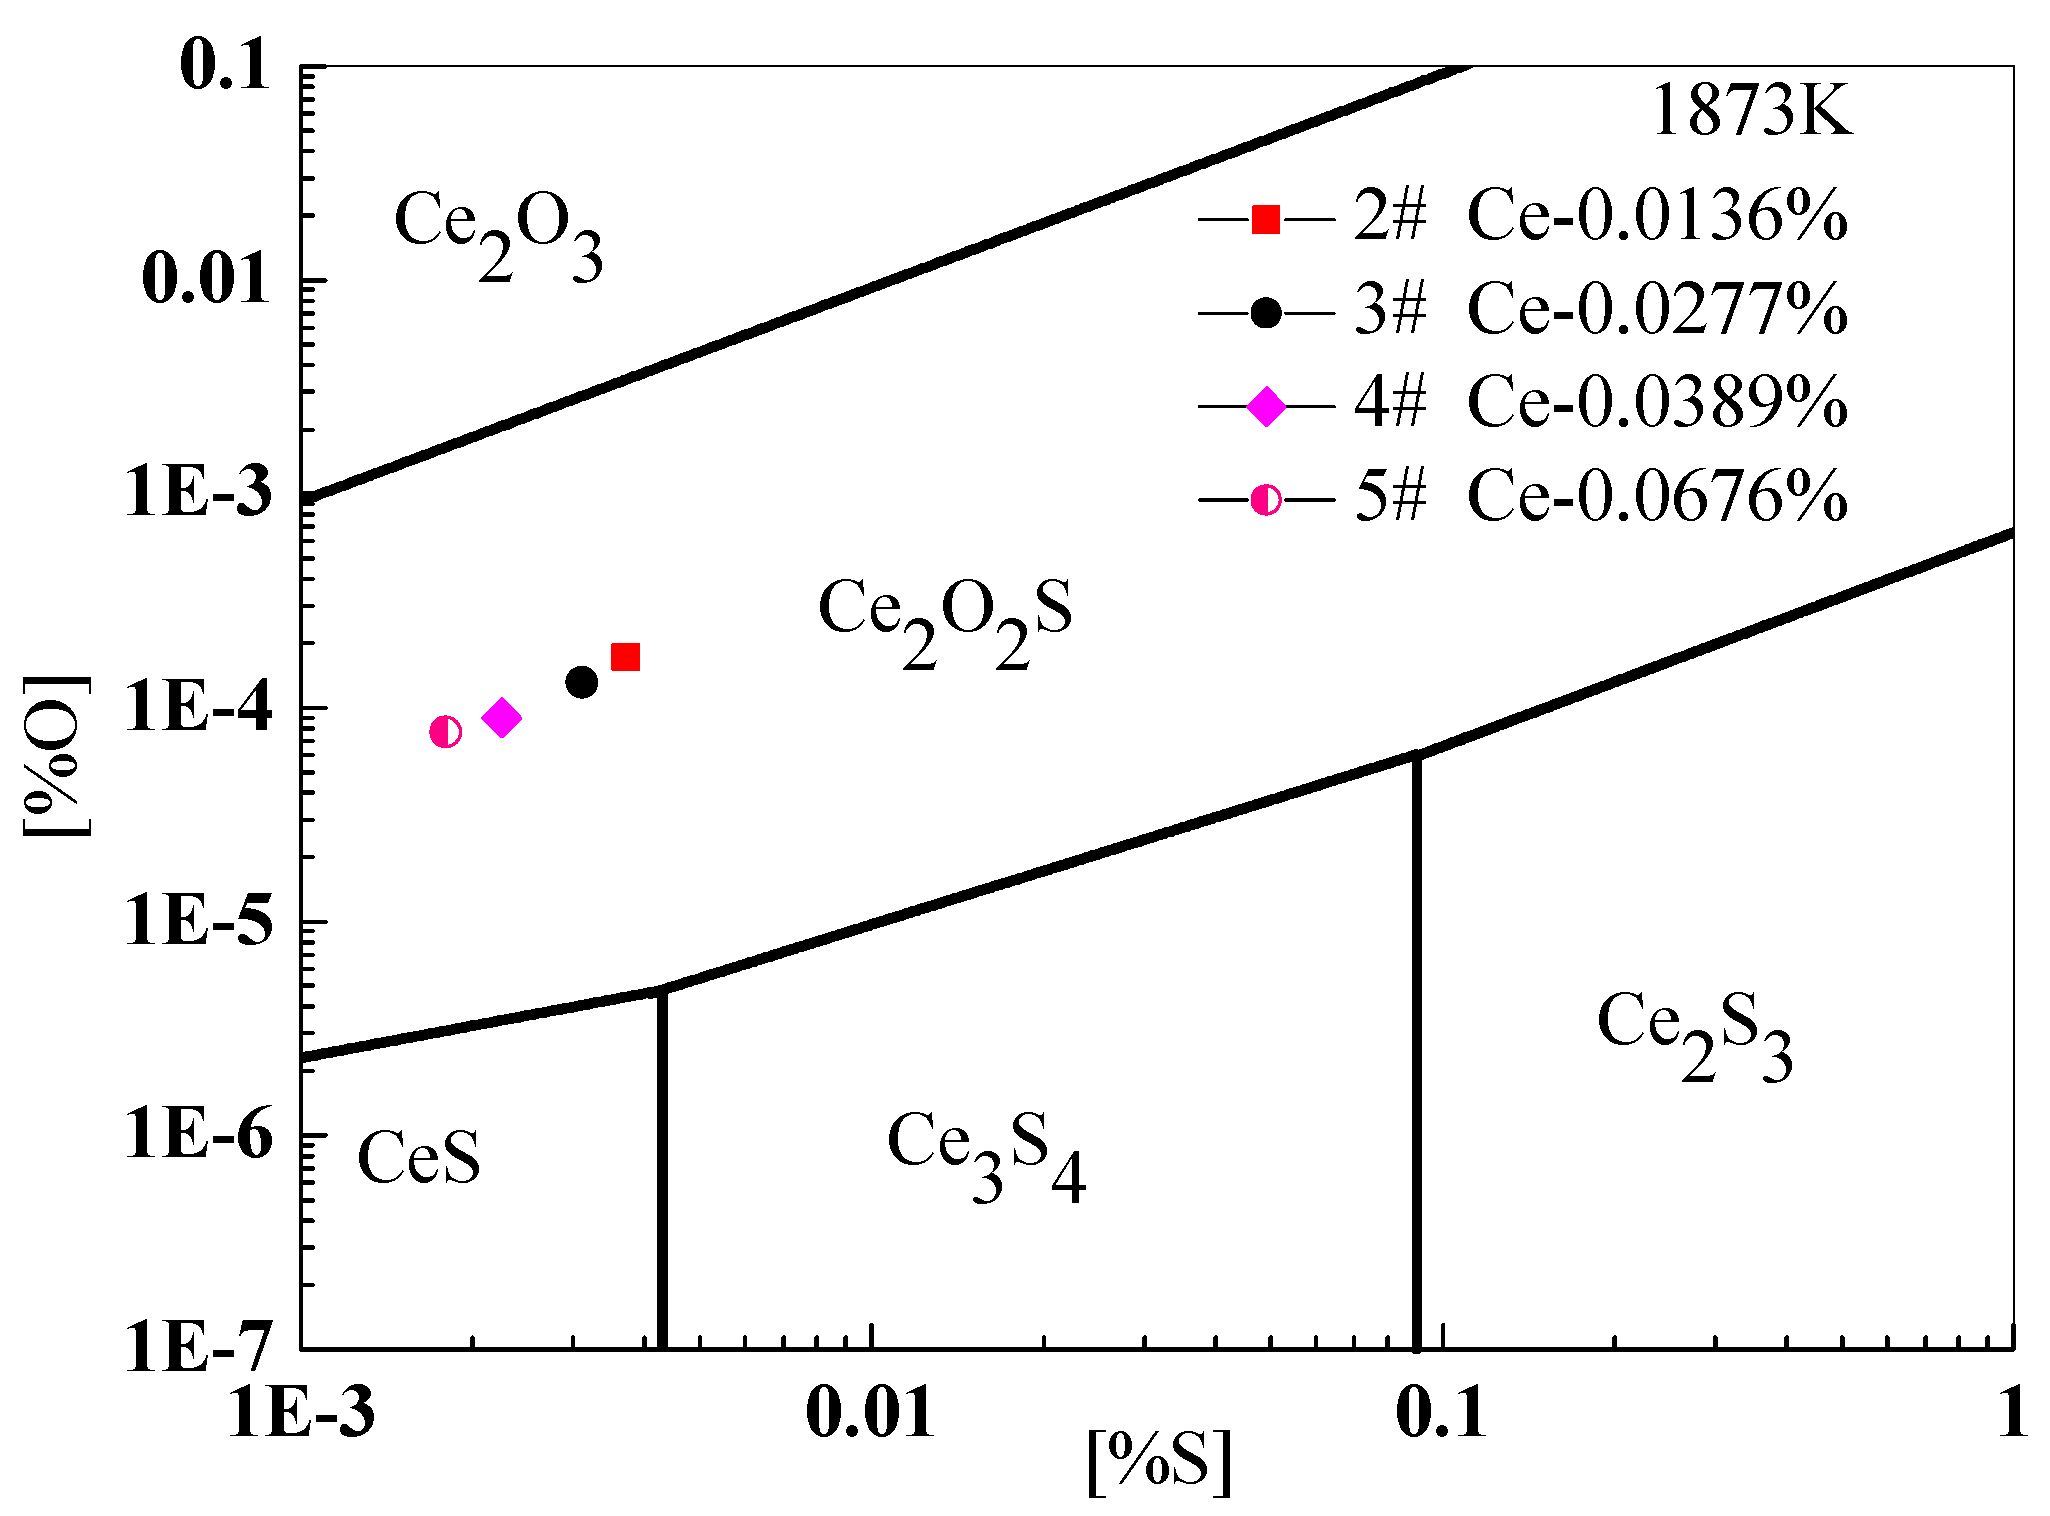
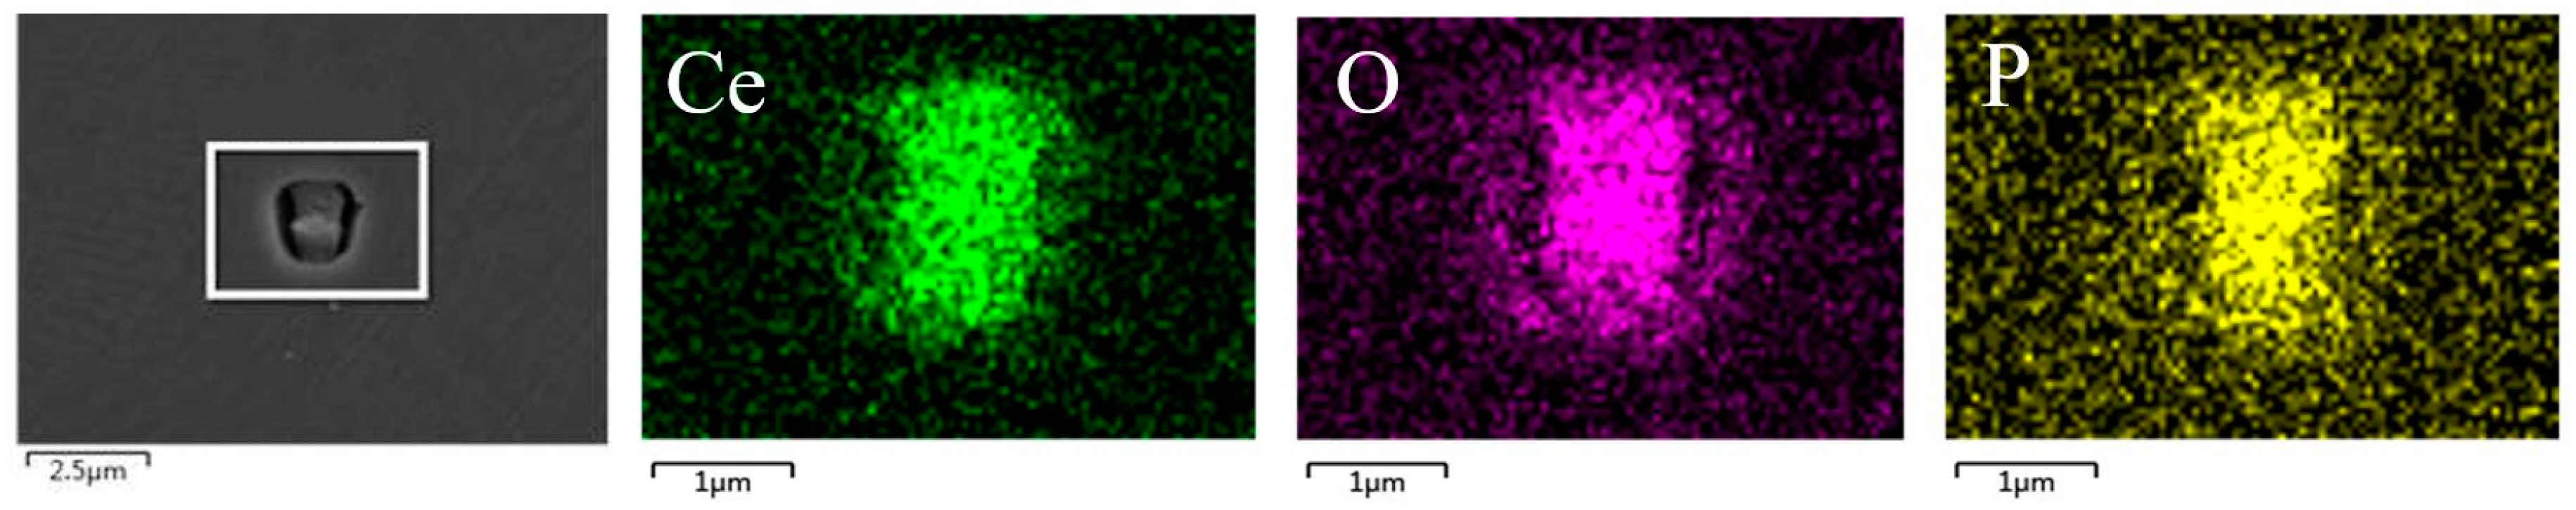
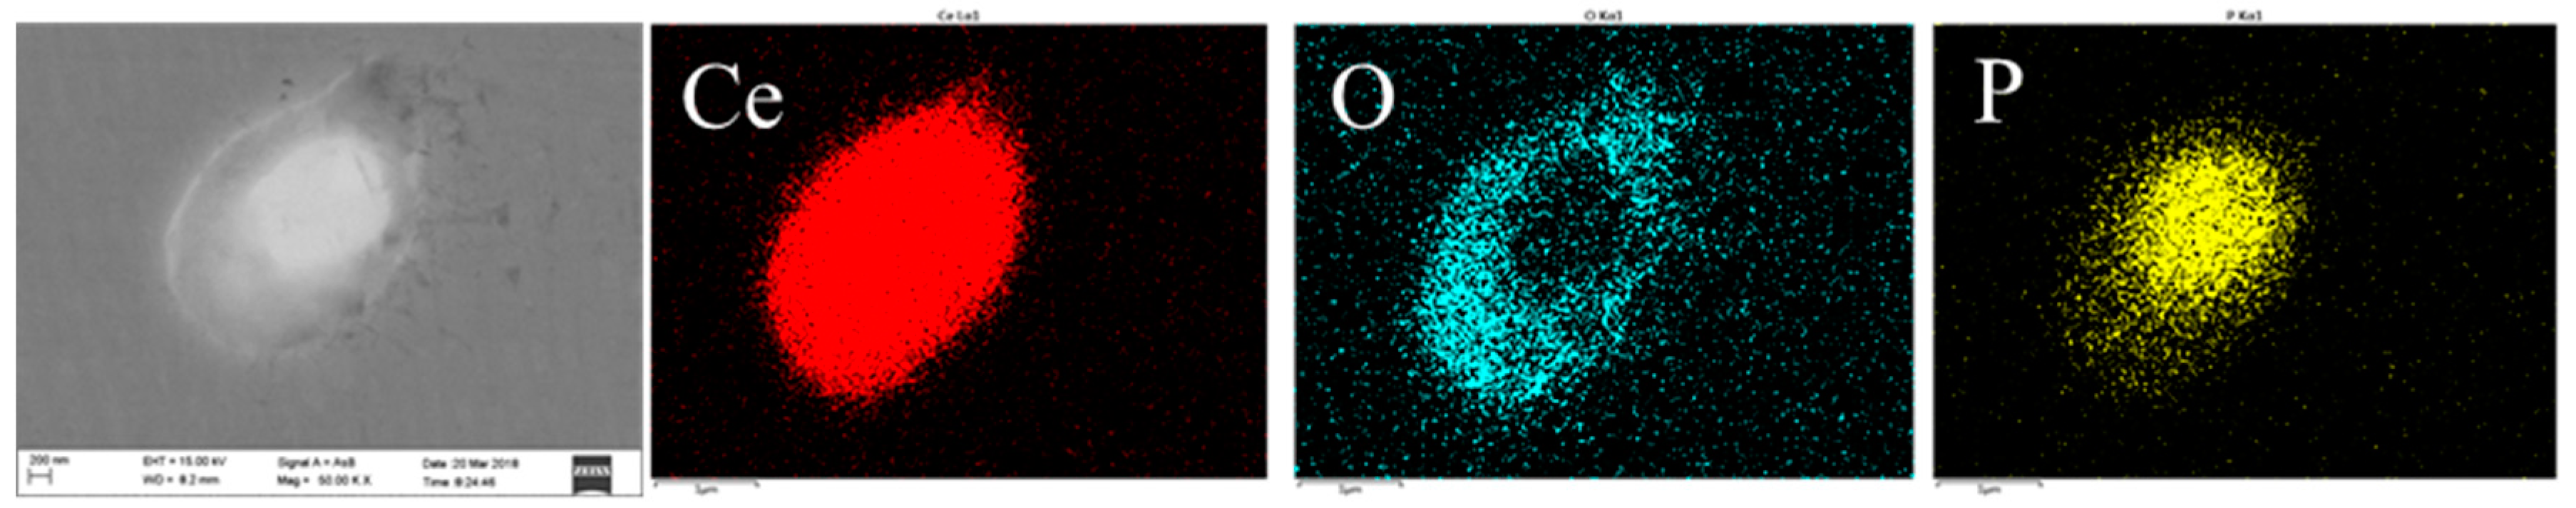
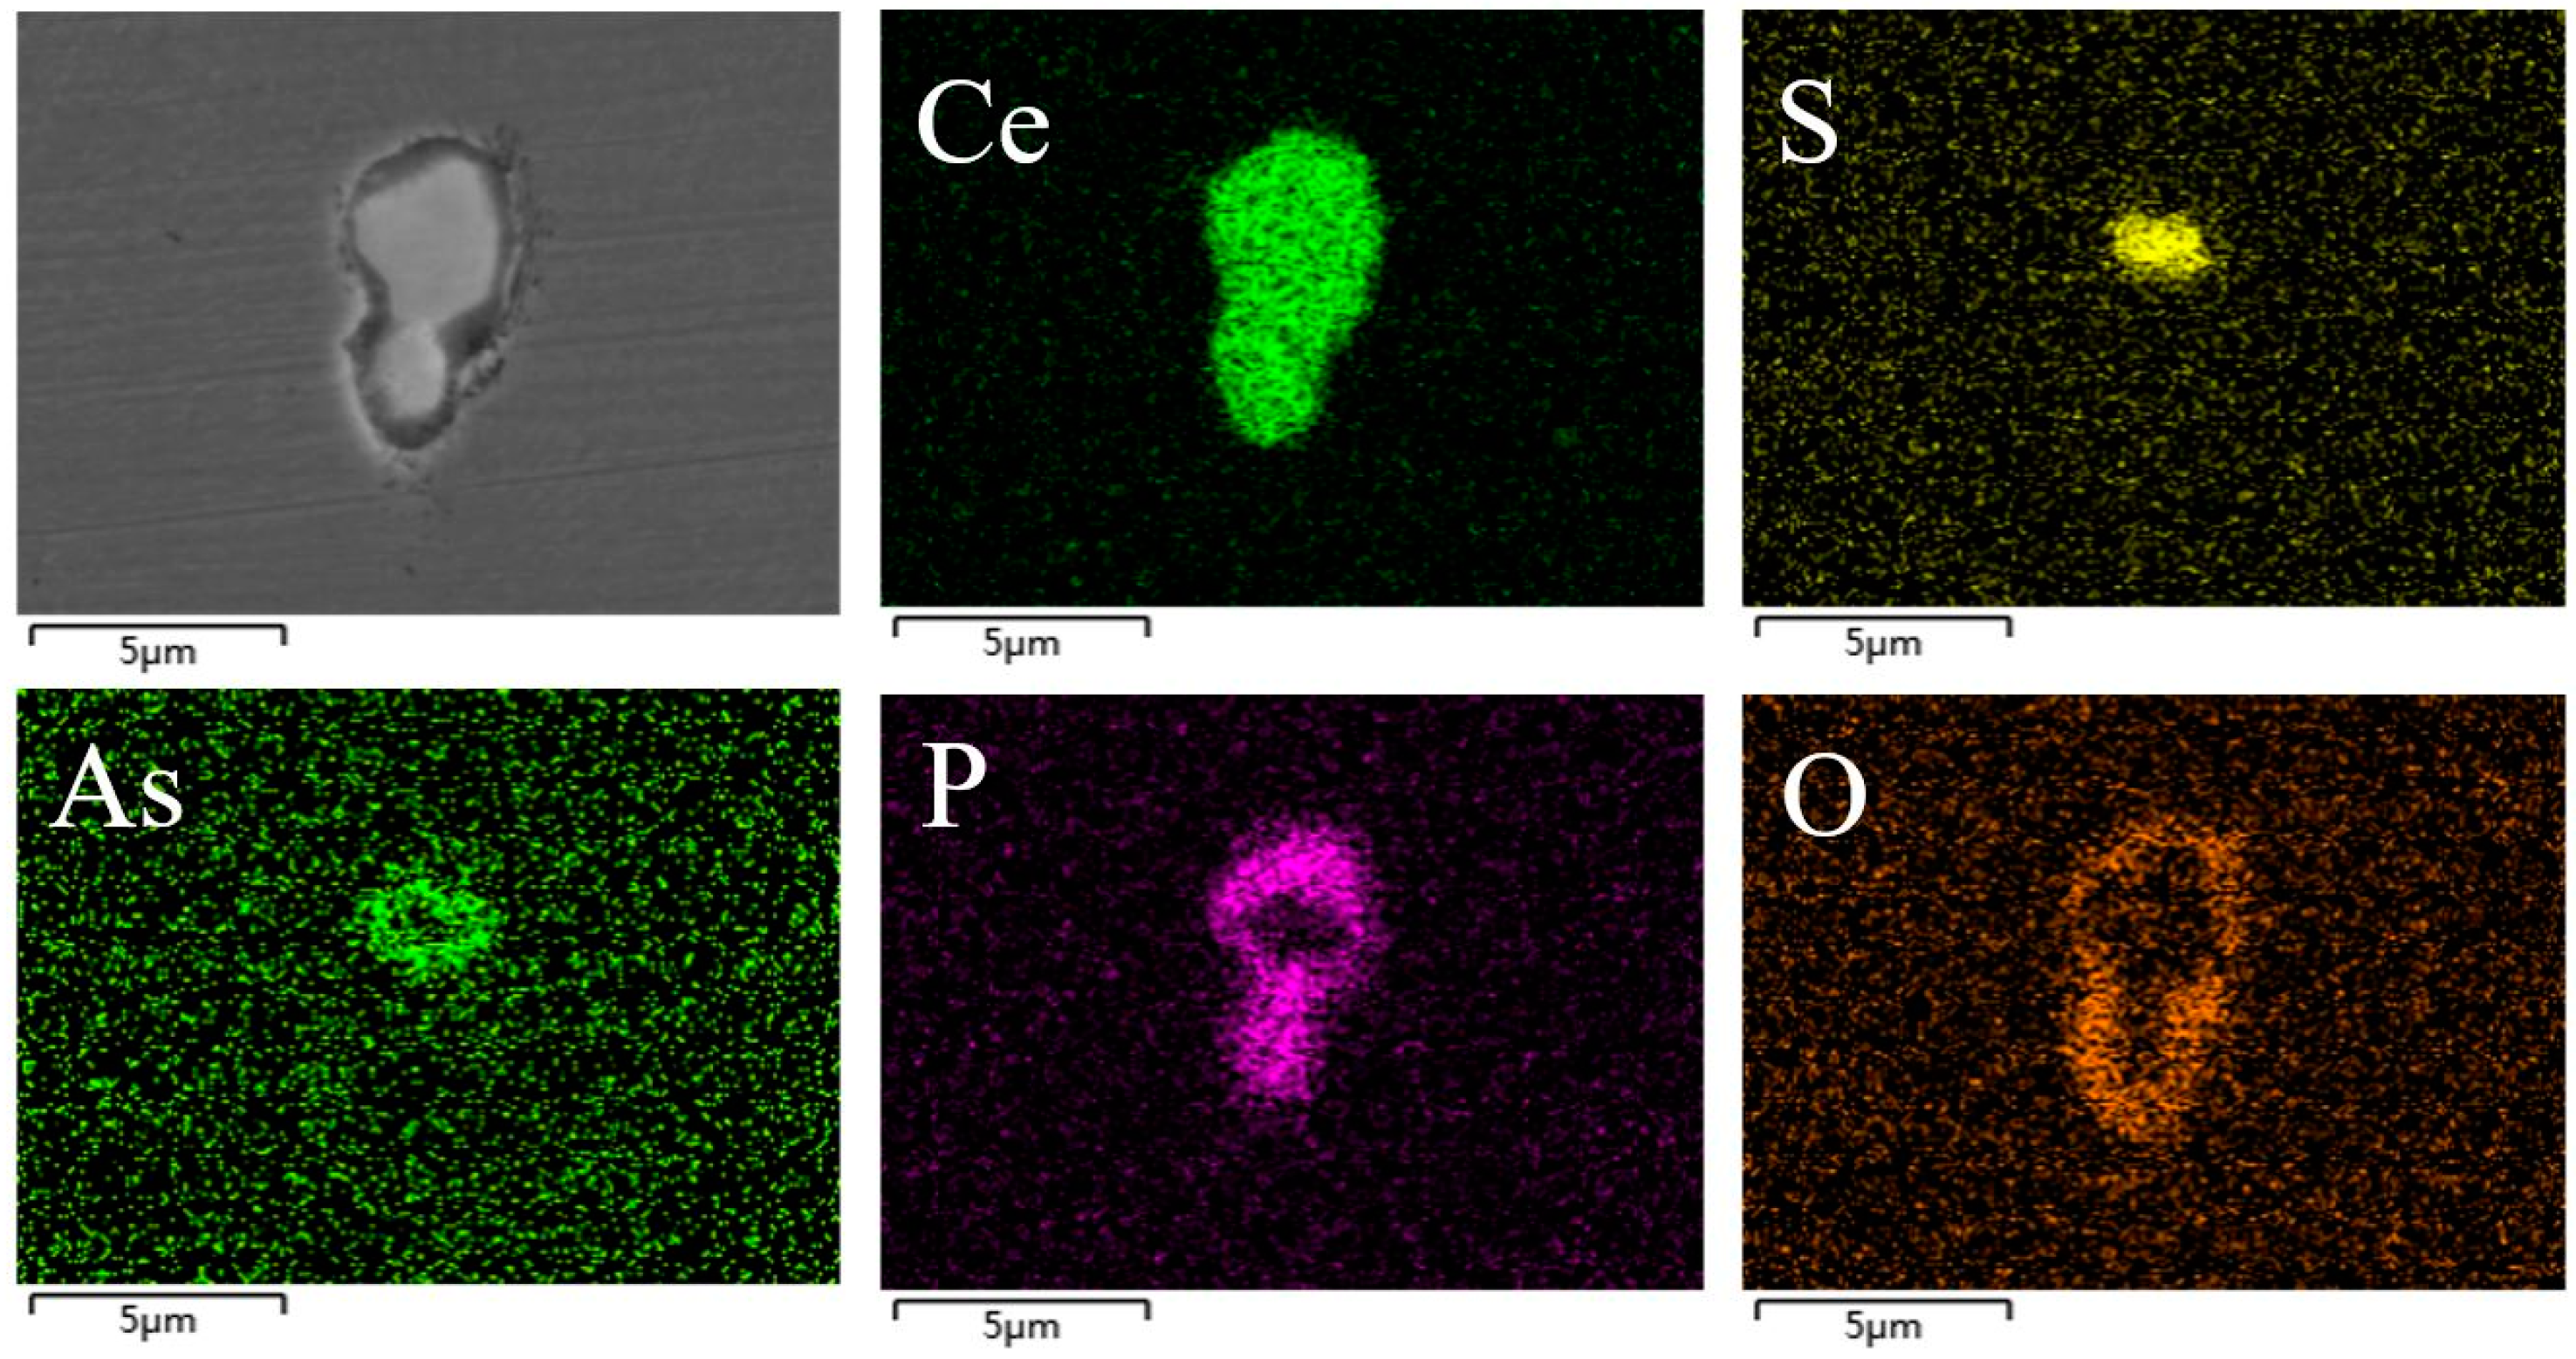
3.2. The Effect of the Cerium Addition on the Characteristics of Inclusions

Typical inclusions in 1#~5# steel samples were presented in Table 5. In 1# steel without the cerium addition, the typical inclusions were MgO·Al2O3, Al2O3, and MnS. When the content of cerium in steel was 0.0136% and 0.0277%, the main inclusions in steel were Ce–O–S, and when the content of cerium was 0.0389% or above, the inclusions in the steel were Ce–O–S, CeS, Ce–S–O–P(As), Ce–O–P, and Ce–P(As). According to the energy spectrum of the Ce–O–S inclusions in Table 5, the S content of Ce–O–S inclusions was high, and these kinds of inclusions were judged to be Ce2O2S and CeS inclusions. Ce–S–O–P(As) inclusions and Ce–O–P inclusions were presumably composed of various inclusions, so these two inclusions need to be further examined for judging the composition and structure with SEM-mapping of elements.
In order to study the formation conditions of the cerium inclusions, the phase stability diagram of the inclusions bearing cerium in the C104Cr steel was founded when [%Ce] was set as 0.0277%, as shown in Figure 3. The [%O] and [%S] of 2#~5# steel are labeled in Figure 3 and [%O] was set as approximately 10% of the total oxygen. Points of the 2#~5# steel fall into the formation region of Ce2O2S. The [%O] in steel is too low to meet the formation condition of Ce2O3, and this is in good agreement with the experimental results.
In order to clarify the formation mechanism of the cerium composite inclusions in the 4#~5# steel, SEM-mappings of typical Ce–O–P inclusions and Ce–S–O–P(As) inclusions were conducted, and the results are shown in Figure 4, Figure 5 and Figure 6.
According to the SEM-mappings results, there are two kinds of Ce–P–O inclusions in the 4#~5# steel:
(i) The first type of Ce–P-O inclusions is shown in Figure 4; cerium, phosphorus, and oxygen are distributed throughout the whole inclusion, and the concentration is uniform and without fluctuation. The atomic percentages of cerium, phosphorus, and oxygen were determined to be nearly 1:4:1 (cerium/phosphorus/oxygen = 17.5%:71.9%:10.6%) using EDS. It is speculated that this indicates that they are CePO4 inclusions. Wang et al. [17] reported that they found LaAsO4 inclusions in high carbon steel with a lanthanum content of 0.059%. However, there is no literature on the thermodynamic data of cerium phosphate, so the formation mechanism of this type of inclusion needs further research.
(ii) The second type of Ce–P–O inclusion is a kind of double-layer composite inclusion, as shown in Figure 5. Cerium is distributed throughout the whole inclusion, phosphorus is distributed in the center of inclusion, and oxygen is distributed in the outer layer of the inclusion. Therefore, this type of inclusion is a two-layer composite inclusion with a core of CeP covered with Ce2O3.
Figure 6 presents the SEM-mappings of the typical Ce–S–O–P(As) inclusion. The results show that the cerium is distributed throughout the inclusions and the sulfur, arsenic, phosphorus, and oxygen are distributed from the inner layer to the outer layer, respectively. Thus, a possible formation order of each inclusion was obtained, and sulfide, arsenide, phosphide, and oxide formed sequentially in the steel. Therefore, this type of inclusion is a four-layer composite inclusion with a core of CeS covered with CeAs, CeP, and Ce2O3, successively.

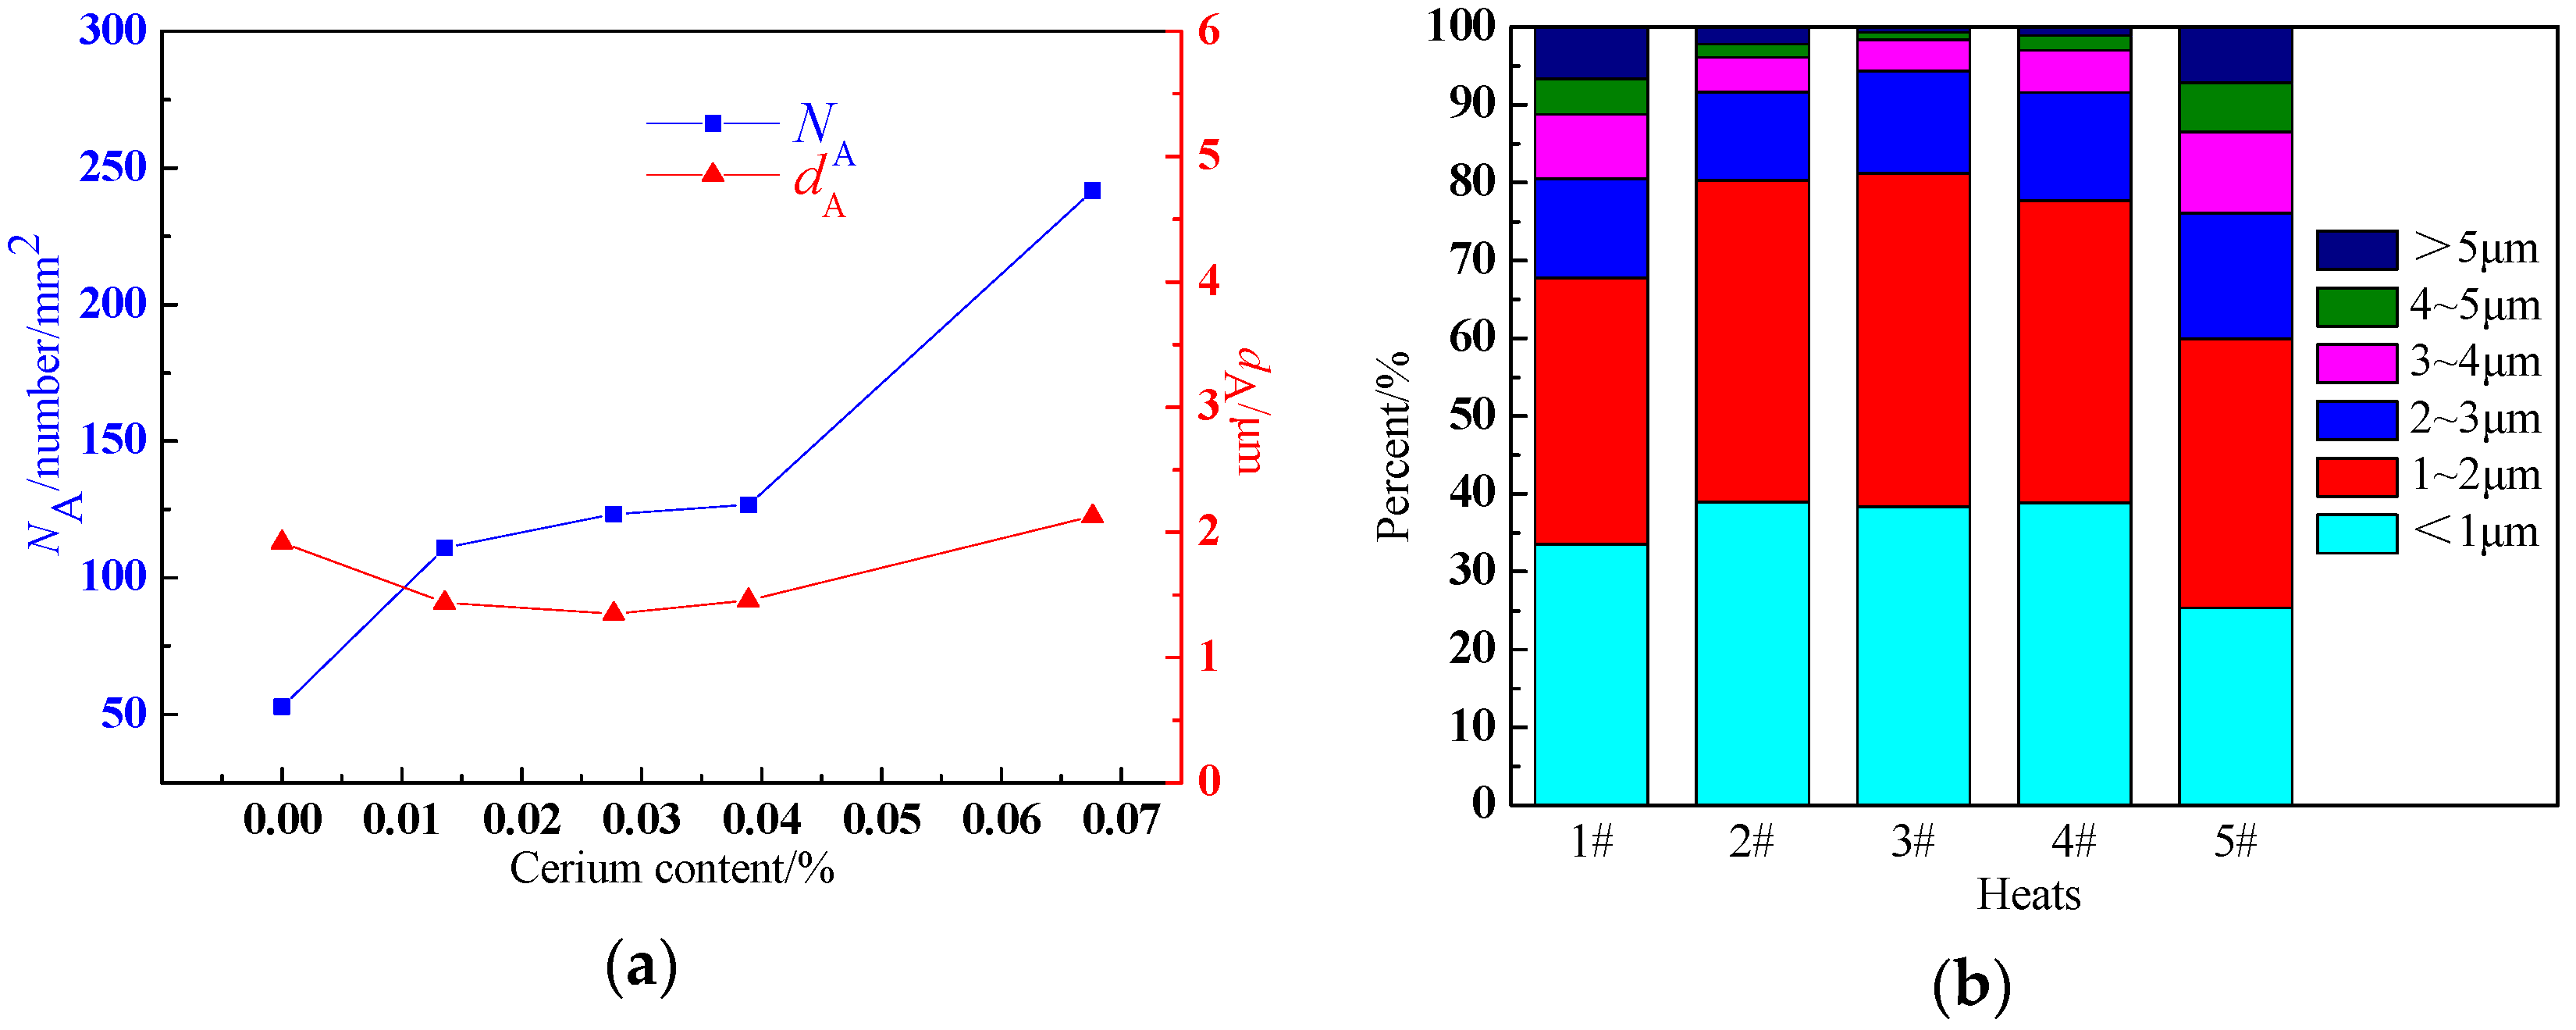
3.3. The Effect of the Cerium Addition on the Number, Size, and Distribution of Inclusions

Figure 7a shows the variation of the number of inclusions per unit area NA and the average size dA with different cerium contents. The number of the inclusions per unit area NA increased significantly with the increase of the cerium content, and it reached its maximum when the cerium content was 0.0676%. The average diameter of the inclusions, dA, experienced some fluctuation, falling slightly to 1.35 μm and then rising dramatically to 2.13 μm. When the cerium content was less than 0.0389 wt % (4#), it could effectively realize the refinement of the inclusions in the steel, and the number of inclusions experienced a small increase. So, a proper cerium addition is beneficial to promote the miniaturization of the inclusions. When the content of cerium was more than 0.0389 wt %, the inclusion diameter and the number of inclusions suffered an increase at the same time. This is because cerium composite inclusions formed in the steel with a high cerium content, and their particle diameters were larger than that of the single particle inclusion.
Figure 7b shows the diameter distribution of the inclusions in the 1#~5# steel. It is obvious that the proportion of large-sized inclusions (especially for sizes larger than 5 μm) in the steel experienced some fluctuation and decreased sharply when the content of cerium increased from 0 to 0.0277 wt %, suffering a dramatic increase when the content of cerium increased to 0.0676 wt %.

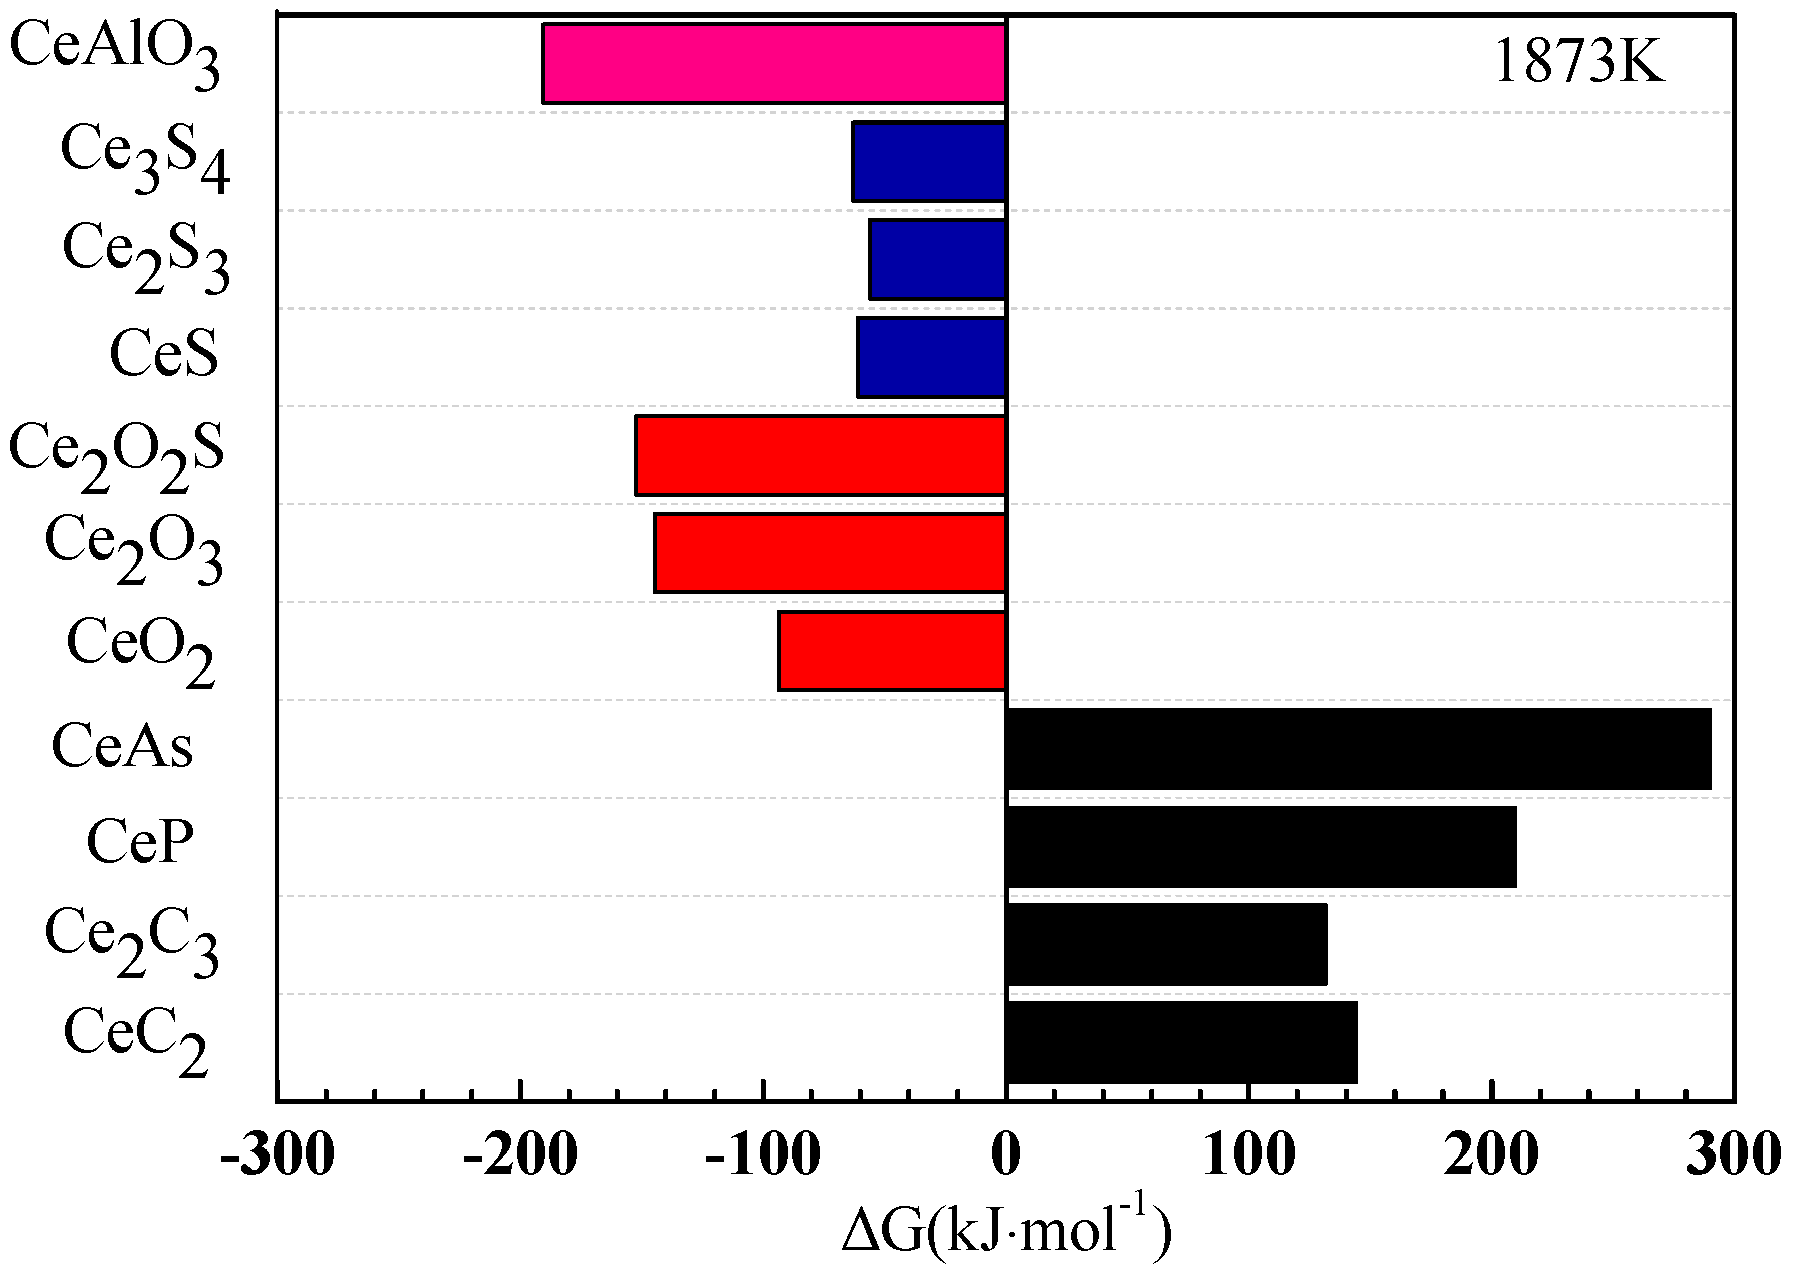
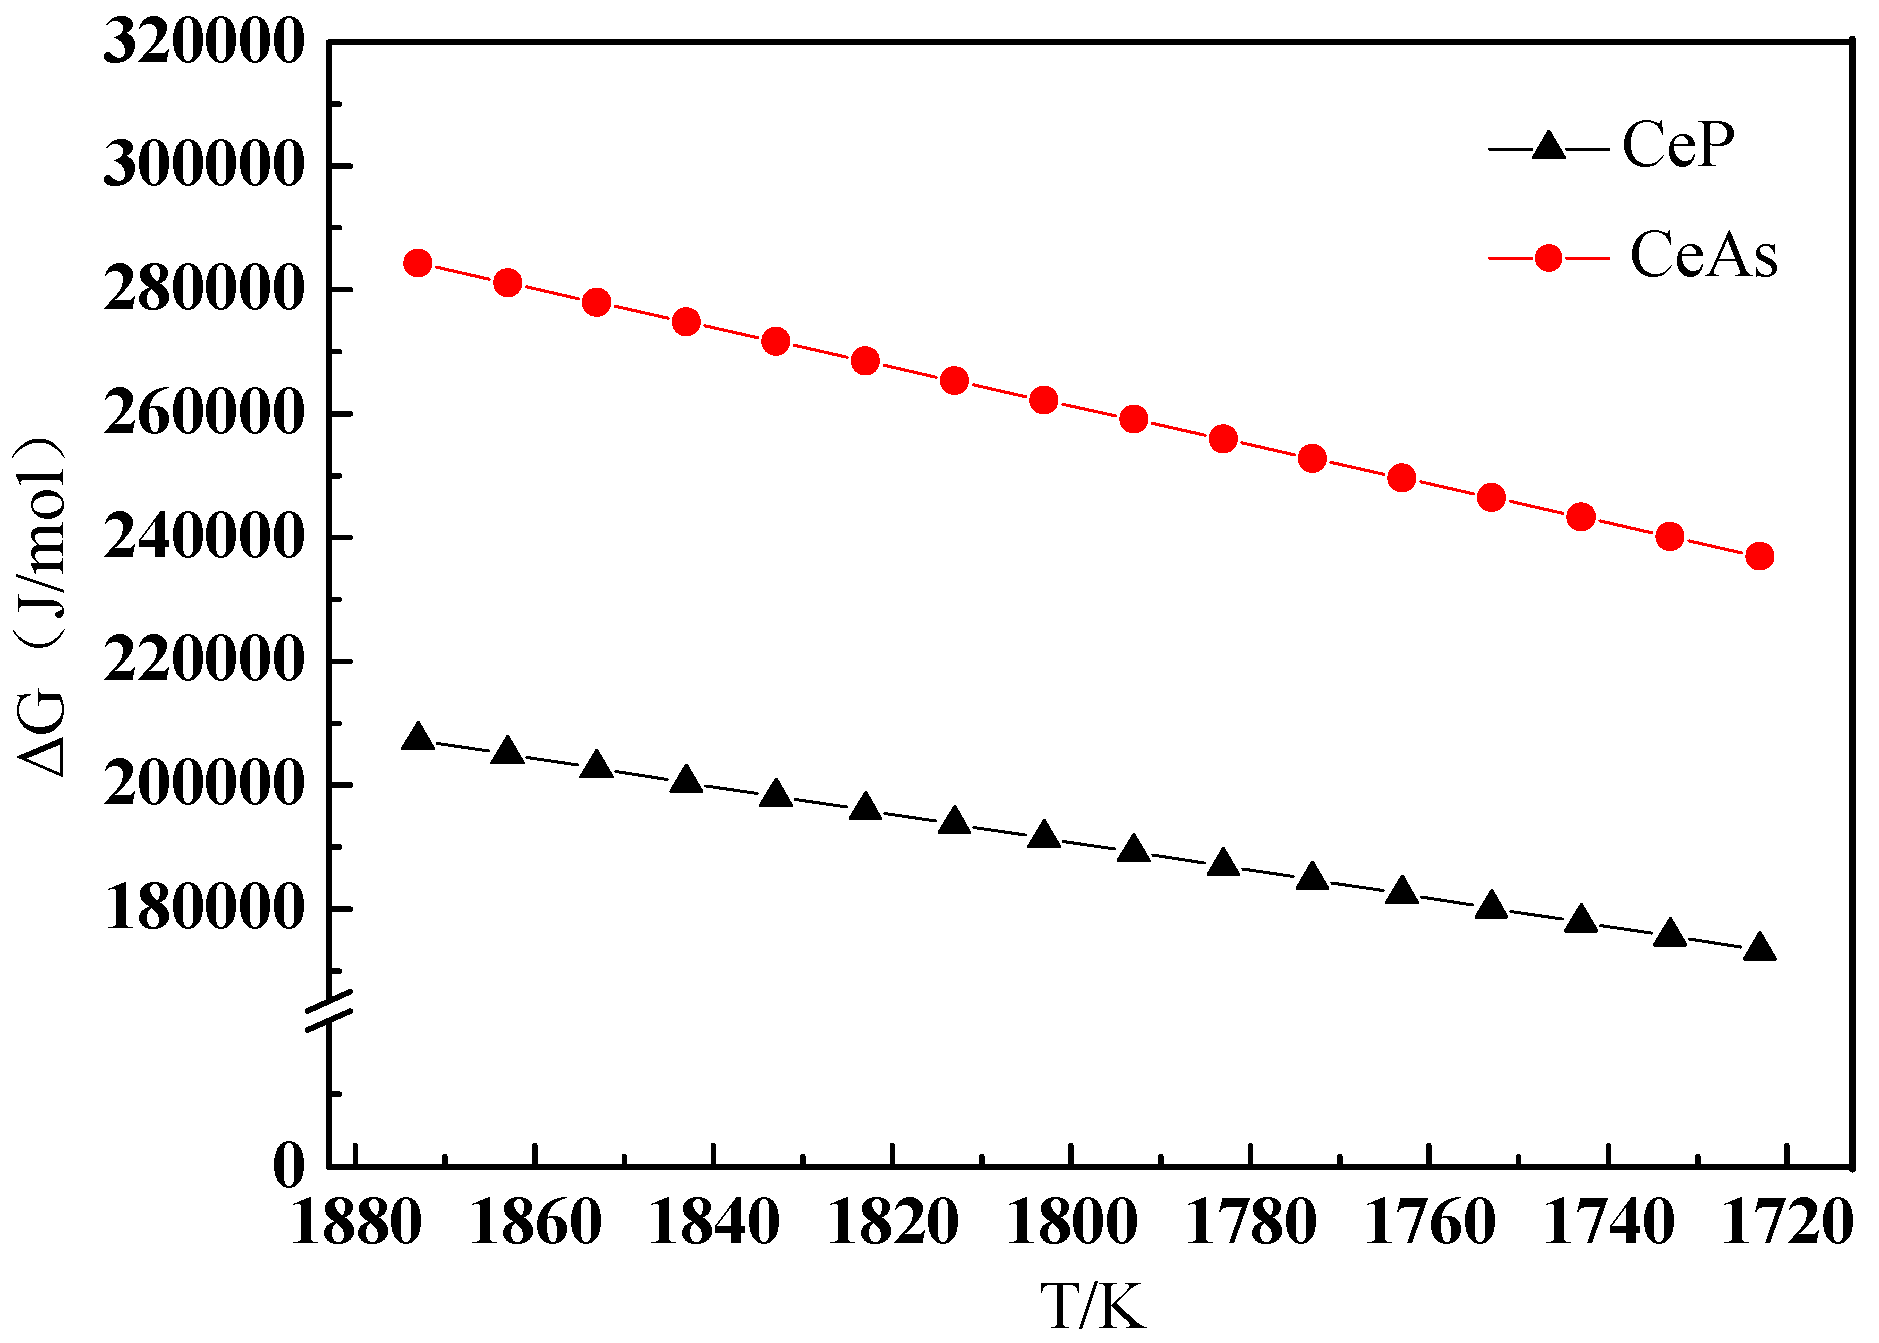
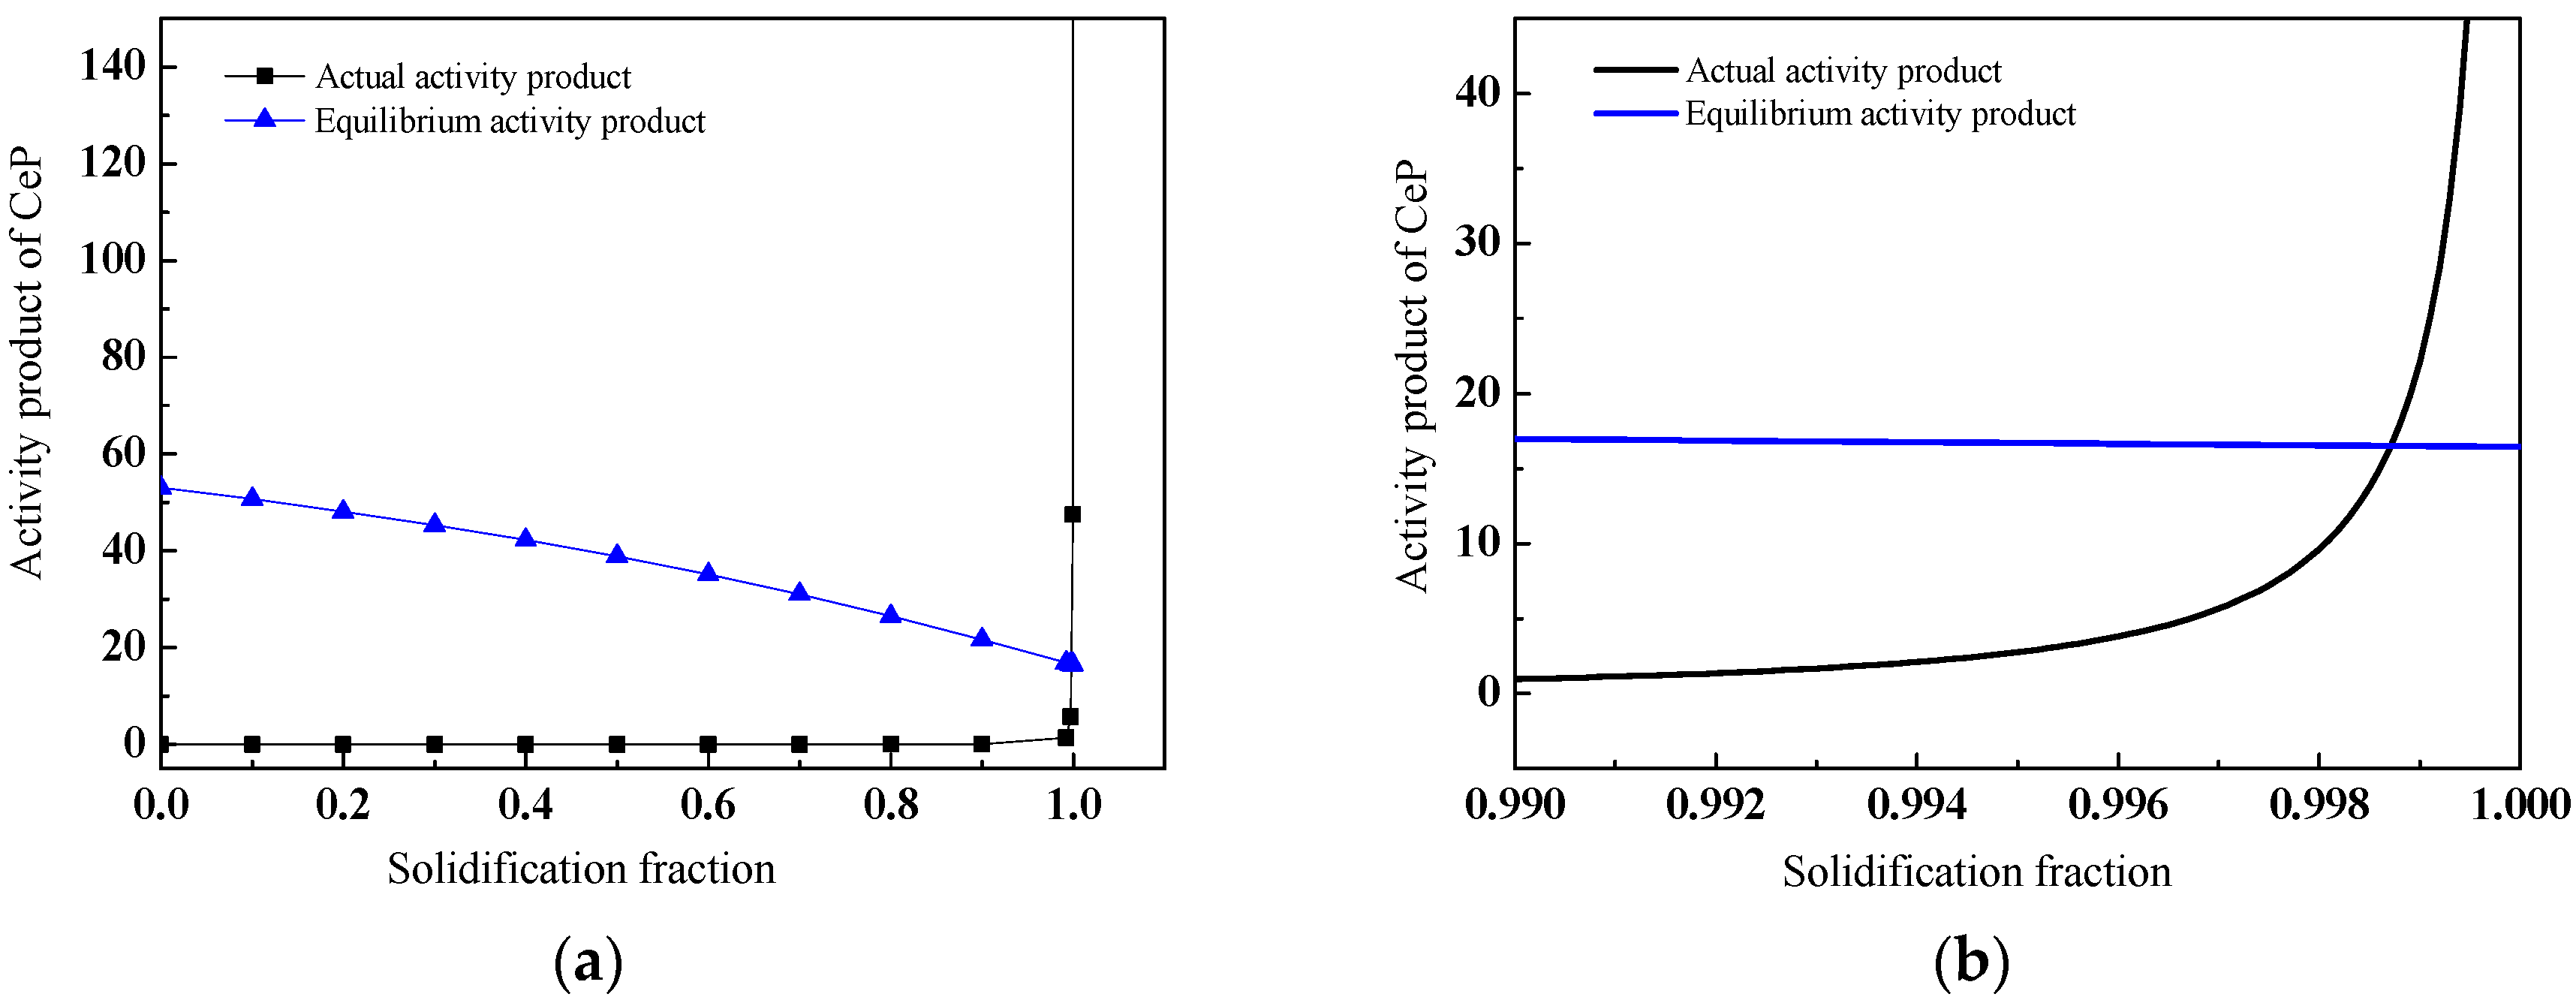
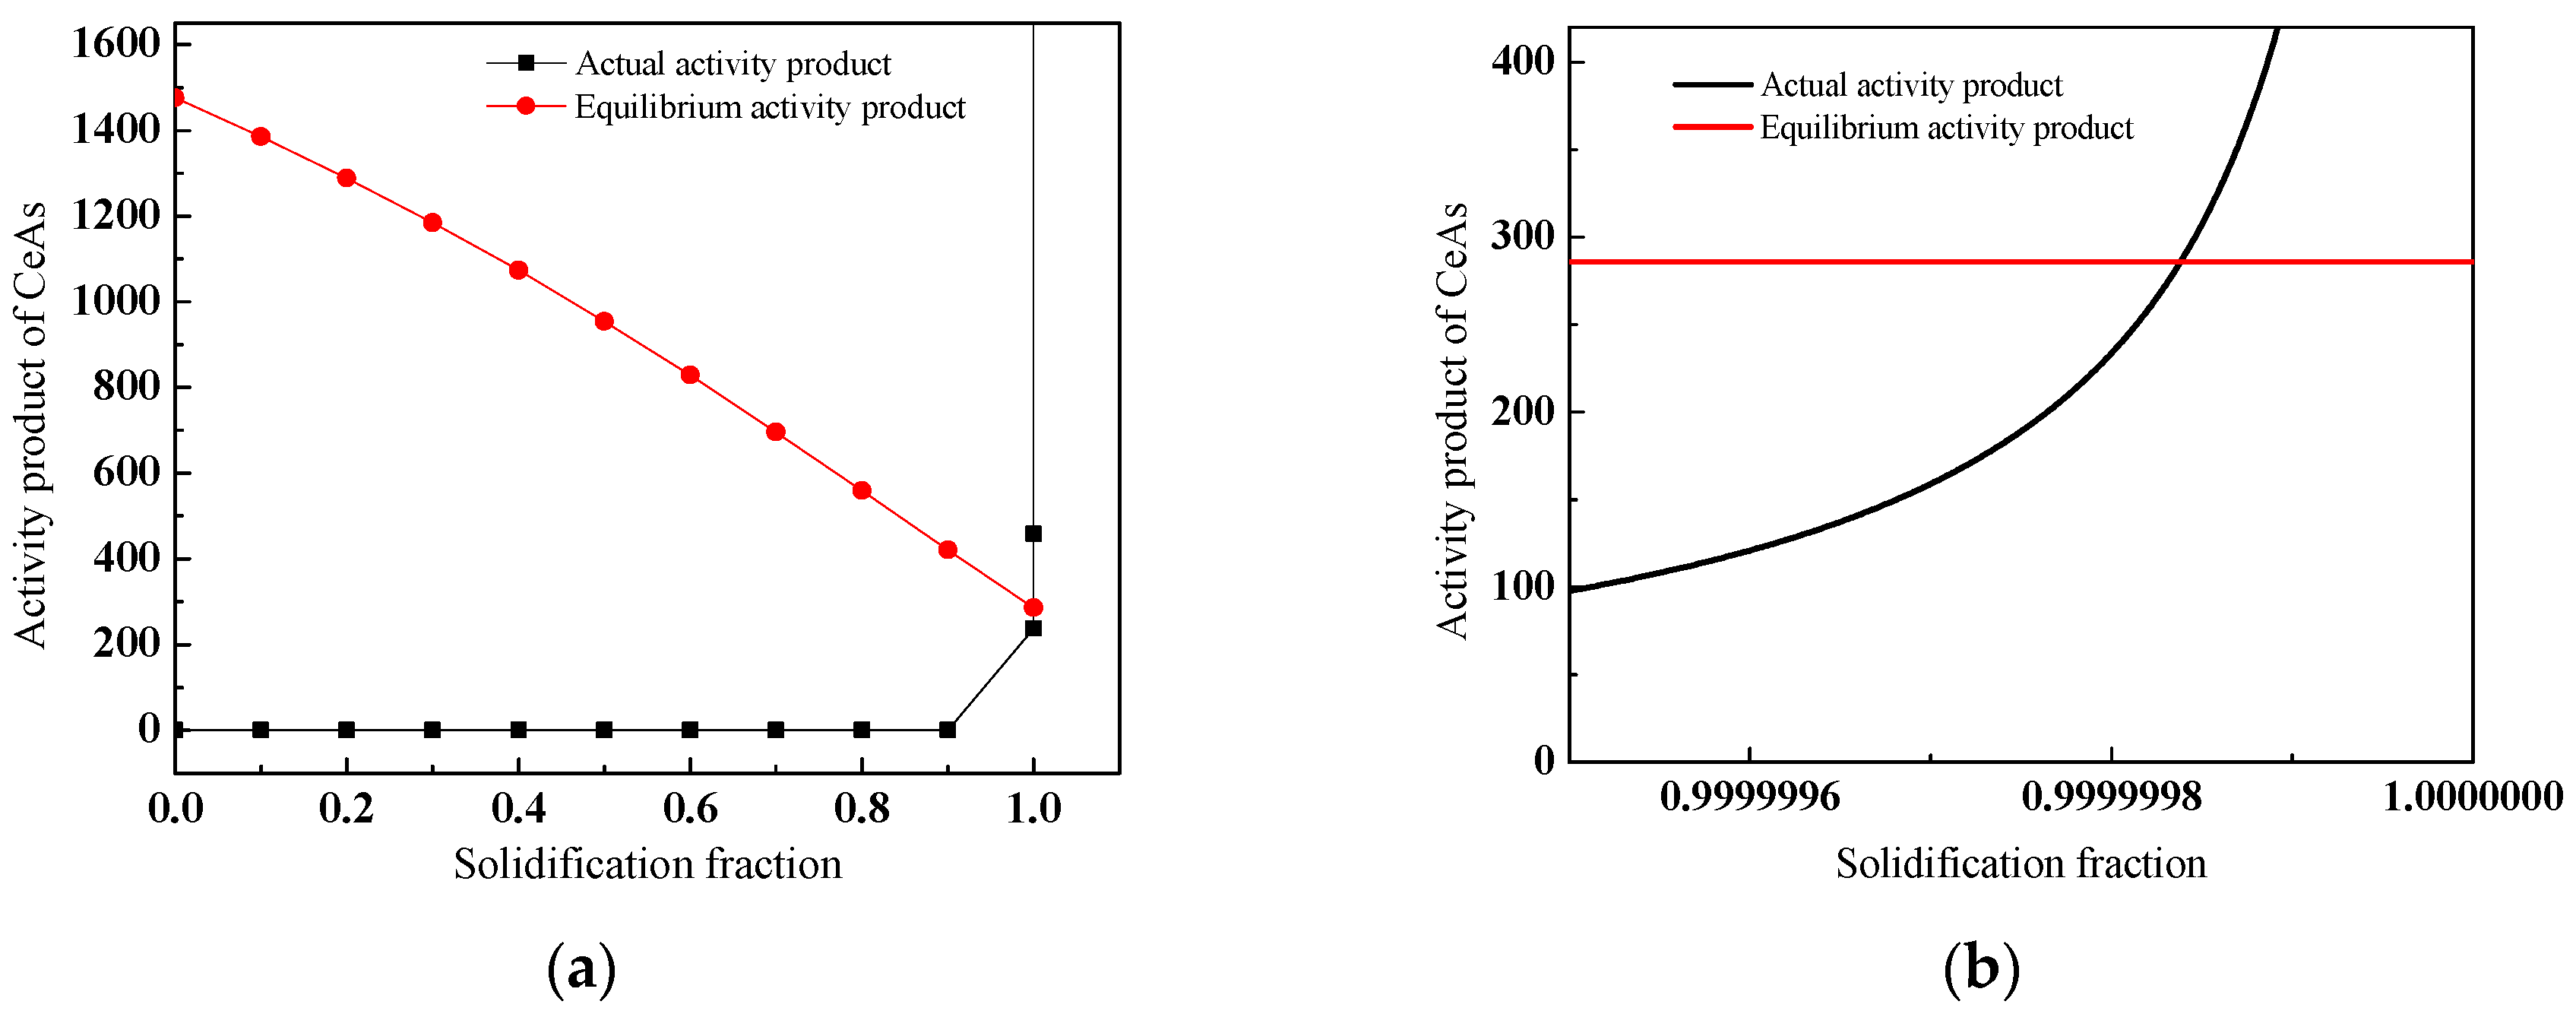
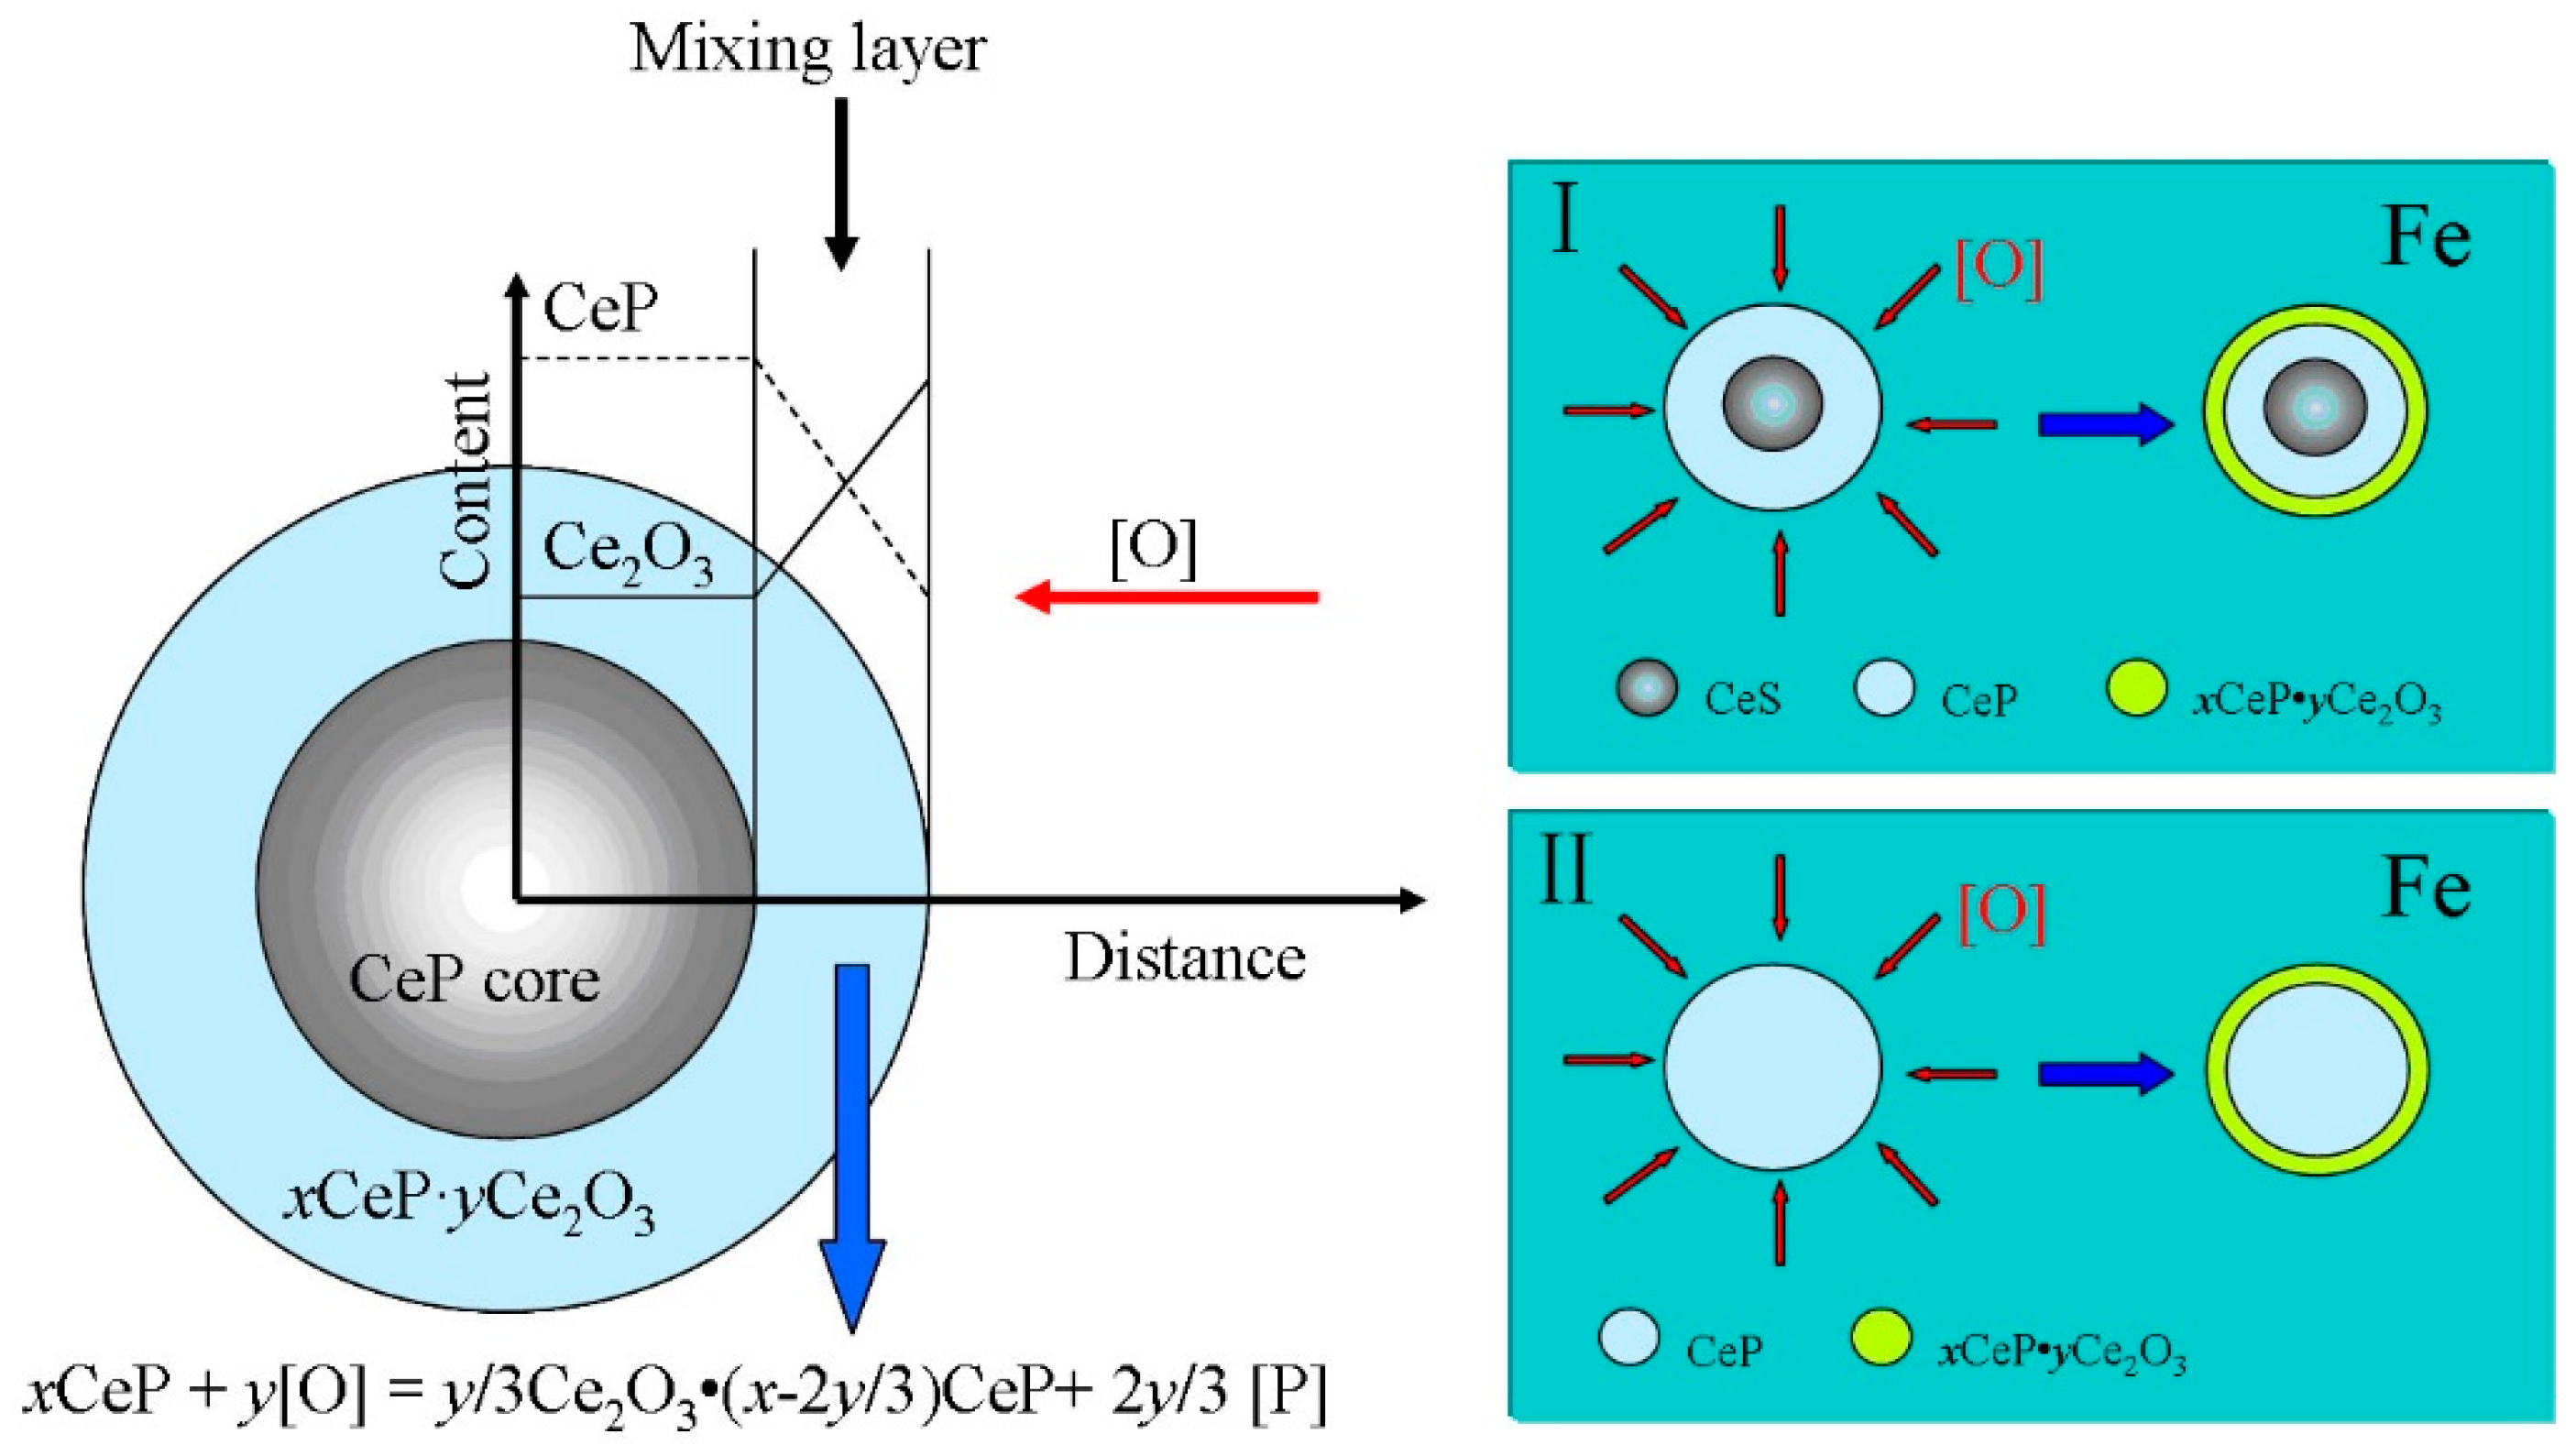
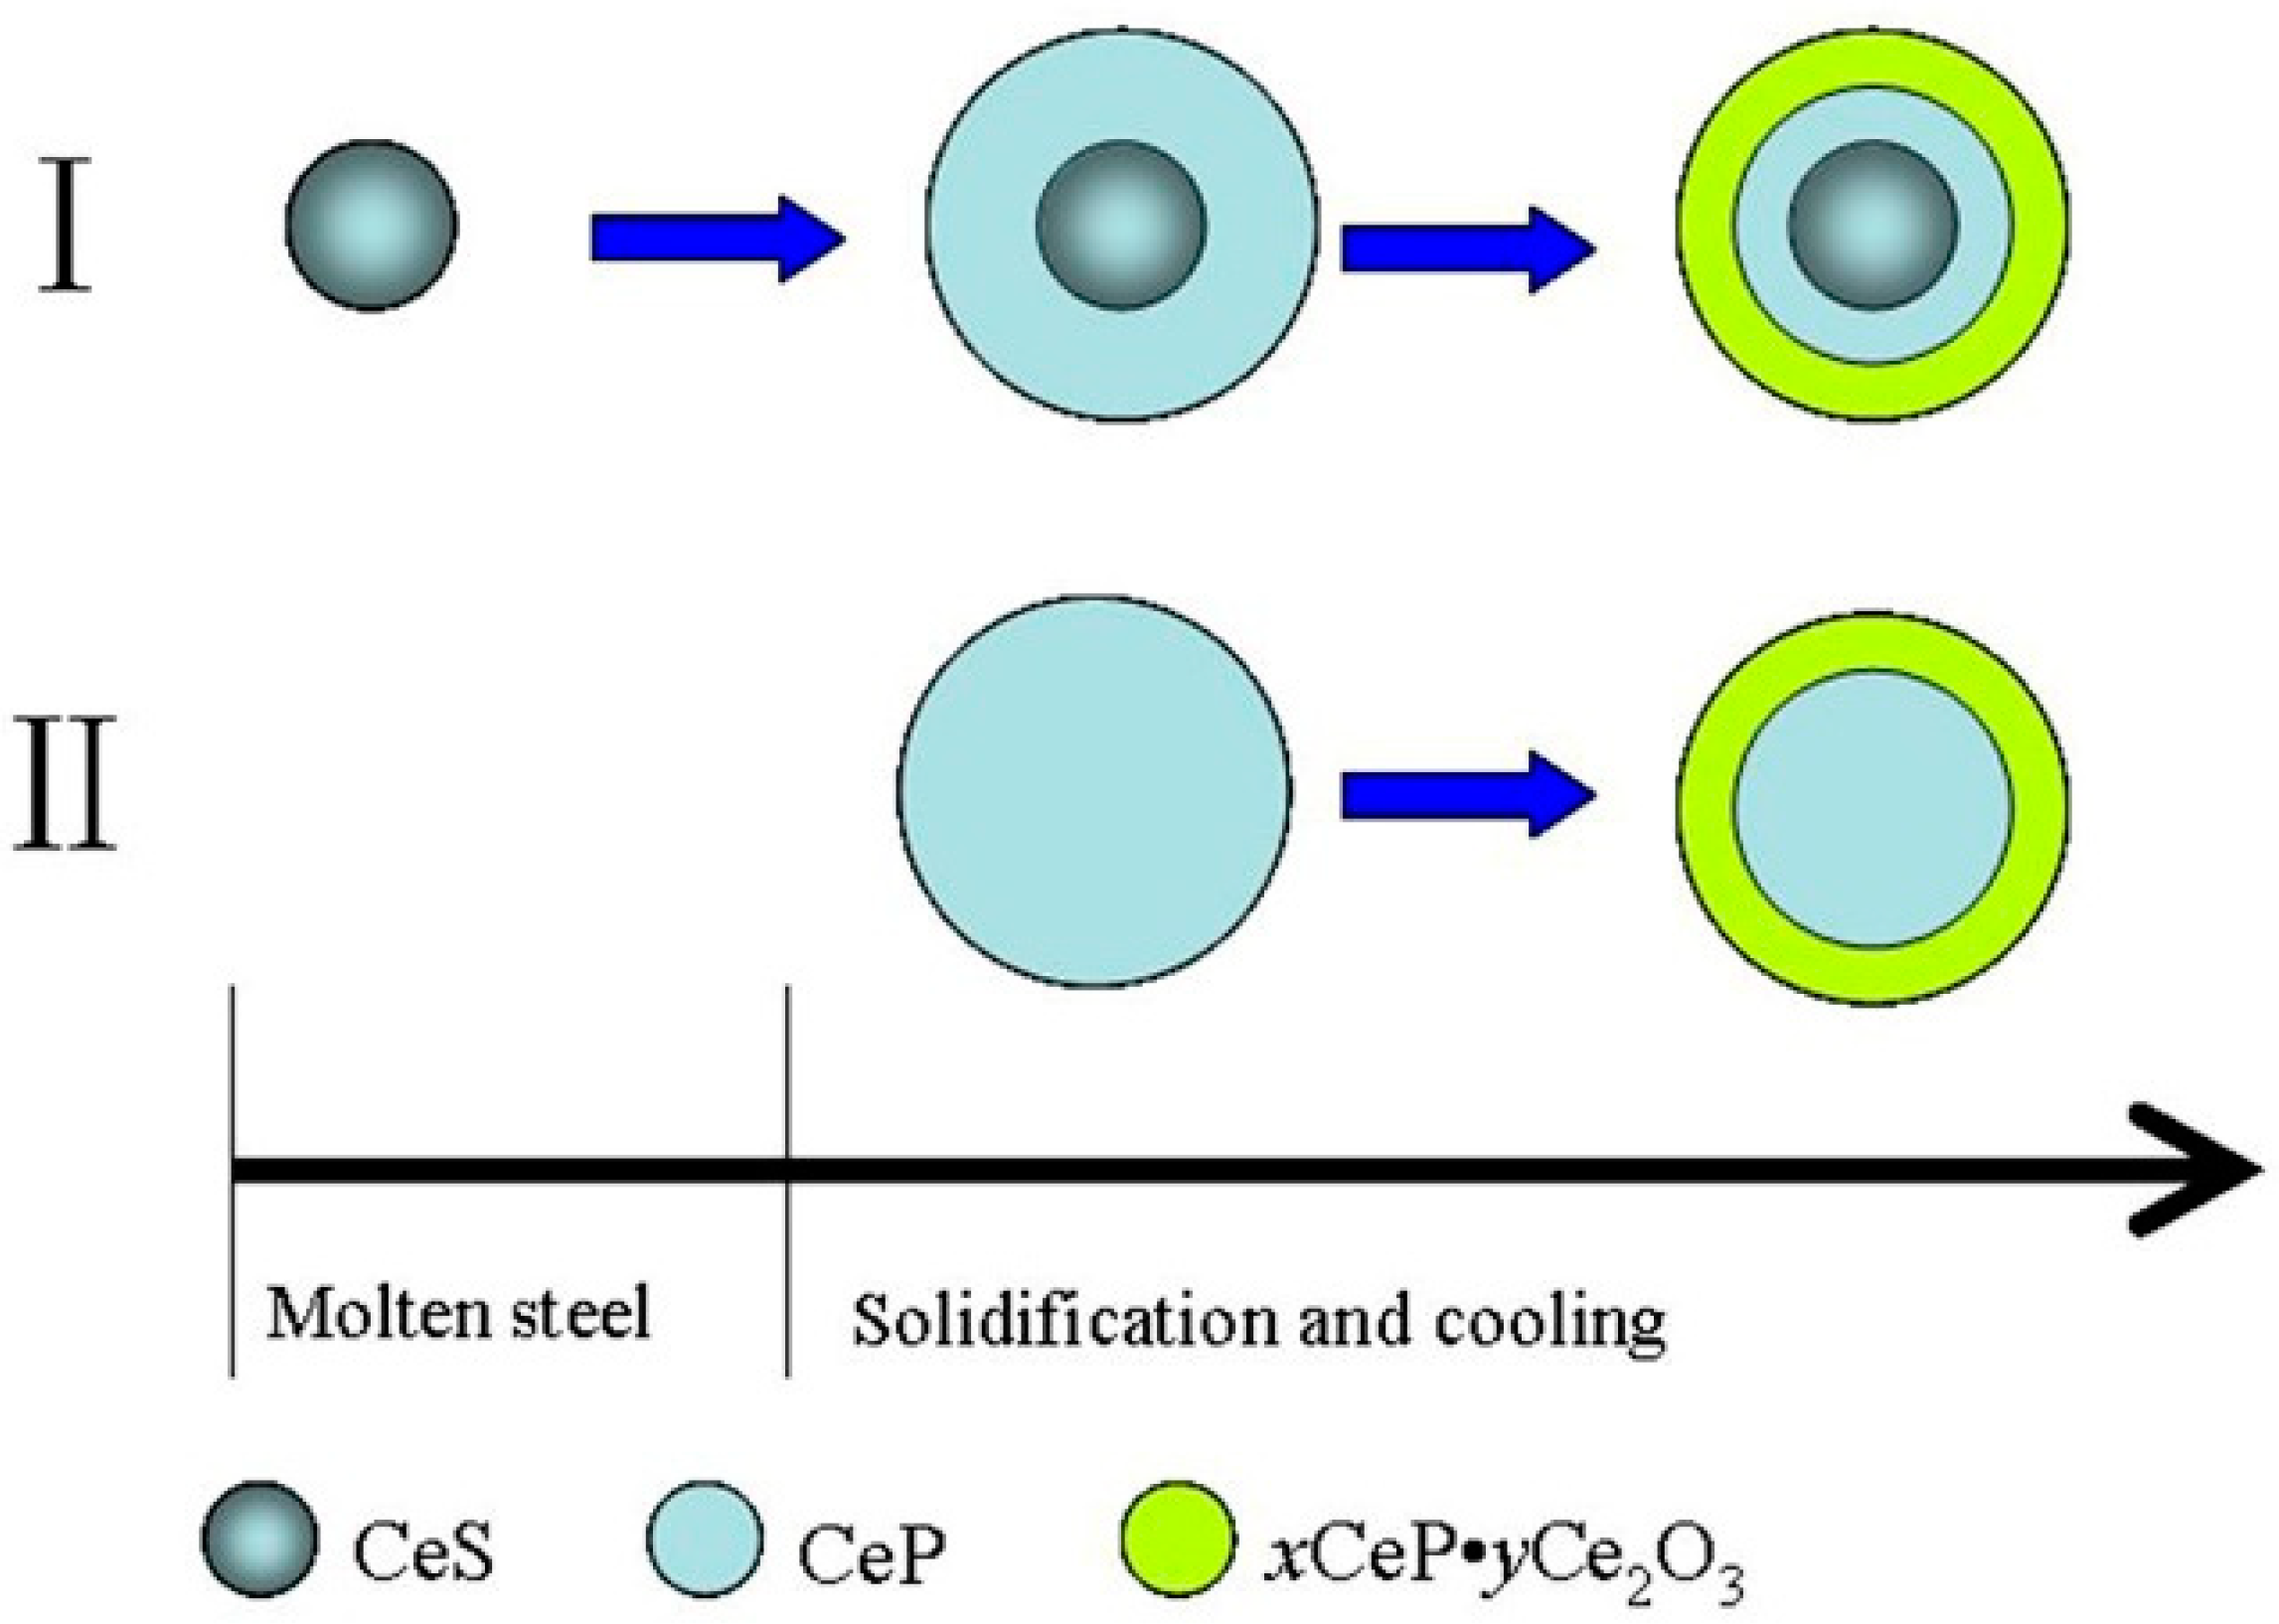
3.4. Discussion on Evolution Mechanism of CeP, CeAs, and Cerium Composite Inclusions

According to the analysis and results above, many CeP, CeAs, and cerium composite inclusions (Ce–P-O inclusions with a double-layer structure and Ce–S–O–P(As) inclusion) formed in the 4#~5# steels. This result indicates that the cerium addition can combine with phosphorus and arsenic. The formation condition of CeP and CeAs inclusions and these composite inclusions will be discussed below.
Figure 8 shows that CeP and CeAs inclusions are difficult to form under steelmaking temperatures. Thus, we suppose that they may form during the cooling process, and the relationship between the formation of the Gibbs free energy of the CeP and CeAs inclusions and temperature was established as shown in Figure 9. The formation of the Gibbs free energy and temperature of the CeP and CeAs inclusions before solidification are always positive, so CeP and CeAs inclusions are difficult to form during the cooling process of molten steel before solidification.
Referring to the work of Xin [18] and Wang [13], it is inferred that the distribution ratio of cerium, phosphorus, and arsenic between solid and liquid changes in the solidification process of molten steel, and the segregation of these three elements occurred, which satisfied the formation thermodynamic conditions of the CeP and CeAs inclusions. In the present experiment, the ingot cooling rate was slow, and the segregation of cerium, phosphorus, and arsenic was promoted in the solidification process. If the actual activity product ( a C e a P )ac and ( a C e a A s )ac in the C104Cr liquid steel exceeds the equilibrium activity product ( a C e a P )eq and ( a C e a A s )eq, respectively, then the CeP and CeAs inclusions satisfy the formation condition.
In this experiment, the composition of the 4# steel was selected to calculate and compare the actual activity product and equilibrium activity product of the CeP and CeAs inclusions during the solidification process. The Brody–Flemings model modified by Clyne and Kurz was taken into account in determining the solute concentration in the liquid phase at the solidification front [18,19,20,21], as shown in Equations (1)–(5). The Brody–Flemings model is a commonly used model for microsegregation calculation. As Clyne and Kurz explained, when α is large, the Brody–Flemings model predicts less enrichment in the liquid phase than the Lever rule, so it is physically unreasonable, and so, Clyne and Kurz modified this model by correcting α to fit extreme cases (when the solidification parameter α is close to 0 or ∞) [19,20,21]. In the present study, the approximate cooling rate of the ingot was provided on the basis of the average value of the secondary dendritic arm according to the corrosion results of the secondary dendritic arm of the as-cast steel sample, and the input value of the average secondary dendritic arm spacing was set as 48.54 μm. The liquid phase range of the C104Cr steel was calculated using Thermo-calc software. According to the calculated results, the liquidus temperature was set as 1728 K, and the solidus temperature was set as 1604 K. The segregation constants used for calculation are listed in Table 6.
C L = C 0 [ 1 ( 1 2 α k ) f S ] ( k 1 ) / ( 1 2 α k )
α = α ( 1 e 1 α ) 0.5 e 1 2 α
α = 4 D S t S λ 2
t S = ( T L T S ) R C
λ = 135.54 × 10 6 ( R C ) 0.3616
where C L (mass%) is the solute concentration in the liquid phase at the solidification front, C 0 (mass%) is the initial concentration of the solute in the liquid steel, f S is the solidification fraction, k is the partition coefficient of solute, D S (m2·s−1) is the diffusion coefficient of the solute, t S (s) is the regional solidification time, λ (m) is the secondary dendritic arm spacing, T L (K) is the liquidus temperature, T S (K) is the solidus temperature, and R C (K·s−1) is the cooling rate.
The equilibrium activity product is obtained from the chemical isothermal equations of the CeP and CeAs inclusions’ formation reactions, respectively, as shown in Equations (6) and (7), and the liquid temperature at the solidification front is obtained from Equation (8) [26].
ln   ( a C e a P ) eq = 215534 + 157.74 T R T
ln   ( a C e a A s ) eq = 302040 + 237.2 T R T
T = T 0 T 0 T L 1 f S T L T S T 0 T S
The actual activity product of CeP and CeAs inclusions exceeds the equilibrium activity product at the end of the solidification, as shown in Figure 10 and Figure 11. The formation thermodynamic conditions of CeP and CeAs inclusions are satisfied during the solidification process. In fact, the formation of CeP and CeAs inclusions during solidification faces the competitive combination of oxygen and sulfur, which indicates that a higher cerium content and lower oxygen and sulfur content are key factors for the formation of CeP and CeAs inclusions. The higher cerium content satisfies the thermodynamic and kinetic conditions of the cerium inclusions. Under the present experimental conditions, when [%Ce] was more than 0.0389 wt %, [%O] was less than 0.0001 wt %, and [%S] was less than 0.0022 wt %; CeP and CeAs inclusions can form in large quantities in C104Cr saw wire steel.
According to the SEM mapping results, as shown in Figure 5 and Figure 6, Ce2O3 inclusions concentrated in the outer layer of CeP inclusions. Therefore, it is supposed that the Ce2O3 inclusions layer is a product of the high-temperature solid-state reaction. It is known that the solid solubility of oxygen decreases with decreasing temperatures, and this is a significant reason for the formation of Ce2O3 inclusions during the cooling process. In view of the situation, two possible mechanisms regarding the formation of Ce2O3 inclusions were supposed:
(i) Ce2O3 inclusions formed from the combination of [Ce] and [O] directly, and the reaction is shown by Equation (9). The CeP inclusions precipitated during solidification served as a nucleation core for the Ce2O3 inclusions, and then, the CeP inclusions were covered with the later-formed Ce2O3 inclusions.
2 [ Ce ] + 3 [ O ] = Ce 2 O 3 .
(ii) Ce2O3 formed by way of oxygen replacing the phosphorus of CeP. That means that Ce2O3 found in the outer layer of the CeP is the product of an oxidization reaction between CeP and [O]. This mechanism was supported by a significant phenomenon—the mixed layer of CeP and Ce2O3, which existed around the boundary between the two layers in the composite inclusions. The reaction equation and mechanism diagram were shown in Equation (10) and Figure 12, respectively, and the approximate calculation result of the Gibbs free energy of the reaction at 1604 K was −813,803 J·mol−1. After the formation of CeP, the mixed layer of CeP and Ce2O3 formed in the outermost layer of composite inclusions with this reaction, and the reaction in different inclusions proceeded to different extents.
x CeP + y [ O ] = y 3 Ce 2 O 3 ( x 2 y 3 ) CeP + 2 y 3 [ P ]   .
Combined with the above thermodynamic and kinetic analysis, a formation mechanism of the I-type of inclusion (Ce–S–O–P (As) inclusions) and the II-type of inclusion (Ce–P-O inclusions with a double-layer structure) in C104Cr steel with high cerium content was proposed, as shown in Figure 13.
For the I-type of inclusion, CeS inclusions precipitated at 1600 °C and then served as the nucleation core for CeP or CeAs inclusions during the solidification process, and then, Ce2O3 formed in the outer layer of CeP with the decrease of the temperature.
For the II-type of inclusion, CeP inclusions precipitated directly in molten steel, and then, the formation reaction of Ce2O3 occurred. As a result, Ce2O3 formed in the outer layer of the inclusion.

4. Conclusions

The effects of cerium content in the range of 0~0.0676% on the cleanness of C104Cr saw wire steel have been studied in this paper. According to the experimental results, the following conclusions were obtained.
(1) When the content of cerium in steel was 0.0136 wt % or 0.0277 wt %, the main inclusions in the steel were Ce2O2S and CeS. When the content of cerium was 0.0389 wt % or above, the inclusions in the steel were Ce2O2S, CeS, Ce–S–O–P(As), Ce–O–P and Ce–P(As), and so on. The conduction of the pre-deoxidization process in the smelting experiment is helpful for prevention of the formation of Ce2O3 inclusions.
(2) The addition of cerium at the appropriate level is beneficial to promote the miniaturization of inclusions and to increase the proportion of small inclusions. This is helpful to control the inclusion of saw wire steel.
(3) The calculation results of the segregation model showed that CeP and CeAs inclusions in C104Cr steel formed in large quantities at the end of the solidification process. When [%Ce] is more than 0.0389 wt %, [%O] is less than 0.0001 wt %, and [%S] is less than 0.0022 wt %; CeP and CeAs inclusions can form in large quantities in C104Cr steel.
(4) Ce–S–O–P (As) inclusions and Ce–P-O inclusions with double-layer structures were found in C104Cr steel when the content of cerium was more than 0.0389 wt %. These two types of inclusions are covered with Ce2O3 inclusions, and two possible mechanisms for the formation of Ce2O3 inclusions distributed in the outer layer of the cerium composite inclusions were proposed. The first was that Ce2O3 inclusions formed from the combination of [Ce] and [O] directly, and the other was that Ce2O3 was the product of the oxidization reaction after the formation of CeP.

Author Contributions

Y.L., Z.J., and H.L. conceived of and designed the experiments; M.S., C.C., and K.C. performed the experiments; and M.S., X.H., and S.S. analyzed the data. Y.L. wrote the paper with the support of Z.J., M.S., and H.L.

Funding

This work was supported by the National Key Research and Development Program of China (Grant No. 2016YFB0300105), the Transformation Project of Major Scientific and Technological Achievements in Shenyang (Grant No. Z17-5-003), and the Fundamental Research Funds for the Central Universities (N172507002).

Conflicts of Interest

The authors declare no conflicts of interest.

References

  1. Xu, X. New Products and New Technology of Special Steel; Metallurgical Industry Press: Beijing, China, 2016; p. 270. ISBN 978-7-5024-7268-9. [Google Scholar]
  2. Kirhara, K. Production technology of wire rod for high tensile strength steel cord. Kobelco Technol. Rev. 2011, 30, 62–65. [Google Scholar]
  3. Li, Y.; Chen, C.; Jiang, Z.; Sun, M.; Hu, H.; Li, H. Application of alkali oxides in LF refining slag for enhancing inclusion removal in C96V saw wire steel. ISIJ Int. 2018, 58, 1232–1241. [Google Scholar] [CrossRef]
  4. Adabavazeh, Z.; Hwang, W.; Su, Y. Effect of adding cerium on microstructure and morphology of Ce-based inclusions formed in low-carbon steel. Sci. Rep. 2017, 7, 46503. [Google Scholar] [CrossRef] [PubMed]
  5. Liu, X.; Yang, J.; Yang, L.; Gao, X. Effect of Ce on inclusions and impact property of 2Cr13 stainless steel. J. Iron Steel Res. Int. 2010, 17, 59–64. [Google Scholar] [CrossRef]
  6. Wang, L.; Liu, Y.; Wang, Q.; Chou, K. Evolution mechanisms of MgO·Al2O3 inclusions by Cerium in spring steel used in fasteners of high-speed railway. ISIJ Int. 2015, 55, 970–975. [Google Scholar] [CrossRef]
  7. Wen, B.; Song, B.; Pan, N.; Shu, Q.; Hu, X.; Mao, J. Influence of Ce on characteristics of inclusions and microstructure of pure iron. J. Iron Steel Res. Int. 2011, 18, 38–44. [Google Scholar] [CrossRef]
  8. Zhu, J.; Huang, H.; Xie, J. Recent progress and new ideas for accelerating research in rare earth steel. J. Iron Steel Res. 2017, 29, 513–529. [Google Scholar]
  9. Wang, L. Application Prospects and Behavior of RE in new generation high strength steels with superior toughness. J. Chin. Rare Earth Soc. 2004, 22, 48–54. [Google Scholar]
  10. Zhi, J.; Liu, L.; Chen, J.; Li, Z. Effect of RE on Inclusion of BNbRE Rail Steel. J. Chin. Rare Earth Soc. 2004, 22, 181–184. [Google Scholar]
  11. Zhao, X.; Jiang, J.; Li, G.; Li, F. Kinetics of formation of large rare earth inclusion in steels. J. Chin. Rare Earth Soc. 2004, 22, 142–144. [Google Scholar]
  12. Xin, W.; Song, B.; Song, M.; Song, G. Effect of cerium on characteristic of inclusions and grain boundary segregation of arsenic in iron melts. Steel Res. Int. 2015, 86, 1430–1438. [Google Scholar] [CrossRef]
  13. Wang, C. Effect of Rare Earth Lanthanum and Magnesium on Cleanliness and Properties of Typical Special Steels. Ph.D. Thesis, Northeastern University, Shenyang, China, 2017. [Google Scholar]
  14. Liang, Y.; Che, Y. Handbook of Thermodynamic Data for Inorganic Matter; NEU Press: Shenyang, China, 1993; p. 107. ISBN 7-81006-532-7. [Google Scholar]
  15. Li, N.; Lu, Q.; Wang, Y.; Zhu, Z.; Xiang, L.; Qiu, S. Effect of Ce on inclusions modification in 2. 9%Si-0. 8%A1 non-oriented electrical steel. J. Iron Steel Res. 2017, 29, 570–576. [Google Scholar]
  16. Liu, Y.; Wang, L.; Guo, J.; Hu, X.; Chou, K. Thermodynamic analysis of cerium inclusion formed in spring steel used in fastener of high-speed railway. Chin. J. Nonferrous Met. 2013, 23, 720–726. [Google Scholar]
  17. Wang, H.; Xiong, L.; Zhang, L.; Wang, Y.; Shu, Y.; Zhou, Y. Investigation of RE-O-S-As inclusions in high carbon steels. Metall. Mater. Trans. B 2017, 48, 2849–2858. [Google Scholar] [CrossRef]
  18. Xin, W. Effect of Arsenic on the Properties of Steel and Improvement by Adding Rare Earth. Ph.D. Thesis, University of Science and Technology Beijing, Beijing, China, 2015. [Google Scholar]
  19. Clyne, T.; Kurz, W. Solute redistribution during solidification with rapid solid state diffusion. Metall. Trans. A 1981, 12, 965–971. [Google Scholar] [CrossRef]
  20. Won, Y.; Thomas, B. Simple model of microsegregation during solidification of steels. Metall. Mater. Trans. A 2001, 32, 1755–1767. [Google Scholar] [CrossRef] [Green Version]
  21. Han, Z.; Cai, K.; Han, Z.; Cai, K. Study on a mathematical model of microsegregation in continuously cast slab. Acta Metall. Sin. 2000, 36, 869–873. [Google Scholar]
  22. Kim, K.; Han, H.; Yeo, T.; Lee, Y.; Oh, K.; Lee, D. Analysis of surface and internal cracks in continuously cast beam blank. Ironmak. Steelmak. 1997, 24, 249–256. [Google Scholar]
  23. Zhong, X.; Hu, H.; Liu, C. The measurement of cerium equilibrium partition coefficient K0 and influence of cerium on value of manganese and silicon K0 in high manganese steel. Chin. J. Eng. 1984, 3, 21–22. [Google Scholar]
  24. Li, W. Thermodynamics of the formation of rare-earth inclusions in steel. Iron Steel 1986, 21, 7–12. [Google Scholar]
  25. Božić, B.; Lučić, R. Diffusion in iron-arsenic alloys. J. Mater. Sci. 1976, 11, 887–891. [Google Scholar] [CrossRef]
  26. Ma, Z.; Janke, D. Characteristics of oxide precipitation and growth during solidification of deoxidized steel. ISIJ Int. 1998, 38, 46–52. [Google Scholar] [CrossRef]
Figure 1. A schematic diagram of the experimental setup: a 30 kg vacuum induction furnace.
Metals 09 00054 g001
Figure 2. Comparison of the S and total oxygen (T.O) mass fraction in different cerium contents.
Metals 09 00054 g002
Figure 3. Data points of the 2#~5# heats in a phase stability diagram of the inclusions bearing cerium.
Metals 09 00054 g003
Figure 4. The morphology and composition of the typical Ce–O–P homogeneous composite inclusion.
Metals 09 00054 g004
Figure 5. The morphology and composition of the typical Ce–O–P stratified composite inclusion.
Metals 09 00054 g005
Figure 6. The morphology and composition of the typical Ce–S–O–P(As) inclusion.
Metals 09 00054 g006
Figure 7. The effect of cerium content on the number of inclusions per unit area and the average diameters and distribution of the inclusion diameters in the 1#~5# steel. (a) The number of the inclusions per unit area NA and the average size dA; (b) distribution of inclusion diameters.
Metals 09 00054 g007
Figure 8. The Formation of the Gibbs free energy of the cerium inclusions at 1873 K.
Metals 09 00054 g008
Figure 9. The Formation of the Gibbs free energy of CeP and CeAs before solidification.
Metals 09 00054 g009
Figure 10. The actual activity product and equilibrium activity product of CeP. (a) Whole solidification process; (b) the solidification end.
Metals 09 00054 g010
Figure 11. The actual activity product and equilibrium activity product of CeAs. (a) Whole solidification process; (b) the solidification end.
Metals 09 00054 g011
Figure 12. Mechanism diagram of the oxidization reaction of cerium inclusions in steel.
Metals 09 00054 g012
Figure 13. Mechanism diagram of composite inclusions of I-type inclusion (Ce–S–O–P (As) inclusions) and II-type inclusion (Ce–P–O inclusions with a double-layer structure) in 4#~5# steel.
Metals 09 00054 g013
Table 1. The chemical composition of C104Cr saw wire steels (mass%).
NoCSiMnCrCeNT.OSPAs
1#1.0430.160.420.190.00000.00110.00190.00470.00790.0046
2#1.0490.160.410.180.01360.00120.00170.00370.00710.0022
3#1.0450.160.420.190.02770.00110.00130.00310.00740.0021
4#1.0420.160.420.190.03890.00090.00090.00220.00720.0021
5#1.0430.170.420.190.06760.00080.00080.00180.00680.0020
Table 2. Interaction coefficients at 1873 K [14,15].
e i j CSiMnOCrAlCePSMgNAs
C0.140.08−0.012−0.34−0.0240.043−0.00260.0510.046−0.070.110.043
O−0.45−0.131−0.021−0.2−0.04−3.9−0.57−0.07−0.133−3000.057-
Al0.0910.00560.012−6.60.0250.045−0.0430.050.03−0.13−0.053-
Ce−0.077-0.13−5.03-−2.25−0.0031.746−39.8---
P0.130.1200.13-0.037-0.0620.028-0.094-
S0.110.063−0.026−0.27-−0.035−0.2310.029−0.028−1.820.010.0041
As0.25-----------
Table 3. Activity coefficients in C104Cr steel at 1873 K.
iAlCOCeSPAs
fi1.231.410.300.711.291.411.82
Table 4. Thermodynamic data of some deoxidization reactions at 1873 K [16].
ReactionΔGθ, J·mol−1
[Ce] + [N] = CeN(s)−172,890 + 81.09T
[Ce] + 2[C] = CeC2(s)−131,000 + 121.40T
[Ce] + [P] = CeP(s)−215,534 + 157.74T
[Ce] + [As] = CeAs(s)−302,040 + 237.2T
[Ce] + 2[O] = CeO2(s)−852,720 + 249.96T
[Ce] + 3/2[O] = 1/2Ce2O3(s)−714,380 + 179.74T
[Ce] + [O] + 1/2[S] = 1/2Ce2O2S(s)−675,700 + 165.50T
[Ce] + [S] = CeS(s)−422,100 + 120.38T
[Ce] + 3/2[S] = 1/2Ce2S3(s)−536,420 + 163.86T
[Ce] + 4/3[S] = 1/3Ce3S4(s)−497,670 + 146.30T
[Ce] + 3/2[C] = 1/2Ce2C3(s)−112,000 + 102.90T
[Ce] + 3[O] + [Al] = CeAlO3(s)−1,366,460 + 364.3T
[Ce] + Al2O3(s) = CeAlO3(s) + [Al]−423,900 − 247.30T
Table 5. The composition and morphology of typical inclusions in the 1#~5# steel.
Cerium Content/%Typical Inclusions
0% (1#) Metals 09 00054 i001 Metals 09 00054 i002
Metals 09 00054 i003 Metals 09 00054 i004
0.0136% (2#) and 0.0277% (3#) Metals 09 00054 i005 Metals 09 00054 i006
0.0389% (4#) and 0.0277% (5#) Metals 09 00054 i007 Metals 09 00054 i008
Metals 09 00054 i009 Metals 09 00054 i010
Table 6. Segregation constants [18,22,23,24,25].
ElementkDS/(m2·s−1)
C0.347.61 × 10−6exp(−134,557/RT)
Si0.523 × 10−5exp(−251,458/RT)
Mn0.785.5 × 10−6exp(−249,366/RT)
P0.131.0 × 10−6exp(−182,841/RT)
S0.0352.4 × 10−4exp(−214,639/RT)
O0.0223.71 × 10−6exp(−23,050/RT)
Ce0.051 × 10−20
As0.3358 × 10−6exp(−58,900/RT)

