Abstract
One of the main in-service failure mechanisms of the work-rolls used in hot strip mill finishing stands is surface spalling. The indefinite chill double-poured rolls usually comprise of a peripheral working layer made of crushed Ni-hard cast iron and a grey cast iron core, mostly pearlitic matrix with spheroidal graphite. To enhance its wear resistance, the working layer can be alloyed with Mo and Nb. The possible cracking and spalling of the surfaces of these work-rolls is strongly influenced by the presence of carbides and the continuity of their network. The flexural and impact toughness tests are reliable testing methods to assess these properties. The aim of this paper is to identify those manufacturing factors that have a significant effect on the flexural strength and toughness of this material, correlating the results with the volume fraction of precipitated carbides. It is worth highlighting, among the analysed factors are the liquidus temperature, the %Si, the use of an inoculant with traces of Lanthanum, and inoculation with different amounts of FeB, SiCa and Mg. Inoculation with SiCa is found to have a positive effect on the toughness of the material, breaking up the continuity of the carbide network, while FeB is found to act as a heterogeneous nucleant for NbC precipitation. However, high FeB contents reduce flexural strength and do not have a significant effect on the hardness of the material. To enhance the fracture toughness of the working layer, a liquidus temperature in the 1270–1275 °C range is recommended, as well as inoculating the ladle with Mg, 3 kg/T FeB and 0.6 kg/T SiCa.
1. Introduction
Indefinite chill double-poured (ICDP) work-rolls are usually used in the finishing stands of hot strip mills (HSMs). These rolls usually comprise a peripheral working layer made of crushed Ni-hard cast iron and a grey cast iron core with spheroidal graphite in a mostly pearlitic matrix. Table 1 shows the most usual chemical composition range for the working layer.

Table 1.
Chemical composition range of the working layer, expressed in weight percent (wt.%).
These rolls are manufactured by means of vertical centrifugal casting. The working layer is cast first and the core is subsequently cast in two stages. In the first, an intermediate layer is cast which ensures optimum binding with the outer layer. The remainder of the core is then cast in a second stage. The microstructure of the working layer is formed by primary austenite, which is partially transformed into martensite during solidification, and by the result of several eutectic reactions, such as austenite + MC carbides, austenite + graphite, and austenite + M3C carbides [1]. The presence of graphite is intended to increase the thermal conductivity and the resistance to thermal shock of the working layer. In turn, the graphite performs dry lubrication functions [2,3], reducing the coefficient of friction between the work-roll and the steel strip to be rolled [4]. These rolls should also have a high resistance to wear. To enhance this property, they can be alloyed with Mo and Nb. The addition of Nb favours the formation of hard MC carbides, whose hardness is around 2400 HV [5,6], which promotes enhanced wear resistance and increases the material’s impact toughness [7,8]. Mo improves austenite hardenability, and with increasing percentages up to 1%, refines carbides and improves wear resistance [9]. During the rolling pass, the roll undergoes compression forces that oppose thermal expansion. The service life of these rolls depends on their wear resistance, as well as on their fatigue behaviour versus cyclic loadings of thermal stresses and cyclic mechanical strain [10]. The rolling process commences with the slab at 1250 °C, the work-roll reaches up to 500–600 °C in a single second when entering into contact with the slab, subsequently being water-cooled to the 80 °C in 4 s as the slab exits the rolls. These thermal variations generate severe thermal fatigue cycles [11]. The thermal stresses are proportional to the thermal gradient, which reaches a maximum during the cooling at the exit of the rolling pass. After a few cycles, thermally induced cracks may begin to appear and may advance inwards into the roll. In this case, the ledeburite microstructure plays an important role in the formation of these cracks and their development [12]. Furthermore, in addition to the yield stress of the material, the amount of pressure the roll must support will depend on geometric factors such as the roll radius, the reduction in thickness, and the final thickness of the slab between passes. The pressures exerted during rolling can lead to the crushing of some carbides and the subsequent transmission of the cracks generated through the network of these carbides [13]. Aside from the rolling process, the possible cracking and spalling of the surfaces of these rolls is strongly influenced by the microstructural characteristics of the working layer [14], especially by the presence of carbides [15]. For the above reasons, it follows that in addition to wear resistance in the working layer of these rolls, they must also present a high mechanical strength and a high fracture strength. The flexural test [16] and the impact toughness test [17] are reliable methods to assess these properties in this type of alloy, where the presence of a continuous carbide network is crucial. Via the application of a Design of Experiments (DoE), the aim of this paper is to identify those manufacturing factors that have a significant effect on the flexural strength and toughness of this material, correlating the results with the volume fraction of precipitated carbides and the material’s hardness. For this purpose, manufacturing factors such as the liquidus temperature, the %Si, the use of an inoculant with traces of Lanthanum, and inoculation with different amounts of FeB, SiCa and Mg were analysed. Previous research concludes that additions of B promote an increase in the percentage of carbides and an increase in wear resistance. However, their addition could affect the flexural strength of the material [18]. Moreover, the addition of Mg and other elements such as Ca and La promote the precipitation of graphite with a nodular morphology [19]. Mg acts as a nucleator of graphite [20]. Inoculation with SiCa promotes a decrease in the grain size of the primary austenite and discontinuity of the carbide network [21], which could increase the toughness of the material. The presence of Lanthanum improves the mechanical properties of white cast irons [22]. The research was conducted at an industrial scale, for which purpose eight rolls with a diameter between 680 and 700 mm, a length between 1800 and 2000 mm, and a thickness of the working layer between 50 and 55 mm, were cast.
2. Materials and Methods
The experimental method applied was a fractional factorial Design of Experiments (DoE) with six factors, two levels for each factor, and eight experiments in all. The resolution of this Design of Experiments was III [23].
The working layer was smelted in a medium frequency induction furnace. ‘Bleeding’ from the furnace into the treatment ladle was carried out at 1420 °C, with the inoculants being placed at the bottom of the ladle. Table 2 shows the chemical composition of the inoculants.
Table 2.
Chemical composition of the inoculants, expressed in weight percent (wt.%).
The casting was carried out at a temperature of around 60–65 °C above the liquidus temperature. Demoulding took place after five days. Before machining, the work-rolls were subjected to tempering at 400 °C. Table 3 shows the analysed factors and levels.
Table 3.
Description of the Factors and Levels for the DoE.
Table 4 shows the array of experiments.
Table 4.
Array of experiments.
Table 5 shows the sequence of generators and confounders in the DoE. The ‘generators’ column indicates the applied sign algorithm in the construction of columns D, E and F. The ‘confounders’ column shows those second-order (2 factor) interactions whose effects are confounded in the main effects. For example, the effect of the second-order interactions BD + CE will be confounded with the effect of Factor A [24].
Table 5.
Generators and confounders in the array of experiments.
The Yates algorithm [25], which can be implemented on a spreadsheet, is usually used to calculate the effects; the main effects, as well as interactions of all kinds. The experimental response is subject to random variation. This variation will follow a normal law, where its standard deviation reflects an experimental error. The effects are linear combinations of the responses. Hence, by the application of the central limit theorem (CLT), they follow a normal law. Each main effect may be considered a random variable, where the obtained value is an estimate of its mean; hence, this value is accompanied by the estimation of its standard deviation. If all the effects were non-significant, they would follow an N(0,σ) law and would thus appear aligned in a representation of the effects on a normal probability plot. If any effect is significant, it will follow an N(μ,σ) law, not appearing aligned with the non-significant effects. The standardized effect is the ratio between the difference in the value of the variable and its mean and standard deviation. This represents not only whether the value of the variable is above or below the average, but also how far it deviates from it. To decide whether an effect is significant, we can compare this standardized effect on a normal probability plot. Those effects that deviate from the straight line towards the ends are significant. The significant factors that deviate from the straight line to the left indicate that their −1 level increases the response function with respect to their +1 level. The significant factors at a distance from the straight line to the right indicate that their +1 level increases the response function with respect to their −1 level [26].
For the analysis, the thickness of the work layer was divided into two regions. An outer layer, which started at the periphery of the roll and penetrated into the working layer, reaching a thickness of 15 mm (Region I). Another more interior layer that began 25 mm from the periphery of the roll and whose thickness encompassed another 15 mm, reaching 40 mm in depth from the periphery of the cylinder (Region II). Three 10 mm × 10 mm × 50 mm unnotched Charpy specimens were machined from each of these regions, as well as three bending specimens with a rectangular cross-section, each measuring 10 mm wide, 3mm thick and 60 mm long. The bending tests were performed on an INSTRON 5582 universal testing machine (INSTRON, Barcelona, Spain) equipped with a 100 KN load cell, employing a distance of 50 mm between supports.
The metallographic samples were prepared using one of the pieces of the Charpy specimens once fractured. The Vickers hardness was measured on the other piece, applying a 150 KPa load. The result is obtained as the average value of 10 indentations in each experiment.
The mechanical grinding process was carried out with 60, 120, 240, 400, and 600 grit size SiC paper. Subsequently, the samples were polished in two consecutive stages with 6 μm and 1 μm diamond paste, respectively. Nital 5 was used as the chemical reagent to reveal the microstructure of the material. The optical microscope employed was a NIKON Epiphot 200 (Nikon, Tokyo, Japan), the images being obtained using the Omnimet Enterprise Image Analysis System. Five micrographs were randomly obtained for each region (Regions I and II) and for each experiment (Experiments 1 to 8). The volume fraction of carbides was calculated using Image ProPlus, version 4.5.0.29 (Media Cybernetics, Rockville, MD, USA), imaging software and its Materials-Pro analysis module. The different types of precipitated carbides were identified under a JEOL JSM-5600 (JEOL, Nieuw-Vennep, The Netherlands) scanning electron microscope (SEM), equipped with the characteristic X-ray scattering microanalysis system (SEM-EDX).
3. Results
Table 6 shows the chemical composition and casting parameters of the peripheral working layers in each of the eight experiments. The elements C, Mn, Si, Cr, Ni, Mo, and Mg were quantified by spark optical emission spectrometry, while the elements B, Nb, and La were quantified by inductively coupled plasma mass spectrometry on an Agilent 7500 ICP-MS device (Agilent Technologies, Madrid, Spain).
Table 6.
Chemical composition of the peripheral working layer in the 8 Experiments.
Figure 1 shows the characteristic microstructure of the working layer. The micrograph in Figure 1a) corresponds to Region II in Experiment 1. The presence of the network of cementite, with M3C stoichiometry, and of martensite needles in a retained austenite background can be identified in this image. The micrograph in Figure 1b corresponds to Region I in Experiment 6. Spheroidal graphite nodules can be observed within the eutectic austenite which subsequently mainly transform into martensite. The micrograph in Figure 1c corresponds to Experiment 3, in the transition zone between the working layer and the core of the roll. In the transition zone of the core part, the presence of spheroidal graphite can be observed within a pearlite matrix, where some ferrite areas can also be seen, in addition to the presence of carbides that could precipitate due to the diffusion of carburizing elements. The darker colouring of the pearlite in the core zone stands out, as compared to the lighter colouring of the martensite in the working layer zone.


Figure 1.
Characteristic microstructure obtained by optical microscopy: (a) Experiment 6, Region I of the working layer; (b) Experiment 1, Region II of the working layer; and (c) Experiment 3, transition zone between the working layer and the core of the roll.
Figure 2 shows the precipitated carbides.
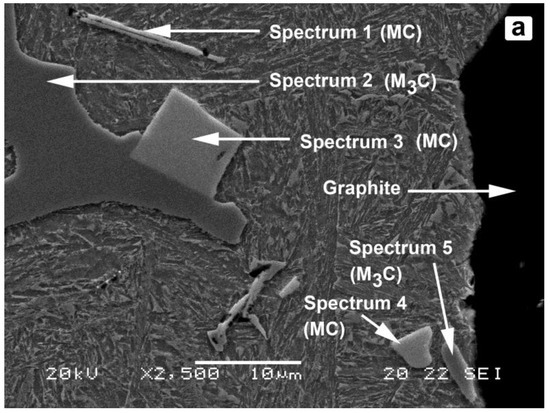
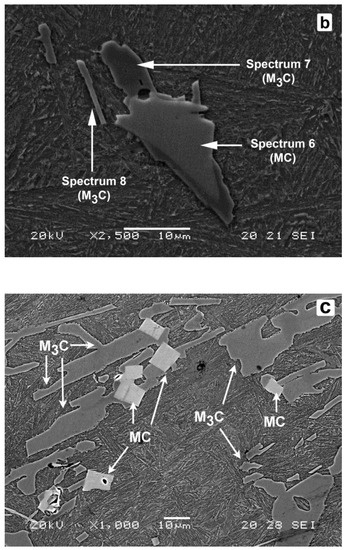
Figure 2.
Microstructure obtained under scanning electron microscopy in which the different types of carbides can be distinguished: (a) Experiment 8, Region I of the working layer, EDX analysis; (b) Experiment 5, Region II of the working layer, EDX analysis; and (c) Experiment 8, Region II of the working layer, carbides of MC (NbC) and M3C (cementite-like carbides) stoichiometry.
The micrograph in Figure 2a corresponds to Region I in Experiment 8. The presence of graphite and two types of disperse carbides can be appreciated in the image. Table 7 shows the results of the microanalysis performed on these two types of carbides (spectra 1 to 5). The lighter-coloured carbides, corresponding to spectra 1, 3 and 4, are carbides of MC stoichiometry, of the NbC type. Elements such as B and Fe can be seen attached to this type of carbide, from which it may be deduced that the FeB acts as a heterogeneous nucleant of this type of carbide. The darker-coloured carbides, spectrum 2 and 5, correspond to carbides of M3C stoichiometry, associated with mixed cementite-like carbides (Fe, Cr)3C.
Table 7.
Results of the microanalysis performed by SEM-EDX, corresponding to Figure 2a,b. Atomic (%).
The micrograph in Figure 2b corresponds to Region II in Experiment 5. Table 7 shows the results of the microanalysis performed on the three particles, identified as spectra 6 to 8. Spectra 6 corresponds to NbC carbides, whose precipitation seems to have been promoted by heterogeneous nucleation from FeB particles. Spectra 7 and 8 correspond to a mixed cementite-like carbide.
Figure 2c corresponds to Region II in Experiment 8. Carbides of MC stoichiometry can be identified in this figure, with a brighter colouring and rectangular geometry, as well as carbides of M3C stoichiometry, with a darker colouring, which are found to be the majority. It should be noted that no carbides of M2C stoichiometry, which would be associated with Mo2C, were observed. Hence, it can be deduced that the Mo remains in solid austenite solution, favouring its hardenability.
Table 8 and Table 9 show for Regions I and II, respectively, the average values obtained for the studied responses: hardness, volume fraction of Cementite, energy absorbed up to fracture by means of the Charpy test, and flexural strength. These tables also include the standardized effects of the factors and interactions, which are given in the last column (called ‘Restricted confounding pattern’). In this column, we indicate the main factors and the second-order interactions with which their effects are confounded. It should be borne in mind that fractional factorial DOEs allow a large number of factors to be studied by means of a very small number of experiments, assuming the loss of information of potential interactions between factors, which are not usually significant in industrial practice. The aim of using a fractional approach is not to make a good fit, but to try to find out which factors have a significant effect on the response variable.
Table 8.
Average values and standardized effects for the impact energy absorbed by means of the Charpy test, for the flexural strength and modulus of elasticity obtained by the three-point bending test.
Table 9.
Average values and standardized effects for the volume fraction of cementite and Vickers hardness.
Figure 3, Figure 4, Figure 5 and Figure 6 show the representation of the standardized effects on a normal probabilistic plot for the analysed responses in Regions I and II of the working layers of these rolls.
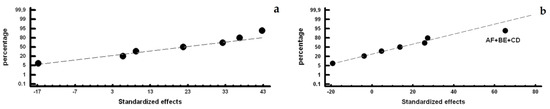
Figure 3.
Representation of standardized effects on a normal probability plot versus Vickers hardness: (a) Region I and (b) Region II.
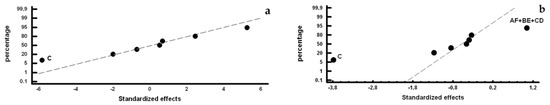
Figure 4.
Representation of standardized effects on a normal probability plot versus the volume fraction of cementite, (a) Region I and (b) Region II.
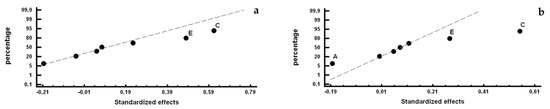
Figure 5.
Representation of the standardized effects on a normal probability plot versus the unnotched Charpy test: (a) Region I and (b) Region II.
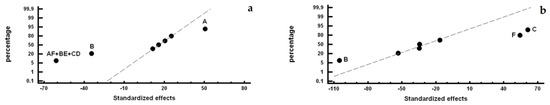
Figure 6.
Representation of standardized effects on a normal probability plot versus flexural strength: (a) Region I and (b) Region II.
Figure 3a shows that none of the studied factors have a significant effect on the hardness in the outermost part of the working layer (Region I). However, Figure 3b shows that some of the interactions AF, BE, and CD, have a significant effect on the hardness inside this working layer (Region II).
The effects of these three interactions are analysed separately in Table 10. To increase the hardness inside the working layer, it would appear advisable to place the interaction of Factors A and F at their (+1, +1) levels, the interaction of Factors B and E at their (+1, +1) levels, and the interaction of Factors C and D at their (−1, −1) levels.
Table 10.
Analysis of the interactions AF+BE+CD versus hardness in Region II.
That is, it would be advisable to combine inoculation with FeSi-La with the addition of Mg, combine inoculation with 6 kg/T FeB with inoculation with 0.6 kg/T SiCa, and combine a liquidus temperature between 1250 and 1255 °C with a low percentage of Si, at around 0.8–0.85%. Of these three interactions, the interaction between factors B and E at their (+1, +1) level, i.e., 6 kg/T FeB in combination with 0.6 kg/T SiCa, seems to have a significantly stronger ‘effect’.
Figure 4 shows that the liquidus temperature (factor C) has a significant effect on the volume fraction of cementite. Hence, if we wished to increase its presence, we should place it at its −1 level (1250–1255 °C). A low liquidus temperature means an increase in the volume fraction of the eutectic constituent, which is why it is consistent with an increase in the volume fraction of the cementite. Furthermore, Figure 4b) shows that interactions AF + BE + CD has a significant effect on the inside of the working layer. Table 11 analyses the effect of the separate interactions of Factors A with F, B with E, and C with D. From its analysis, it can be concluded that, in order to increase the cementite content, in addition to placing the liquidus temperature between 1250 and 1255 °C, the absence of Mg is advisable. Mg has a nucleating effect on spheroidal graphite, and also increases the number of graphite beads [27]. Hence, although it does not have a graphitizing effect, the volume fraction of cementite could be affected by its presence.
Table 11.
Analysis of the interactions AF+BE+CD versus Vv Cementite (%) in Region II.
From the analysis, it can be concluded that, in order to increase the Cementite content, in addition to placing the Liquidus Temperature between 1250 and 1255 °C, the absence of Mg is advisable.
Figure 5 shows that factors E (inoculation with SiCa) and C (liquidus temperature) have a significant effect on impact toughness. Thus, if we place both factors at their +1 levels, i.e. 0.6 kg/T and 1270–1275 °C, respectively, there is an increase in the amount of energy absorbed before impact fracture. This improvement produced by the increase in the amount of SiCa could be due to the effect that this inoculant seems to have on the continuity in the carbide network. An increase in the liquidus temperature leads to the decrease in the volume fraction of cementite. Moreover, Figure 5b) shows that if the ladle is not inoculated with FeSi-La, then there is an improvement in the impact toughness inside the working layer (Region II).
Figure 6 shows those factors with a significant effect on flexural strength. Inoculation with FeB is found to have a significant effect in both zones under analysis, Regions I and II. Thus, if we wish to increase this strength, then we should limit the addition of this inoculant to 3 kg/T. In Region I, inoculation with FeSi-La and the interactions AF + BE + CD also seemingly have a significant effect, see Figure 6a. Thus, in order to increase this strength, it would be advisable to inoculate with 2.7 kg/T FeSi-La. Table 12 analyses the interactions AF + BE + CD, showing that, in order to increase the flexural strength in this region, in addition to limiting the addition of FeB to 3 kg/T, it would be advisable to increase the addition of SiCa to 0.6 kg/T.
Table 12.
Analysis of the interactions AF + BE + CD versus flexural strength in Region I.
Figure 6b shows, for Region II, that in addition to inoculation with FeB, the Liquidus Temperature and the addition of Mg also have a significant effect. Hence, in order to increase the flexural strength in this region, it is advisable to place both factors at their +1 level, i.e., 1270–1275 °C and 0.02%, respectively.
4. Conclusions
To improve the resistance to in-service cracking and spalling of the working layer of duplex work-rolls used in hot strip mill finishing stands, manufactured in Ni-hard cast iron alloyed with Mo, Nb and Mg, it is concluded that:
- Inoculation with SiCa has a positive effect on the toughness of the material and seems to confirm its tendency to break up the carbide network.
- Inoculation with FeB promotes heterogeneous nucleation of the NbC, but also reduces flexural strength and does not have a significant effect on the hardness of the material.
- The addition of Mg leads to an improvement in flexural strength.
- Mo remains in solid austenite solution, favouring the hardenability of the material.
On the other hand, within the levels analysed in this study, neither the %Si nor heterogeneous nucleation with La has a significant effect on the fracture strength of the surface of the aforementioned work layer. To improve this resistance, it is advisable to:
- (1)
- Set the liquidus temperature within the 1270–1275 °C range
- (2)
- Inoculate with 3 kg/T FeB
- (3)
- Inoculate with 0.6 kg/T SiCa
- (4)
- Inoculate with Mg.
Author Contributions
J.A.-L. conceived and designed the experiments; A.C.-V. performed the experiment; J.F.A.-A. analyzed the data and wrote the paper.
Funding
This research received no external funding.
Conflicts of Interest
The authors declare no conflict of interest.
References
- Bravo, S.V.; Yamamoto, K.; Miyahara, H.; Ogi, K. Control of carbides and graphite in Ni-hard type cast iron for hot strip mills. Mater. Sci. Forum 2007, 561–565, 1023–1026. [Google Scholar] [CrossRef]
- Vadiraj, A.; Balachandran, G.; Kamaraj, M. Effect of misch metal inoculation on microstructure, mechanical and wear properties of hypoeutectic gray cast irons. Mater. Des. 2009, 30, 4488–4492. [Google Scholar] [CrossRef]
- Sergio, V.; Shikawa, S.; Yamamoto, K.; Miyahara, H.; Ogi, K.; Kamimiyada, K. Control of graphite formation in solidification of white cast iron. Int. J. Cast Met. Res. 2008, 21, 27–30. [Google Scholar] [CrossRef]
- Gowda, D.; Kumar, D.C.; Sandeep, G.M.; Parthasarathy, A.; Chandrashekar, S. Tribological characterization of centrifugally cast graphite cast iron under dry and wet conditions. Mater. Today Proc. 2018, 5, 145–151. [Google Scholar] [CrossRef]
- Chen, H.X.; Chang, Z.C.; Lu, J.C.; Lin, H.T. Effect of niobium on wear-resistance of 15% Cr white cast iron. Wear 1993, 166, 197–201. [Google Scholar] [CrossRef]
- Bedolla-Jacuinde, A. Microstructure of vanadium-, niobium- and titanium-alloyed high-chromium white cast irons. Int. J. Cast Met. Res. 2001, 13, 343–361. [Google Scholar] [CrossRef]
- Filipovic, M.; Kamberovic, Z.; Korac, M.; Jordovic, B. Effect of niobium and vanadium additions on the as-cast microstructure and properties of hypoeutectic Fe-Cr-C alloy. ISIJ Int. 2013, 53, 2160–2166. [Google Scholar] [CrossRef]
- Zhang, Z.G.; Yang, C.K.; Zhang, P.; Li, W. Microstructure and wear resistance of high chromium cast iron containing niobium. China Foundry 2014, 11, 179–184. [Google Scholar]
- Mourad, M.M.; El-Hadad, S.; Ibrahim, M.M. Effects of molybdenum addition on the microstructure and mechanical properties of ni-hard white cast iron. Trans. Indian Inst. Met. 2015, 68, 715–722. [Google Scholar] [CrossRef]
- Noda, N.A.; Hu, K.; Sano, Y.; Ono, K.; Hosokawa, Y. Residual stress simulation for hot strip bimetallic roll during quenching. Steel Res. Int. 2016, 87, 1478–1488. [Google Scholar] [CrossRef]
- Belzunce, F.J.; Ziadi, A.; Rodriguez, C. Structural integrity of hot strip mill rolling rolls. Eng. Fail. Anal. 2004, 11, 789–797. [Google Scholar] [CrossRef]
- Drobne, M.; Urska, K.; Tercelj, M.; Fajfar, P.; Ltd, T. Thermal crack propagation during hot rolling and its influence on cast iron work roll degradation. In Proceedings of the Metal 2017: 26th International Conference on Metallurgy and Materials, Brno, Czech Republic, 24–26 May 2017. [Google Scholar]
- Jonck, J.; Moema, J.S.; Jooste, J.; van Tonder, P. Investigation of the ‘tiger skin’ defect on indefinite chill rolls. J. South. Afr. Inst. Min. Metall. 2016, 116, 907–913. [Google Scholar] [CrossRef]
- Ray, A.; Prasad, M.S.; Dhua, S.K.; Sen, S.K.; Jha, S. Microstructural features of prematurely failed hot-strip mill work rolls: Some studies in spalling propensity. J. Mater. Eng. Perform. 2000, 9, 449–456. [Google Scholar] [CrossRef]
- Nilsson, M.; Olsson, M. An investigation of worn work roll materials used in the finishing stands of the hot strip mill for steel rolling. Proc. Inst. Mech. Eng. Part J J. Eng. Tribol. 2013, 227, 837–844. [Google Scholar] [CrossRef]
- Paar, A.; Schneider, R.; Sommitsch, C. Influence of microstructural parameters of indefinite chill alloys on flexural strength and young’s modulus. Mater. Test. 2018, 60, 239–244. [Google Scholar] [CrossRef]
- Ibrahim, M.M.; El-Hadad, S.; Mourad, M. Enhancement of wear resistance and impact toughness of as cast hypoeutectic high chromium cast iron using niobium. Int. J. Cast Met. Res. 2018, 31, 72–79. [Google Scholar] [CrossRef]
- Col, M.; Koc, F.G.; Oktem, H.; Kir, D. The role of boron content in high alloy white cast iron (Ni-hard 4) on microstructure, mechanical properties and wear resistance. Wear 2016, 348–349, 158–165. [Google Scholar] [CrossRef]
- Iacoviello, F.; Iacoviello, D.; Di Cocco, V.; De Santis, A.; D’Agostino, L. Classification of ductile cast iron specimens based on image analysis and support vector machine. Procedia Struct. Integr. 2017, 3, 283–290. [Google Scholar] [CrossRef]
- Takeda, H.; Yoneda, H.; Asano, K. Effect of silicon and bismuth on solidification structure of thin wall spheroidal graphite cast iron. Mater. Trans. 2010, 51, 176–185. [Google Scholar] [CrossRef]
- Dun, X.L.; Liu, K.P.; Liu, H.S.; Lai, J.P.; Fu, X.H.; Zhou, J. Effect of multicomponent modifier on microstructure and mechanical properties of high Ni-Cr-Mo cast iron. Mater. Sci. Technol. 2011, 27, 1840–1845. [Google Scholar] [CrossRef]
- Radulovic, M.; Fiset, M.; Peev, K. Effect of rare-earth elements on microstructure and properties of high chromium white iron. Mater. Sci. Technol. 1994, 10, 1057–1062. [Google Scholar] [CrossRef]
- Prat, A.; Tort-Martorell, X.; Grima, P.; Pozueta, L. Métodos Estadísticos. Control y Mejora de la Calidad, 2nd ed.; Universidad Politécnica de Cataluña (UPC): Barcelona, Spain, 1997; pp. 165–195. ISBN 9788498802320. [Google Scholar]
- Romero, R.; Zúnica, L.R. Métodos Estadísticos en Ingeniería; Universidad Politécnica de Valencia: Valencia, Spain, 2005; pp. 275–278. ISBN 9788497057271. [Google Scholar]
- Johnson, R. Probabilidad y Estadística para Ingenieros, 3rd ed.; Prentice-Hall Hispanoamérica: México DF, México, 1997; pp. 489–494. ISBN 9688809616. [Google Scholar]
- Box, G.E.P.; Hunter, W.G.; Hunter, J.S. Estadística Para Investigadores: diseño, Innovación Y Descubrimiento, 2nd ed.; Reverté: Barcelona; Spain, 2008; pp. 235–273. ISBN 9788429150445. [Google Scholar]
- Song, J.M.; Lui, T.S.; Chen, L.H. Effect of carbon equivalent and spheroidizer addition on the morphology of strip cast white cast iron plate. Int. J. Cast Met. Res. 1999, 12, 83–91. [Google Scholar] [CrossRef]


© 2018 by the authors. Licensee MDPI, Basel, Switzerland. This article is an open access article distributed under the terms and conditions of the Creative Commons Attribution (CC BY) license (http://creativecommons.org/licenses/by/4.0/).