Abstract
Effects of microstructural changes induced by prestraining on hydrogen transport and hydrogen embrittlement (HE) of austenitic stainless steels were studied by hydrogen precharging and tensile testing. Prestrains higher than 20% at 20 °C significantly enhance the HE of 304L steel, as they induce severe α′ martensite transformation, accelerating hydrogen transport and hydrogen entry during subsequent hydrogen exposure. In contrast, 304L steel prestrained at 50 and 80 °C and 316L steel prestrained at 20 °C exhibit less HE, due to less α′ after prestraining. The increase of dislocations after prestraining has a negligible influence on apparent hydrogen diffusivity compared with pre-existing α′. The deformation twins in heavily prestrained 304L steel can modify HE mechanism by assisting intergranular (IG) fracture. Regardless of temperature and prestrain level, HE and apparent diffusivity () increase monotonously with α′ volume fraction (). can be described as for , with is diffusivity in α′, and are solubility in α′ and austenite, respectively. The two equations can also be applied to these more typical duplex materials containing both BCC and FCC phases.
1. Introduction
Many studies have focused on the effects of microstructural changes induced by prior plastic deformations on the hydrogen embrittlement (HE) and hydrogen transport of austenite stainless steels (ASSs) [,,,,,,,,,,], considering that ASS components often suffer from some degrees of plastic deformations during manufacturing processes before hydrogen exposure. In metastable ASSs, the microstructural changes mainly include the increase of dislocation density, formation of deformation twins and transformation from γ austenite to α′ martensite.
Some studies have demonstrated that α′ platelets induced by prior deformations (pre-existing α′) can increase significantly HE of ASSs because they accelerate hydrogen transport [,,,,,,] during hydrogen exposure by acting as diffusion “highways”. The hydrogen diffusivity has been found 5–6 orders of magnitude higher in α′ than in γ. For example, Perng and Altstetter [] showed that the apparent hydrogen diffusivity and permeability in 301 and 304 steels were greatly increased by pre-existing α′. In contrast, up to 80% deformation of 310 steel made only small changes in these two parameters, since no α′ was pre-introduced. Mine et al. [] found that, for 304 steel, in which prestrain-induced α′ was detected, fatigue crack growth (FCG) rate was more sensitive to hydrogen in prestrained steel than in solution-annealed steel. The increases of dislocations and other lattice defects after prestraining increased apparent solubility but without affecting diffusivity. In 316L steel, which exhibited little α′ after prestraining, there was no significant difference in FCG rate between the uncharged and hydrogen-charged specimens. Martin et al. [] even revealed a detrimental effect of machining-induced α′ on the performance of 304 steel after hydrogen exposure.
Dislocations can act as trap sites for hydrogen, thus the increase of dislocations after prestraining increases the apparent hydrogen solubilities of both ferritic steels and ASSs [,,,]. But it does not reduce the apparent diffusivity of ASSs [,], contrary to ferritic steels [,]. Mine et al. [] explained this as that the binding energy of hydrogen to dislocations in face-centered cubic (FCC) γ is not higher than the activation energy of lattice diffusion of hydrogen, whereas in body-centered cubic (BCC) ferrite the binding energy of hydrogen to dislocations is higher. However, Michler et al. [] studied the HE of ASSs, which were firstly deformed to various strains at various low temperatures to result in different pre-existing α′ contents and initial dislocation densities and then were tensile tested to failure in gaseous hydrogen. They found that HE increased with increasing initial dislocation density rather than with α′ content. They explained this by the fact that hydrogen can be transported by dislocation movement during plastic deformation []. The dislocation density increased as prestrain level increased, consequently, a higher amount of hydrogen was carried and transported from the external hydrogen gas into the interior of steel during deformation, leading to more severe HE. But when the initial dislocation density was increased to exceed a “critical” value, HE started to decrease, as in the heavily prestrained steel the mean free path of dislocations was too low to provide a sufficient transport distance and thus to cause HE effect. They concluded that, in the HE of ASSs loading directly in gaseous hydrogen, the initial dislocation density played a more crucial role than the pre-existing α′, though they did not exclude the role of pre-existing α′.
Twins play an important role in HE of twinning-induced plasticity (TWIP) steels [,,], because on one hand, stress concentrations can arise at the tips of twin plates, and on the other hand twin boundaries have higher binding energy with hydrogen compared with dislocations, thus they can trap and accumulate hydrogen strongly. Under the combined effect of stress concentration and hydrogen accumulation, hydrogen-assisted cracking initiates preferentially at twin tips and crack propagation occurs along twin boundaries. In addition, it is shown that in TWIP steels the presence of twins can even assist intergranular (IG) fracture [,,]. In 300 series ASSs, twins also play a role. As known, hydrogenated ASSs often show some flat facets in their fracture surfaces, which is believed to be caused by hydrogen-assisted cracking along the boundaries of annealing twins [,,,,,,,]. The effect of prestrain and its induced deformation twins on the HE of ASSs has been especially studied by Ji et al. [,]. In 310S steel, they found that prestrains and pre-existing deformation twins suppressed both the formation of fresh deformation twins and the delivery of hydrogen to twin boundaries during deformation, as a result with increasing prestrain level HE decreased []. Nevertheless, for 316L steel, although prestrains suppressed the formation of fresh deformation twins, they increased the volume fraction of ε martensite and consequently caused the segregation of hydrogen to γ/ε interfaces, resulting in increasing HE with increasing prestrain []. Recently, Chen et al. [] studied the effects of α′ and deformation twins on hydrogen-assisted FCG of cold- and warm-rolled 304 steel. In cold-rolled 304 steel, FCG was accelerated significantly by α′ platelets pre-induced by cold-rolling. However, for warm-rolled 304 steel, in which almost no α′ phase existed, FCG rate was controlled by deformation twins induced by warm-rolling. FCG rate was enhanced by hydrogen-assisted cracking along deformation twin boundaries and slip bands, though the enhancement degree was less compared with α′ platelets in cold-rolled steel.
As known, depending on the original location of hydrogen, HE can be classified into internal HE (IHE) and hydrogen environment embrittlement (HEE). Clearly, the HE type investigated by Michler et al. [] is HEE. Since there are often significant differences between IHE and HEE, in this study we investigated the effect of prestraining on hydrogen transport and IHE of metastable 304L steel. By altering prestrain level and temperature at which a prestrain was applied, different fractions of α′ were pre-introduced into the 304L steel [,,]. Prestrains also varied twin morphology and dislocation density. The HE was then evaluated by electrochemical hydrogen precharging and tensile testing. To differentiate the effect of the pre-existing α′ from that of the dislocation density on the resulting HE degree and hydrogen transport, the more stable 316L steel was also tested. In the 316L steel, prestrains can result in an increase of dislocation density but cannot induce severe α′ transformation. The resulting HE degree and apparent transport parameters (i.e., diffusivity and solubility) were related to these microstructural changes to demonstrate their effects. In addition, quantitative analyzes on the hydrogen transport parameters as a function of pre-existing α′ content were also performed by both theoretical analysis and finite element (FE) simulations.
2. Materials and Methods
2.1. Materials and Specimens
Industrially hot-rolled 304L and 316L plates with chemical compositions listed in Table 1 were used. They were solution-annealed at 1080 °C for 1 h and water-quenched. Md30, i.e., the temperature at which straining to 30% induces 50% vol. α′, is 25 and −62 °C for the 304L and 316L steel, respectively, according to the formula proposed by Nohara et al. []: ) (wt.%, is the ASTM grain size grade, which is 5.0 and 5.5 for the 304L and 316L, respectively, based on ASTM E112 standard []). Thus, the 304L steel used is metastable at room temperature but the 316L steel is stable. Tensile specimens with a gauge size of 25 (length) × 10 (width) × 2 (thickness) mm3 were cut from the plates with length direction parallel to rolling direction. The specimen surfaces were ground with successive grades of emery paper up to 2000 grit and then were polished with paste, washed with deionized water and dried.

Table 1.
Chemical compositions of the 304L and 316L ASSs used (in wt.%).
2.2. Prestraining
Uniaxial plastic prestrains were introduced by tensile at a strain rate of 2.5 × 10⁻⁴ s−1 using a tensile machine with a heating furnace. It has been found that, near Md30 temperature, elevating the temperature even slightly can lead to a rapid reduction in α′ content [,,]. Thus, the temperatures at which prestrains were applied for 304L steel included both room temperature (20 °C) and higher temperatures (50 and 80 °C). The specimens were heated slowly (~5 °C/min) to the specified temperatures and then clamped and tensioned to deform plastically. The temperature used for 316L steel was 20 °C; at this temperature the 316L steel is stable against α′ transformation. The plastic prestrain levels were set as 10 (±1), 20 (±2), 30 (±2), and 40 (±3) % for each temperature. After cooling, the resulting prestrain levels were measured. If the measured prestrain value of a specimen fell into the above specified tolerance interval, the specimen was used, otherwise, was abandoned.
2.3. Microstructural Examinations
To reveal the microstructural changes after prestraining, the un-prestrained and prestrained specimens were examined by an optical microscope (OM, AXIO Imager.A1m, ZEISS, Oberkochen, Germany) after etching by Beraha’s tint reagent (0.5 g potassium metabisulfite, 20 mL HCl and 100 mL distilled water), which can etch and reveal clearly the α′ platelets (dark) and austenite phase (white) by color difference [,,]. Some specimens are also examined by an electron backscattered diffraction (EBSD) detector (NordlysNano, OXFORD, Oxford, UK) after grounding and vibration polishing for 12 h. Channel 5 HKL software package was used to analyze and display EBSD data. In the generated orientation imaging microscopy (OIM) maps, different colors are used for ordinary high angle boundaries (misorientations greater than 15°), low angle boundaries (misorientations less than 15°), and Σ3 boundaries (misorientation of 60° about a <111> axis). Σ3 boundaries are considered as the twin boundaries [] to reveal the presence of twins. The BCC phase was also detected by the EBSD.
2.4. Martensite Content and Dislocation Density Measurements
To quantitatively determine α′ contents induced, the volume fractions of ferromagnetic phase was measured by a calibrated Feritscope (MF300F+, DIVERSE, Cambridge, UK), which is based on magnetic induction, giving the average ferromagnetic phase content yielding from a certain volume at measured site. Since γ is not ferromagnetic, the ferromagnetic phase can be taken as α′ [,,]. To verify the Feritscope readings, phase identifications and estimations were also carried out by X-ray diffraction (XRD) on un-prestrained and 30% prestrained specimens. The XRD was conducted by a diffractometer (SmartLab, RIGAKU, Tokyo, Japan) at 20 °C using a Cu-Kα (λ = 0.154056 nm) radiation operating at 40 kV and 30 mA at a step size of 0.02°. The quantitative estimations of phase fractions are based on the principle that the total integrated intensity of all diffraction peaks for each phase in a mixture is proportional to the volume fraction of that phase [,]. That is, the volume fractions of γ, α′, and ε can be derived by considering (220)γ, (311)γ, (111)γ, and (200)γ reflections for FCC γ austenite, (200)α′, (211)α′, and (110)α′ reflections for BCC α′ martensite, (101)ε and (102)ε for HCP ε martensite by the following formula:
where = γ, α′ or ε, is number of peaks of phase examined, and are integrated intensity of reflecting plane and material scattering factor, respectively. Each value was taken from [].
Dislocation density were evaluated based on the method of Williamson–Hall [,] using the XRD patterns. This method calculates dislocation density, , from the average values of microstrain, , and crystallite size, , of material by
where is the Burgers vector, for the FCC structure with is the lattice parameter. The determinations of and by using the XRD patterns have been reported elsewhere []. Although the Williamson–Hall method is not the most precise method to determine the dislocation density, it is enough to identify the changing trend of dislocation density [,].
2.5. Hydrogen Precharging and Total Hydrogen Amount Measurements
Hydrogen charging was performed in 0.1 mol/L NaOH solution for 48 h at 50 °C using a current density of 1.1 mA/cm2. Specimens were cathodes and Pt sheets were anodes. After charging, one group of specimens was taken to tensile testing immediately (within 5 min). To examine the hydrogen uptake during charging, the other group of specimens were selected to measure the total hydrogen amount charged into using an oxygen-nitrogen-hydrogen analyzer (ONH836, LECO, St. Joseph, MI, USA), which melted the specimens and measured the total mass of released hydrogen, , through the inert gas impulse fusion heat conductivity method [].
2.6. Tensile Testing and HE Degree Evaluation
Tensile testing after charging was performed at 20 °C also at the strain rate of 2.5 × 10⁻⁴ s−1. The uncharged un-prestrained and prestrained specimens were also tested as references. Tensile properties including yield strength (0.2% flow stress), tensile strength, and total elongation were recorded. To quantitatively describe the HE degree, HE index , i.e., plasticity loss was used as
where and are the total elongation of uncharged and charged specimen, respectively. HE degree increases with increasing . Fracture surfaces of broken specimens were examined by a scanning electron microscope (SEM, JSM-6510, JEOL, Tokyo, Japan). The apparent diffusivity and solubility of hydrogen was evaluated by analyze the brittle fracture region depth of fracture surfaces using Fick’s law. For 30% prestrain, two duplicate specimens were tested for each prestrain temperature.
3. Results
3.1. Martensite Transformation and Microstructures
The results of α′ content and OM images are shown in Figure 1, Figure 2 and Figure 3 Almost no α′ was detected in un-prestrained 304L and 316L steels, Figure 1 and Figure 2, indicating that both steels without prestraining were fully austenitic. The OM images confirm this, as the two steels exhibit typical microstructures of solution-annealed 300 series ASSs, i.e., consisting of nearly-equiaxed γ grains and some annealing twins, Figure 3a,g. However, as expected, the 304L steel prestrained at 20 °C exhibit α′, particularly at prestrains higher than 20%, as shown by Feritscope readings, Figure 1, and the presence of (110), (200), and (211) α′ peaks in XRD patterns, Figure 2a α′ content increases with prestrain. The α′ content is 41.5% in 30% prestrained specimens whereas it is 67.9% in 40% prestrained specimens. The OM images confirm the presence of a large fraction of α′ in the heavily prestrained 304L specimens, as etched dark platelets appeared within the bunches of shear bands, Figure 3b–d [,,]. Thus, a high level of prestrain (>20%) near 20 °C can induce severe α′ transformation in 304L steel due to its higher Md30 temperature. In contrast, 316L steel exhibits only a little α′ even at 40% prestrain at 20 °C (2.6%), Figure 1, Figure 2b, and Figure 3h, because it is stable.
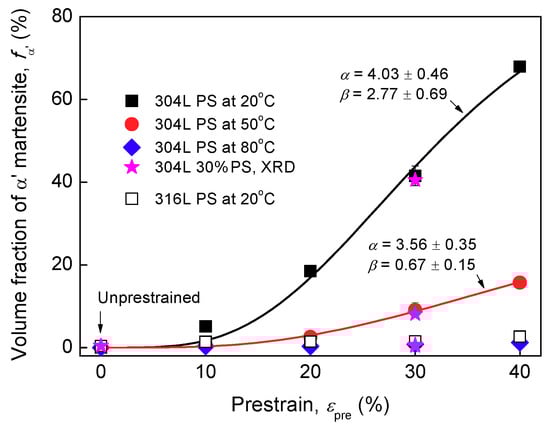
Figure 1.
Volume fraction of α′ obtained by Feritscope for 304L and 316L specimens un-prestrained and prestrained (PS) at different temperatures. The fitting curves based on the relation proposed by Olson and Cohen [] are also depicted: , where n is a fixed exponent having a value of 4.5, and and are temperature-dependent parameters, which decrease with increasing temperature, in agreement with [].
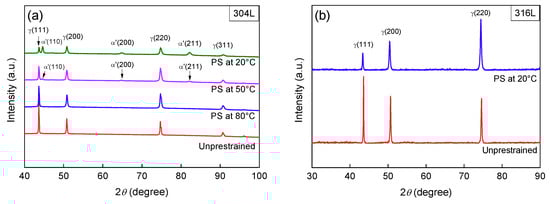
Figure 2.
XRD patterns of 304L (a) and 316L (b) steel specimens un-prestrained and prestrained (PS) to 30% strain at different temperatures. The (220)γ reflection becomes dominant after prestraining, indicating that texture changes also occur due to the uniaxial tensile prestrain.
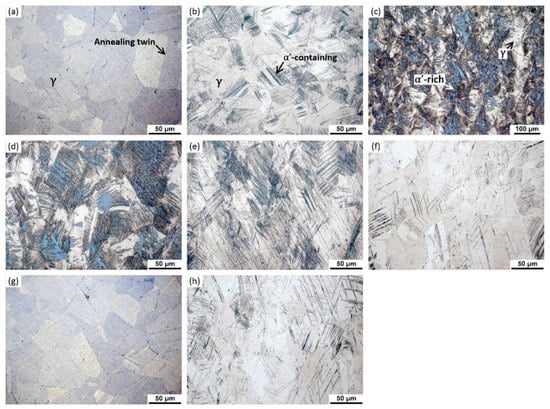
Figure 3.
OM images: (a) 304L un-prestrained; (b) 304L prestrained to 10% at 20 °C; (c,d) 304L prestrained to 30% at 20 °C; (e) 304L prestrained to 30% at 50 °C; (f) 304L prestrained to 30% at 80 °C; (g) 316L un-prestrained; (h) 316L prestrained to 40% at 20 °C. The etched dark regions within the bunches of shear bands contain α′ martensite; the darker the region, the more the α′ martensite.
Turning to 304L specimens prestrained at higher temperatures, Figure 1 shows that, the specimens prestrained at 50 °C exhibit less α′ (for example, almost no α′ at 10% prestrain, 15.7% α′ at 40% prestrain) and the specimens prestrained at 80 °C exhibit almost no α′ at all prestrain levels (for example, 1.2% α′ at 40% prestrain at 80 °C). The XRD patterns, Figure 2a, and OM images, Figure 3e,f, also indicate that there is only a small content of α′ in the specimens prestrained at 50 °C and almost no α′ in the specimens prestrained at 80 °C. Clearly, the results confirm that, increasing the prestrain temperature to slightly higher than Md30 temperature can rapidly suppress α′ transformation upon prestraining for 304L steel, in line with previous studies [,,]. The higher the temperature used, the more significantly the transformation is suppressed.
3.2. Twin Boundaries and Dislocation Densities
Boundary characteristics identified by EBSD are shown in Figure 4. Un-prestrained 304L specimen contains annealing twin boundaries, Figure 4a. But twin boundaries in 20 °C 20% and 30% prestrained 304L specimens appear irregular and fragmented, Figure 4b,c. These twin boundaries are expected to consist of both annealing and deformation twin boundaries. Typically, annealing twin boundaries after deformation appear fragmented because the concurrent deformation and grain rotation can convert a twin boundary, fully or in part, into an ordinary high angle grain boundary []. It is difficult to distinguish the two types of twin boundaries, however the fragmented twin boundaries are more likely to indicate the generation of new deformation twins [], because the twin boundaries are more in the 30% prestrained specimen than in the 20% prestrained specimen. This also indicates that with increasing prestrain the amount of deformation twins increases. In fact, it has been established that the amount of deformation twins in 300 series ASSs increases with prestrain [,,,]. Shen et al. [] found that the fraction of deformation twins in 304 steel increased with increasing strain for strain level less than 57%; the volume fraction of deformation twins was about 17% at the strain level of 20%. However, there are only a few twin boundary fragments in the 80 °C prestrained 304L specimen, it appears that no significant deformation twin was generated by warmly prestraining.
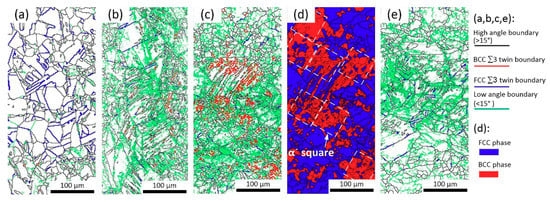
Figure 4.
EBSD results of un-prestrained (a), 20 °C 10% (b), 20 °C 30% (c,d), and 80 °C 30% (e) prestrained 304L steels. Blue lines in (a) are annealing twin boundaries, which become fragmented in (b,c) due to deformation (bule or red lines). (c) contains more fragmented red lines than (b) indicating the formation of deformation twins. (d) shows that α′ platelets can be modeled as squares.
The EBSD results confirm that there is a large fraction of BCC α′ platelets in 20 °C 30% prestrained 304L specimens. The BCC phase is 39% vol. measured by Channel 5 HKL software, Figure 4d, which is slightly lower than the Feritscope reading. There are almost no α′ platelets in the un-prestrained and 80 °C 30% prestrained specimens, in line with the Feritscope readings.
On assumption that dislocation density of un-prestrained specimen is ρ0, the relative dislocation densities ρ/ρ0 measured by XRD are depicted in Figure 5. ρ/ρ0 increases monotonously with prestrain, in agreement with the results of past studies [,]. In fact, there is a large amount of low angle boundaries in prestrained 304L specimens, Figure 4b–e. This also indicates the generation of new dislocations. It is indicated that dislocations mainly present at the vicinity of grain boundaries and twin boundaries. Compared with 20 °C prestrains, warm prestrains result in lower dislocation density.
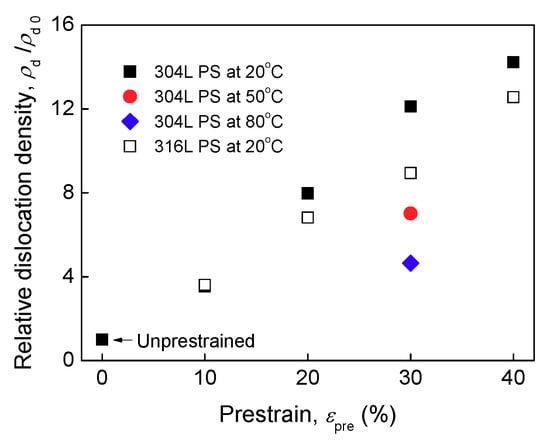
Figure 5.
Relative dislocation density of un-prestrained and prestrained (PS) specimens as functions of prestrain and temperature (: the dislocation density of un-prestrained specimen).
3.3. Mechanical Properties
Tensile properties are summarized in Figure 6a,b. The strength increases at the expense of total elongation with prestrain, indicating work-hardening due to prestraining. This has been widely-studied [] and is related to the increases of dislocations, deformation twins, and α′ transformation after prestraining. After a higher level of prestrain at 20 °C, since the increase in dislocations is more significant, Figure 5, and α′ is more, Figure 1, the work-hardening degree of steel after prestraining is more significant. However, for 304L steel prestrained at higher temperatures and 316L steel prestrained at 20 °C, since the increase of dislocations and/or α′ transformation is less significant, the work-hardening after prestraining is less significant. Hydrogen-charging has almost no influence on the yield strength of two steels but reduces the tensile strength and total elongation, indicating HE.
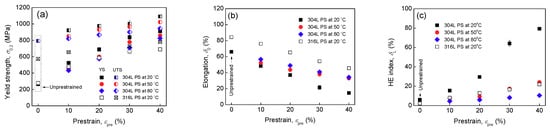
Figure 6.
Yield strength (a), total elongation (b), and HE index (c) of un-prestrained and prestrained (PS) specimens as functions of prestrain level and temperature.
3.4. HE Susceptibility Index
The HE indexes calculated by Equation (3) are summarized in Figure 6c. Un-prestrained 304L and 316L specimens have a HE index of 6% and 2%, respectively, confirming that solution-annealed two steels possess good HE resistance. In addition, 316L steel is less sensitive to hydrogen. Nevertheless, prestrains at 20 °C enhance the HE of 304L steel, particularly the prestrains higher than 20%. At 10% prestrain, the HE index of 304L steel is 15%, but at 30% prestrain it is 64%, at 40% prestrain it is 79%, indicating very severe HE. However, turning to 316L steel, the HE index is increased from 2% for un-prestrained specimen to 8% by 10% prestrain, to 17% by 30% prestrain, and to 22% by 40% prestrain, thus the enhancement of HE due to prestraining for 316L steel is not as significant as 304L steel. After prestraining, 316L steel still has a relatively higher HE resistance. Increasing prestrain temperature, Figure 6c shows that, the HE degree of 304L steel decreases, as compared with those prestrained at 20 °C. At 50 °C, even if the prestrain level is 40%, the HE degree is just slightly higher than un-prestrained specimen. Further elevating the prestrain temperature to 80 °C, the HE degrees at various prestrain levels are very close to that of un-prestrained specimen. Also, after high temperature prestrains, the HE degree of 304L steel becomes less dependent on prestrain, similar with 316L steel prestrained at 20 °C. It seems that warm prestrains have a little influence on HE of 304L steel.
3.5. Fracture Surface Morphologies
All specimens without charging exhibit evident necking and show dimples in the whole fracture surfaces, revealing a ductile fracture. But all charged specimens exhibit smaller reduction of area (RA) and two regions with different fracture features. The central regions show dimples, but the edge regions show brittle fracture mode. Representative fracture surfaces are shown in Figure 7, Figure 8 and Figure 9.
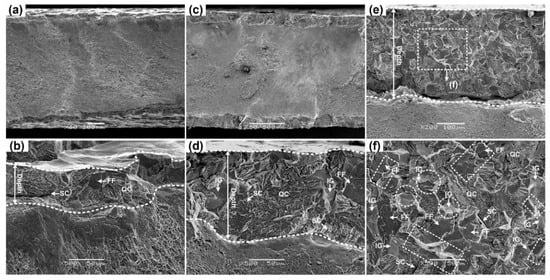
Figure 7.
SEM fracture surfaces of the 304L steel specimens: (a,b) Un-prestrained; (c,d) prestrained to 20% at 20 °C; (e,f) prestrained to 40% at 20 °C.
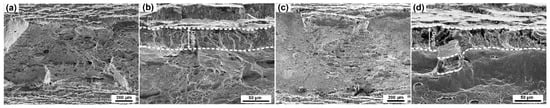
Figure 8.
SEM surfaces of 316L specimens: (a,b) Un-prestrained; (c,d) prestrained to 30% at 20 °C.
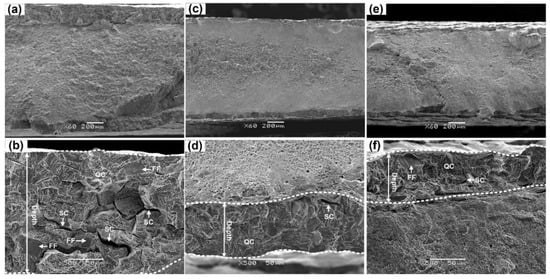
Figure 9.
SEM surfaces of 304L specimens. (a,b) Prestrained to 30% at 20 °C; (c,d) prestrained to 30% at 50 °C; (e,f) prestrained to 30% at 80 °C.
Brittle region of un-prestrained 304L specimen exhibits quasi-cleavage (QC) fracture with some flat facets (FFs) and secondary cracks (SCs), Figure 7b, which is typical fracture characteristic of HE in metastable 300 series ASSs [,,,,,,,]. As mentioned, FFs can be related to hydrogen-assisted twin boundary cracking [,,]. Nevertheless, besides QC fracture, FFs and SCs, 20 °C prestrained 304L steel also show intergranular (IG) fracture, Figure 7d,f and Figure 9b indicate more severe HE. The depth of brittle region, number of FFs, and proportion of IG fracture increase with prestrain, indicating that HE increases with prestrain, in line with the trend of HE index calculated by Equation (3). The results imply that a higher prestrain can modify the HE mechanism of metastable 304L steel.
The edge region of un-prestrained 316L steel exhibits also QC, whereas compared to 304L steel the depth of brittle region is smaller and SCs are tinier, Figure 8b, confirming higher HE resistance of 316L steel. Unlike 304L steel prestrained at 20 °C, there is no much difference in fracture surface characteristic between un-prestrained and prestrained 316L specimens, Figure 8d. On the other hand, all fracture surfaces of high-temperature prestrained 304L specimens show QC fracture with FFs and SCs but without IG fracture, Figure 9d,f. Thus, the results indicate that, for 316L steel prestrained at 20 °C and 304L steel prestrained at higher temperatures, in which little or no α′ was detected after prestraining, prestrains up to 40% have little influence on the HE mechanism. This is different from the case of 304L steel prestrained at 20 °C, in which an amount of α′ was detected after prestraining.
3.6. Hydrogen Diffusivity and Solubility
Figure 7, Figure 8 and Figure 9 show that the depth of brittle region, denoted as , varies with specimen condition. 304L specimens heavily prestrained at 20 °C exhibit larger and smaller RA, thus more severe HE, whereas 304L prestrained at 50 and 80 °C and 316L specimens prestrained at 20 °C exhibit smaller and larger RA, thus milder HE. The HE of specimen increases with .
The depth of brittle region can represent the distance of hydrogen transporting into the interior of specimen at end of charging, thus many researchers have used it to approximately calculate the apparent hydrogen diffusivity based on Fick’s law. For thick plate specimens, the distribution of hydrogen along the depth direction during charging can be formalized by []
where is depth from surface; is initial hydrogen concentration in specimen; is hydrogen concentration dissolved at specimen surface during charging, which is apparent hydrogen solubility; is apparent diffusivity of hydrogen; is charging time. Since when ≥ 2, approaches to 0, hence, the hydrogen transport depth (taking it equal to as an approximation) at end of hydrogen-charging can be calculated by taking = 2 [,], thus we have
Based on Equation (5), was calculated, Figure 10a. of un-prestrained 304L and 316L steels are and , respectively, in good agreement with data reported [,] ( ) for solution-annealed ASSs. Thus, calculated by Equation (5) is acceptable. Figure 10a shows that in 304L steel is significantly increased by prestrain at 20 °C. The higher the prestrain applied the higher the . are and , respectively, in 30 and 40% prestrained specimens, being about 22 and 51 times higher than that of the un-prestrained 304L specimen. However, of 304L specimens prestrained to 30% and 40% at 50 °C are just slightly higher than that of un-prestrained specimen, and of specimens prestrained to 30% and 40% at 80 °C are very close to that of un-prestrained specimens. of 304L specimens with a lower level of prestrain at higher temperatures, i.e., 10% at 50 °C and 10% and 20% at 80 °C, are even slightly lower than that of un-prestrained specimen. These results indicate that prestrains at 50 and 80 °C, particularly at 80 °C, have a relatively lesser influence on of 304L steel, compared with prestrains at 20 °C. In addition, prestrains at 20 °C also have a lesser influence on of 316L steel.
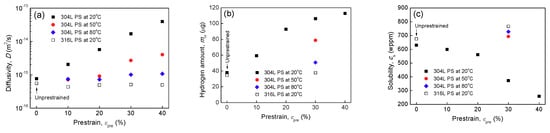
Figure 10.
Apparent hydrogen diffusivity (a), total hydrogen amount (b), and apparent solubility (c) of un-prestrained and prestrained (PS) specimens as functions of prestrain level and temperature.
Total hydrogen mass, , obtained by ONH836 analyzer are shown in Figure 10b. increased with prestrain for 304L steel prestrained at 20 °C. However, there is no evident difference between un-prestrained and 20 °C 30% prestrained 316L steel. At 30% prestrain, the higher the temperature used, the less the was charged into 304L steel. of 80 °C 30% pretrained specimen is just slightly higher that of the un-prestrained specimen. can be approximately calculated by
where, and are length and perimeter of specimen at gauge cross-section, respectively, and is density. Inserting and values into Equations (5) and (6), solubility was calculated, Figure 10c. The results indicate that in 304L steel decreases with increasing prestrain at 20 °C, particularly for prestrain higher than 20%, whereas of 316L steel prestrained at 20 °C and of 304L steel prestrained at higher temperatures are slightly higher than their un-prestrained specimens. The results indicate that a high level of prestrain at 20 °C can decrease significantly the apparent solubility of 304L steel, whereas a prestrain at higher temperatures has relatively little influence on the solubility. A prestrain even at 20 °C has little influence on the apparent solubility of 316L steel.
4. Discussion
4.1. Role of Pre-Existing α′ Martensite
Many studies [,,,,,,] have regarded α′ induced by prior deformation as the key contributor to enhanced HE of 300 series ASSs. Clearly, the significant increase in HE of 304L steel after a higher prestrain at 20 °C can also be attributed to α′. Figure 11a depicts HE indexes of all specimens as a function of α′ fraction. Regardless of prestrain and temperature, HE index is directly proportional to α′ content. The studies [,,,,,,] believed that the role of pre-existing α′ is to provide diffusion “highways” during hydrogen exposure. To verify this, Figure 11b,c display and values, respectively, as a function of α′. Both and increases with α′ fraction. Thus, it is undeniable that pre-existing α′ can act as diffusion “highways”, enhancing transport rate and hydrogen uptake during hydrogen exposure. With increasing prestrain, since the content of α′ increases, the hydrogen transport rate and total hydrogen amount entering is increased, the HE of metastable 304L steel is more severe. On the contrary, since the α′ is less significant in the prestrained 316L steel and the warmly prestrained 304L steel, their are less affected and their HE is less severe.
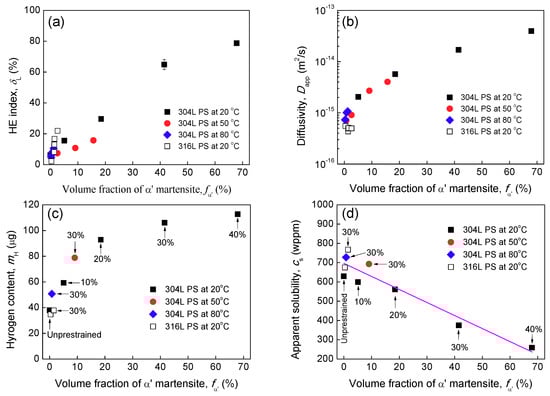
Figure 11.
HE indexes (a), apparent hydrogen diffusivity (b), total hydrogen amount (c), and apparent solubility (d) of specimens un-prestrained and prestrained (PS) as a function of α′ volume fraction.
Figure 11d depicts the apparent solubility calculated by Equation (6), although total hydrogen amount into a specimen increases with increasing α′ fraction, the decreases rapidly with α′. This is because the solubility of hydrogen is much lower in α′ than in γ. This also indicates that the hydrogen charged into was mainly stored inside γ phase. Evidently, there is a competition between the reduction of solubility (hydrogen concentration dissolved at surface) and the increase of apparent diffusivity due to α′. In fact, Figure 11c shows that initially rapidly increases with increasing prestrain, but later becomes not much changed with further increasing prestrain, because of the competition.
4.2. Role of Initial Dislocation Density
It is believed that IHE and HEE are the same on an atomic scale, but macroscopically there are significant differences between them. Discussions on the differences can be referred to a previous work []. The most important difference is that the transport processes of hydrogen in IHE and HEE are different. On one hand, HEE is more complicated because several steps (including gaseous hydrogen transport, physical adsorption, dissociation of molecules, chemisorption, and diffusion in metals) are required to transport hydrogen from environment into metal lattice. On the other hand, strong interactions exist between hydrogen transport and plastic deformation (dislocation glides). It is believed that hydrogen transport by moving dislocations [] is the most important transport mechanism in HEE.
Michler et al. [] suggested that the increase of dislocations after deforming is more crucial than α′ in HEE of cold-worked ASSs. In annealed ASSs, the dislocation population is low, thus dissolved hydrogen amount is low. But after deforming, since dislocations increases, the hydrogen amount that dissolved and can be transported by moving dislocations increases [], leading to enhanced HE. However, turning to the IHE of 304L steel prestrained, it appears that the contribution of dislocation density is minor, compared with pre-existing α′, based on two aspects.
- Compared with pre-existing α′, the effect of initial dislocation density on apparent parameters is minor.
As mentioned, dislocations acting as trap sites can decrease the apparent hydrogen diffusivity but increase solubility of BCC carbon and low alloy steels. However, Figure 11c shows contrary results for FCC 304L steel. Thus, the increasing (decreasing) effect of dislocation multiplication on the apparent solubility (diffusivity) is negligible compared to the decreasing (increasing) effect of α′ on solubility (diffusivity). In addition, Figure 11c shows that, for high-temperature prestrained 304L specimens and 20 °C prestrained 316L specimens, although their dislocation density increased after prestrain, their apparent diffusivity remains almost unchanged and solubility are just slightly higher than that of un-prestrained specimen, confirming again that the effect of dislocation increase on apparent solubility and diffusivity is minor. In fact, as mentioned, Perng and Altstetter [] and Mine et al. [] have also found that even after a very high level of deformation (for example, up to 80% deformation for 310 steel) apparent diffusivity is less affected. In the IHE condition, since a large amount of hydrogen has already been transported into the steel by α′ “highways” before loading, hydrogen can readily interact with deformation and/or reduce cohesive energy during loading. Hydrogen transport by moving dislocations is not the essential step in such case.
- Compared with pre-existing α′, the effect of initial dislocation density on HE degree is minor.
In more stable 316L steel after prestraining at 20 °C and 304L steel after prestraining at higher temperatures, dislocation densities are also significantly increased, Figure 5. However, their HE degrees are just slightly increased, Figure 6c. Thus, the prestrain-induced increase in dislocation density has relatively little influence on the HE of ASSs. On the contrary, for 304L specimens prestrained at 20 °C, a large fraction of α′ was induced by prestraining, consequently their HE was markedly enhanced.
4.3. Role of Twin Boundaries
As revealed, high levels of prestrain modify the HE mechanism of 304L steel by showing more FFs and IG fractures. Moreover, Figure 7d,f shows that IG fracture initiated mainly at grain boundaries impinging on twins and grain boundary triple junctions. Many SCs “wedged” into grain–twin boundaries and some FFs intersected. These features are rarely observed in solution-annealed and hydrogenated ASSs but have been observed in TWIP steels [,,]. Thus, the presence of these fracture features can be attributed to deformation twins after prestraining and can be explained schematically by Figure 12 from the following two aspects.
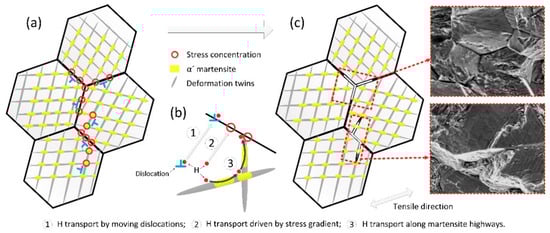
Figure 12.
Schematics for the intergranular (IG) cracking and twin boundary separations. (a) Stress concentrations arising at the grain or twin boundaries and their intersections; (b) Hydrogen transport ways to these boundaries and intersections: ① transported by moving dislocations, ② stress-assisted hydrogen diffusion, ③ transported through α′ “highways”; (c) IG fracture initiates at the intersections.
(1) Stress concentration. Moving dislocations and progressing twins can be intercepted by grain or twin boundaries, leading to stress concentration [,,], Figure 12a. In addition, α′ platelets, which form preferably at deformation twins, intersections between twins, and at twin or grain boundary intersections, can also lead to stress concentration [,,]. In fact, Figure 3 has shown that α′ platelets mainly formed within the bunches of shear bands, where deformation twins also present [].
(2) Hydrogen accumulation. Clearly, stress concentration at grain or twin boundaries can induce hydrogen accumulation due to stress-assisted hydrogen diffusion [], Figure 12b②. Moreover, since dislocations are trapping sites for diffusible hydrogen (grain boundaries are also trap sites), hydrogen can be transported to grain or twin boundaries by moving dislocations [], Figure 12b①. Figure 4 has indicated that more dislocations present at the vicinity of grain boundaries and twin boundaries. Furthermore, hydrogen can also be transported to these boundaries and their intersections through α′ “highways” for hydrogen diffusion, Figure 12b③. Thus, hydrogen can accumulate on grain or twin boundaries and their intersections. Under the combined action of stress concentration and concentrated diffusible hydrogen, IG fracture initiates at the intersections of grain–grain/grain–twin boundaries and crack propagation occurs along grain or twin boundaries, because the cohesive energy of these intersections and boundaries is reduced by hydrogen, Figure 12c.
4.4. Warm Prestrain: Strengthening ASSs without Impairing Their HE Resistance
To widen the applications of ASSs, cold-deformations have been often applied to ASS parts or their surface layers to strengthen/harden them. However, if α′ transformation occurs during cold-deformation, the HE resistance and hydrogen permeation resistance can be reduced. The results of this study imply that, for ASSs that will be deformed, elevating the deformation temperature is an applicable method to suppress α′ transformation, consequently preserving their HE resistance. For 304L steel investigated, which has a Md30 temperature close to room temperature, 50 and 80 °C prestrains are easy to operate. More importantly, the results show that, although high-temperature prestrains do not strengthen the 304L steel as effective as 20 °C prestrain due to less significant α′ transformation, they still elevate the strength of 304L steel by a large degree. For example, 30% prestrain at 20 °C elevates the yield strength from 263 to 847 MPa by 3.2 times, whereas 30% prestrain at 50 °C elevates it to 785 MPa by 3.0 times, 30% prestrain at 80 °C elevates it to 720 MPa by 2.7 times. Moreover, since α′ transformation is less significant at higher temperatures, 304L steel still has a relatively higher plasticity. For example, the total elongation of un-prestrained 304L specimen is 66%, after 40% prestrain at 20 °C it reduces to only 14%, whereas it is 27% after 40% prestrain at 50 °C, 33% after 40% prestrain at 80 °C. Such level of plasticity is attractive to the components exposing to hydrogen compared with carbon and low alloy steels having a similar strength level.
5. Hydrogen Transport in Duplex Materials
The ASSs after a higher level of plastic deformation consist of both FCC γ and BCC α′, thus they can be considered as duplex materials. The more typical duplex materials include the duplex stainless steels containing BCC ferrite and austenite (e.g., 2205) and the martensitic stainless steel containing retained austenite (e.g., 13% Cr). Hydrogen transport is more complicated in FCC + BCC duplex materials, because the dispersed austenite platelets possess low hydrogen diffusivity but high solubility and the transport path of hydrogen is tortuous. To understand the HE mechanisms/kinetics of duplex materials and to control/predict their HE, the knowledge of transport properties and hydrogen distribution of duplex materials is essential. Thus, over the years, many researchers have made efforts to study the hydrogen transport of duplex materials. In this section, we discuss the hydrogen transport of duplex materials by means of both theoretical analysis and FE simulations.
5.1. Theoretical Analysis
By viewing the platelets of two phases as organized in a parallel or series geometrical configuration, Gesnouin et al. [] have proposed two extreme cases to describe the hydrogen permeation rate of a duplex material, i.e., parallel configuration:
and series configuration:
where and are permeation rates, and are fractions of BCC and FCC phase, respectively, . The permeation rate is the product of solubility constant s and diffusivity , i.e., . Regardless of geometrical configuration, the apparent hydrogen solubility can be described as
where and are solubilities of BCC and FCC phase. Thus, Equations (7) and (8) are rewritten as
where and are diffusivities of BCC and FCC phase, respectively. Table 2 gives a summary of hydrogen transport parameters reported for BCC and FCC phase [,,,,]. Since is 5–6 orders of magnitude higher than , but is 2–3 orders of magnitude lower than , we can expect that for a duplex material, in which BCC phase is rich. Thus, for the parallel configuration, the last items of Equation (10) is ignored, Equation (10) becomes
Table 2.
Hydrogen transport parameters used for the theoretical modeling and FE simulations.
Since >>, >>1. Equation (12) becomes
Equation (13) indicates a simple linear relation between and . Since >>, Equation (9) can be simplified as
indicating that there is also a simple linear relation between and for a duplex material.
γ platelets are also believed to play roles as hydrogen trap sites. According to Oriani’s theory [], if the local equilibrium of hydrogen is maintained between lattice sites and trap sites, the apparent diffusivity of hydrogen can be given by
where is lattice diffusivity, is number of lattice sites, is number of trapping sites, and is binding energy of hydrogen to trap sites. Considering γ platelets are trap sites, , , , and should be replaced by , , , and , respectively, where and are binding energy of hydrogen to dislocations in FCC and BCC phase, respectively. Moreover, at lower temperatures, the 2nd term in the denominator is predominant. Thus, Equation (15) becomes
According to local equilibrium assumption of hydrogen between BCC and FCC phase, we have
In general, has a value of 13.5 kJ [] and has 27 kJ [] at 20 °C. Inserting 13.5 and 27 kJ into Equation (17), we get , which is close to the value that can be calculated from the data in Table 2, e.g., . Inserting Equation (17) into Equation (16), we can get . Therefore, linear relation between and can also be deduced from the viewpoint of hydrogen trapping. It is interesting that both Equations (10)–(15) can lead to Equation (13), though the former is based on the geometrical configuration whereas the latter is based on the hydrogen trapping role of γ platelets.
Figure 11d and Figure 13 plots experimental and as a function of , respectively. linearly increases with when and linearly decreases with . Thus, Equations (10)–(14) can be used to describe the apparent hydrogen diffusivity and solubility of α′-containing ASSs. To further valid Equations (10) and (13), Figure 14 shows a summary of experimental data available in literatures [,,,,,,,,,,,,,,,,] including the typical duplex materials. Most of the experimental data follow a near-linear relation between and . Moreover, by inserting the reported transport parameters listed in Table 2 into Equation (10), the diffusivities at a similar temperature were predicted. The predicting curves are very close to the reported data, Figure 14.
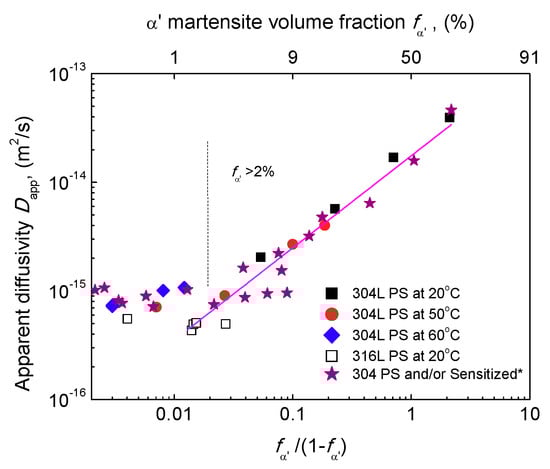
Figure 13.
Relation between and . (*: These data were obtained for a 304 steel in another ongoing study. The steel was firstly prestrained and then submitted to sensitization for different times to vary the content of pre-existing α′).
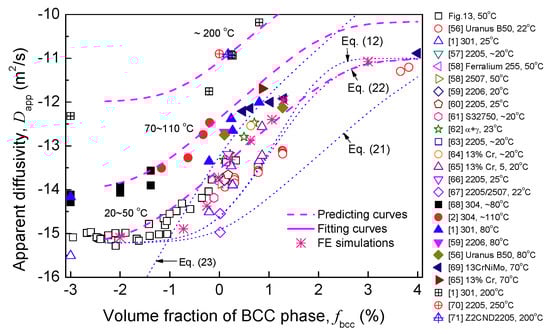
Figure 14.
of FCC + BCC duplex materials reported as a function of BCC volume fraction.
Nevertheless, the series model Equation (11) cannot produce the linear trend of as a function of , Figure 14. Some researchers have also suggested relations to describe the apparent hydrogen diffusivity of duplex materials. For instance, Equation (18) is another simple series model used by Iacoviello et al. [,], Equation (19) is the model used by Bernabai and Torella [], Hsu et al. [], and He et al. []. These two models do not include solubility item. Equation (20) is the model extracted from the study of Turnbull and Hutchings [] and, for example, has been used by Silva et al. [].
Based on the data listed in Table 2, these models are also depicted in Figure 14. It can be found that these three equations cannot predict the diffusivity of duplex materials more accurately compared with Equations (10)–(13). Equations (10)–(13) are enough to assess quickly the diffusivity for a duplex material at hand when exact diffusion data are not available.
5.2. FE Simulations
Hydrogen transport in a duplex material depends on the size, shape, orientation, and geometrical configuration of FCC/BCC platelets. To study the effects of these factors, some studies have used FE method. Olden et al. [] simulated the effects of shape, size, and orientation of γ platelets in a ferrite-austenite steel. They revealed that FE method is applicable to demonstrate hydrogen transport in a duplex steel. Mente and Boellinghaus [] have demonstrated hydrogen diffusion and effusion behaviors of a duplex steel consisting of 45% γ by FE method. They used a geometrical configuration copied from a real OM image. The fraction of BCC/FCC platelets also affects hydrogen diffusion; thus, we studied the effect of α′ fraction on hydrogen diffusion of prestrained 304L steel by FE method.
Olden et al. assume a regular arrangement for γ platelets [], but the embedded platelets of a duplex material are generally distributed randomly and some platelets connected with each other. For the prestrained 304L steel, Figure 3 and Figure 4d also indicates that α′ platelets distributed somewhat randomly. Thus, duplex materials are more suitably modeled by means of representative volume element (RVE) method, which has been widely employed to predict the mechanical/thermal behavior of duplex steels or composites [,]. Using ABAQUS 6.10 software (SIMULIA, Providence, RI, USA), 2D RVE models were built for 304L steel. Based on Figure 3 and Figure 4d, the embedded α′ platelets are modeled as squares for simplicity and they distribute randomly with a quantity equal to that of prior γ gains. The α′ squares grow bigger with increasing prestrain, thus the size of α′ squares were set as 10, 20, 30, 35, 40, 45, and 48 μm (prior γ size is 50 μm), corresponding to a volume faction of α′ of 4, 16, 36, 49, 64, 81, and 92%, respectively (for example, ). Figure 15 shows the model containing 64% α′ as an example.

Figure 15.
2D RVE model of the 304L steel containing 64% α′.
The diffusion calculation of ABAQUS is based on an extension of Fick′s equation allowing for the nonuniform solubility of hydrogen in a material. The basic solution variable is the so-called “normalized concentration”, denoted as , . The diffusion constitutive equation is
The diffusivity and solubility parameters at 20–50 °C listed in Table 2 are assigned to the α′ and γ phase regions. A constant surface normalized concentration is prescribed on the top surface as the diffusion boundary condition.
Figure 16 and Figure 17 show the contour results obtained by ABAQUS. Hydrogen transport depth increases with time, Figure 16a,b. The presence of α′ platelets significantly accelerates the hydrogen transport, as indicated by Figure 16b,c. If the α′ squares connect with each other into a path along depth direction, the acceleration is more significant, as indicated by location a, b, and c in Figure 16e, where diffusion “highways” can be traced out along the connected α′ squares and the transport path is crooked. The magnitude of concentration flux vector of hydrogen, Mflux, is very large along the connected α′ squares, Figure 16f, demonstrating directly the “highways” role of connected α′ platelets in hydrogen transport. However, if the α′ squares are surrounded by γ platelets, the transport rate is somewhat small, as indicated by location e in Figure 16e. Figure 16d shows the result of a case where all α′ squares are surrounded by γ phase, similar with the cases considered by Olden et al. [], where the α′ squares are all embedded in γ phase and are arranged regularly rather than randomly. Evidently, this case results in a lower transport depth. Thus, it may be not suitable for a duplex material with irregularly distributed embedded platelets, such as the prestrained and α′-containing 304L steel. Moreover, at the same time, hydrogen transport depth increases with volume fraction of α′, Figure 17.
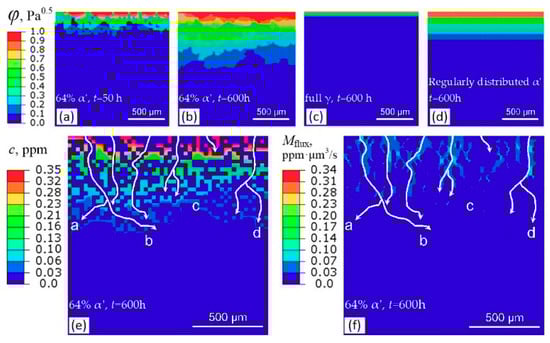
Figure 16.
Contour results obtained by ABAQUS. (a–d) Normalized hydrogen concentration, φ; (e) hydrogen concentration, c; (f) magnitude of the concentration flux vector of hydrogen, Mflux. The white lines with arrows in (e,f) represent the hydrogen diffusion path. The locations, where α′ squares connect with each other to form a path, i.e., (a–d), show the role of α′ as diffusion “highways”.
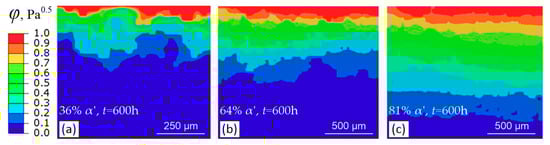
Figure 17.
Normalized concentration distributions after 600 h diffusion at different α′ volume fractions: (a) 36% vol. α′; (b) 64% vol. α′; (c) 81% vol. α′.
was calculated by substituting the average concentration at a certain depth into Equation (4) according to Olden et al. [], Figure 14. When 35% < < 90%, the simulated results are close to experimental data, it seems that there is also a linear relation between and . However, when < 35% the FE simulated data are lower. This is probably because at the early stage of plastic deformation, the small α′ platelets mainly nucleate and grow within the shear bands, thus at this stage α′ phase should be modeled as lines or mesh rather than squares. Evidently, for a specified content of α′, the α′ lines or mesh can transport hydrogen faster.
6. Conclusions
The effects of microstructural changes induced by prestraining on the HE of 304L and 316L steels were investigated. The conclusions are as follows:
- Room temperature prestrains higher than 20% can significantly increase the HE degree of 304L steel after hydrogen exposure, because they can induce severe α′ transformation. During hydrogen exposure, the pre-existing α′ platelets, acting as hydrogen diffusion “highways”, increase significantly the hydrogen transport, thus increasing the HE degree.
- 304L steel prestrained at higher temperatures (50 and 80 °C) and 316L steel prestrained at 20 °C exhibit more dislocations but much less α′ after prestraining, consequently their HE degree and hydrogen diffusivity are just slightly increased by prestraining. HEE can be enhanced by the increase of dislocations after prestraining by transporting more hydrogen into the steel during concurrent loading and hydrogen exposure. However, in the IHE condition studied, where no macroscopic plastic deformation occurs during hydrogen exposure, hydrogen entry is mainly enhanced by α′ “highways” rather than by dislocations. The increase of dislocations has a negligible influence on the apparent hydrogen diffusivity, as compared with the pre-existing α′.
- Deformation twins can provide easier cracking paths for HE, it can assist IG fracture in the heavily prestrained 304L steel after hydrogenation. The fracture surfaces of heavily prestrained and hydrogenated 304L steel show many flat facets and intergranular (IG) fracture.
- Warm prestrains result in much less α′ but they can still strengthen the 304L steel by a large degree, thus there is a potential to use warm prestrains to strengthen the metastable ASSs without compromising their HE resistance.
- The heavily prestrained metastable 304L steel can be considered a duplex material. With increasing α′ platelets, the apparent hydrogen diffusivity of steel increases but its solubility decreases. The apparent hydrogen diffusivity and solubility can be described quantitatively by the parallel configuration model or by the following relations:There two relations can be also applied the other more typical duplex materials.
Author Contributions
Conceptualization, Y.W.; Methodology, Y.W., X.W., and W.W.; Investigation, Y.W., X.W. and W.W.; Data curation, X.W. and W.W.; Resources, Y.W.; Supervision, Y.W.; Writing—original draft, X.W.; Writing—review & editing, Y.W.
Funding
This research was funded by the Fundamental Research Funds for the Central Universities of China (Grant No. 2015QNA20).
Acknowledgments
The authors thank J.G. (Nanjing Tech University) for his technical assistance and acknowledge the financial support by the Fundamental Research Funds for the Central Universities of China (2015QNA20).
Conflicts of Interest
The authors declare no conflicts of interest. The funders had no role in the design of the study; in the collection, analyzes, or interpretation of data; in the writing of the manuscript, and in the decision to publish the results.
References
- Perng, T.P.; Altstetter, C.J. Effects of deformation on hydrogen permeation in austenitic stainless steels. Acta Metall. 1986, 34, 1771–1781. [Google Scholar]
- Mine, Y.; Narazaki, C.; Murakami, K.; Matsuoka, S.; Murakami, Y. Hydrogen transport in solution-treated and pre-strained austenitic stainless steels and its role in hydrogen-enhanced fatigue crack growth. Int. J. Hydrogen Energy 2009, 34, 1097–1107. [Google Scholar] [CrossRef]
- Martin, M.; Weber, S.; Izawa, C.; Wagner, S.; Pundt, A.; Theisen, W. Influence of machining-induced martensite on hydrogen-assisted fracture of AISI type 304 austenitic stainless steel. Int. J. Hydrogen Energy 2011, 36, 11195–11206. [Google Scholar] [CrossRef]
- Wang, Y.; Wang, X.; Gong, J.; Shen, L.; Dong, W. Hydrogen embrittlement of catholically hydrogen-precharged 304L austenitic stainless steel: Effect of plastic pre-strain. Int. J. Hydrogen Energy 2014, 39, 13909–13918. [Google Scholar] [CrossRef]
- Buckley, J.R.; Hardie, D. The effect of pre-straining and δ-ferrite on the embrittlement of 304L stainless steel by hydrogen. Corros. Sci. 1993, 34, 93–107. [Google Scholar] [CrossRef]
- Perng, T.P.; Altstetter, C.J. Cracking kinetics of two-phase stainless steel alloys in hydrogen gas. Metall. Trans. A 1988, 19, 145–152. [Google Scholar] [CrossRef]
- Zhang, L.; Li, Z.; Zheng, J.; Zhao, Y.; Xu, P.; Zhou, C.; Li, X. Effect of strain-induced martensite on hydrogen embrittlement of austenitic stainless steels investigated by combined tension and hydrogen release methods. Int. J. Hydrogen Energy 2013, 38, 8208–8214. [Google Scholar] [CrossRef]
- Zhang, L.; Li, Z.; Zheng, J.; Zhao, Y.; Xu, P.; Liu, X. Influence of low temperature prestrain on hydrogen gas embrittlement of metastable austenitic stainless steels. Int. J. Hydrogen Energy 2013, 38, 11181–11187. [Google Scholar] [CrossRef]
- Chen, X.; Zhou, C.; Zheng, J.; Zhang, L. Effects of α′ martensite and deformation twin on hydrogen-assisted fatigue crack growth in cold/warm-rolled type 304 stainless steel. Int. J. Hydrogen Energy 2018, 43, 3342–3352. [Google Scholar] [CrossRef]
- Lai, C.L.; Tsay, L.W.; Chen, C. Effect of microstructure on hydrogen embrittlement of various stainless steels. Mater. Sci. Eng. A 2013, 584, 14–20. [Google Scholar] [CrossRef]
- Chen, T.C.; Chen, S.T.; Tasy, L.W. The role of induced α′-martensite on the hydrogen-assisted fatigue crack growth of austenitic stainless steels. Int. J. Hydrogen Energy 2014, 39, 10293–10302. [Google Scholar] [CrossRef]
- Choo, W.Y.; Lee, J.Y. Effect of cold working on the hydrogen trapping phenomena in pure iron. Metall. Trans. A 1983, 14, 1299–1305. [Google Scholar] [CrossRef]
- Huang, Y.; Nakajim, A.; Nishikata, A.; Tsuru, T. Effect of mechanical deformation on permeation of hydrogen in iron. ISIJ Int. 2003, 43, 548–554. [Google Scholar] [CrossRef]
- Michler, T.; Naumann, J.; Hock, M.; Berreth, K.; Balogh, M.P.; Sattler, E. Microstructural properties controlling hydrogen environment embrittlement of cold worked 316 type austenitic stainless steels. Mater. Sci. Eng. A 2015, 628, 252–261. [Google Scholar] [CrossRef]
- Louthan, M.R., Jr.; Caskey, G.R., Jr.; Donovan, J.A.; Rawl, D.E., Jr. Hydrogen embrittlement of metals. Mater. Sci. Eng. 1972, 10, 357–368. [Google Scholar] [CrossRef]
- Koyama, M.; Akiyama, E.; Sawaguchi, T.; Raabe, D.; Tsuzaki, K. Hydrogen-induced cracking at grain and twin boundaries in an Fe-Mn-C austenitic steel. Scr. Mater. 2012, 66, 459–462. [Google Scholar] [CrossRef]
- Koyama, M.; Akiyama, E.; Tsuzaki, K.; Raabe, D. Hydrogen-assisted failure in a twinning-induced plasticity steel studied under in situ hydrogen charging by electron channeling contrast imaging. Acta Mater. 2013, 61, 4607–4618. [Google Scholar] [CrossRef]
- Koyama, M.; Akiyama, E.; Tsuzaki, K. Hydrogen embrittlement in a Fe-Mn-C ternary twinning-induced plasticity steel. Corros. Sci. 2012, 54, 1–4. [Google Scholar] [CrossRef]
- Caskey, G.R., Jr. The role of twinning and transformation in hydrogen embrittlement of austenitic stainless steels. In Proceedings of the Conference of the Environmental Degradation of Engineering Materials, Blacksburg, VA, USA, 10 October 1977. [Google Scholar]
- Caskey, G.R., Jr. Fractography of hydrogen-embrittled iron-chromium-nickel alloys. In Proceedings of the 13th Annual Technical Meeting of the International Metallographic Society, Brighton, UK, 18–20 August 1980. [Google Scholar]
- Eliezer, D.; Chakrapani, D.G.; Altstetter, C.J.; Pugh, E.N. The influence of austenite stability on the hydrogen embrittlement and stress-corrosion cracking of stainless steel. Metall. Trans. A 1979, 10, 935–941. [Google Scholar] [CrossRef]
- Ji, H.; Park, I.J.; Lee, S.M.; Lee, Y.K. The effect of pre-strain on hydrogen embrittlement in 310S stainless steel. J. Alloys Compd. 2014, 598, 205–212. [Google Scholar] [CrossRef]
- Park, I.J.; Jung, J.G.; Jo, S.Y.; Lee, S.M.; Lee, Y.K. The effect of pre-strain on the resistance to hydrogen embrittlement in 316L austenitic stainless steel. Mater. Trans. 2014, 55, 964–970. [Google Scholar] [CrossRef]
- Talonen, J.; Hänninen, H. Formation of shear bands and strain-induced martensite during plastic deformation of metastable austenitic stainless steels. Acta Mater. 2007, 55, 6108–6118. [Google Scholar] [CrossRef]
- Ahmedabadi, P.M.; Kain, V.; Agrawal, A. Modelling kinetics of strain-induced martensite transformation during plastic deformation of austenitic stainless steel. Mater. Des. 2016, 109, 466–475. [Google Scholar] [CrossRef]
- Shin, H.C.; Ha, T.K.; Chang, Y.W. Kinetics of deformation induced martensitic transformation in a 304 stainless steel. Scr. Mater. 2001, 45, 823–829. [Google Scholar] [CrossRef]
- Nohara, K.; Ono, Y.; Ohashi, N. Composition and grain size dependencies of strain-induced martensitic transformation in metastable austenitic stainless steels. Tetsu-to-Hagane 1977, 63, 212–222. [Google Scholar] [CrossRef]
- ASTM International. Metallography, Nondestructive Testing; ASTM International: New York, NY, USA, 1986; pp. 115–117. [Google Scholar]
- Wu, Z.; Huang, Y. Mechanical behavior and fatigue performance of austenitic stainless steel under consideration of martensitic phase transformation. Mater. Sci. Eng. A 2017, 679, 249–257. [Google Scholar]
- Tian, Y.; Gorbatov, O.I.; Borgenstam, A.; Ruban, A.V.; Hedström, P. Deformation microstructure and deformation-induced martensite in austenitic Fe-Cr-Ni alloys depending on stacking fault energy. Metall. Mater. Trans. A 2017, 48, 1–7. [Google Scholar] [CrossRef]
- Ahmadzade-Beiraki, E.; Mazinani, M.; Kashefi, M. Examination of Barkhausen noise parameters for characterisation of strain-induced martensitic transformation in AISI 304 stainless steel. Insight 2016, 58, 297–301. [Google Scholar] [CrossRef]
- Mirzadeh, H.; Cabrera, J.M.; Najafizadeh, A.; Calvillo, P.R. EBSD study of a hot deformed austenitic stainless steel. Mater. Sci. Eng. A 2012, 538, 236–245. [Google Scholar] [CrossRef]
- Cullity, B.D. Elements of X-ray Diffraction; Addison-Wesley: Reading MA, USA, 1978; pp. 392–393. [Google Scholar]
- De, A.K.; Murdock, D.C.; Mataya, M.C.; Speer, J.G.; Matlock, D.K. Quantitative measurement of deformation-induced martensite in 304 stainless steel by X-ray diffraction. Scr. Mater. 2004, 50, 1445–1449. [Google Scholar] [CrossRef]
- Williamson, G.K.; Smallman, R.E. Dislocation densities in some annealed and cold-worked metals from measurements on the X-ray Debye-Scherrer spectrum. Philos. Mag. 1955, 1, 34–36. [Google Scholar] [CrossRef]
- Dini, G.; Ueji, R.; Najafizadeh, A.; Monir-Vaghefi, S.M. Flow stress analysis of TWIP steel via the XRD measurement of dislocation density. Mater. Sci. Eng. A 2010, 527, 2759–2763. [Google Scholar] [CrossRef]
- Peng, Y.; Gong, J.; Jiang, Y.; Fu, M.; Rong, D. The effect of plastic pre-strain on low-temperature surface carburization of AISI 304 austenitic stainless steel. Surf. Coat. Technol. 2016, 304, 16–22. [Google Scholar] [CrossRef]
- Steel and Iron—Determination of Hydrogen Content—Inert Gas Impulse Fusion Heat Conductivity Method; SAC: Beijing, China, 2007; GB/T 223.82-2007.
- Olson, G.B.; Cohen, M. Kinetics of strain-induced martensitic nucleation. Metall. Trans. A 1975, 6, 791–795. [Google Scholar] [CrossRef]
- Mishra, S.; Narasimhan, K.; Samajdar, I. Deformation twinning in AISI 316L austenitic stainless steel: role of strain and strain path. Mater. Sci. Technol. 2007, 23, 1118–1126. [Google Scholar] [CrossRef]
- Shen, Y.F.; Li, X.X.; Sun, X.; Wang, Y.D.; Zuo, L. Twinning and martensite in a 304 austenitic stainless steel. Mater. Sci. Eng. A 2012, 552, 514–522. [Google Scholar] [CrossRef]
- Shintani, T.; Murata, Y. Evaluation of the dislocation density and dislocation character in cold rolled Type 304 steel determined by profile analysis of X-ray diffraction. Acta Mater. 2011, 59, 4314–4322. [Google Scholar] [CrossRef]
- Lebedev, A.A.; Kosarchuk, V.V. Influence of phase transformations on the mechanical properties of austenitic stainless steels. Int. J. Plast. 2000, 16, 749–767. [Google Scholar] [CrossRef]
- Olden, V.; Thaulow, C.; Johnsen, R. Modelling of hydrogen diffusion and hydrogen induced cracking in supermartensitic and duplex stainless steels. Mater. Des. 2008, 29, 1934–1948. [Google Scholar] [CrossRef]
- Crank, J. The Mathematics of Diffusion; Oxford University Press: Clarendon, UK, 1975; pp. 231–232. [Google Scholar]
- Zhu, W.Y.; Qiao, L.J.; Li, J.X.; Su, Y.J.; Yan, Y.; Bai, Y.; Ren, X.C.; Huang, H.Y. Hydrogen Embrittlement and Stress Corrosion Cracking; Science Press: Beijing, China, 2013; p. 124. [Google Scholar]
- Turnbull, A.; Hutchings, R.B. Analysis of hydrogen atom transport in a two-phase alloy. Mater. Sci. Eng. A 1994, 177, 161–171. [Google Scholar] [CrossRef]
- Walter, R.J.; Jewett, R.P.; Chandler, W.T. On the mechanism of hydrogen-environment embrittlement of iron- and nickel-base alloys. Mater. Sci. Eng. 1970, 5, 99–110. [Google Scholar] [CrossRef]
- West, A.J.; Louthan, M.R. Dislocation Transport and Hydrogen Embrittlement. Metall. Trans. A 1979, 10, 1675–1682. [Google Scholar] [CrossRef]
- Gesnouin, C.; Hazarabedian, A.; Bruzzoni, P.; Ovejero-García, J.; Bilmes, P.; Llorente, C. Effect of post-weld heat treatment on the microstructure and hydrogen permeation of 13CrNiMo steels. Corros. Sci. 2004, 46, 1633–1647. [Google Scholar] [CrossRef]
- Owczarek, E.; Zakroczymski, T. Hydrogen transport in a duplex stainless steel. Acta Mater. 2000, 48, 3059–3070. [Google Scholar] [CrossRef]
- Olden, V.; Saai, A.; Jemblie, L.; Johnsen, R. FE simulation of hydrogen diffusion in duplex stainless steel. Int. J. Hydrogen Energy 2014, 39, 1156–1163. [Google Scholar] [CrossRef]
- Oriani, R.A. The diffusion and trapping of hydrogen in steel. Acta Metall. 1970, 18, 147–157. [Google Scholar] [CrossRef]
- Thomas, G.J. Hydrogen trapping in fcc metals. In Proceedings of the Conference of Hydrogen Effects in Metals, Jackson Lake Lodge, WY, USA, 26–31 August 1980; pp. 77–85. [Google Scholar]
- Hagi, H.; Hayashi, Y. Effects of interstitial impurities on dislocation trapping on hydrogen in iron. Trans. Jpn. Inst. Met. 1987, 28, 375–382. [Google Scholar] [CrossRef]
- Hutchings, R.B.; Turnbull, A.; May, A.T. Measurement of hydrogen transport in a duplex stainless steel. Scr. Metall. Mater. 1991, 25, 2657–2662. [Google Scholar] [CrossRef]
- Sentence, P. Hydrogen embrittlement of cold worked duplex stainless steel oilfield tubulars. In Proceedings of the Conference of Duplex Stainless Steel 91, Beaune, France, 28–30 October 1991; Volume 2, pp. 895–903. [Google Scholar]
- Alsarraf, J. Hydrogen Embrittlement Susceptibility of Super Duplex Stainless Steels. Ph.D Thesis, Cranfield University, Bedfordshire, UK, 2010. [Google Scholar]
- Wang, X.G.; Dumortier, D.; Riquier, Y. Structural evolution of zeron 100 duplex stainless steel between 550 nd 1100 °C. In Proceedings of the Conference of Duplex Stainless Steel 91, Beaune, France, 28–30 October 1991; Volume 1, pp. 127–134. [Google Scholar]
- Chen, S.S.; Wu, T.I.; Wu, J.K. Effects of deformation on hydrogen degradation in a duplex stainless steel. J. Mater. Sci. 2004, 39, 67–71. [Google Scholar] [CrossRef]
- da Silva, B.R.S.; Salvio, F.; dos Santos, D.S. Hydrogen embrittlement in super duplex stainless steel tubes UNS S32750 under mechanical stress. In Proceedings of the 2012 International Hydrogen Conference on Hydrogen-Materials Interactions, Jackson Lack Lodge, WY, USA, 9–12 September 2012; pp. 245–254. [Google Scholar]
- He, J.; Tang, X.; Chen, N. Diffusion of hydrogen in (α + γ) duplex stainless steel. Acta Metall. Sin. 1989, 25, 42–47. [Google Scholar]
- Chou, S.L.; Tsai, W.T. Effect of grain size on the hydrogen-assisted cracking in duplex stainless steels. Mater. Sci. Eng. A 1999, 270, 219–224. [Google Scholar] [CrossRef]
- Smirnova, A.; Johnsen, R. Effect of Tensile Stress on Hydrogen Permeation in 13% Cr Super Martensitic Stainless Steel. Available online: https://brage.bibsys.no/xmlui/bitstream/handle/11250/248888/506367_FULLTEXT01.pdf?sequence=1 (accessed on 8 June 2018).
- Hinds, G.; Zhao, J.; Griffiths, A.J.; Turnbull, A. Hydrogen diffusion in Super 13% chromium martensitic stainless steel. Corrosion 2005, 61, 348–354. [Google Scholar] [CrossRef]
- Luu, W.C.; Liu, P.W.; Wu, J.K. Hydrogen transport and degradation of a commercial duplex stainless steel. Corros. Sci. 2002, 44, 1783–1791. [Google Scholar] [CrossRef]
- Turnbull, A.; Beylegaard, E.L.; Hutchings, R.B. Hydrogen transport in SAF 2205 and SAF 2507 duplex stainless steels. In Proceedings of the Conference of Hydrogen Transport and Cracking in Metals, Cambridge, UK, 13–14 April 1994; pp. 268–279. [Google Scholar]
- Dayal, R.K.; Grabke, H.K. Dependence of the hydrogen permeation in stainless steel on carbon content, heat treatment and cold work. Steel Res. 2000, 71, 255–260. [Google Scholar] [CrossRef]
- Iacoviello, F.; Habashi, M.; Cavallini, M. Hydrogen embrittlement in the duplex stainless steel Z2CND2205 hydrogen-charged at 200 °C. Mater. Sci. Eng. A 1997, 224, 116–124. [Google Scholar] [CrossRef]
- Iacoviello, F.; Galland, J.; Habashi, M. A thermal outgassing method (T.O.M.) to measure the hydrogen diffusion coefficients in austenitic, austeno-ferritic and ferritic-perlitic steels. Corros. Sci. 1998, 40, 1281–1293. [Google Scholar] [CrossRef]
- Bernabai, U.; Torella, R. Thermal analysis of hydrogen-charged austenitic and duplex stainless steels. Int. J. Hydrogen Energy 1993, 18, 763–771. [Google Scholar] [CrossRef]
- Hsu, J.W.; Tsai, S.Y.; Shih, H.C. Hydrogen Embrittlement of SAF 2205 Duplex Stainless Steel. Corrosion 2002, 58, 858–862. [Google Scholar] [CrossRef]
- Mente, T.; Boellinghaus, T. Modeling of hydrogen distribution in a duplex stainless steel. Weld. World 2012, 56, 66–78. [Google Scholar] [CrossRef]
- Paul, S.K. Micromechanics based modeling of dual phase steels: Prediction of ductility and failure modes. Comput. Mater. Sci. 2012, 56, 34–42. [Google Scholar] [CrossRef]
- Sun, C.T.; Vaidya, R.S. Prediction of composite properties from a representative volume element. Compos. Sci. Technol. 1996, 56, 171–179. [Google Scholar] [CrossRef]
© 2018 by the authors. Licensee MDPI, Basel, Switzerland. This article is an open access article distributed under the terms and conditions of the Creative Commons Attribution (CC BY) license (http://creativecommons.org/licenses/by/4.0/).