Article

Experimental Study of Surface Characteristic in Electrochemical Machining of 35CrMo Steel

College of Mechanical and Transportation Engineering, China University of Petroleum-Beijing, Beijing 102249, China
*
Author to whom correspondence should be addressed.
Metals 2018, 8(7), 509; https://doi.org/10.3390/met8070509
Submission received: 27 May 2018 / Revised: 21 June 2018 / Accepted: 28 June 2018 / Published: 3 July 2018

Abstract

:
35CrMo steel is a widely used material in machinery equipment for the petroleum industry. With the improvement of exploring technology, some particular complex features cannot be achieved with traditional processing methods. However, electrochemical machining provides a potential solution to such problems, especially in the machining of the turbine blades of turbine drilling tools, in which the surface behavior of the workpiece is an important basis for judging the machining effect. To investigate the surface behavior of 35CrMo after electrochemical machining, the electrochemical machining experiment of 35CrMo steel was conducted by a self-made experimental system. Effects of the electrolyte type, concentration, and current density on surface quality were investigated in this study. The surface characteristics of 35CrMo steel were analyzed under different current densities in three different electrolytes—NaCl, NaClO3 and NaNO3—with different concentrations. Based on the obtained results, an optimum machining plan was obtained. The principle of the electrolysis reaction of 35CrMo steel in NaCl, NaClO3 and NaNO3 electrolytes were studied as well. Experimental results showed that the best surface quality of 35CrMo steel was achieved under an NaClO3 electrolyte concentration of 200 g/L and current density of 30 A/cm2. The results in this paper provide a theoretical basis for the effective machining of complex parts such as downhole turbine blades.

Graphical Abstract

1. Introduction

With the development of the petroleum industry towards the direction of deep wells, ultra-deep wells and complex hydrocarbon reservoirs exploration, various petroleum equipment and drilling technologies have been continuously improved, and higher demands have been placed on the materials for the drilling equipment [1]. Due to the high static strength, 35CrMo steels are widely used in the important structural parts subjected to high loads and in petroleum machinery [2,3,4,5,6] subjected to bending, torsion, impact and vibration, such as perforators, gas lift valves and turbine blades, etc. With the increasing improvement of application requirements, the machining of workpieces has become more complex [7,8,9]. The traditional methods cannot adapt to the machining of all complex parts. However, because of the unique machining method, electrochemical machining is a good solution for some problems which traditional machining finds difficult to solve [10,11]. It can mold at one time and make workpieces free of internal stress. It is easy to process complex molding surfaces and holes. Especially for turbine blade machining for turbine drilling tools, electrochemical machining has great potential.
Electrochemical machining has the unique advantage of quickly machining some difficult-to-cut materials and complex surfaces through the principle of electrochemical dissolution. The electrochemical machining of steel has been widely investigated by scholars and industry experts around the world [12,13]. In recent years, Ayyappan and Sivakumar [14,15,16] studied the electrochemical machining characteristics of 20MnCr5 alloy steel in aqueous sodium chloride (NaCl) and potassium dichromate (K2Cr2O7) mixed aqueous NaCl, to optimize the operating conditions. Britto and Lenin [17] established the effect of process parameters such as voltage, current and concentration of electrolyte on the material removal rate for AISI 202 steel during the electrochemical machining process to determine the optimum machining parameters. Kirchner et al. [18] enabled the fabrication of three-dimensional microelements from stainless steel using the electrochemical pulse technique. Kumar et al. [19] investigated the effect of process parameters on surface roughness characteristic in electrochemical machining of EN31 tool steel using grey relation analysis. Klocke et al. [20] presents a model for the prediction of microstructure evolution regarding the influence of on the surface topography for the 42CrMo4 steel during electrochemical machining. The effectiveness of surface characteristics for the design and analysis of experiments has been proven in many research works [21,22,23,24,25,26]. However, studies on the electrochemical machining of 35CrMo steel is rarely reported in the literature.
Surface characteristics is an important basis for evaluating the processing effect [27]. In this research, the surface characteristics of 35CrMo steel specimen under different electrolyte environments, electrolyte concentrations and current densities were studied by using a self-made ECM (electrochemical machining) experimental system to evaluate the electrochemical machining quality of a simple 35CrMo steel workpiece, which would be used for processing the turbine blades of the turbodrill tools, in terms of the surface characteristics.

2. Experimental

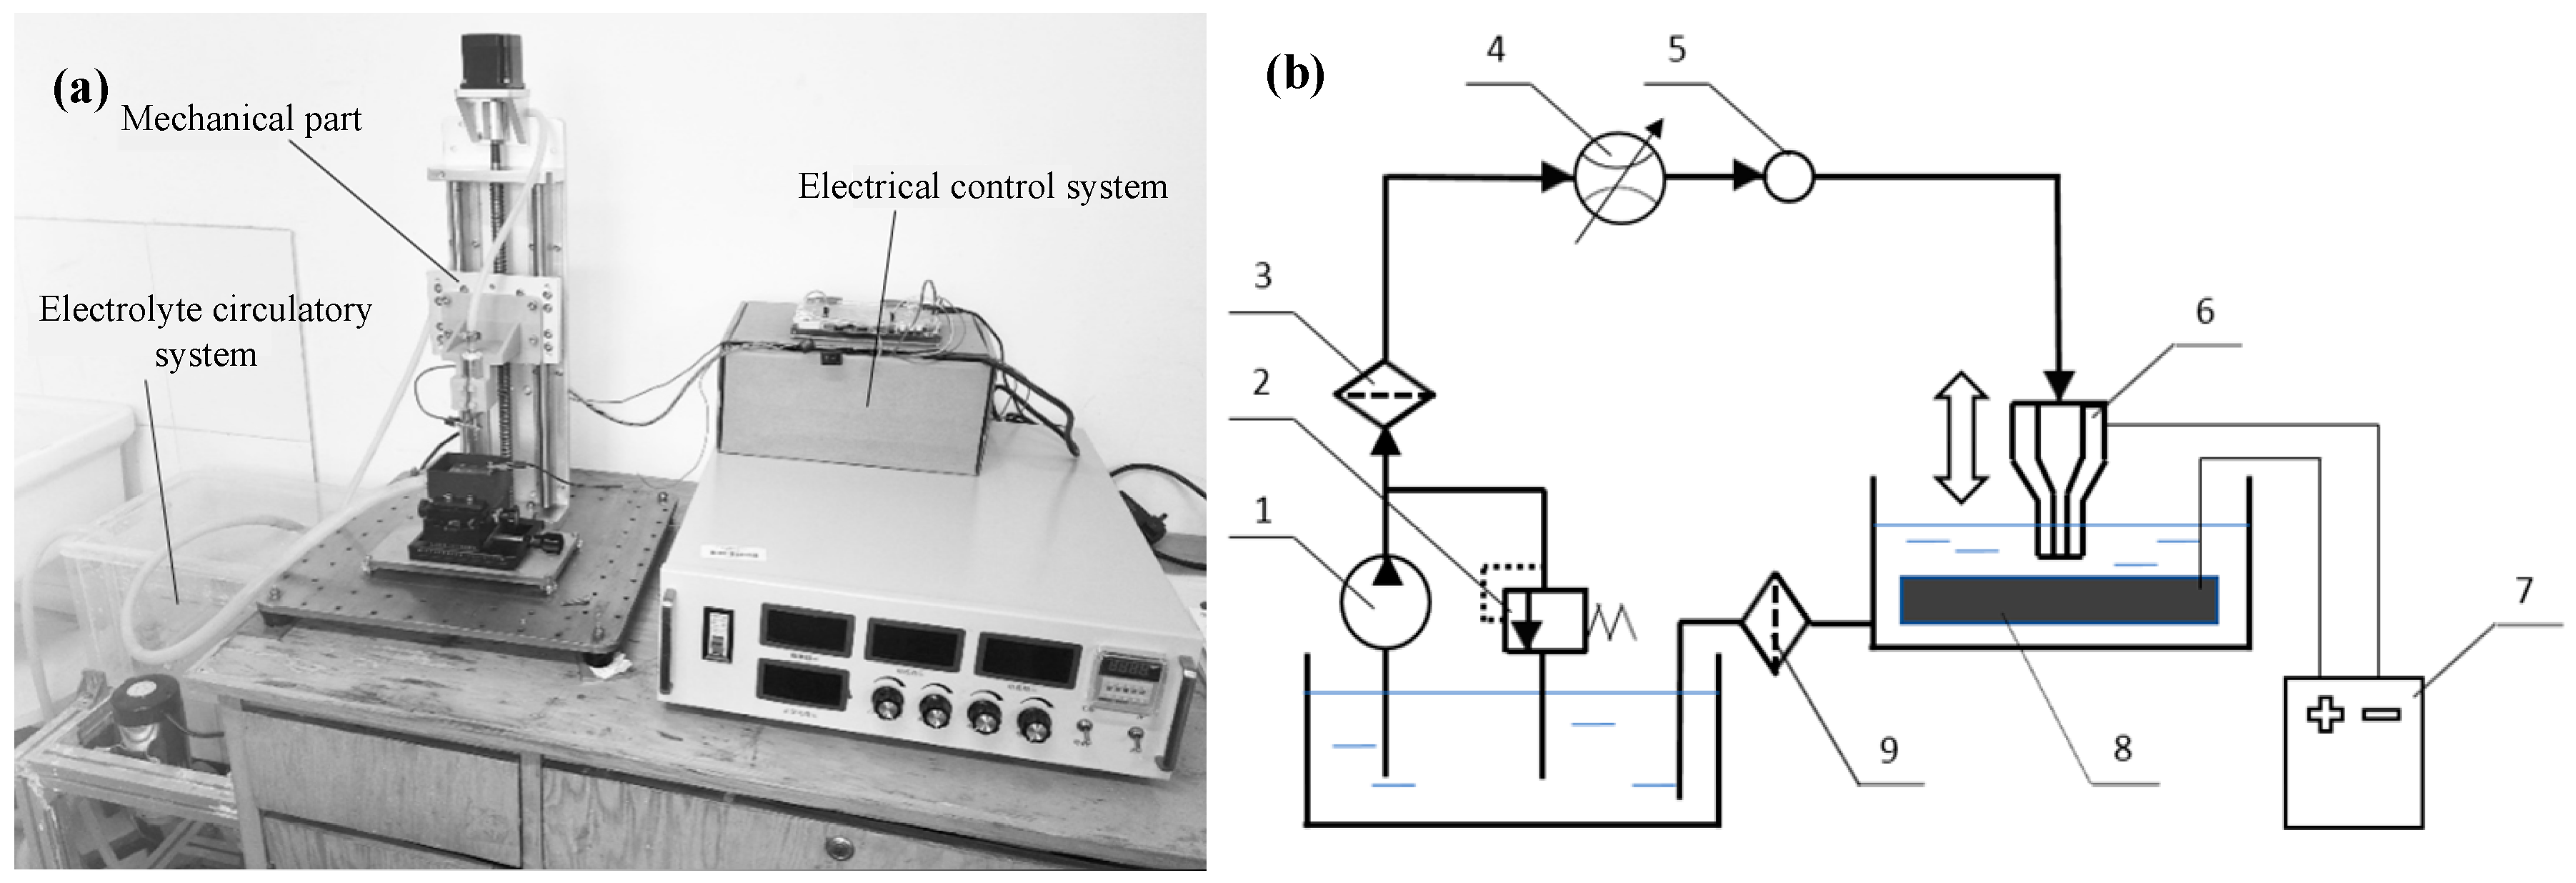
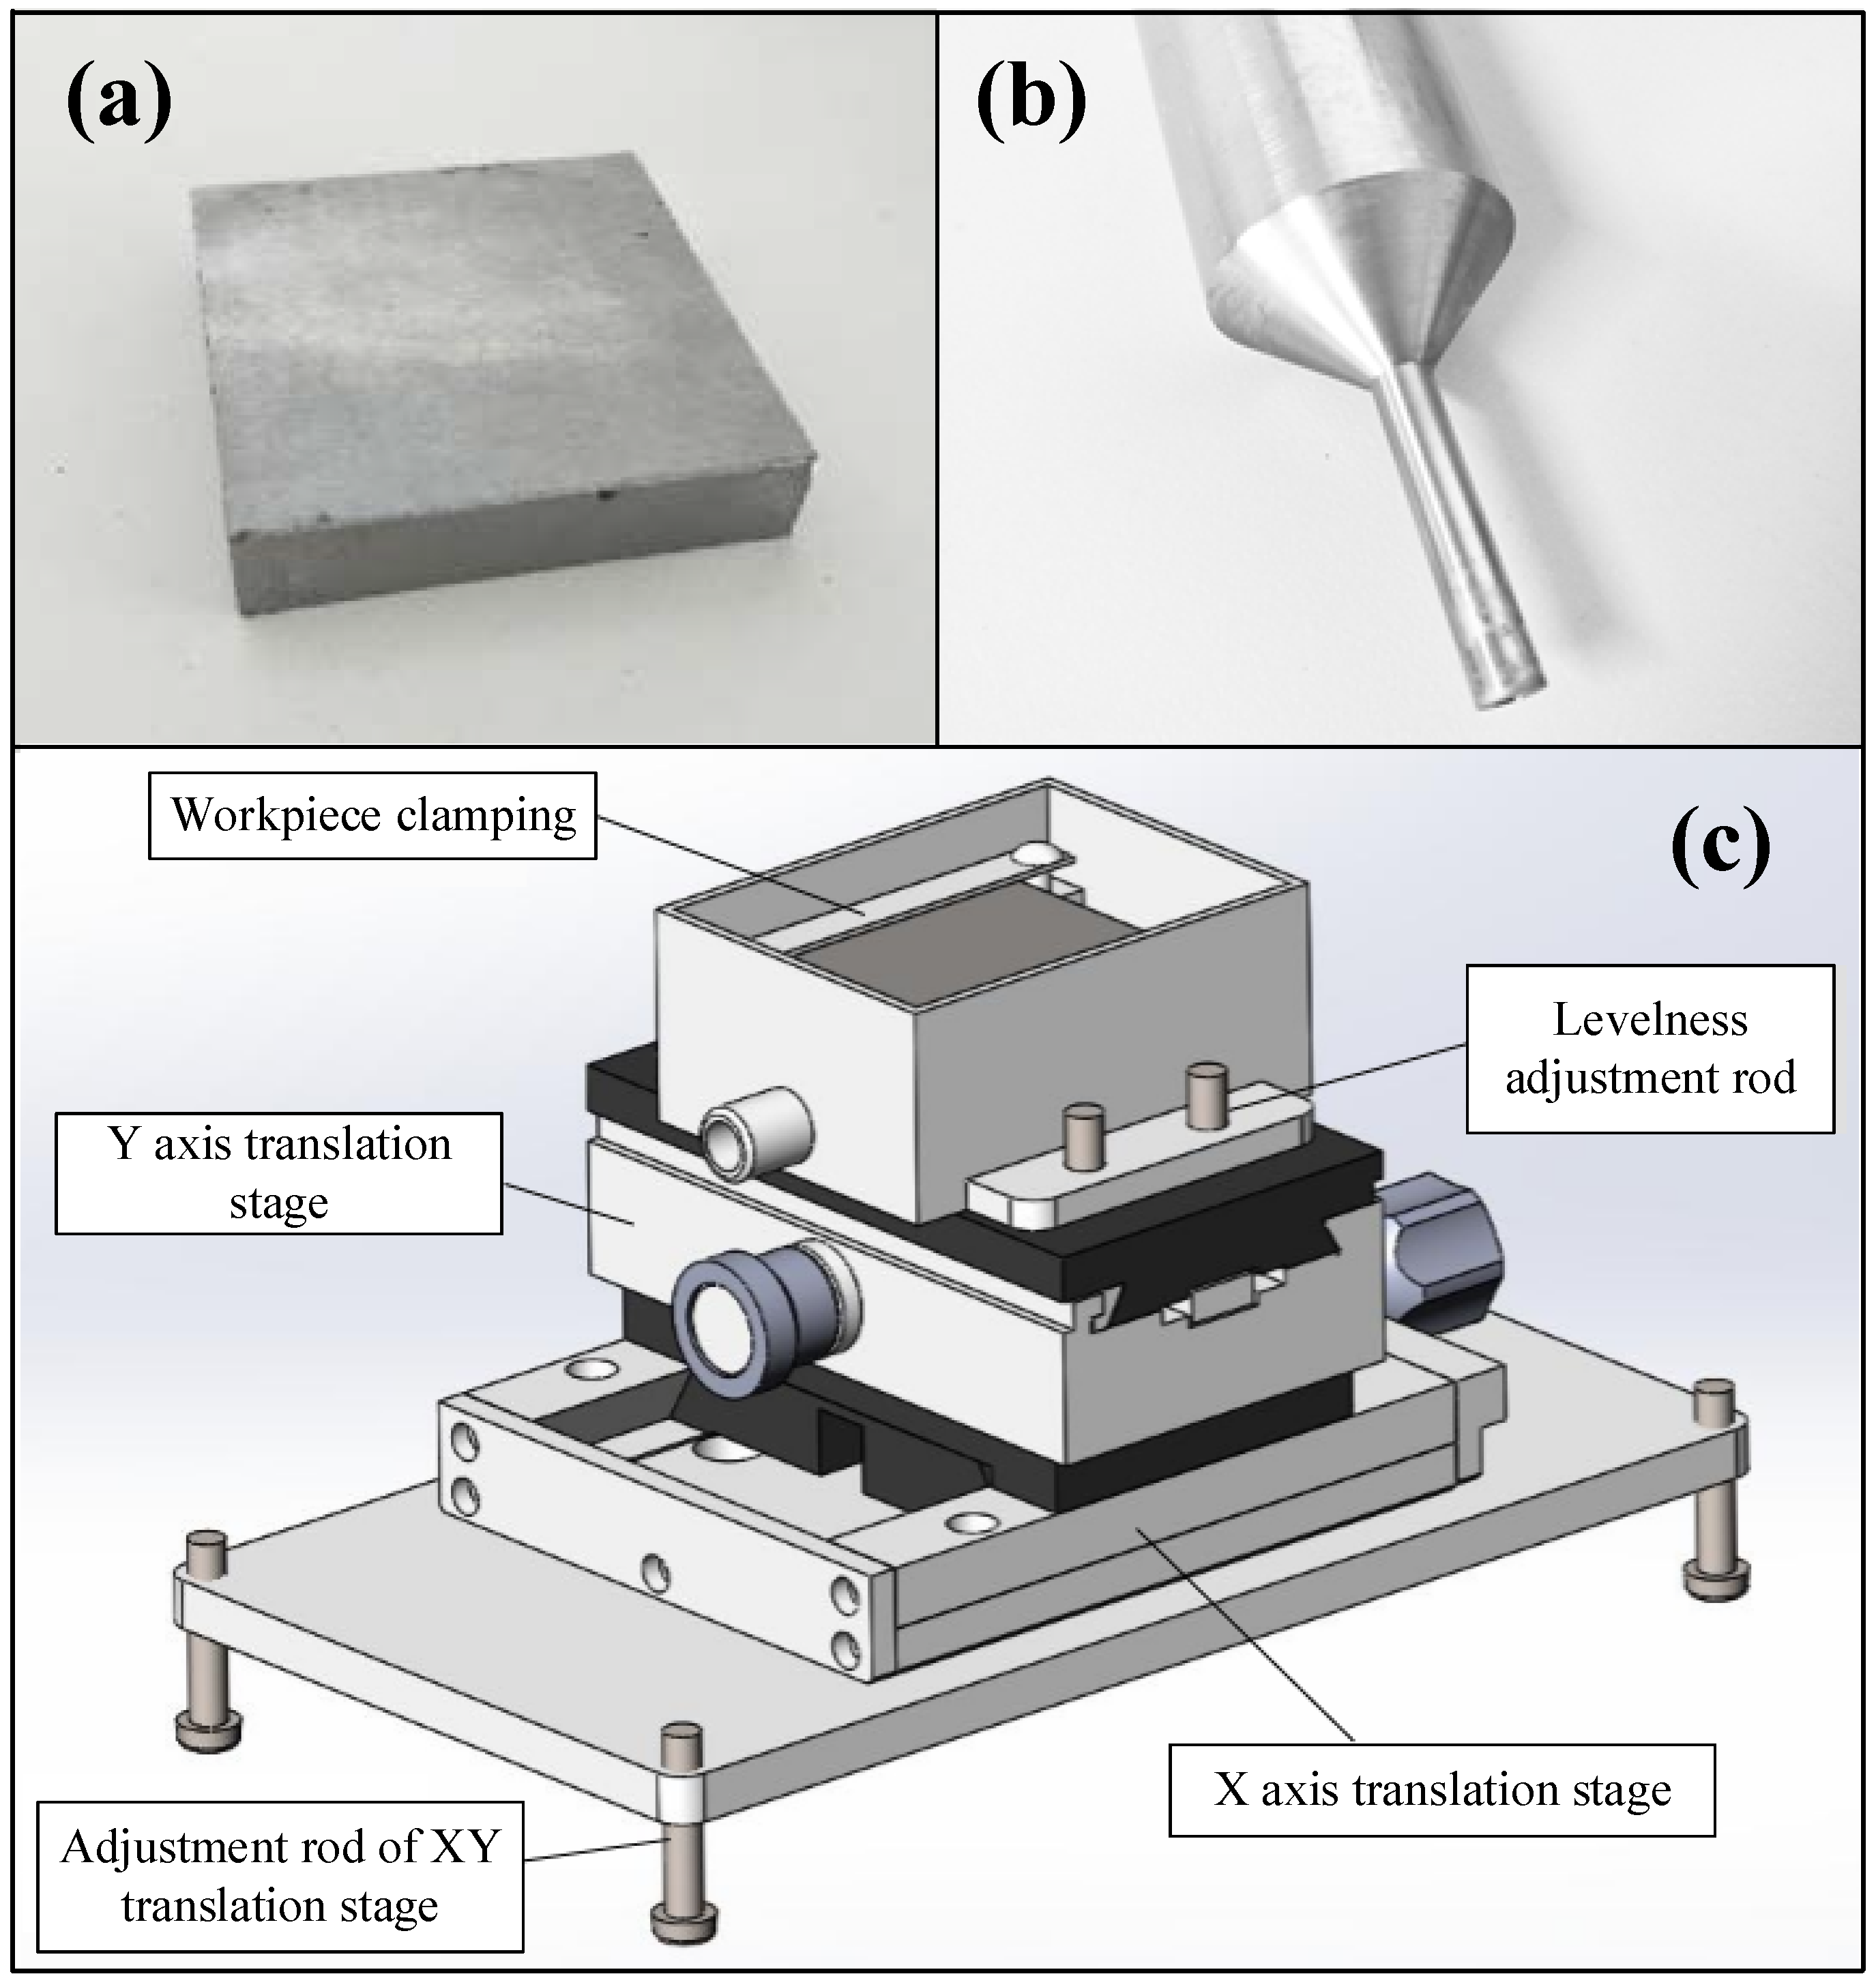
2.1. Experimental System and Materials

The major components of the experimental system included tool electrodes, mechanical structure, the control system and the circulatory system of electrolyte, as shown in Figure 1.
The 35CrMo steel blocks selected for the experiment were machined to a hardness of 290–320 HB according to the downhole turbine material requirements. The dimension of every sample was 50 mm × 50 mm, as shown in Figure 2a. The surface roughness of the plan to be machined was 3.2 μm. Each parameter of the cathode directly affected the dimensional accuracy and machining quality of the workpiece. As shown in Figure 2b, the entire cathode was made of stainless steel in the experiment to prevent corrosion caused by prolonged contact with the electrolyte during processing. The electrode adopted a tubular structure with an outer diameter of 5 mm and an inner diameter of 3 mm. The outer surface of the outlet was insulated with epoxy resin. The end surface was used as a machining surface and was polished to a surface roughness of 0.8 μm or less before use. Before the start of the experiment, it should be ensured that the tool can machine multiple samples at one time. Meanwhile, the workpiece was corrected before tool setting to ensure that the surface quality of the workpiece did not change greatly caused by repeated tool setting.
The tool electrode in this experiment was tubular electrode structure. The end face to be machined was a ring structure, as shown in Figure 2b. In order to make the flow field uniform in each part, the runoff method was adopted to ensure the flow rate of liquid and pressure were the same at the points with the same radius from the center. This experiment did not require a smaller machining gap under high speeds, and the distance between the outer circle (R0) and the inner circle (Rm) was 1 mm, which was small. Consequently, the forward runoff method was selected. By controlling the flow rate of electrolyte, it could be ensured that the processing area would not generate a hole. In the experiment, the immersion method was used for the machining, that is, the workpiece was completely immersed in the electrolyte so that a certain back pressure is generated at the outlet of the electrolyte, and the outside air is prevented from entering the processing gap. The flow field in the gap could keep uniform and stable by reasonable control of the flow rate of electrolyte.
The main components of the electrochemical machining fixture were fixture of the tool electrode and the fixture used to installation workpiece. The relative position of the cathode and anode, the distribution of the electric field and the flow of the electrolyte were determined by the operating method of fixture. The fixture used for the installation piece is shown in Figure 2c. In order to ensure the levelness of the workpiece’s surface and the verticality between the tool electrode and workpiece after the installation, a four-point level adjustment method was adopted to adjust the level of the top surface of the platform. The height of each position on the upper surface of the workpiece was kept the same when the workpiece was moved by the translation stage in the XY direction, so as to ensure the relative position between tool cathode and workpiece.

2.2. Machining Parameters

The machining parameters in this experiment mainly included the type of power supply, voltage, type and concentration of electrolyte, machining gap, machining time, and current density in the electrochemical machining. A pulsed DC power (Provided by Soyipower, Shanghai, China) supply with a maximum pulse frequency of 30 kHz was employed. The duty cycle was continuously adjustable from 0 to 100%. The voltage had a range of 0–30 V and the current had a range of 0–10 A. Three common electrolytes, NaCl, NaClO3 and NaNO3, were selected to prepare for electrolytic solution. The saturation solubility of NaCl at room temperature was 360 g/L. The concentrations of the NaCl solution of 50 g/L, 100 g/L, 150 g/L, 200 g/L were introduced respectively in this experiment. The saturation solubility of NaClO3 and NaNO3 at room temperature were 959 g/L and 870 g/L respectively. Because the stray corrosion occurred easily in the high concentration during machining and was hard to control, the concentration of NaClO3 and NaNO3 were all 100 g/L, 200 g/L, 300 g/L and 400 g/L.
The initial machining gap was 0.2 mm and the machining area was 0.125 cm2. The current density was set to 10 A/cm2, 20 A/cm2, 30 A/cm2, 40 A/cm2, 50 A/cm2 respectively. Total charges through machining area in one experiment was 75 C. So, the machining current assigned to each experiment was 1.25 A, 2.50 A, 3.75 A, 5.00 A and 6.25 A, respectively, and the corresponding machining time was 60 s, 30 s, 20 s, 15 s and 12 s, respectively.

2.3. Experimental Processes

The operation during the experiment directly affects the final surface quality of the workpiece. In order to ensure that the experiments are not subject to the additional influence of non-critical factors, the consistency of each experimental step must be controlled. The operation during this experiment was as follows:
(1) Appropriate amount of electrolyte was weighted and mixed with water to become electrolytic solution with required concentration, and then put them into the electrolyzer;
(2) The samples were cleaned by the pickling oil firstly, and then dried for later experiment after 10 min ultrasonic cleaning by using anhydrous alcohol;
(3) The workpiece was installed. The safety resistor was setup. The initial distance between electrode and workpiece was fixed at 0.2 mm by using short circuit tool setting under the voltage of 2 V;
(4) Then the electrolyte circulation system was started. After the circulation was stabilized, the current parameter for machining and timing were setup. Finally, the power supply was turned on and the machining experiment started.
During the experiment, experiments under different conditions were performed three times, and the annular groove with the best machining effect was taken as the final machining effect of the experiment. After machining, the surface was cleaned with pickling oil and then put into anhydrous alcohol to clean for 5 min before observation.

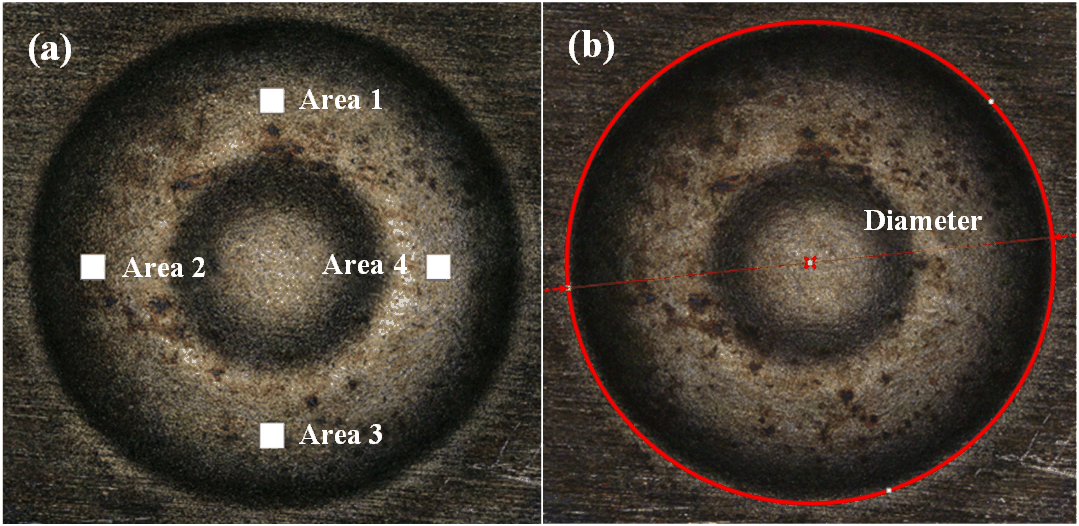
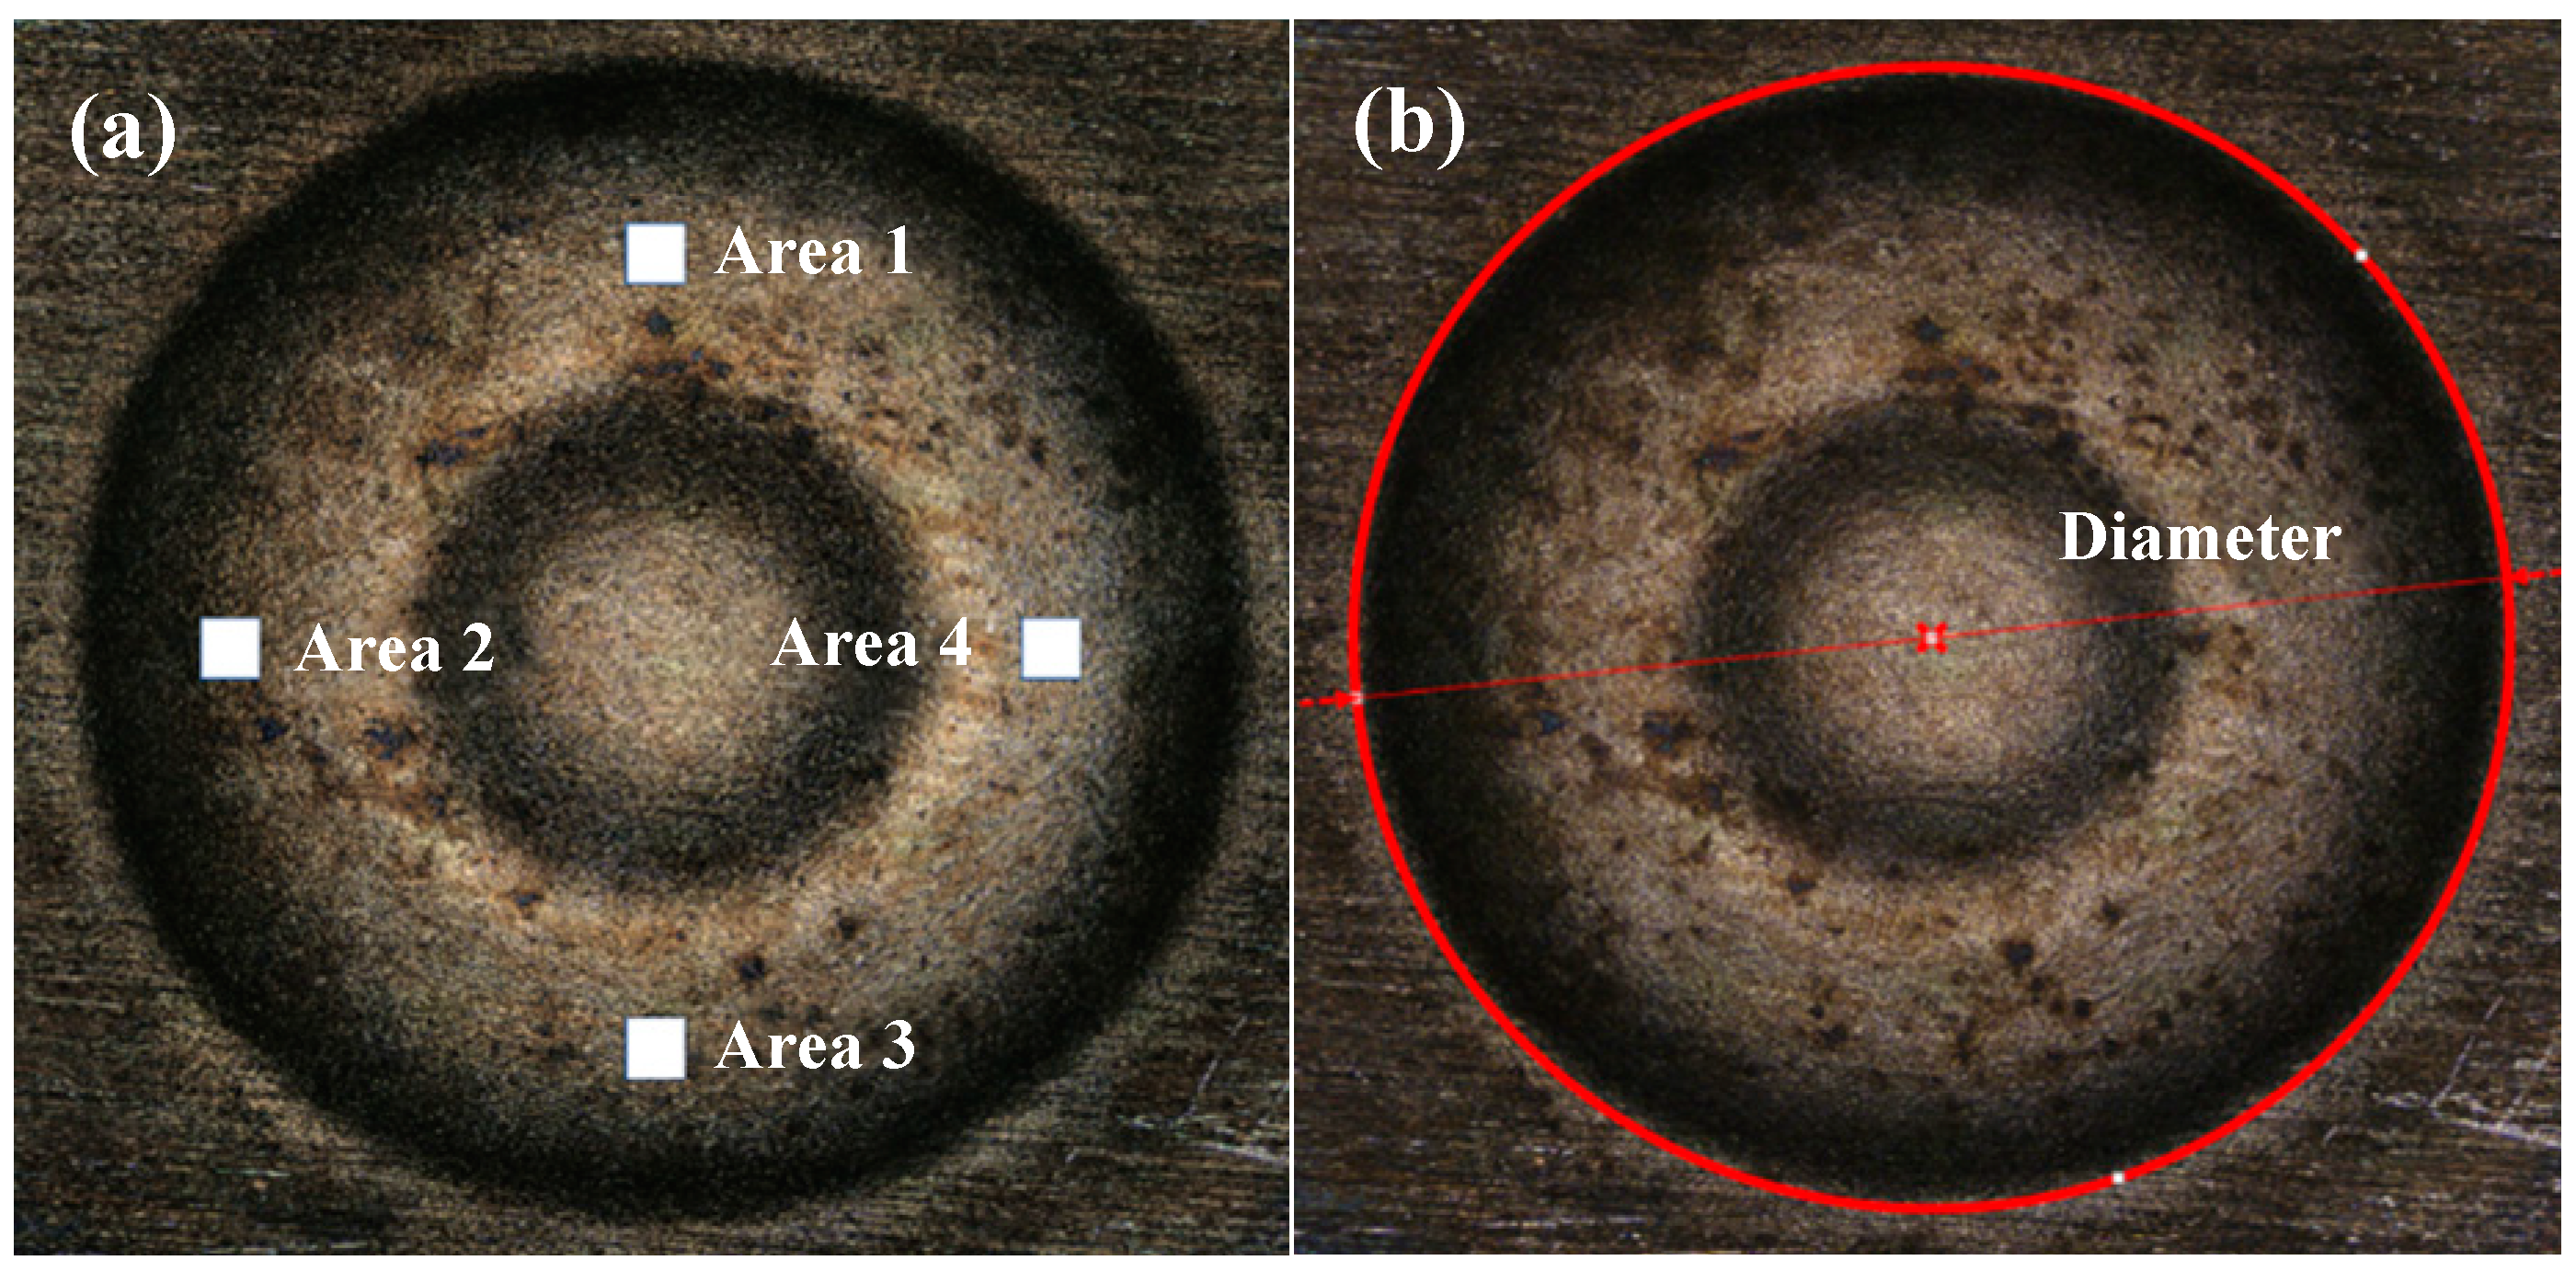
2.4. Result Characterization

A similar annular shallow groove was formed on the surface of 35CrMo steel after machining by annular electrode. The roughness of bottom surface of annular shallow groove was used to judge the machining quality. The diameter of the excircle was used to calculate the shape precision after machining.
The surface roughness of the workpieces was measured by KEYENCE VK-X 3D laser scanning microscope (produced by Keyence, Japan) according to ISO standards. Four uniformly distributed areas of 1 mm2 in groove were selected. Four points with different position were selected in each area, as shown in Figure 3a. After eliminating the excessive machining error, the average value of measurements was calculated and was treated as the surface roughness of this machining. The accuracy of cylindrical was measured with the shape measuring tool, the profilometer, and the mean of three times measurement of the excircle was calculated, as shown in Figure 3b.

3. Electrochemical Machining Experiment and Analysis in NaCl Electrolyte

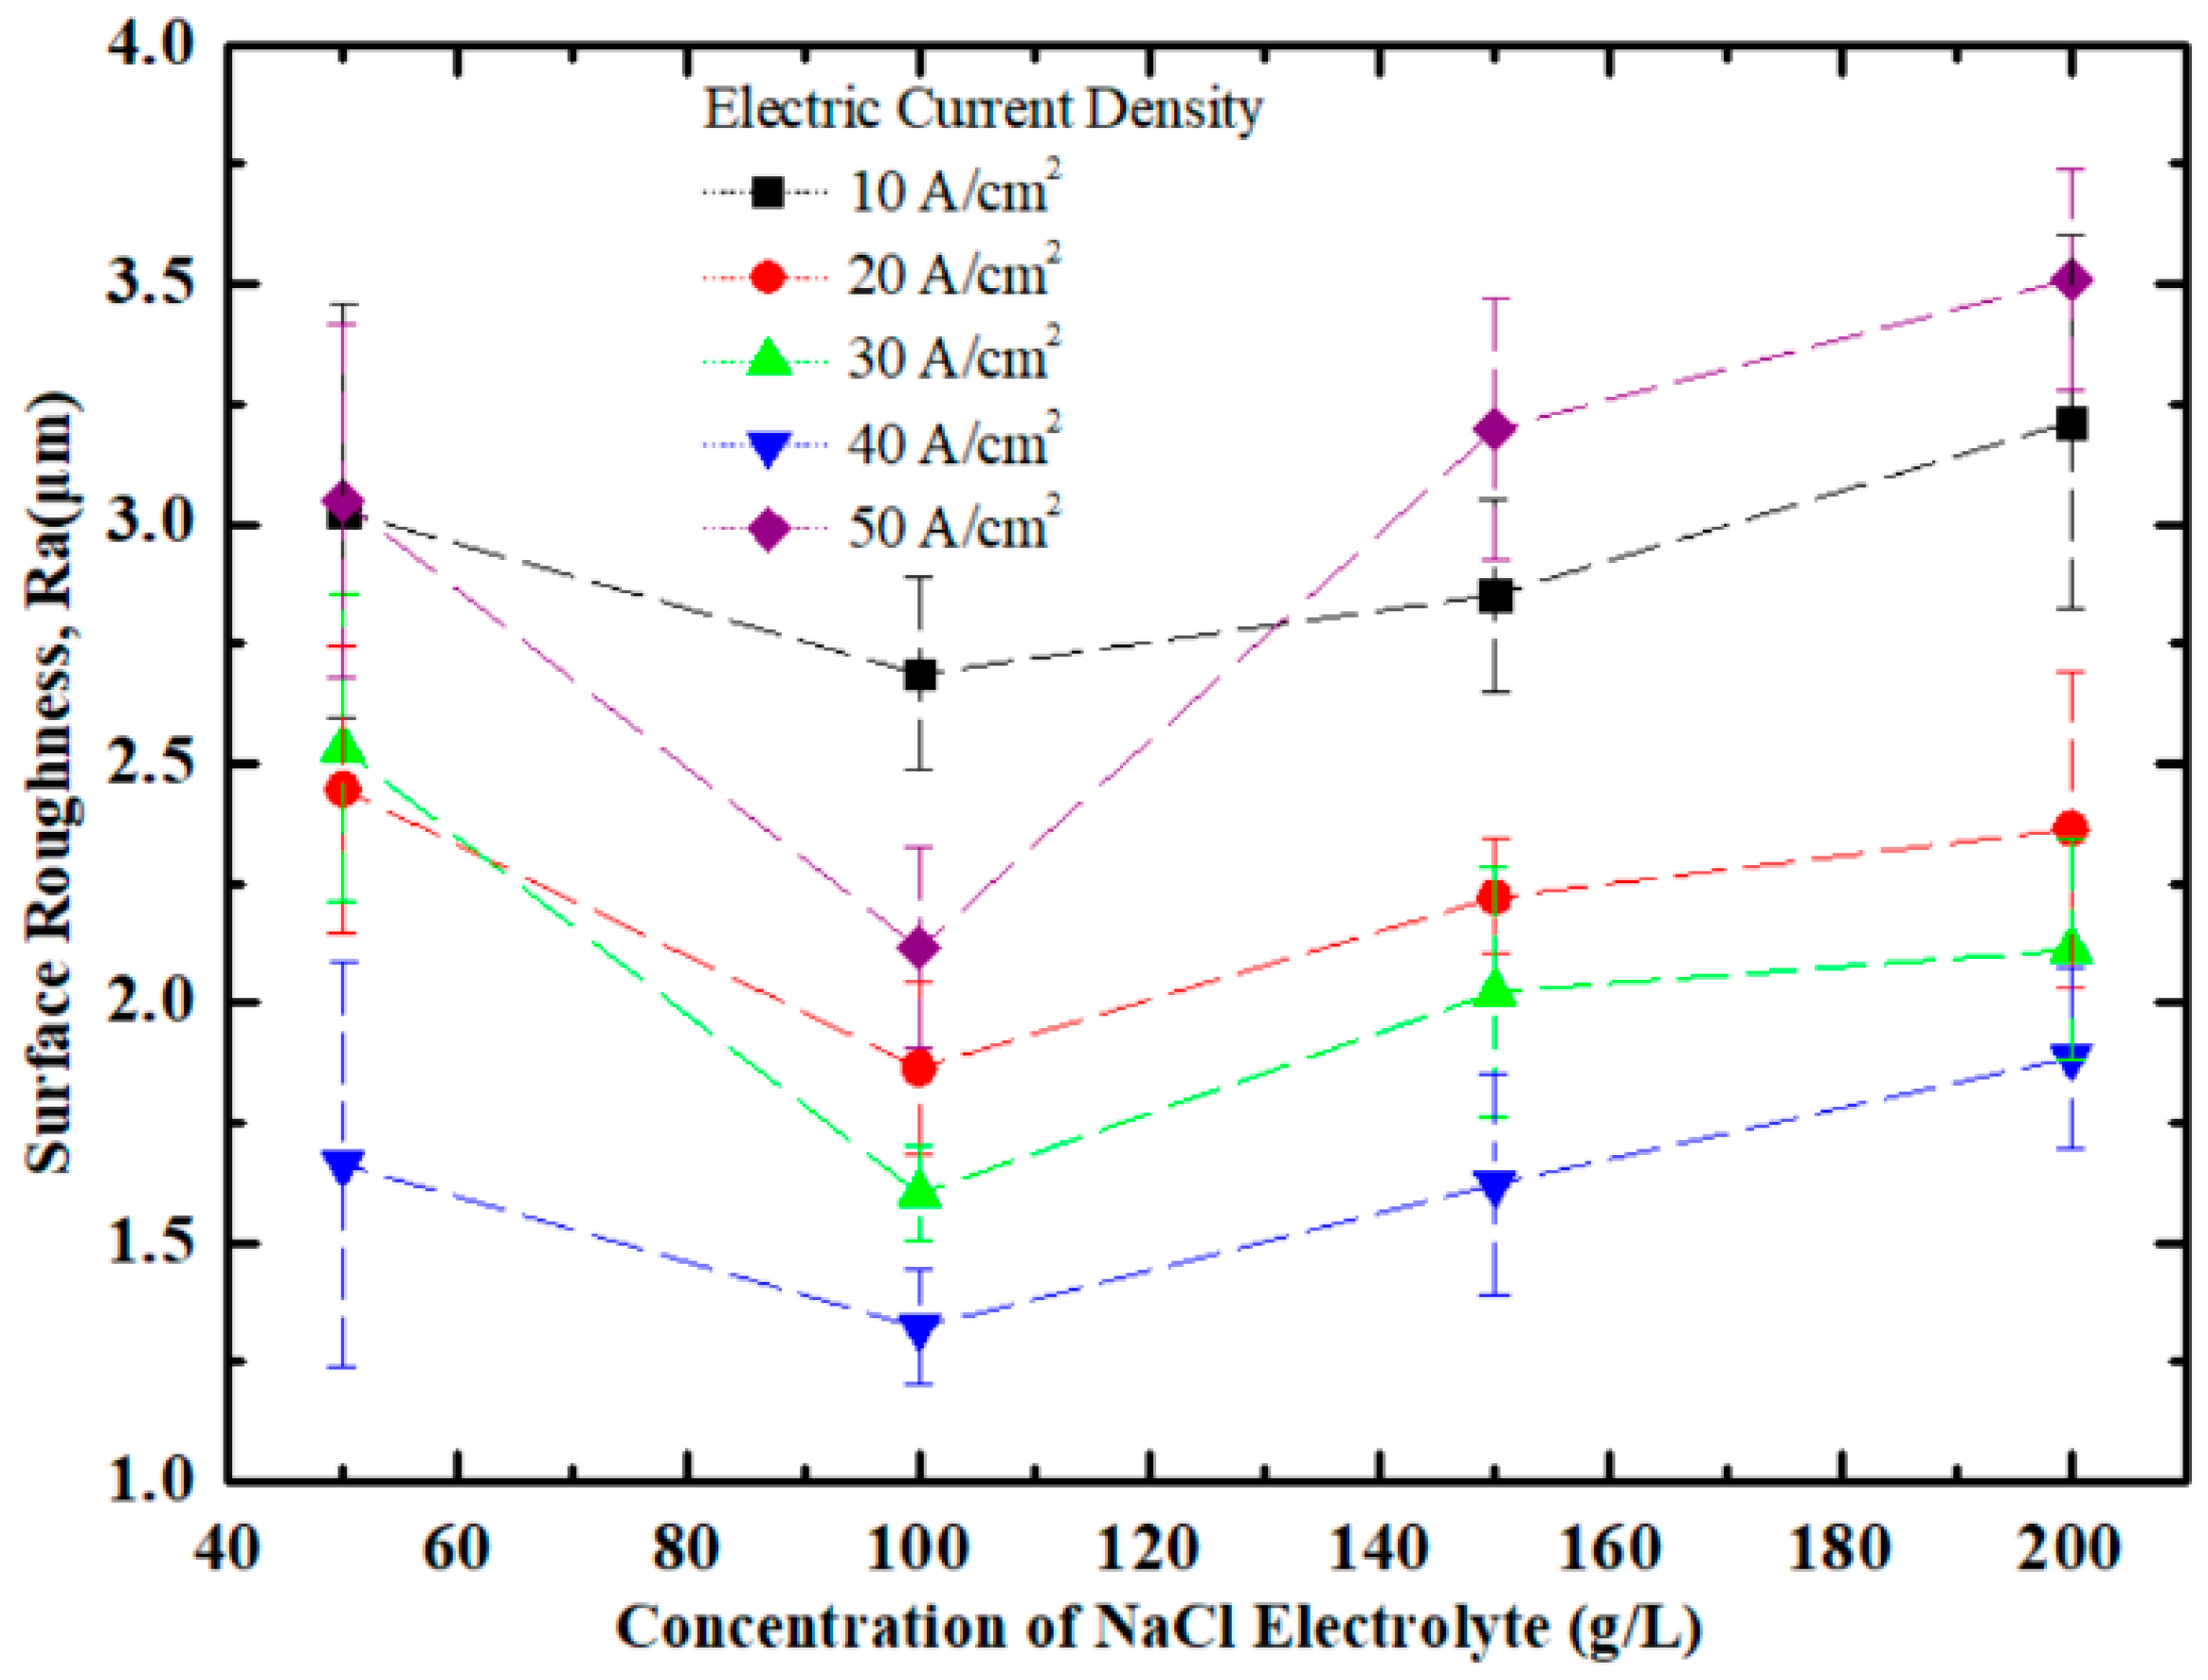
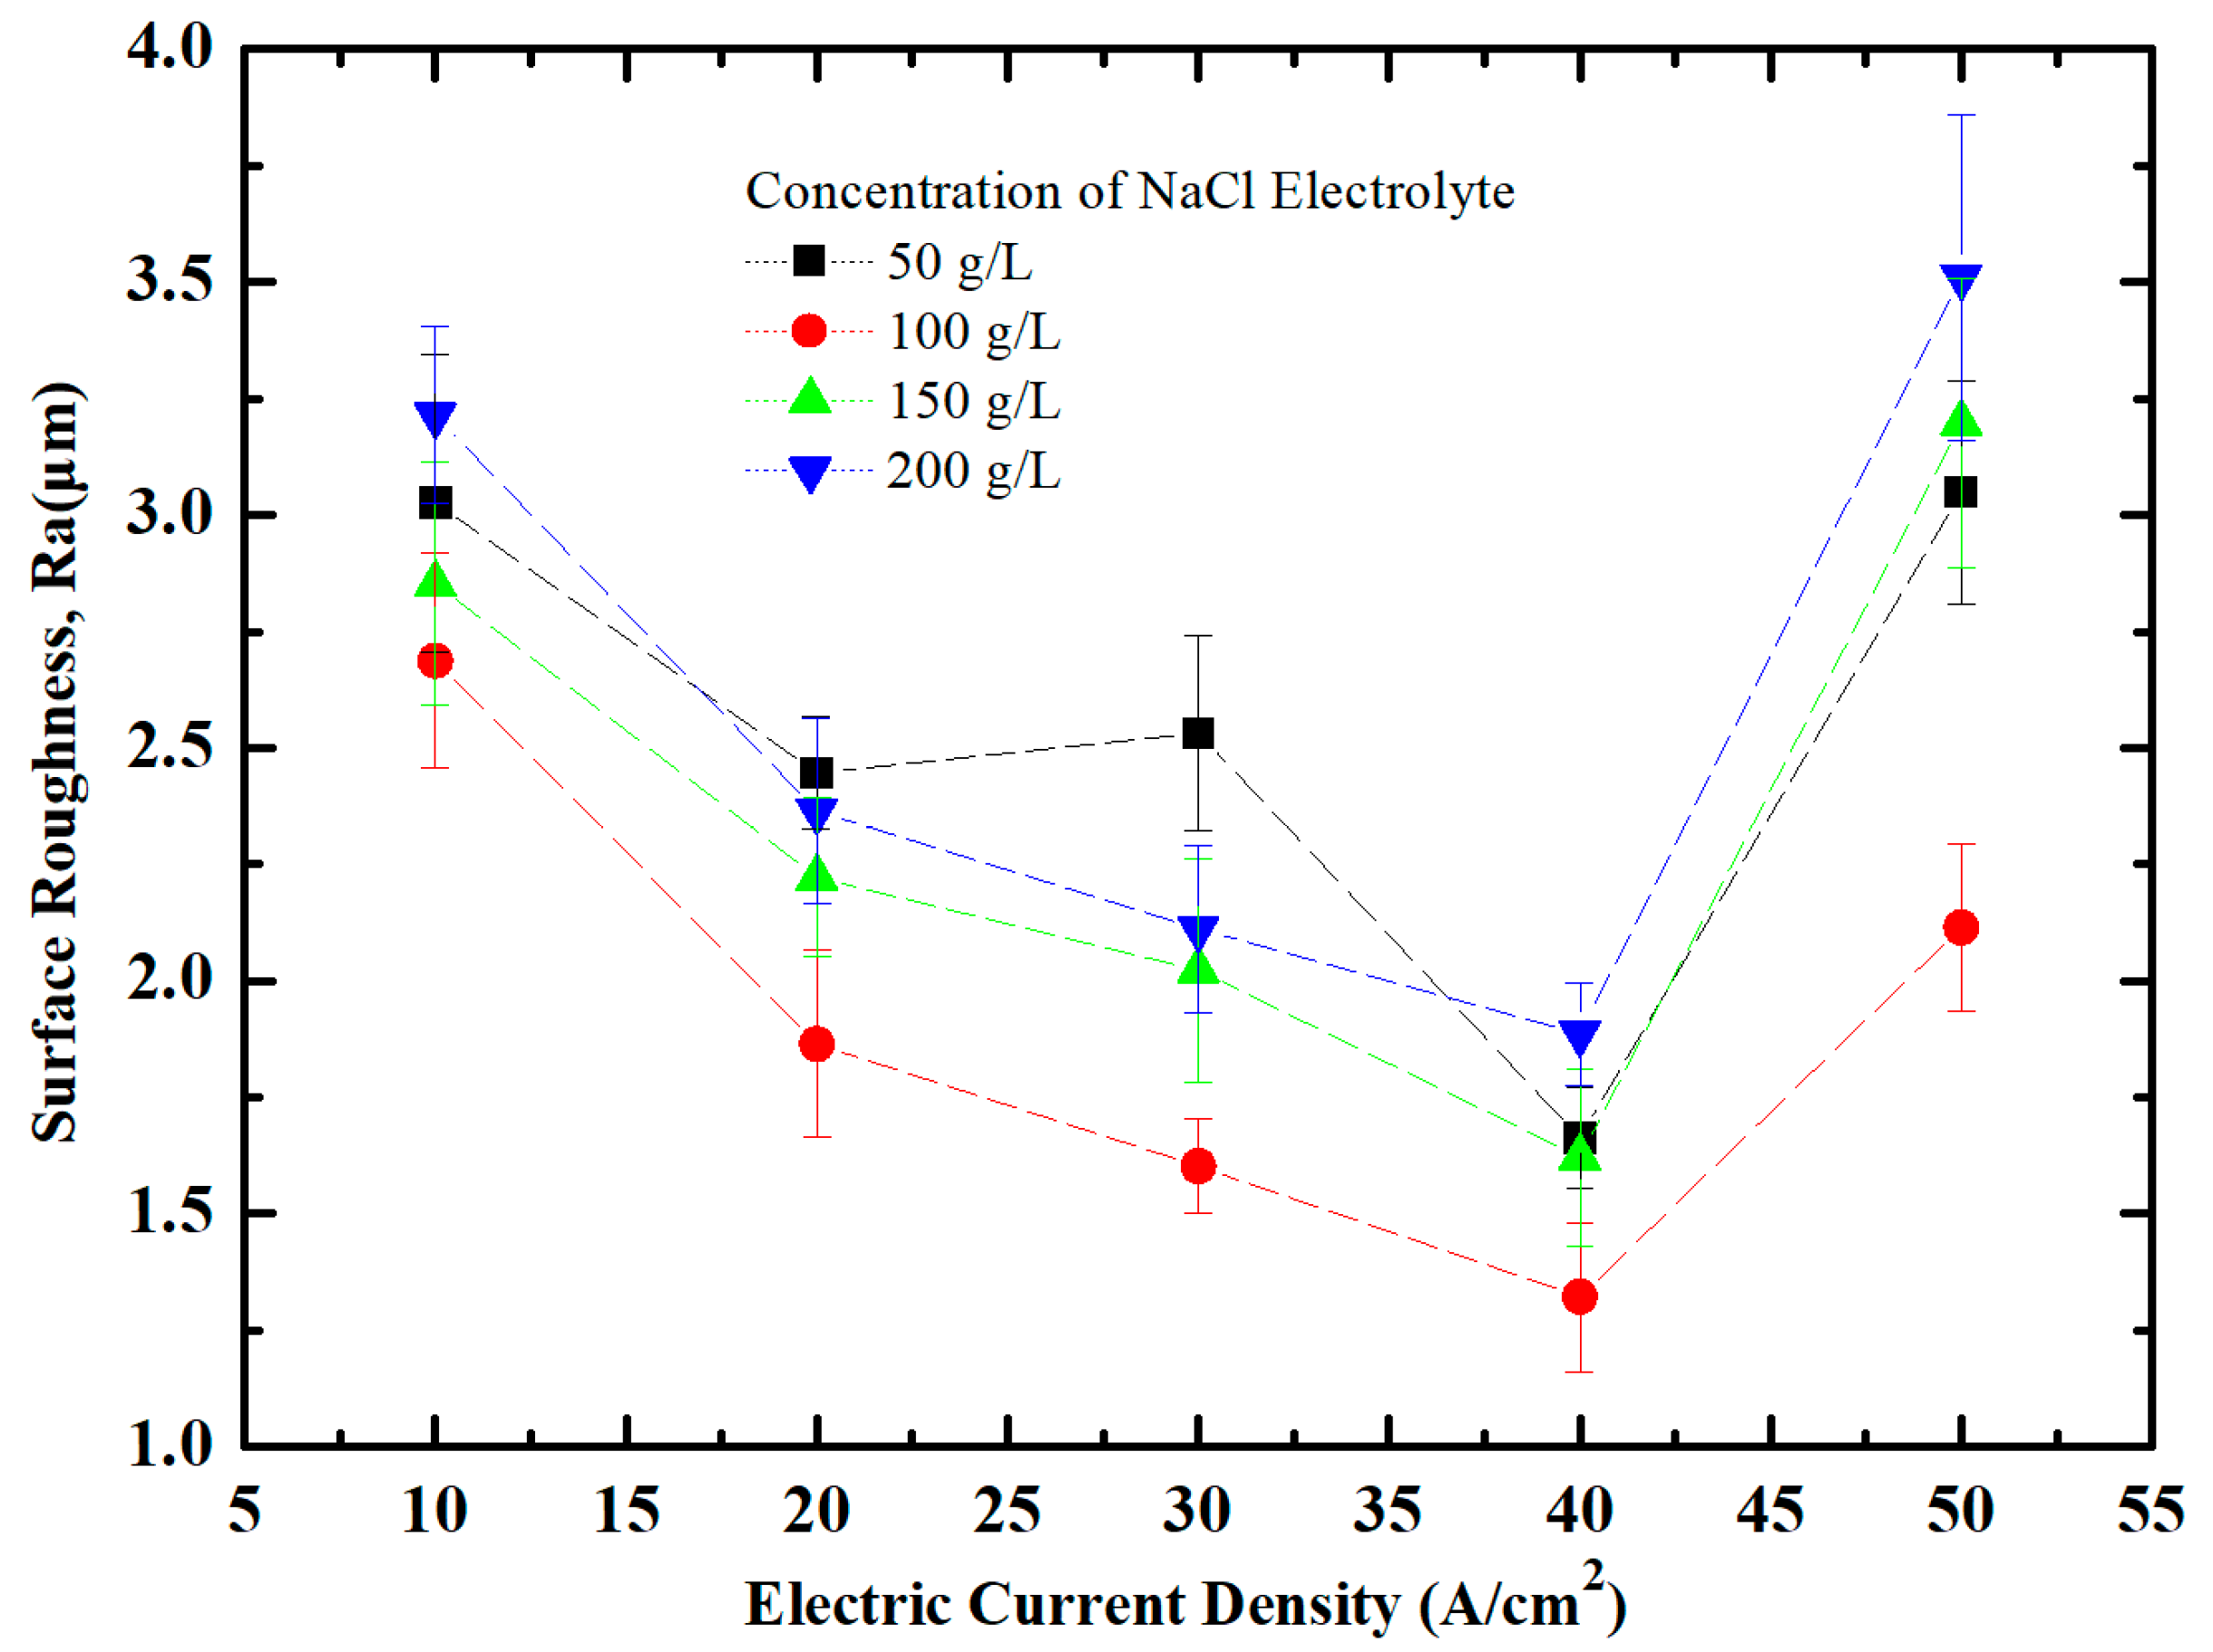
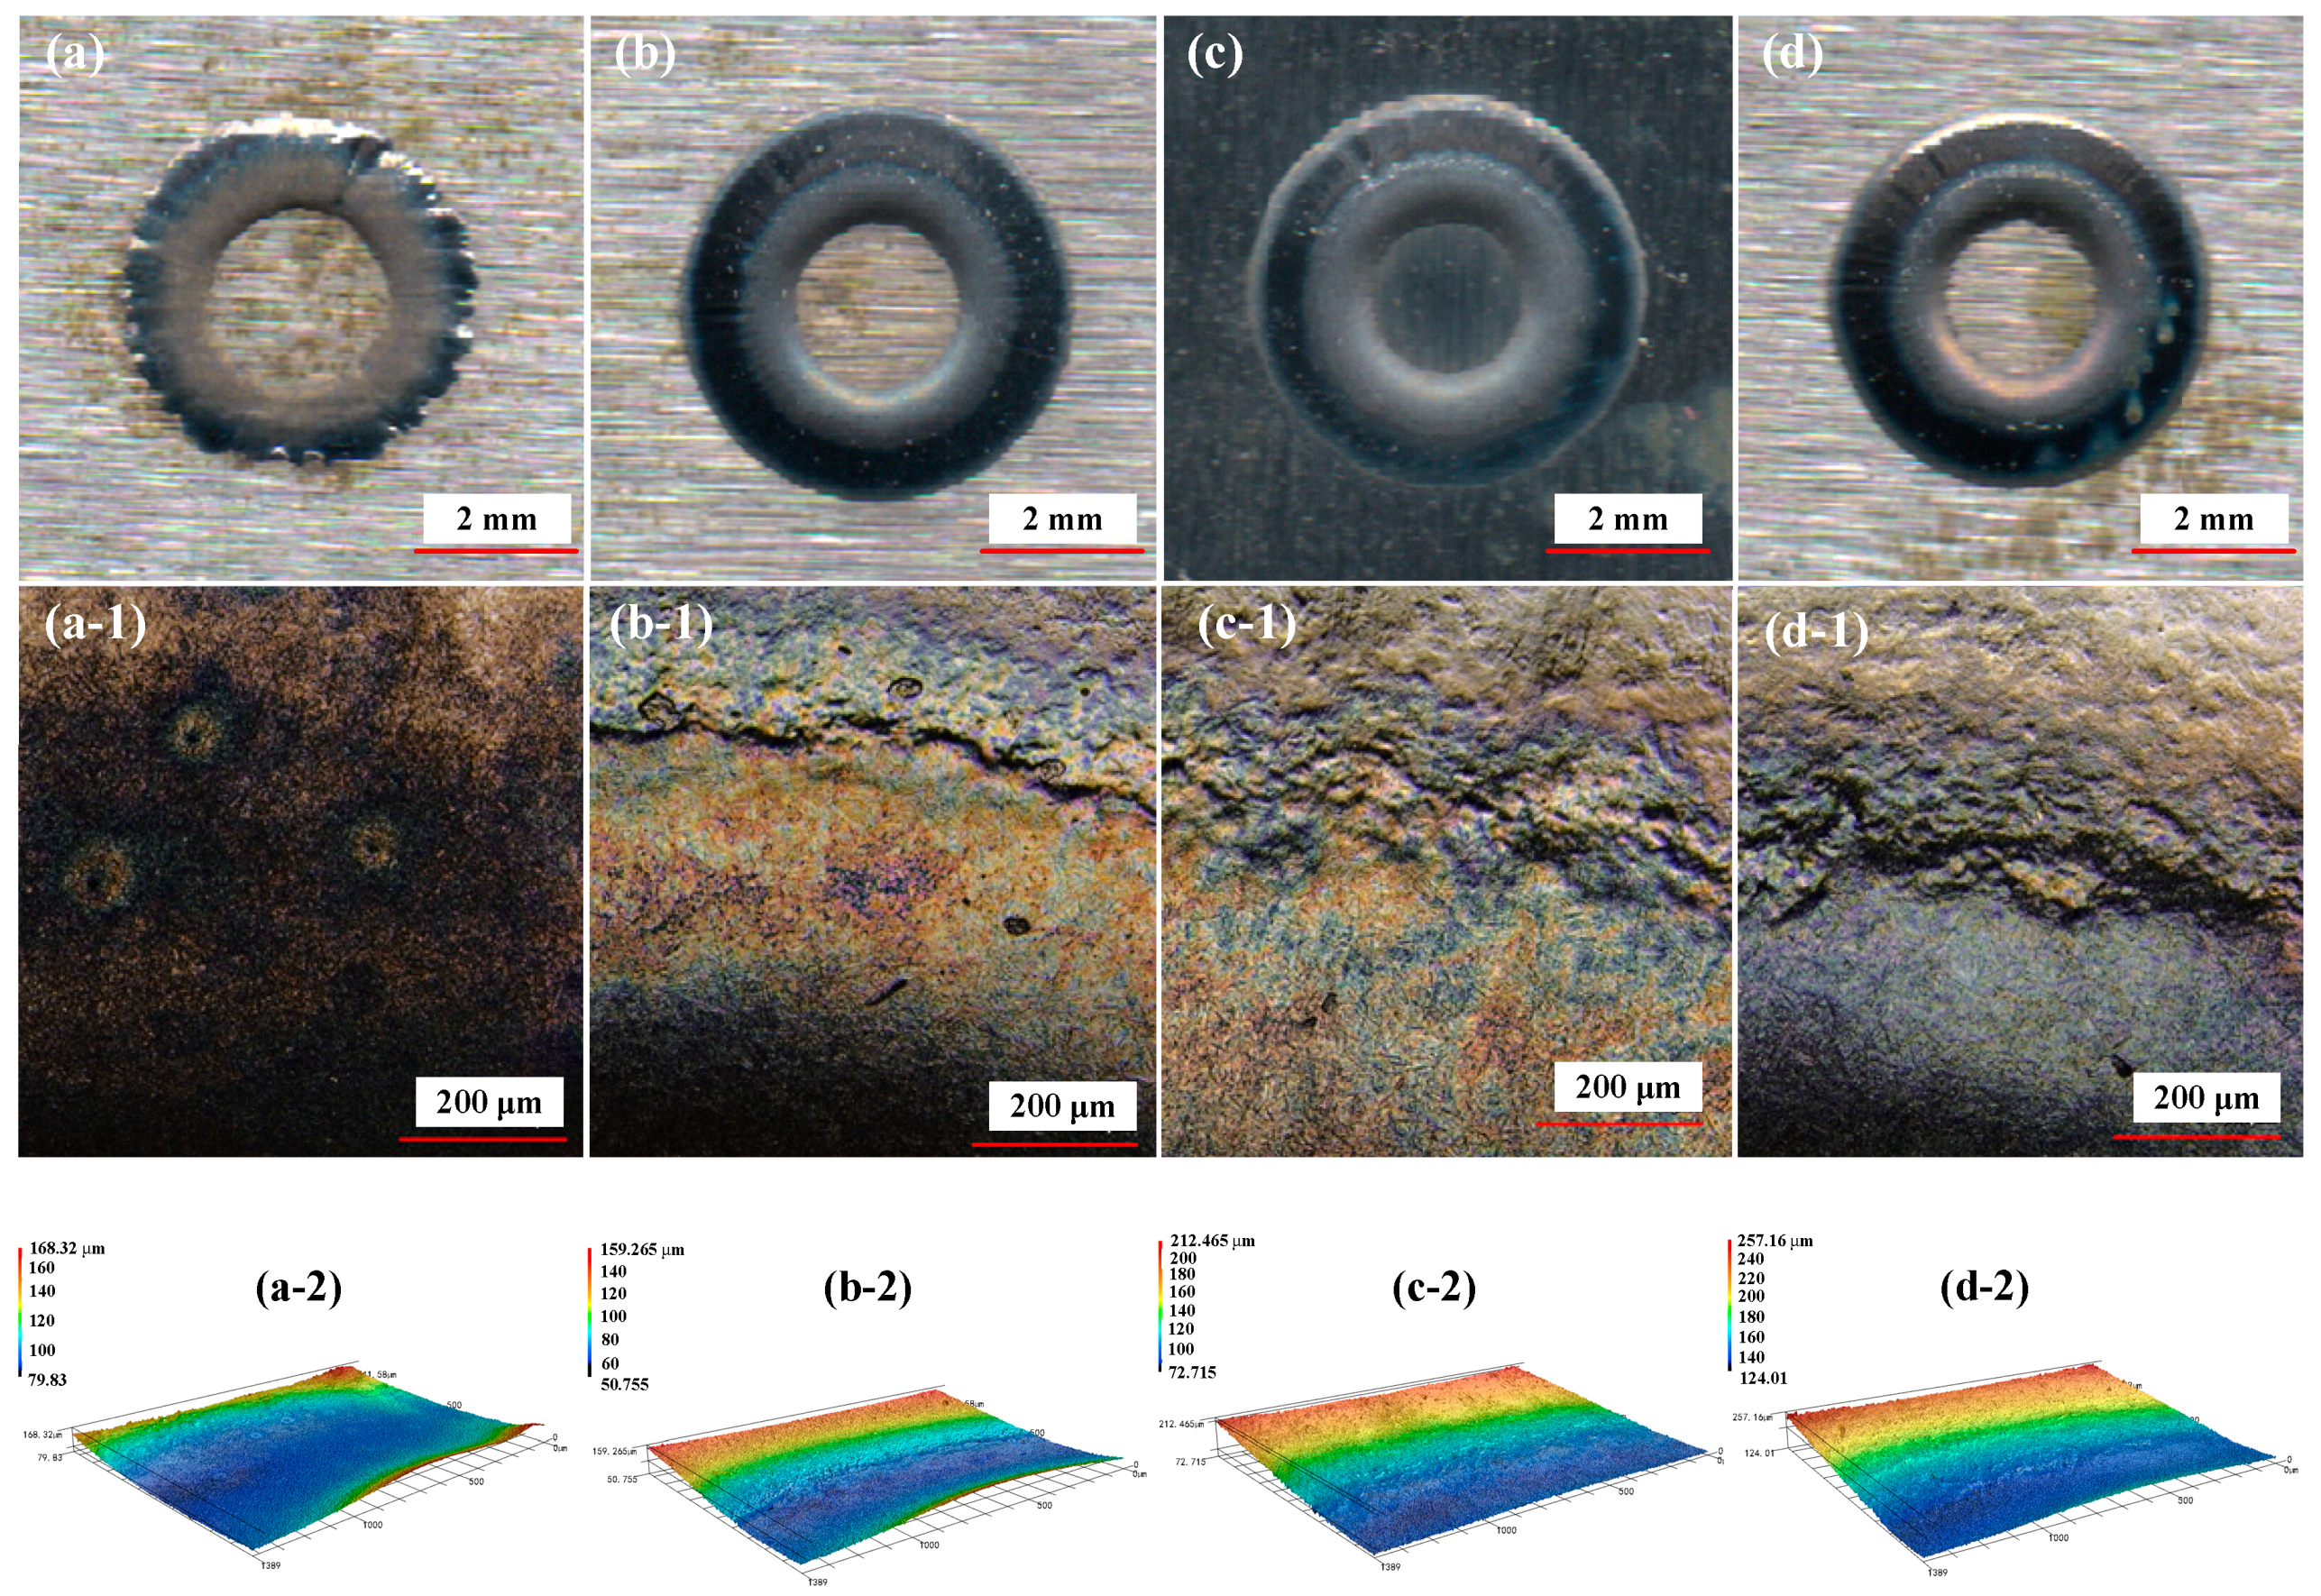
3.1. Effect of NaCl Electrolyte Concentration on Surface Quality of Workpiece

The mean value of the surface roughness of a workpiece at different concentrations of NaCl electrolyte under each current density was obtained, as shown in Figure 4. It was found that the workpiece surface roughness at the same current density decreased first, and then increased. The surface roughness after machining was generally batter than before except at a high electrolyte concentration and a high current density and the workpiece has the minimum surface roughness at electrolyte concentration of 100 g/L.
It also can be seen from Figure 4 that the workpiece had better surface quality at a current density of 40 A/cm2. So, a series of experiments was conducted at different concentration of NaCl electrolyte under current density of 40 A/cm2. The surface morphology of a workpiece at different concentrations of NaCl electrolyte are shown in Figure 5a–d. The range of the micromorphology of a workpiece local surface is depicted by the green rectangle area in Figure 5a which contains the main part of the machined surface, as shown in Figure 5(a-1–d-1). The range of the 3D profile image is depicted by the blue rectangle area in Figure 5a which contained the main part of the machined surface and the edge of the inner circle, as shown in Figure 5(a-2–d-2). The surface morphologies, micro-morphologies and 3D profiles in other cases were according to the same range as shown in Figure 5. The workpieces after machining had a serious stray corrosion at different concentrations of NaCl electrolyte, as shown in Figure 5a–d. The machining area can only see the approximate shape. And the inner and outer round corners were completely eroded and cannot be identified. The corrosion area became larger with increasing electrolyte concentration. The circle at the center was hardly distinguished at an electrolyte concentration of 200 g/L. It can be concluded that the electrolysis process of 35CrMo steel in NaCl electrolyte had a violent reaction and a high efficient machining. The machining surface was delicate and the surface quality was better at a lower electrolyte concentration, as shown in the surface micromorphology of Figure 5(a-1–d-1). With the increase in electrolyte concentration, a thicker stripe structure began to appear in the processing area, which had a negative effect on surface quality.

3.2. Effect of Current Density on Surface Quality of Workpiece

The surface roughness of the workpiece at different current densities is shown in Figure 6. It was found that the workpiece surface roughness at the same electrolyte concentration decreased first, and then increased. The surface roughness at a current density of 40 A/cm2 was generally lower than others.
When the electrolyte concentration was 100 g/L, the surface morphology of the workpiece at different current densities is shown in Figure 7a–e. It can be found that the outlines of the inner and outer circle were clear and the workpieces after machining had a slight stray corrosion but the surface quality was fair. The stray corrosion became more severe and the outline of the inner circle became hardly distinguished with the increase in current density. The surface micromorphology in Figure 7(a-1–e-1) shows that the machining surface became fine. The machining workpiece could get the best surface quality at a current density of 40 A/cm2. Fine lines appeared on the workpiece surface at a current density of 50 A/cm2.

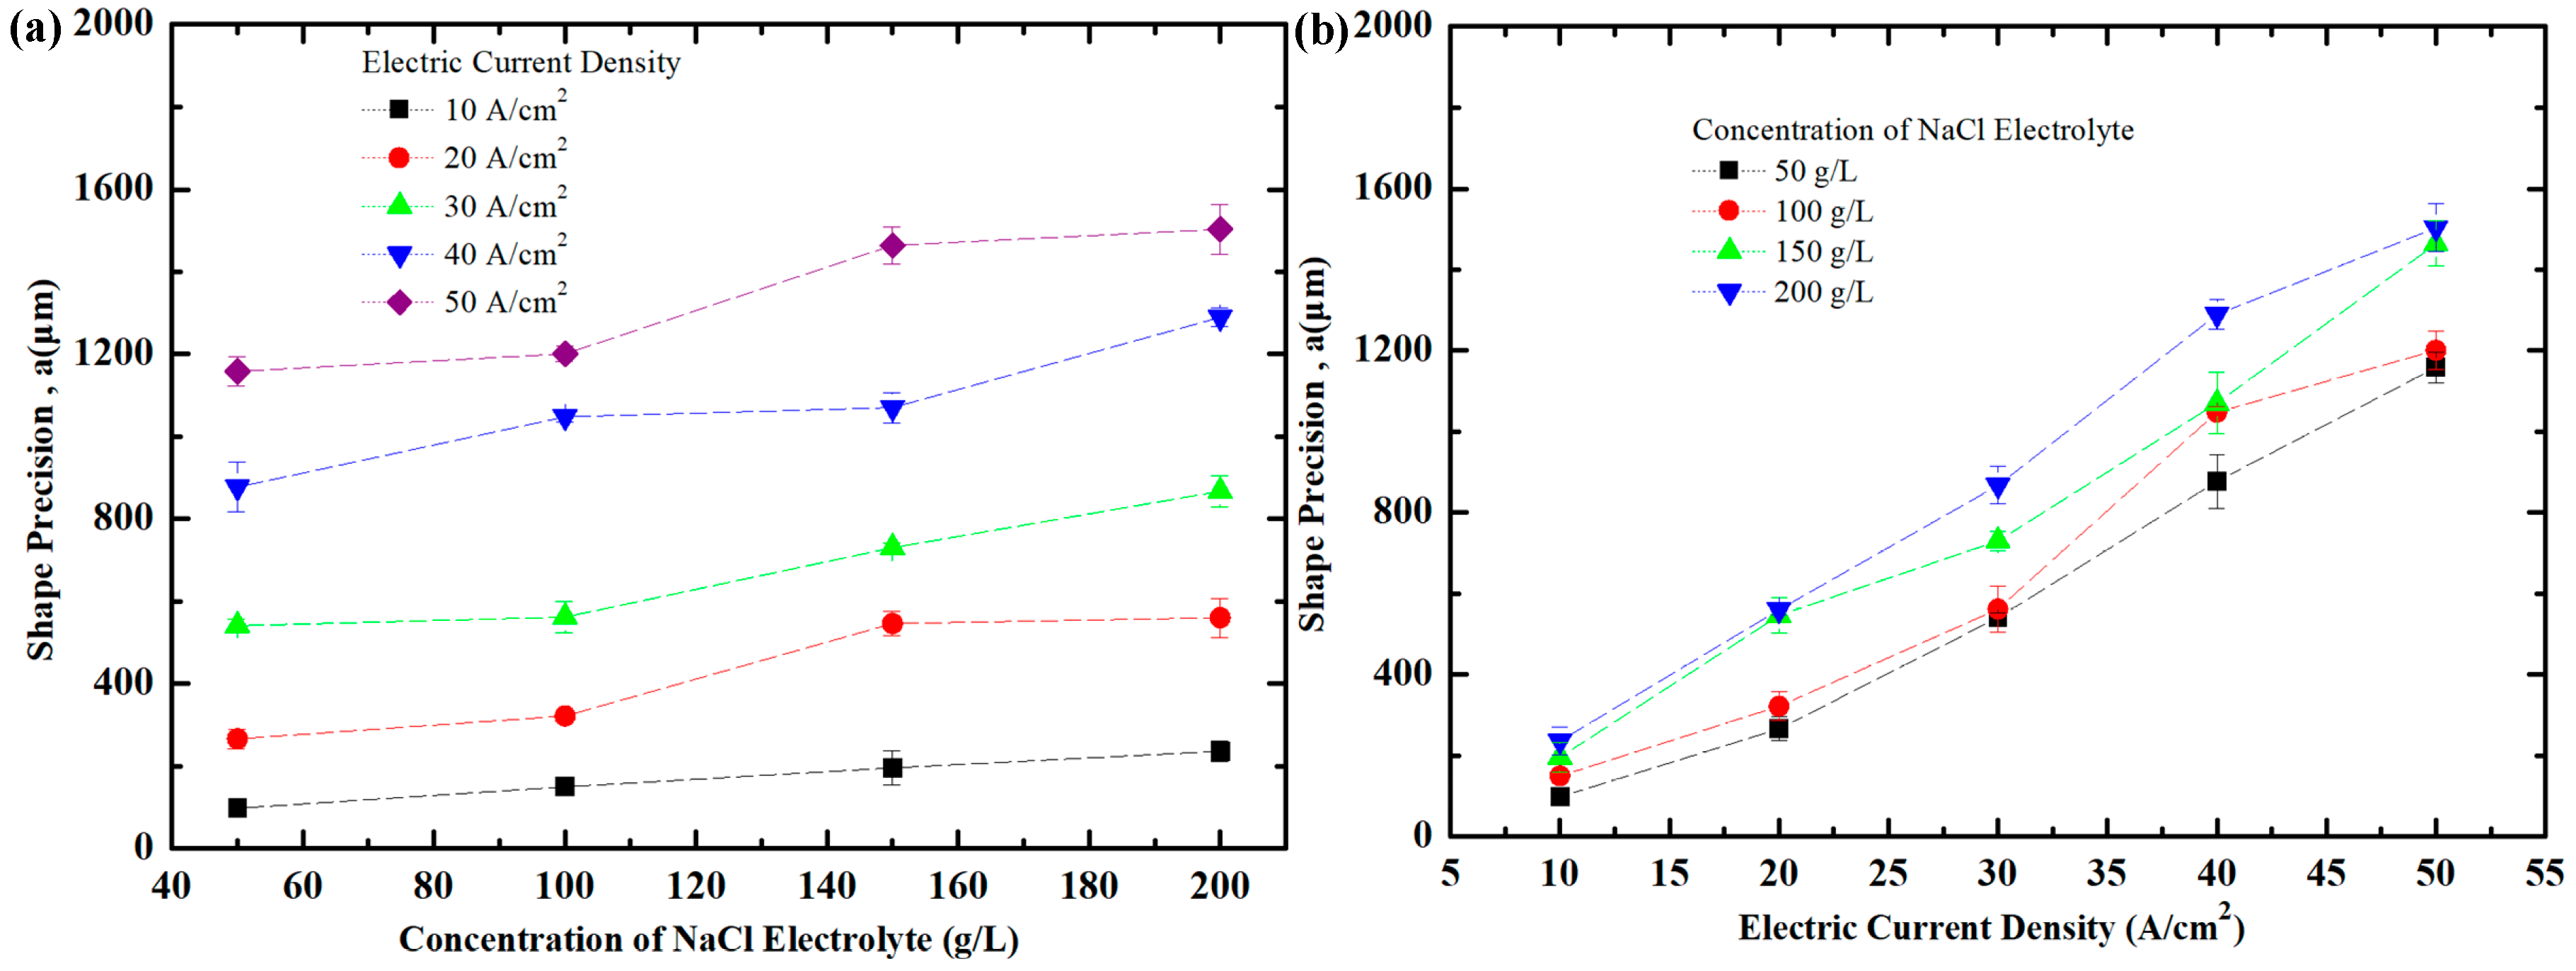
3.3. Effect of Current Density and NaCl Electrolyte Concentration on Shape Precision of Workpiece

Shape precision is the deviation between the actual and desired dimensions of the workpiece after machining, owing to the difference of the machining condition. Each experiment with the same parameters was performed three times. The value of the excircle dimension obtained from three experiments within 50 μm can be seen as a set of valid data. That is to say, the shape precision of the sample is within 50 μm. The mean value of every set of data was treat as experimental value of machining dimension to investigate the effect of current density and electrolyte concentration on shape precision of workpiece.
The shape precision could be calculated as follows:
a = φ 2 φ 1
where a is the shape precision, φ 1 is the diameter of electrode excircle, and φ 2 is the measured value of the excircle after machining.
The shape precision of the workpiece at different electrolyte concentrations is shown in Figure 8a. It was found that the shape precision of the workpiece excircle showed a trend of increasing with the increase in concentration of NaCl electrolyte. The reason is that with the increasing electrolyte concentration, the electrical conductivity of the electrolyte increased, at the same time the density of anion and cation per unit volume increased and the reaction in the machining area at per unit time became faster. With the increase in time, the stray corrosion became more severe, meanwhile the area gradually expanded. As shown in Figure 5, the dimension of the excircle increased with the increase in electrolyte concentration, at the same time the corrosion of inner circle became more severe and the shape precision became lower.
The shape precision at different current densities in the NaCl electrolyte was shown in Figure 8b. It can be found that the shape precision increased with the increase in current density. The reason is that after increasing the current density, the electric field strength of the machining gap increased and the influence of the surrounding electric field increased inevitably. So, the processing area expanded gradually and the shape precision became poor. Comparing the morphology of samples in Figure 7a–e, it can be seen that the diameter of the excircle increased gradually with increasing current density and the inner circle was gradually corroded off and could not be figured out.

3.4. Electrolytic Reaction Principle of 35CrMo Steel in NaCl Electrolyte

The main chemical compositions of 35CrMo steel according to GB/T3077-1999 is shown in Table 1.
The electrolytic reaction of metal impurities also occurred during electrochemical machining although the major reaction was with Fe. The ionization equilibrium as followed existed in the NaCl electrolyte during the machining:
H 2 O H + + OH
NaCl Na + + Cl
The anode was 35CrMo steel and the cathode was stainless steel. The reaction of electrode during the machining can be described as followed [28]:
(1) Anodic reaction
① The iron on the surface of the anode released electron and then formed Fe2+ or Fe3+ dissolved in the electrolyte:
Fe 2 e Fe 2 +
Fe 3 e Fe 3 +
② OH in the electrolyte attracted by the anode lost electron and released oxygen:
4 OH 4 e 2 H 2 O + O 2
③ Cl in the electrolyte attracted by the anode lost electron and released chlorine:
2 Cl 2 e Cl 2
The electrochemical reaction chrome and molybdenum in the 35CrMo steel also occurred in the electrolysis process. The reaction can be described as:
Cr 3 e Cr 3 +
Mo 3 e Mo 3 +
According to the principle of electrode reaction, the electrochemical reaction firstly occurred at the substance of the most negative electron potential. The electron potential of each element is shown in Table 2.
Table 2 shows Cr has the most negative electron potential, so Cr dissolves firstly. The Cr3+ dissolved in electrolyte and combined with OH. Then Cr(OH)3, a gray-green sediment, generated.
Cr 3 + + 3 OH Cr ( OH ) 3
Due to the content of Cr was little, the dissolve of Fe became the major action in the machining domain after the reaction of Cr. The second reaction is the dissolution of Fe to Fe2+, followed by the subsequent formation of Fe(OH)2 by combining with OH.
Fe 2 + + OH Fe ( OH ) 2
Fe(OH)2, a dark green sediment, transformed into Fe(OH)3, a reddish-brown sediment, on the effect of oxygen in the air.
4 Fe ( OH ) 2 + 2 H 2 O + O 2 4 Fe ( OH ) 3
Other reactions would not occur before anode absolutely dissolve. So, a small amount of Mo would be exposed on the surface of the anode, and oxygen and chlorine would not be generated.
(2) Cathodic reaction
A large number of bubbles were generated at the cathode in the machining after starting the power. The reaction of cathodic can be described as followed:
① H+ was attracted by cathodic and absorbed electron to generate hydrogen:
2 H + + 2 e H 2
② Na+ was attracted by cathodic and absorbed electron to generate Na:
Na + + e Na
According to the principle of electrode reaction, the cathodic reaction firstly occurred at the ion of the most positive electron potential. Therefore, only the hydrogen would be generated on the cathode when the electrolyte had H+ only, which coincided with the experimental results.

4. Electrochemical Machining Experiment and Analysis of NaClO3 Electrolyte

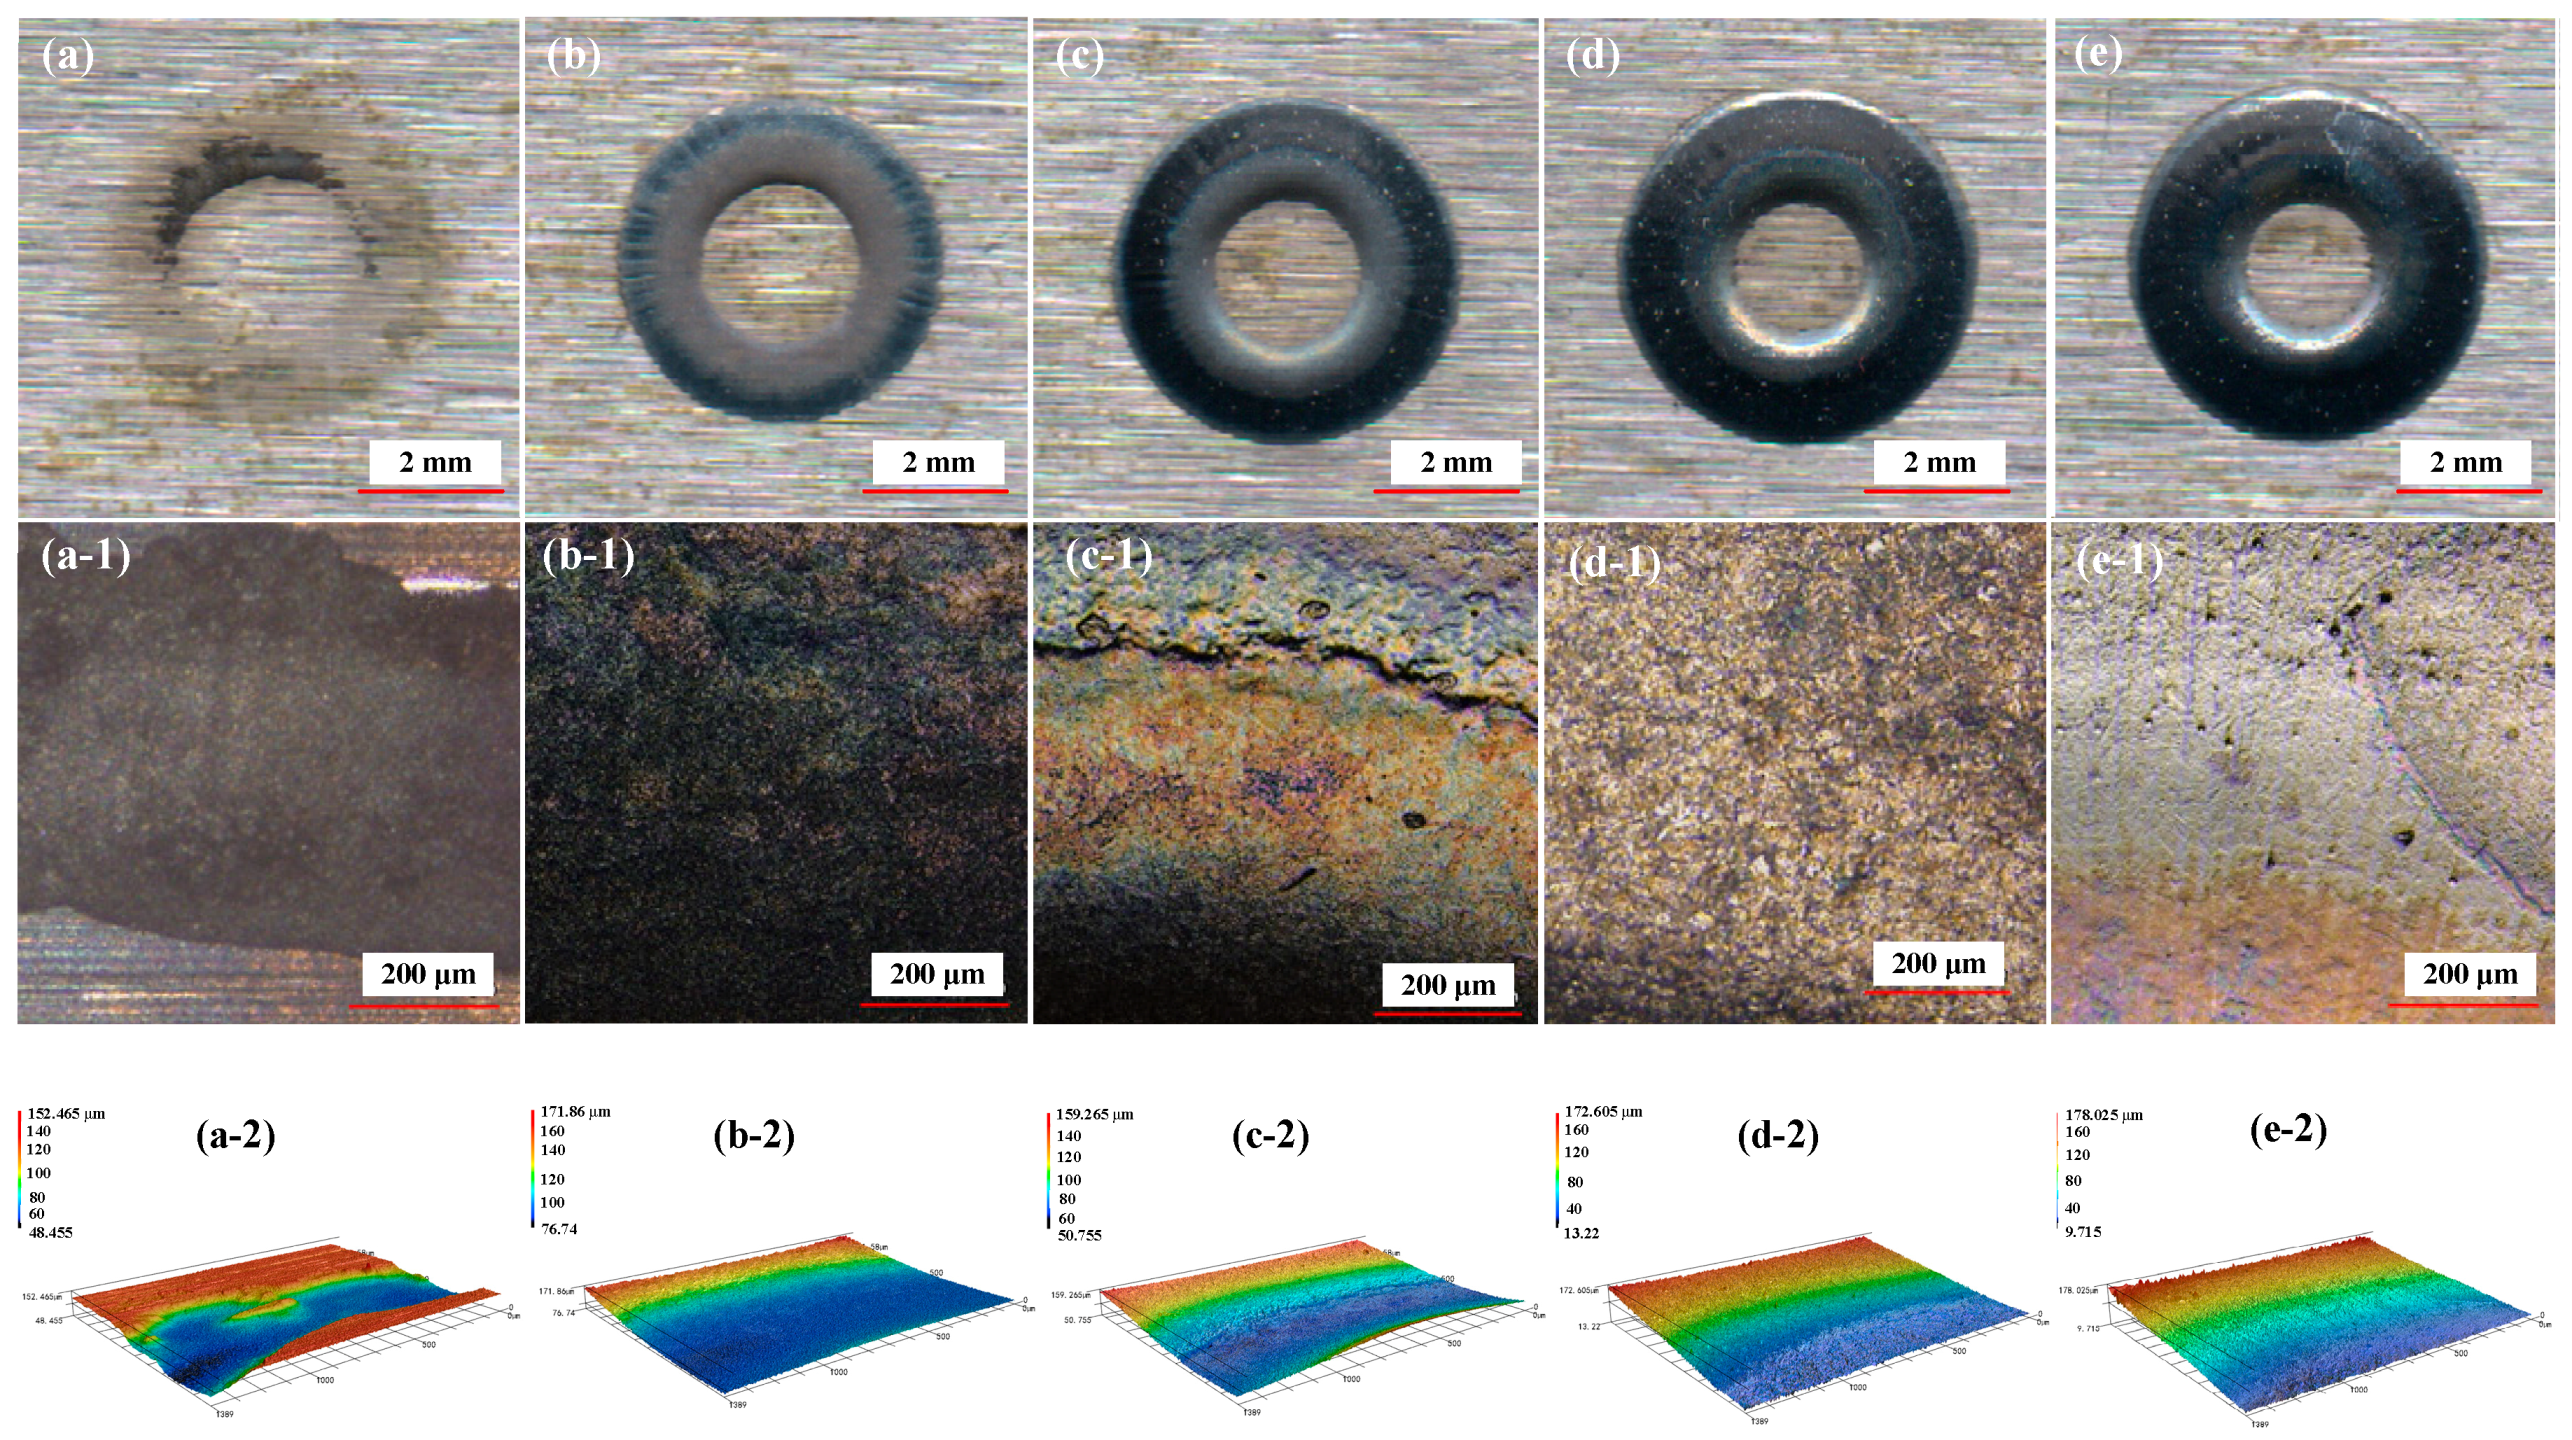
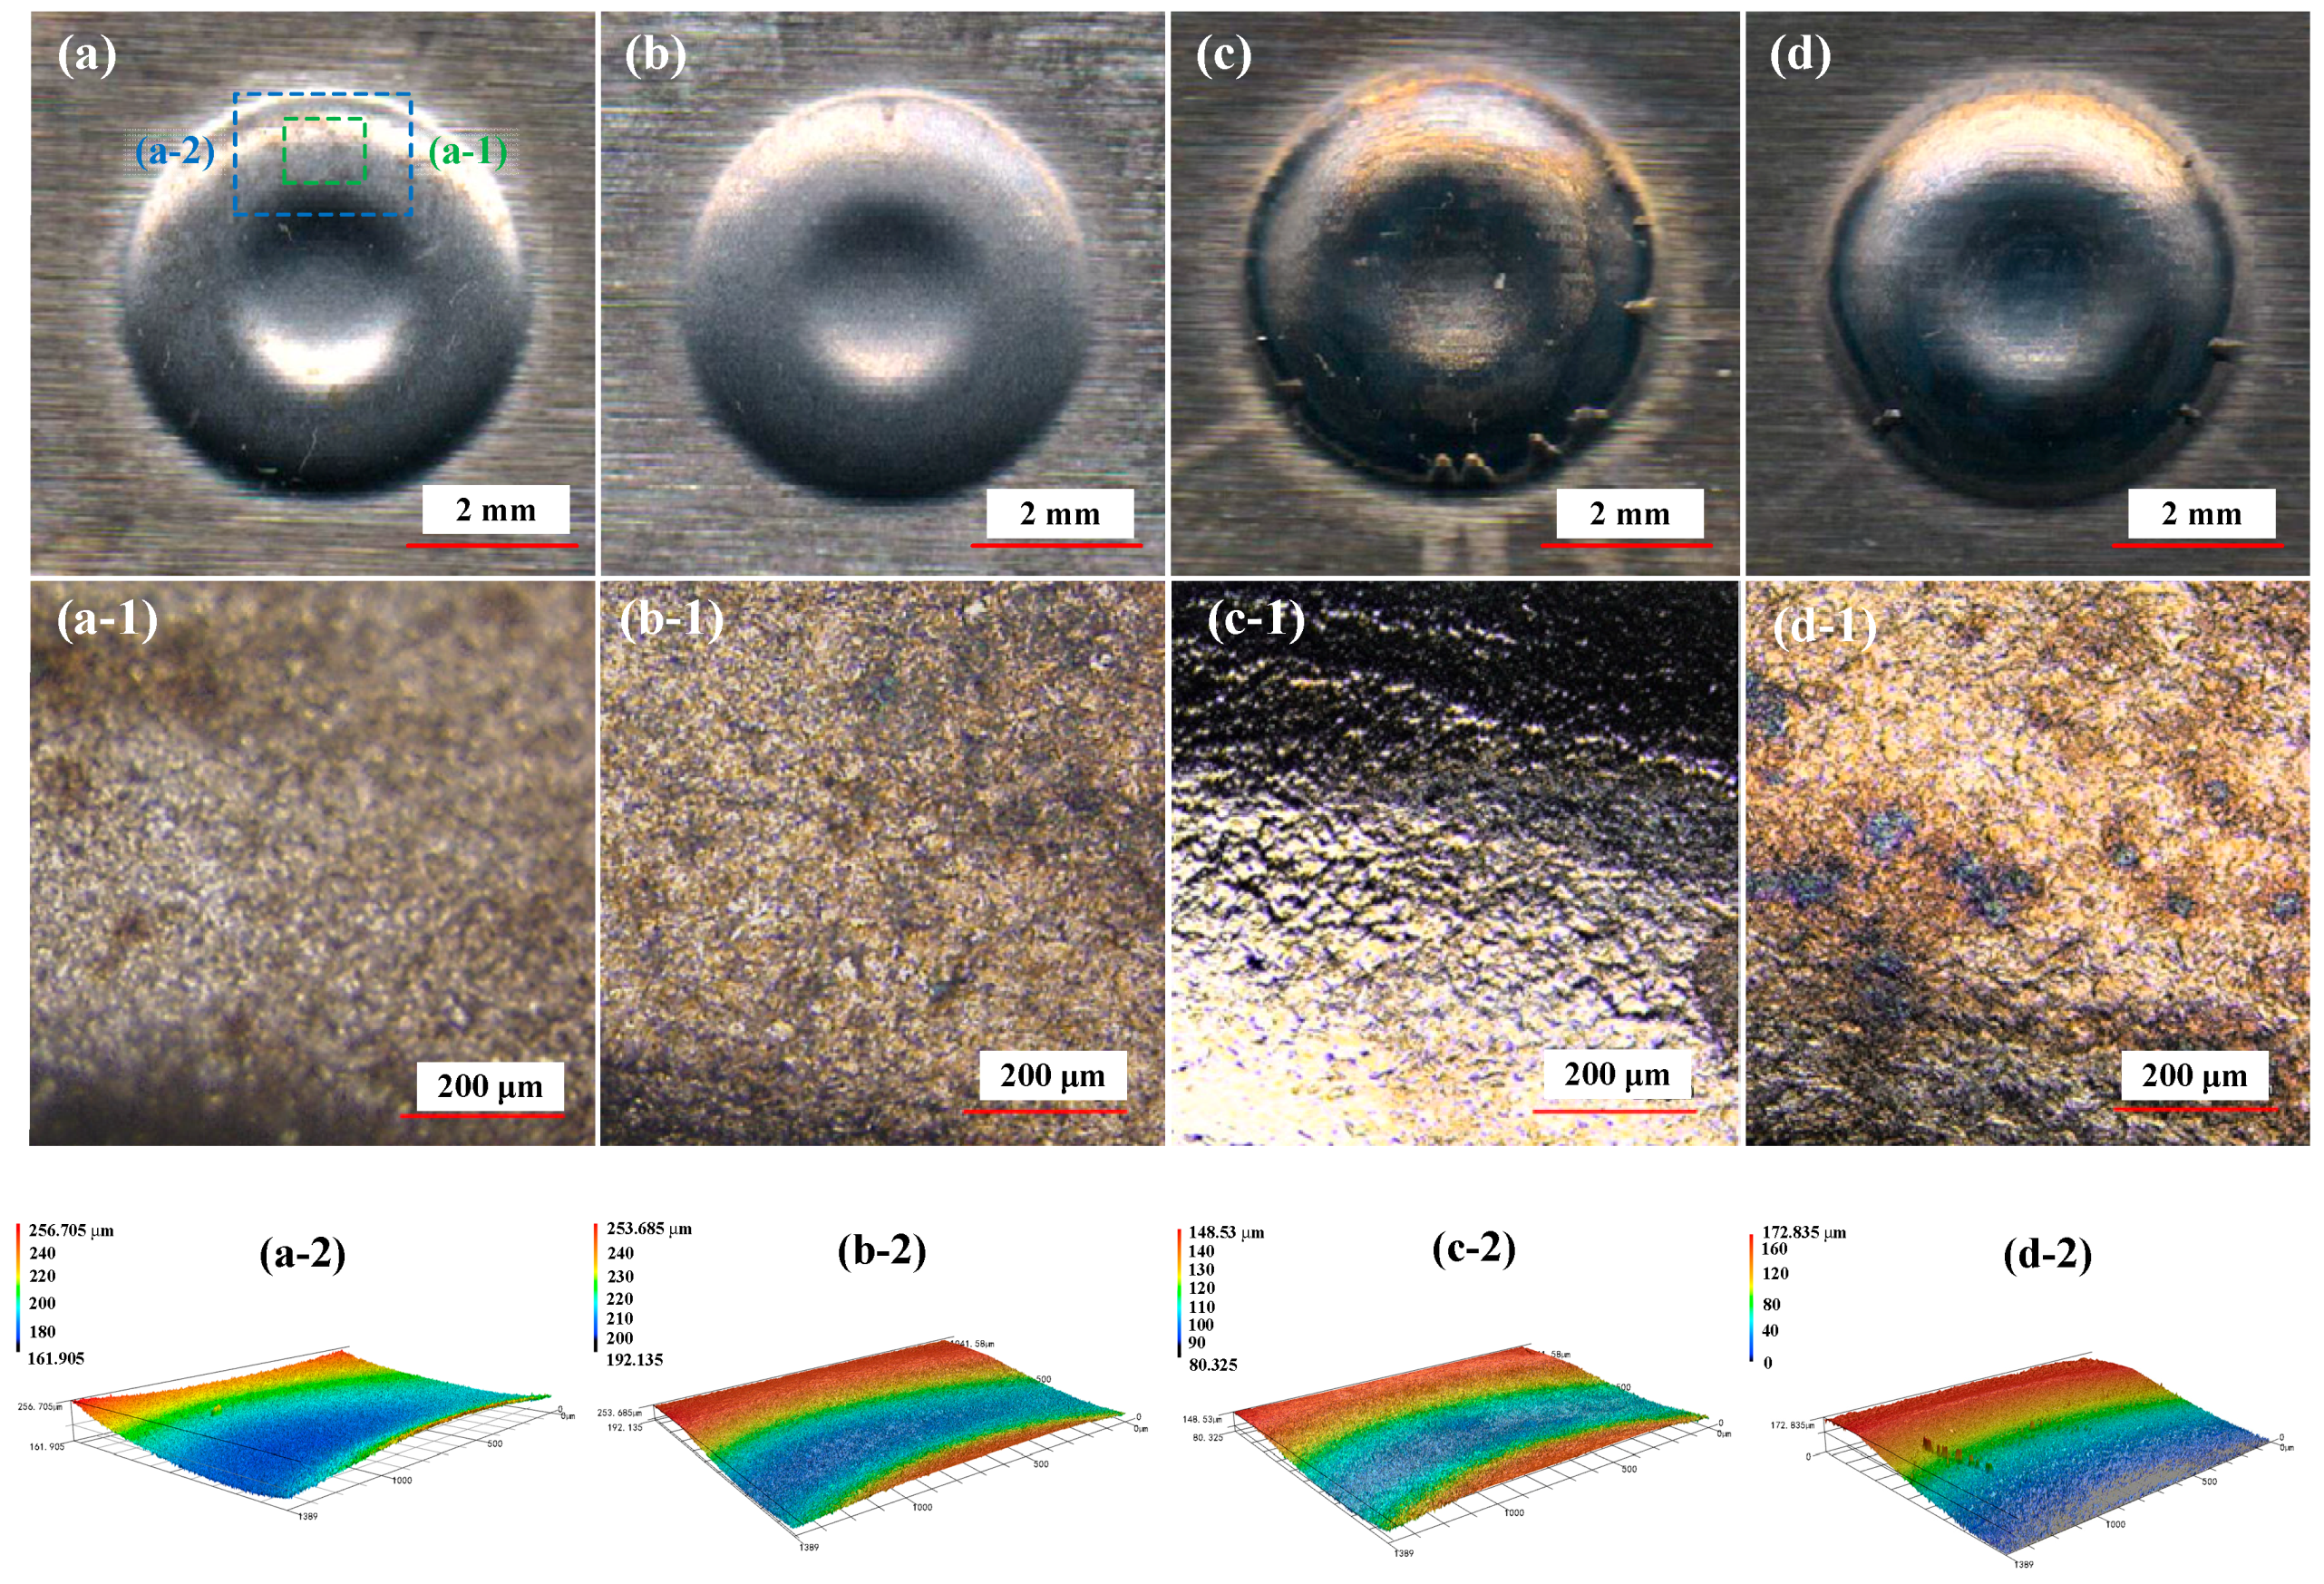
4.1. Effect of NaClO3 Electrolyte Concentration on Surface Quality of Workpiece

The passive film on the surface of 35CrMo occurred during the machining. Because of the passive film on the surface, the action cannot happen under the low electrolyte concentration and low current density during the machining. It can be seen from the experiment that only a circle of passive film was generated on the metal. The metal cannot be machined normally.
Figure 9 shows the variation of surface roughness of a workpiece at different concentrations of NaClO3 electrolyte. It was found that the workpiece surface roughness at the same current density increased first, and then decreased with the increasing concentration. Because the machining cannot be performed under a low electrolyte concentration and a low current density, the corresponding data was discarded. The data at a current density of 10 A/cm2 is absolutely lost. It can be concluded that the electrochemical machining cannot proceed. Three sets of data at the current density of 10 A/cm2, 20 A/cm2 and 30 A/cm2 were lost when the electrolyte concentration was 100 g/L. While machining proceeded successfully under a high current density. The workpiece can also be machined under an electrolyte concentration of 400 g/L when the current density was more than 10 A/cm2. That is to say, in order to machine successfully, higher current density should be adopted under the low electrolyte concentration and lower current density should be adopted under the high electrolyte concentration in electrochemical machining. Figure 9 shows that the workpiece surface roughness under a current density of 30 A/cm2 is generally lower than others. Under this circumstance, the surface morphology of a workpiece after machining at different concentrations of NaClO3 electrolyte is shown in Figure 10a–d.
Figure 10 shows that the electrochemical machining was not performed completely under an electrolyte concentration of 100 g/L. The dentate structure occurred on the excircle of the workpiece. It can be assumed that the passive film was just removed and the machining was not smooth. The machining became smooth when the electrolyte was continuously increased to 200 g/L. The outline of the inner and outer circles was clear and the effect of the machining area was better when the concentration of the electrolyte was continuously increased.
The surface micromorphology of the workpieces is shown in Figure 10(a-1–d-1), which shows the machining surface (the rippled structure above was boundary of workpiece and was used to compare). It can only be seen from the results that the workpiece had better surface quality at an electrolyte concentration of 200 g/L.

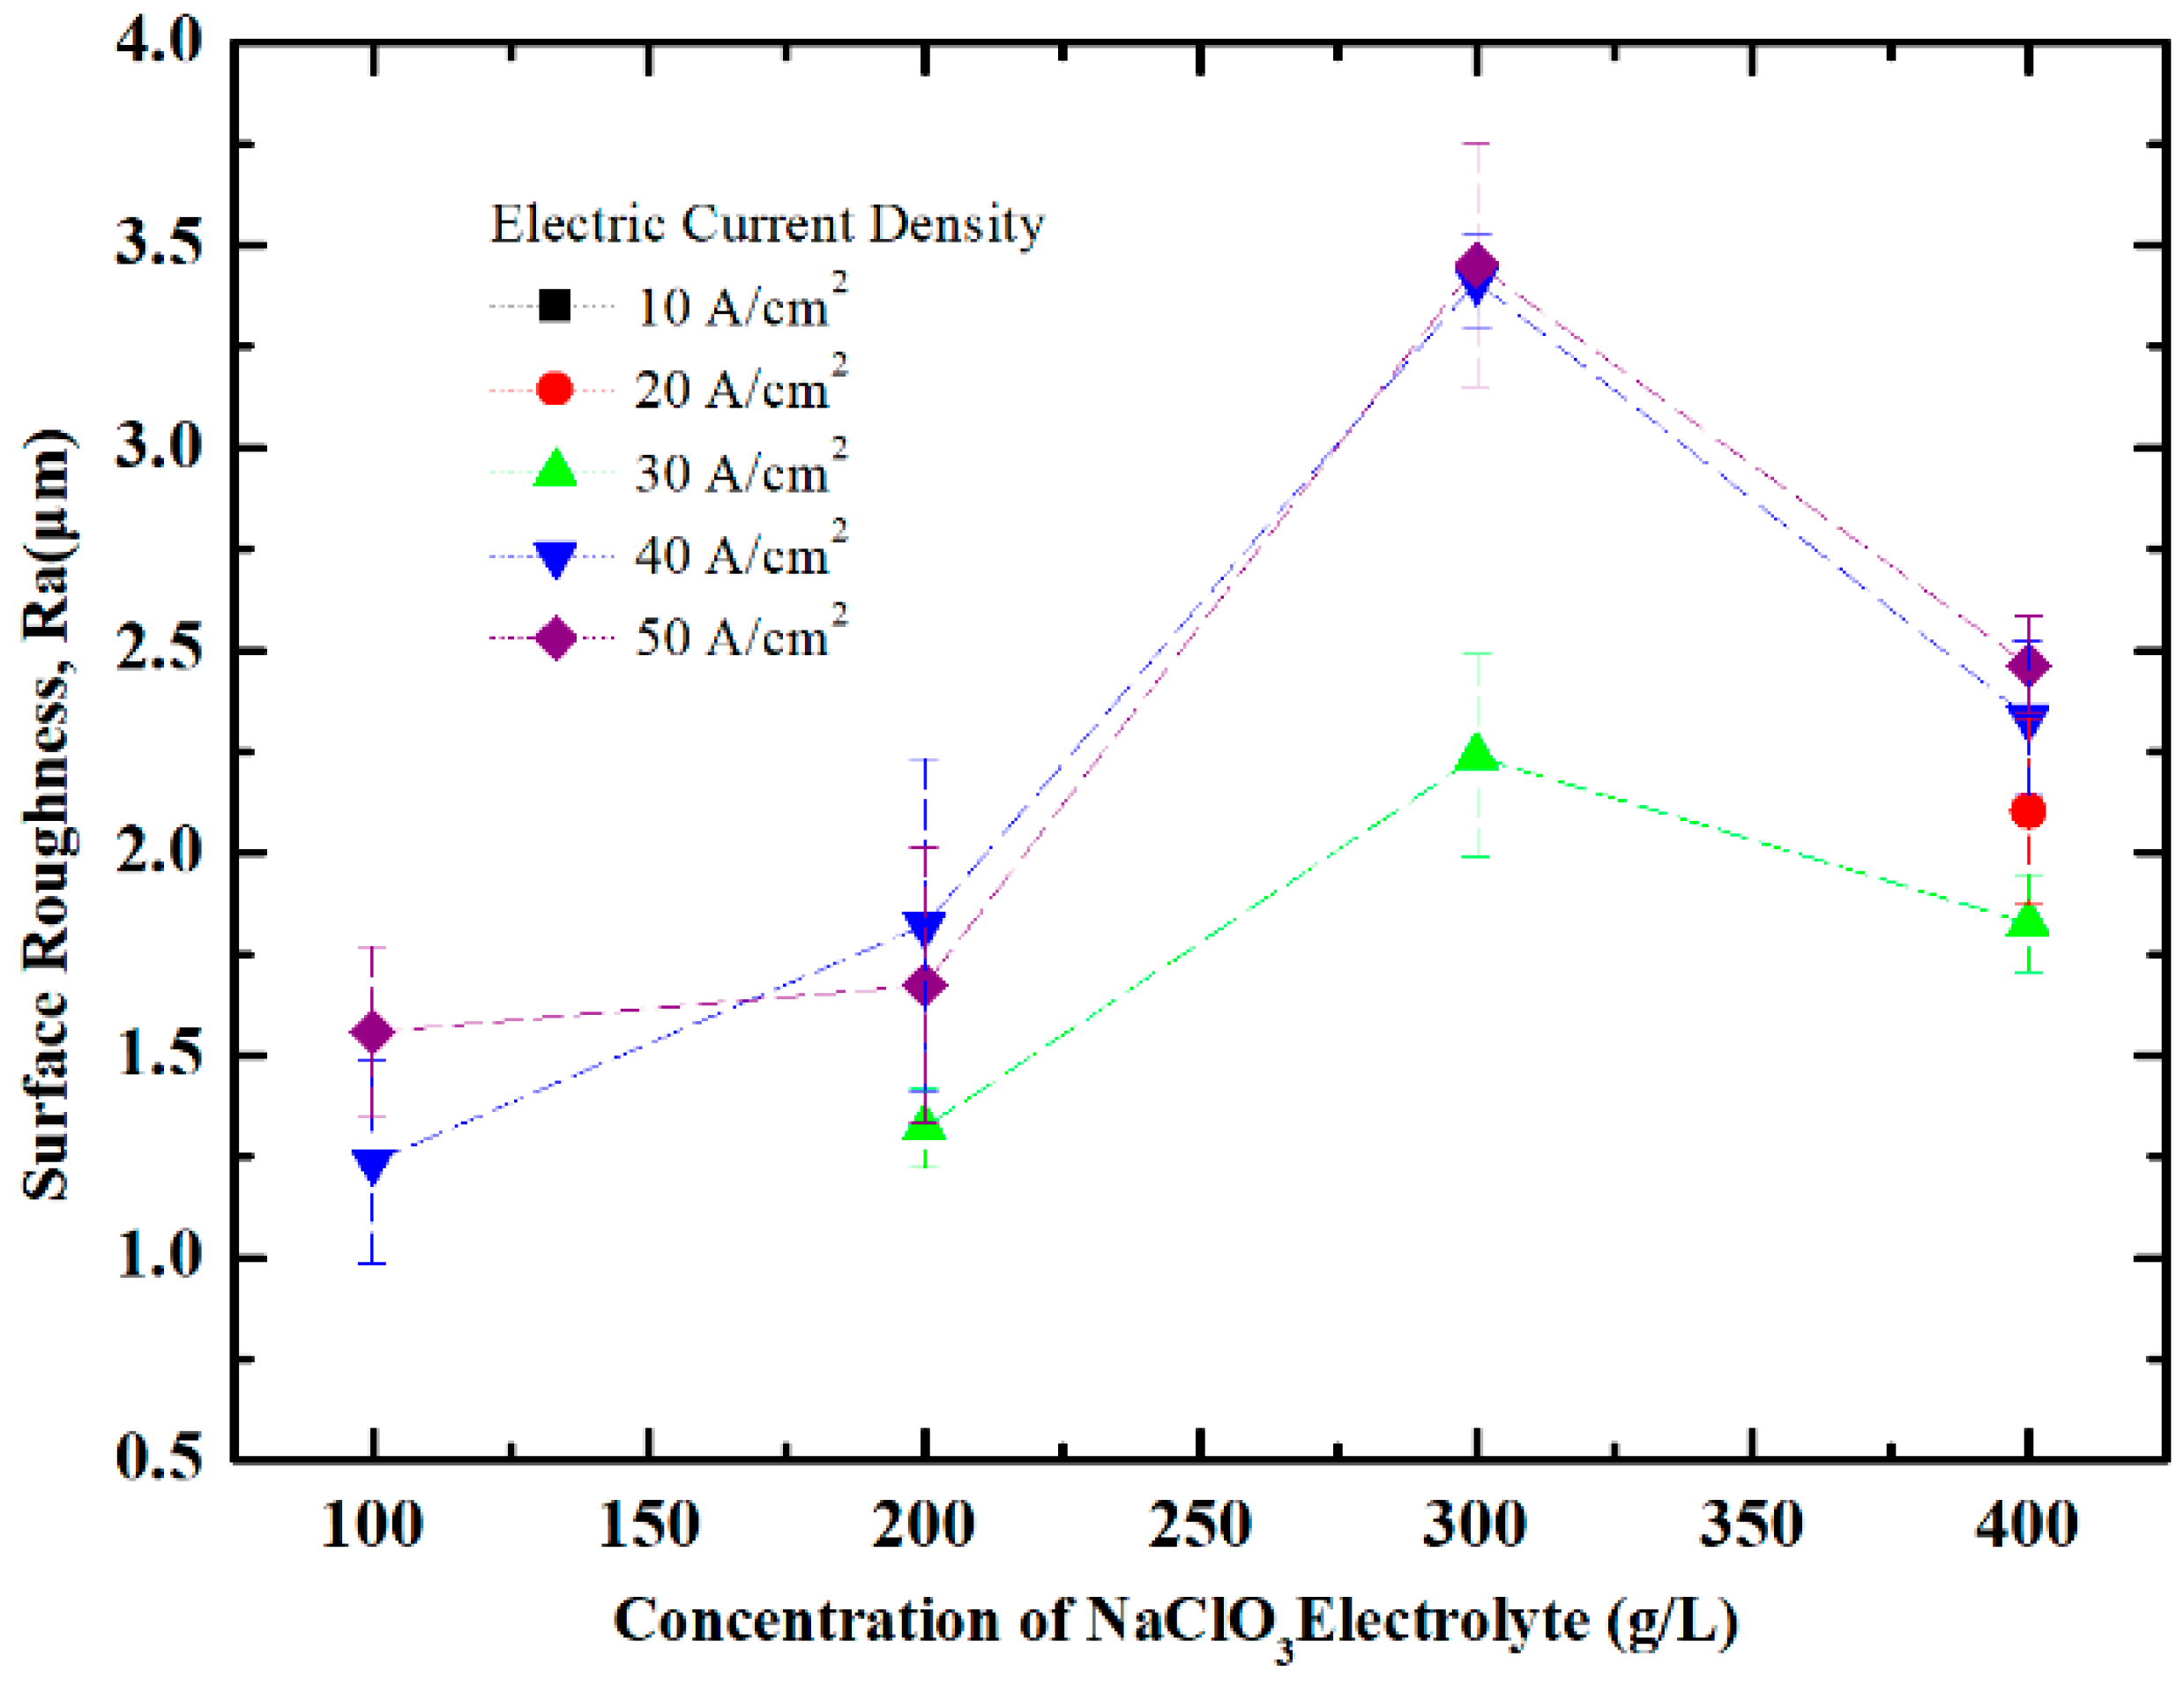
4.2. Effect of Current Density on Surface Quality of Workpiece

The surface roughness of a workpiece at different current densities is shown in Figure 11. It can be found that the workpiece surface roughness at the same electrolyte concentration decreased first, and then increased. The surface roughness at a current density of 30 A/cm2 was generally lower than others and had better surface quality.
Considering the low efficiency at a low electrolyte concentration and a low machining precision at high concentration, so the workpieces under an electrolyte concentration of 200 g/L were selected to observe the surface morphology, as shown in Figure 12. Figure 12a shows the electrolytic reaction did not occur. The surface of the workpiece was partially penetrated by electrolysis and the effect of micro-electrolysis appeared on it. The electrolysis effect became more significant with the increase in current density.
As shown in Figure 12(a-1–e-1), the surface of the machining domain was smooth under a current density of 30 A/cm2. While tiny projections or depressions appeared on the machining domain, which made the surface roughness increase and had a bad effect on the surface.

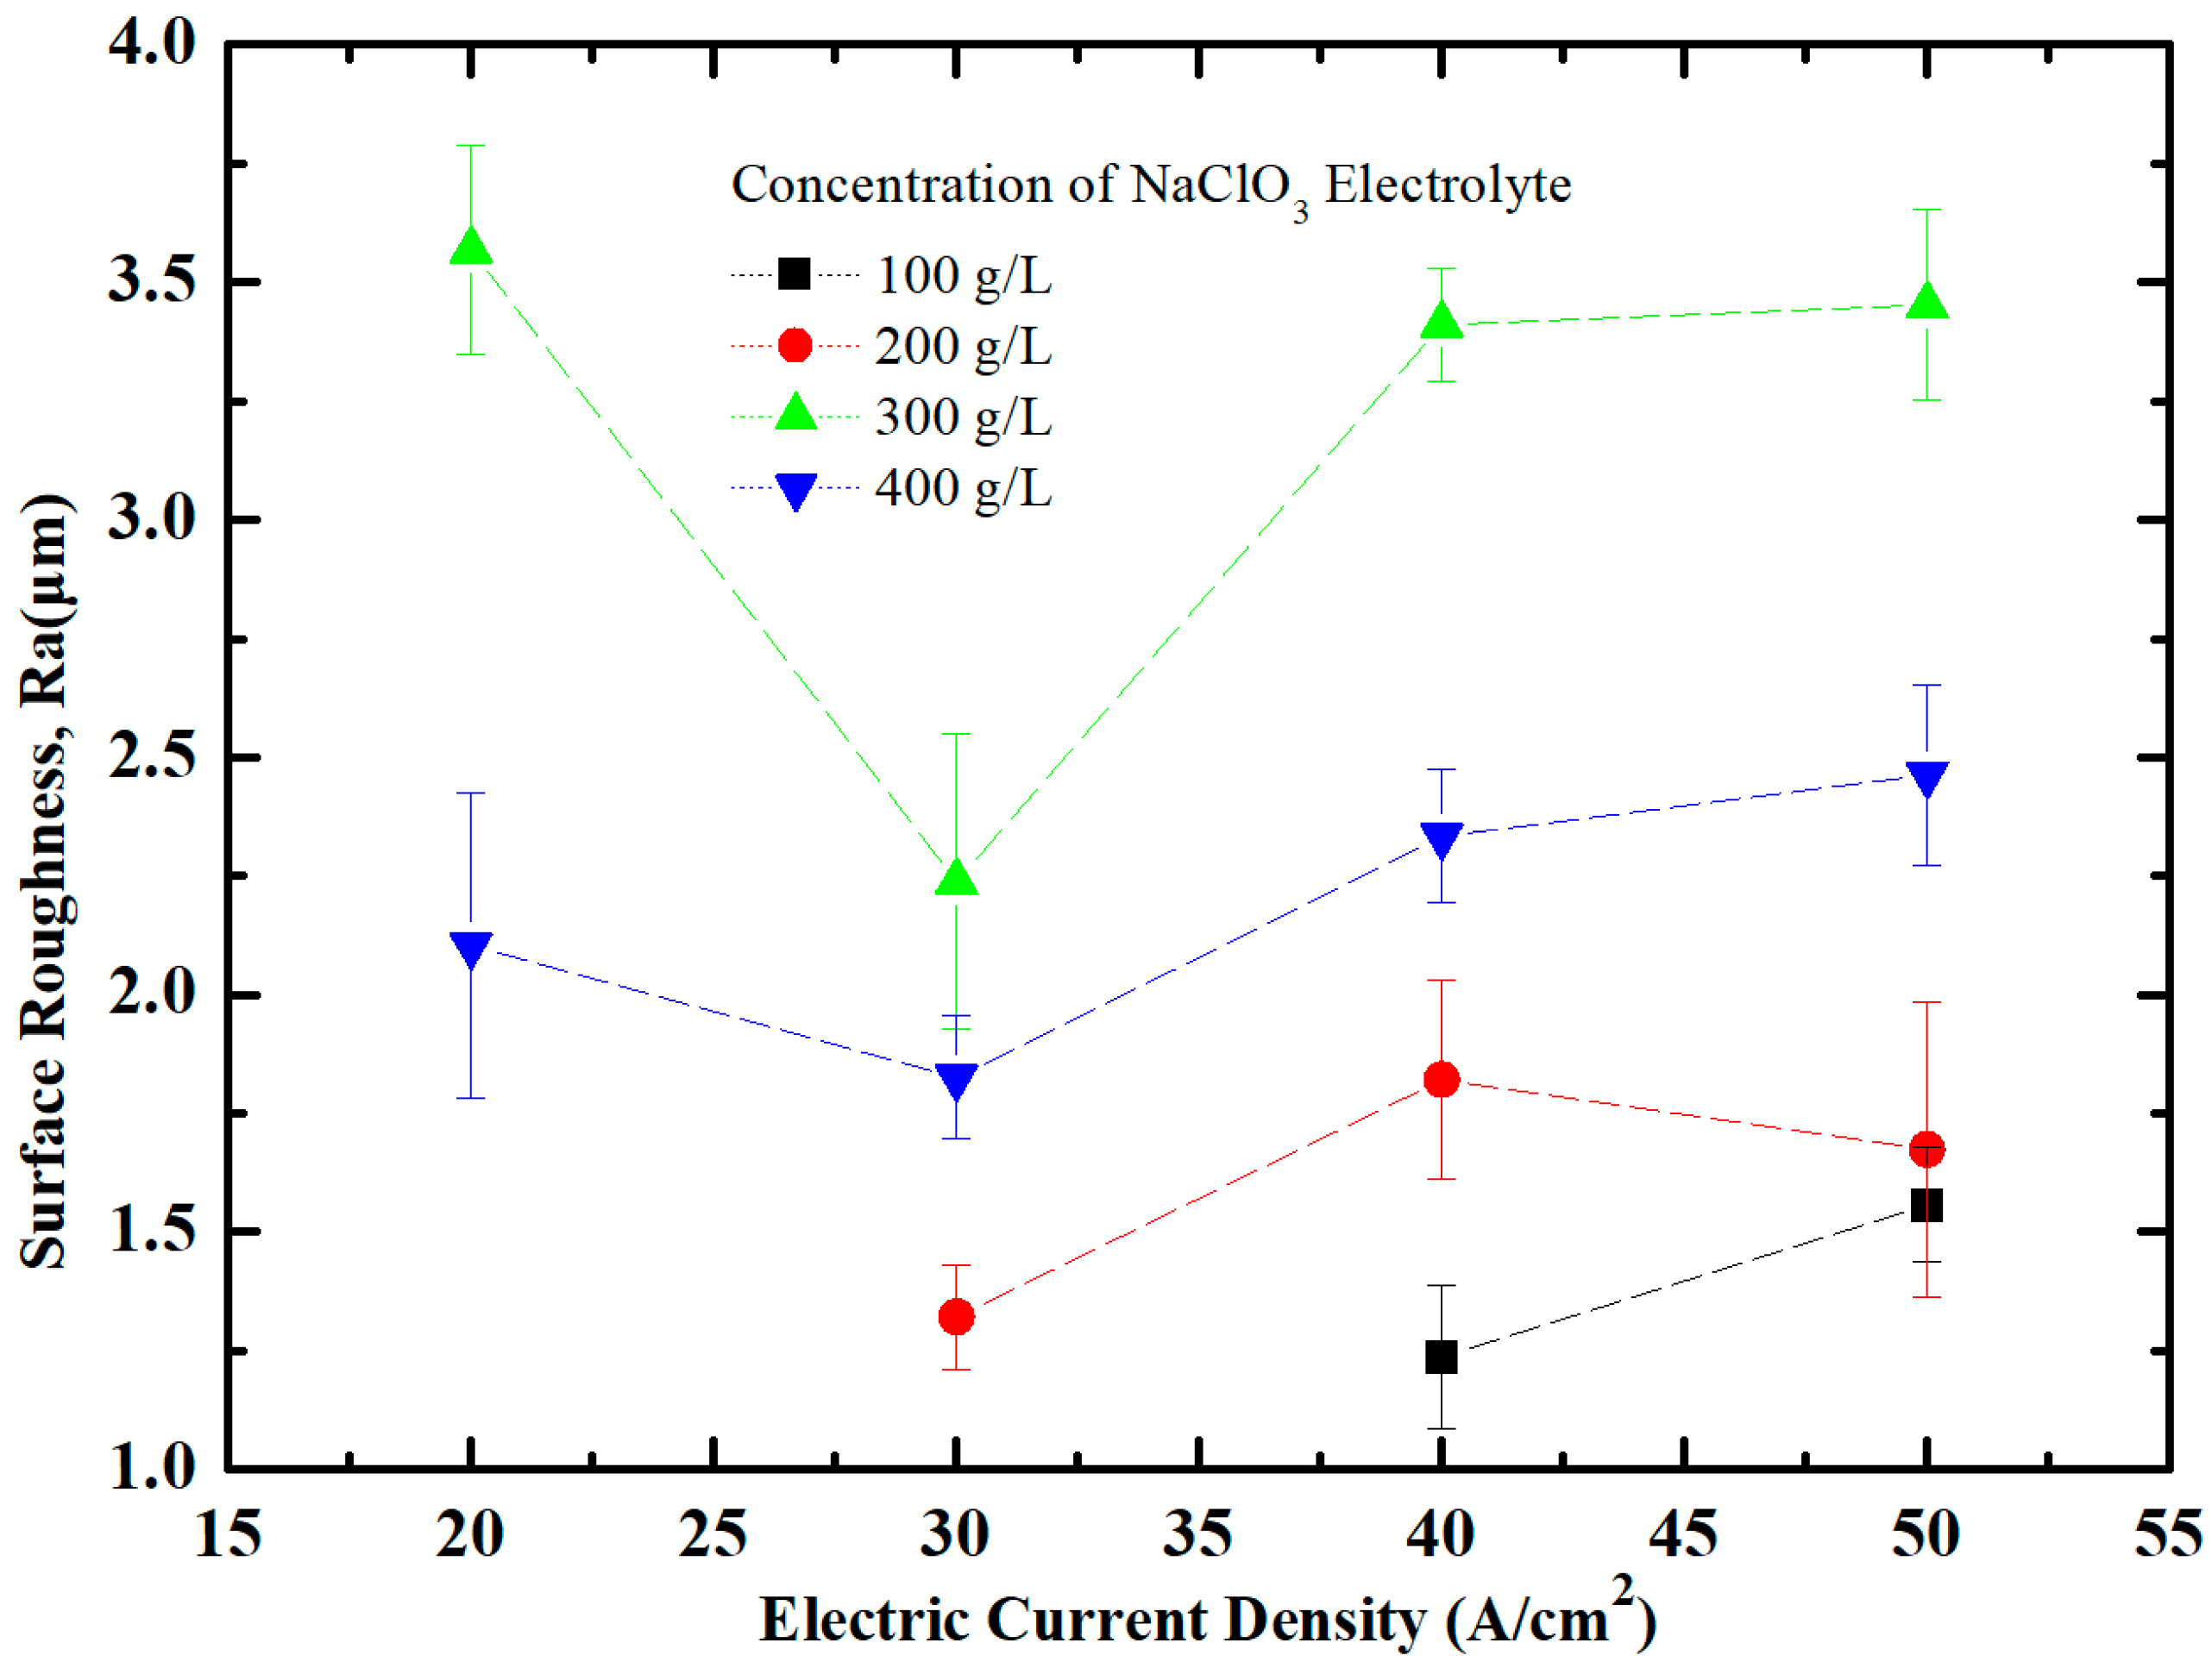
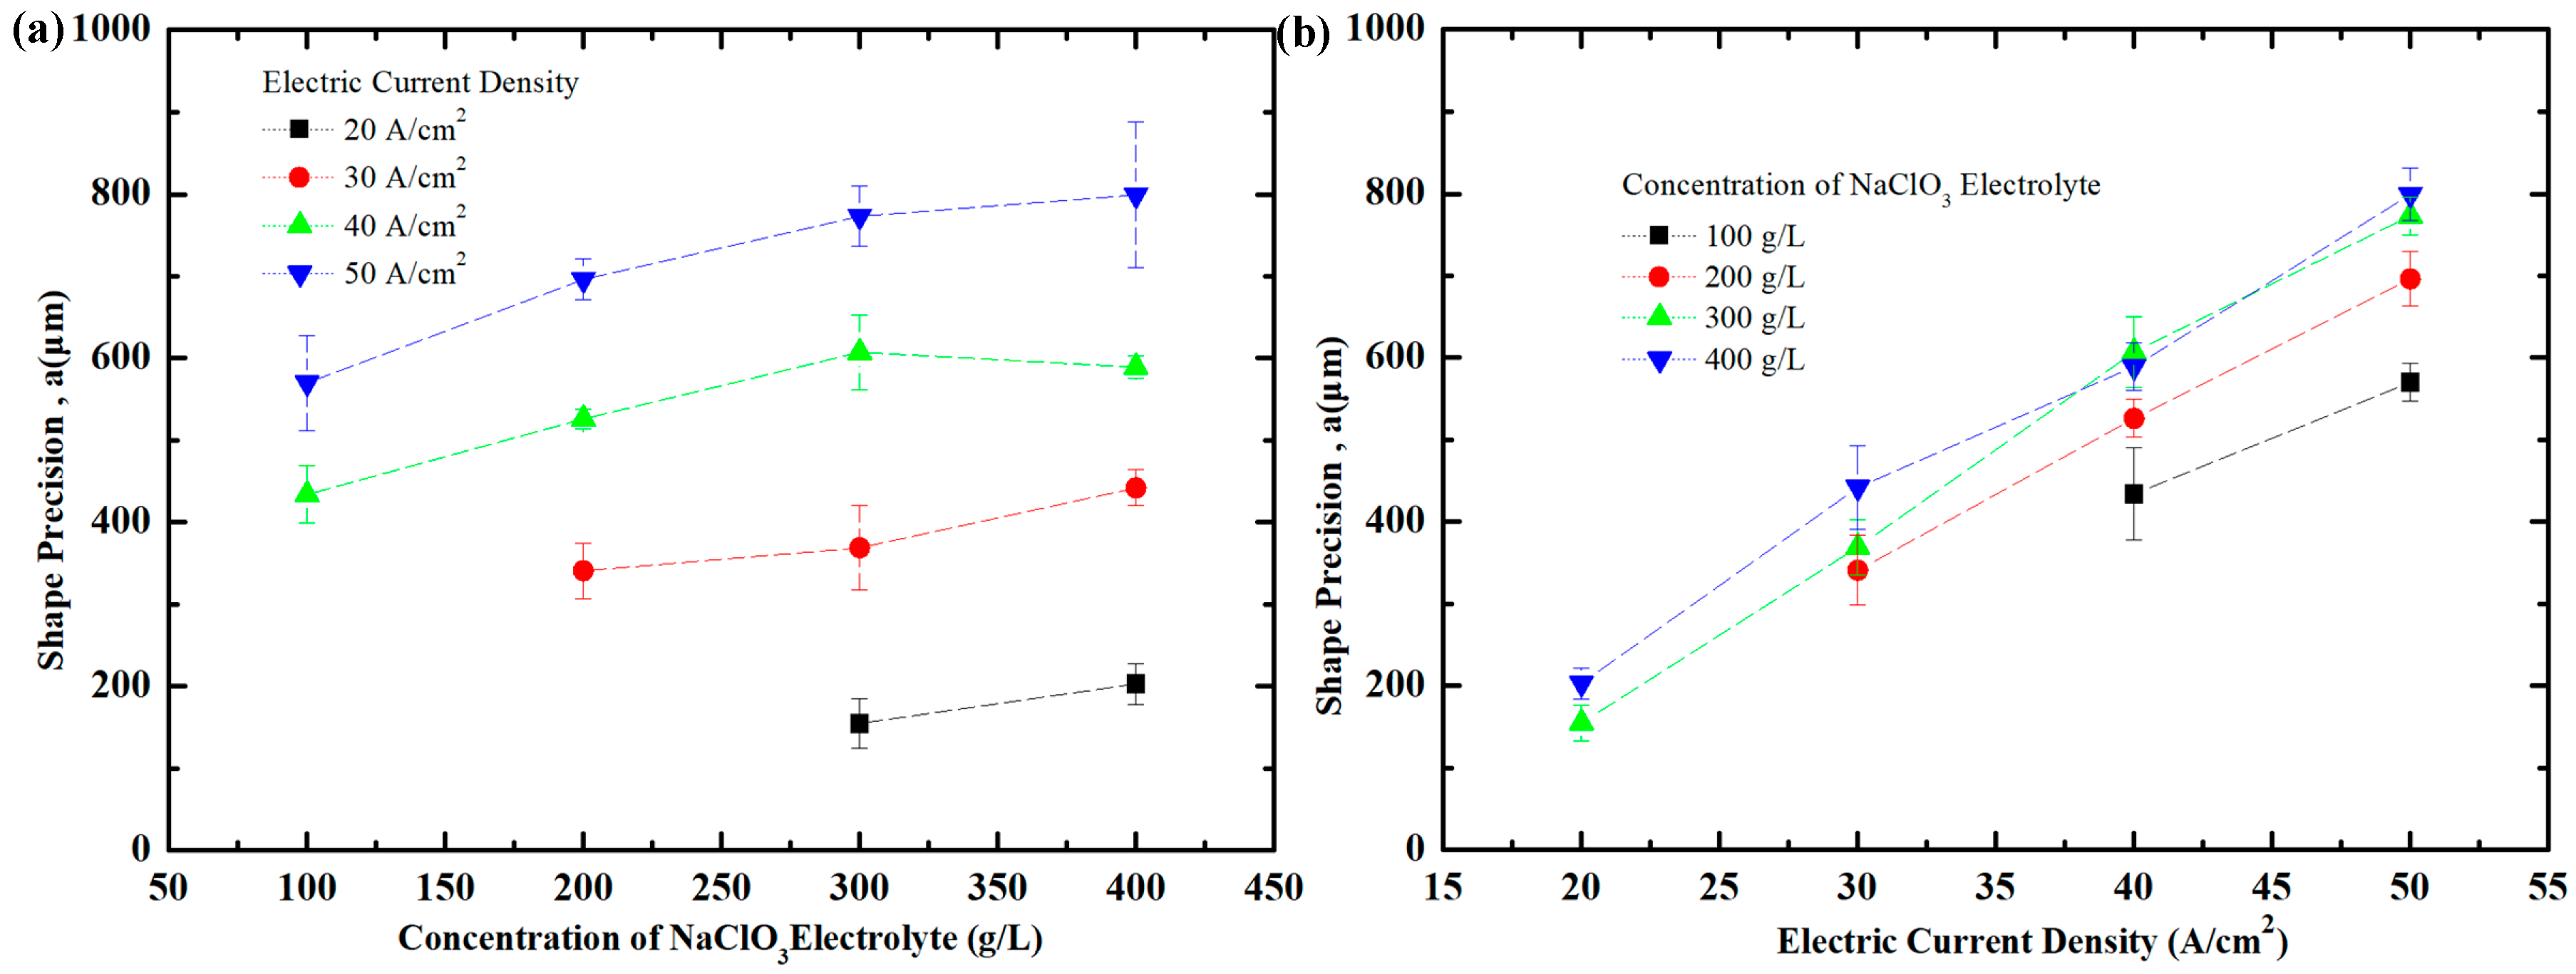
4.3. Effect of Current Density and NaClO3 Electrolyte Concentration on Shape Precision of Workpiece

Removing the result under low current density, the shape precision of the workpiece at different electrolyte concentrations is shown in Figure 13. It can be seen that the shape precision of the workpiece increased with the increasing electrolyte concentration. The dimension error became larger.
Figure 13 shows that the inner and outer circles of the workpiece had high integrity and better locality. The stray corrosion was not severe. The dimension of the inner circle decreased with the increase of electrolyte concentration. That is to say, the machining precision decreased gradually. Figure 13b shows the variation of shape precision at different current densities. It can be found that the shape precision increased gradually with the increase of the electrolyte concentration. It was similar with the machining in the NaCl electrolyte. The reaction of machining became more severe when the electric field strength increased. The corrosion at the machining boundary became more severe, and the shape precision became worse.

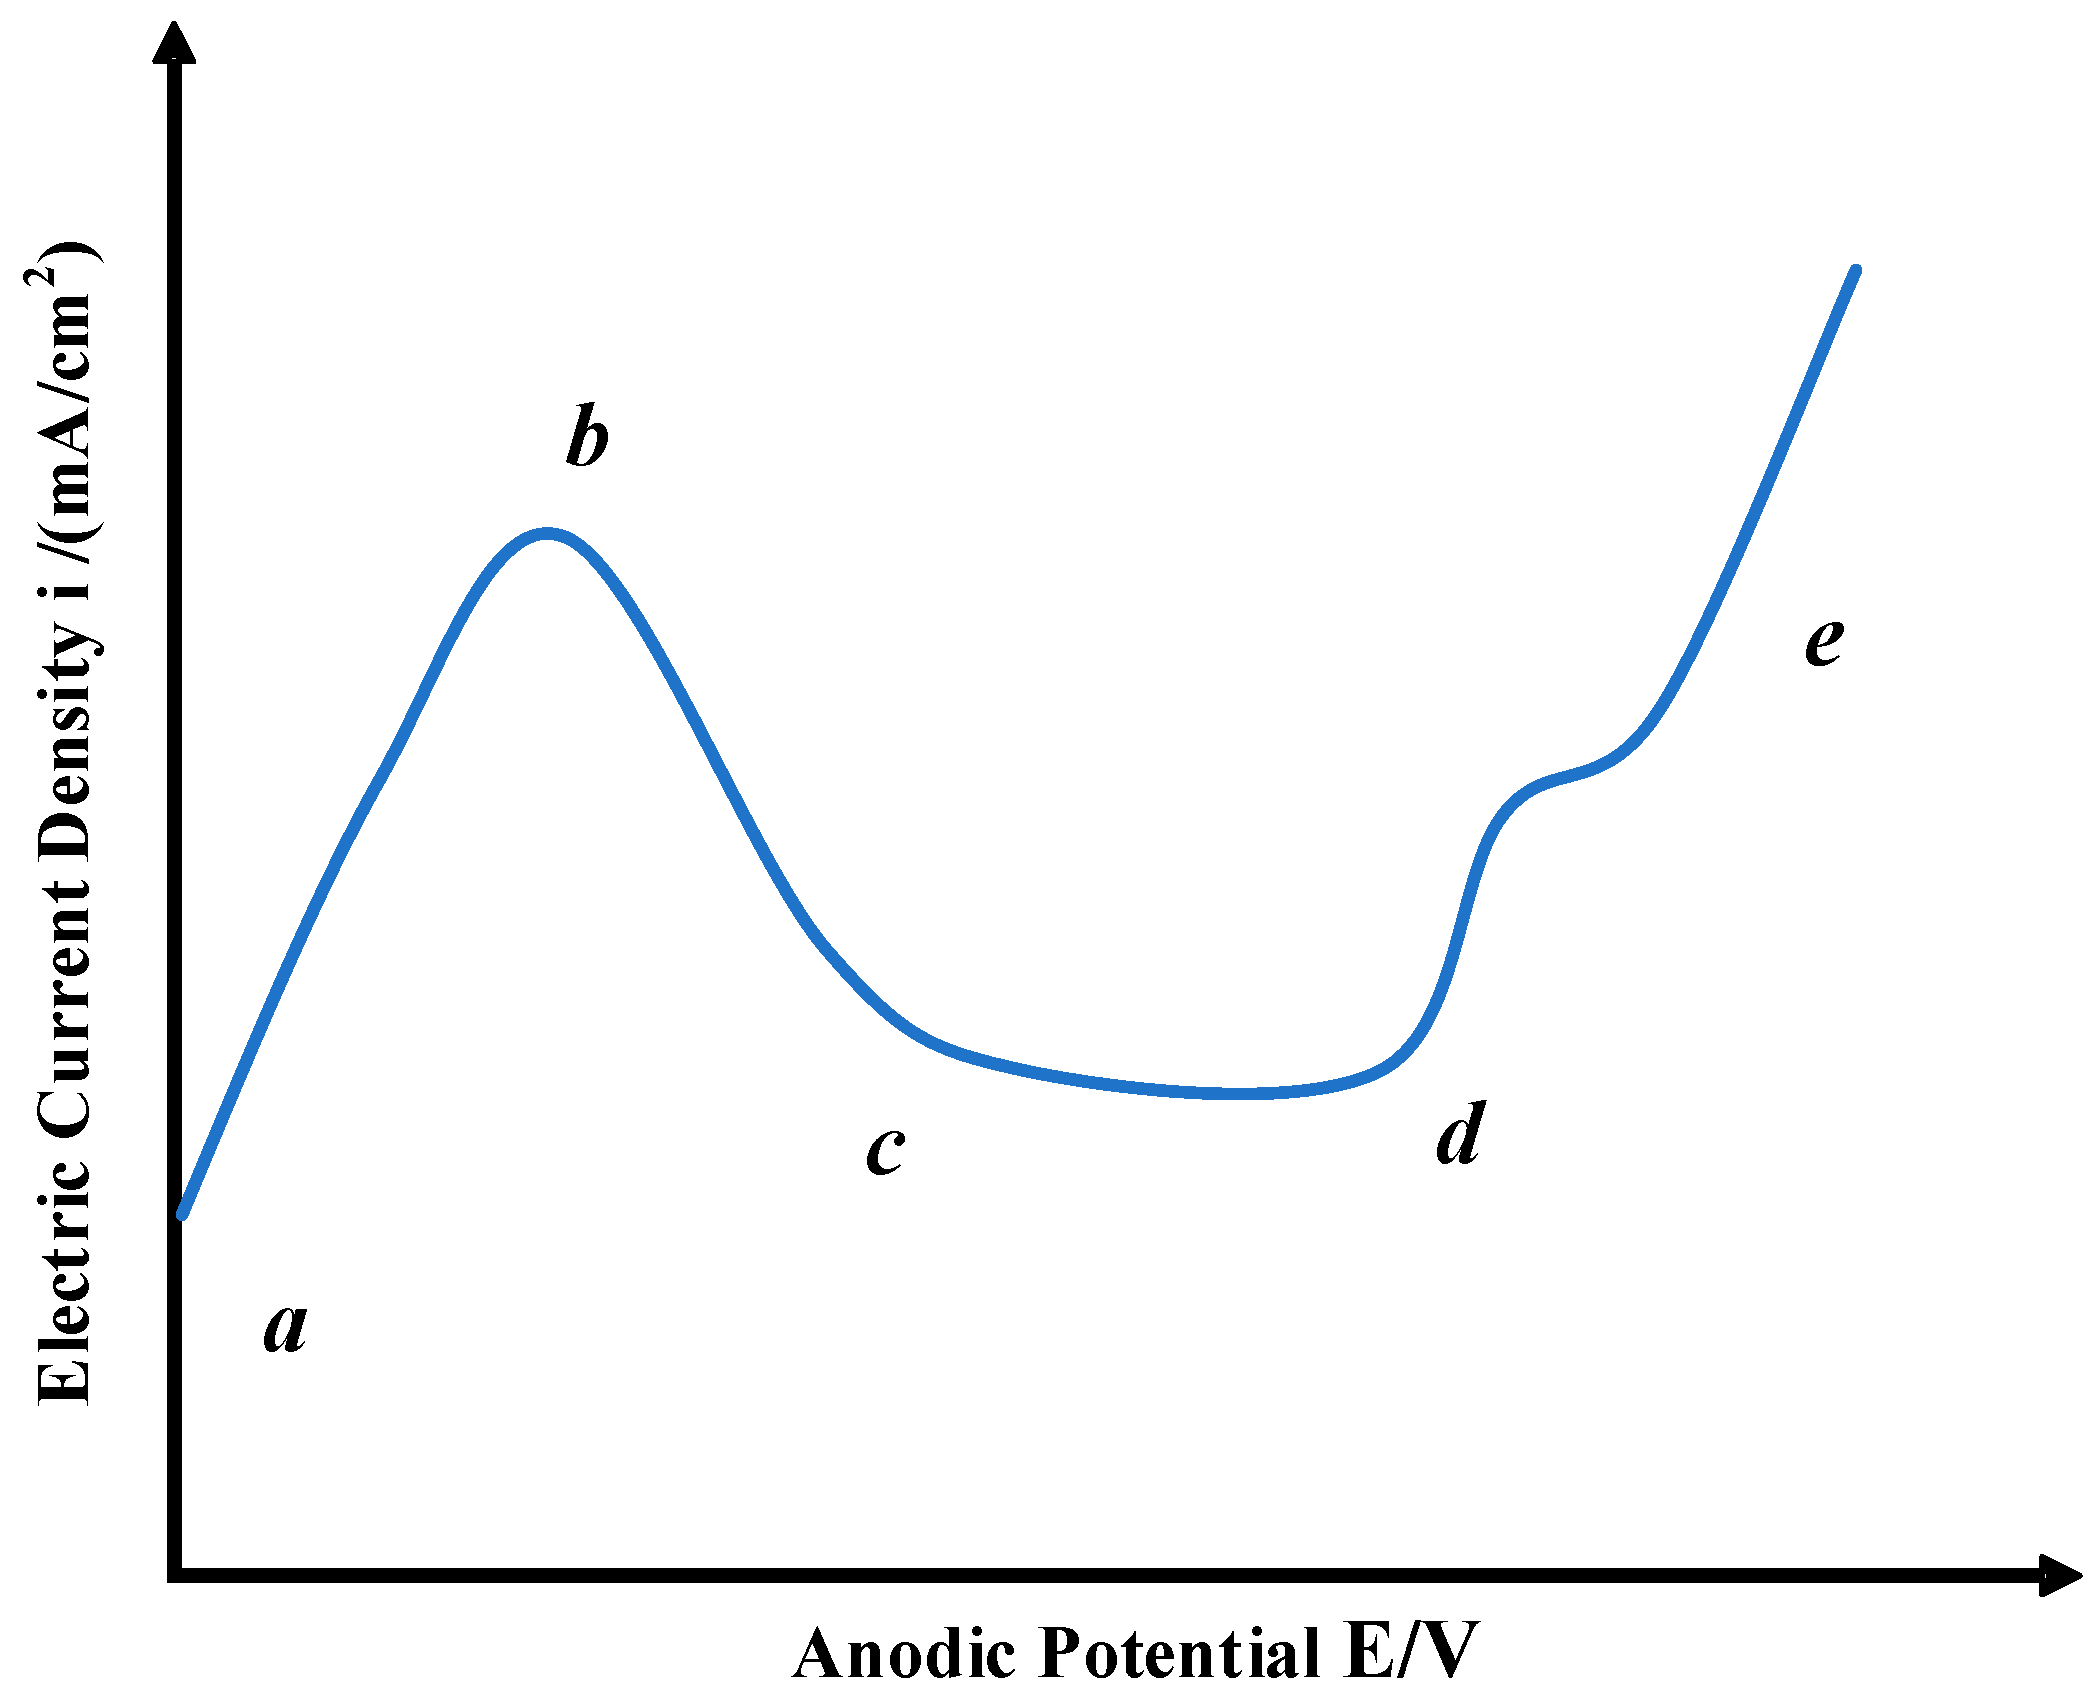
4.4. Electrolytic Reaction Principle of 35CrMo Steel in NaClO3 Electrolyte

Figure 14 shows the polarization curve of NaClO3 [29]. The current density increased with the increasing of the electrode potential at a–b section. The passive film formed at point b and then current density decreased. The electrode was in a passivation state at c–d section. That is, the current density did not change with the increasing of the electrode potential. The electrode was in a transpassivation state at d–e section and the current density increased with the increasing of the electrode potential.
According to the analysis of the experiment above, the 35CrMo steel near the cathode was in a transpassivation state owing to the large electric field strength. The passive film generated by anode was penetrated by intense current and then the metal dissolved continuously and the process went on smoothly. The metal far away from the electrode was in a passivation state owing to the low electric field strength. The passive film could not be destroyed by the current. So, the metal could not dissolve. Consequently, the stray corrosion could be well controlled by using NaClO3 solution as the electrolyte. At the same time, the machining precision could also be guaranteed.
The reaction of electrode during the machining can be described as followed [28,29,30]:
(1) Anodic reaction
① Similar to the process in the NaCl solution, the metal in anode dissolved:
Fe 2 e Fe 2 +
In addition, because of strong oxidizing property of ClO3 in the solution, Fe2+ was quickly oxidized to Fe3+:
6 Fe 2 + + ClO 3 + 6 H + 6 Fe 3 + + Cl + 3 H 2 O
Similar to the process in the NaCl electrolyte, a dark green sediment was generated at anode, and then transformed into Fe(OH)3, a reddish-brown sediment, on the effect of its own oxidation.
(2) Cathodic reaction
There were H+, Na+, Fe2+, Fe3+ and Cr3+ in the solution. According to the principle of electrode reaction, H+ firstly took part in the reaction. Others were similar to the reaction in the NaCl electrolyte.
2 H + + 2 e H 2

5. Electrochemical Machining Experiment and analysis Of NaNO3 Electrolyte

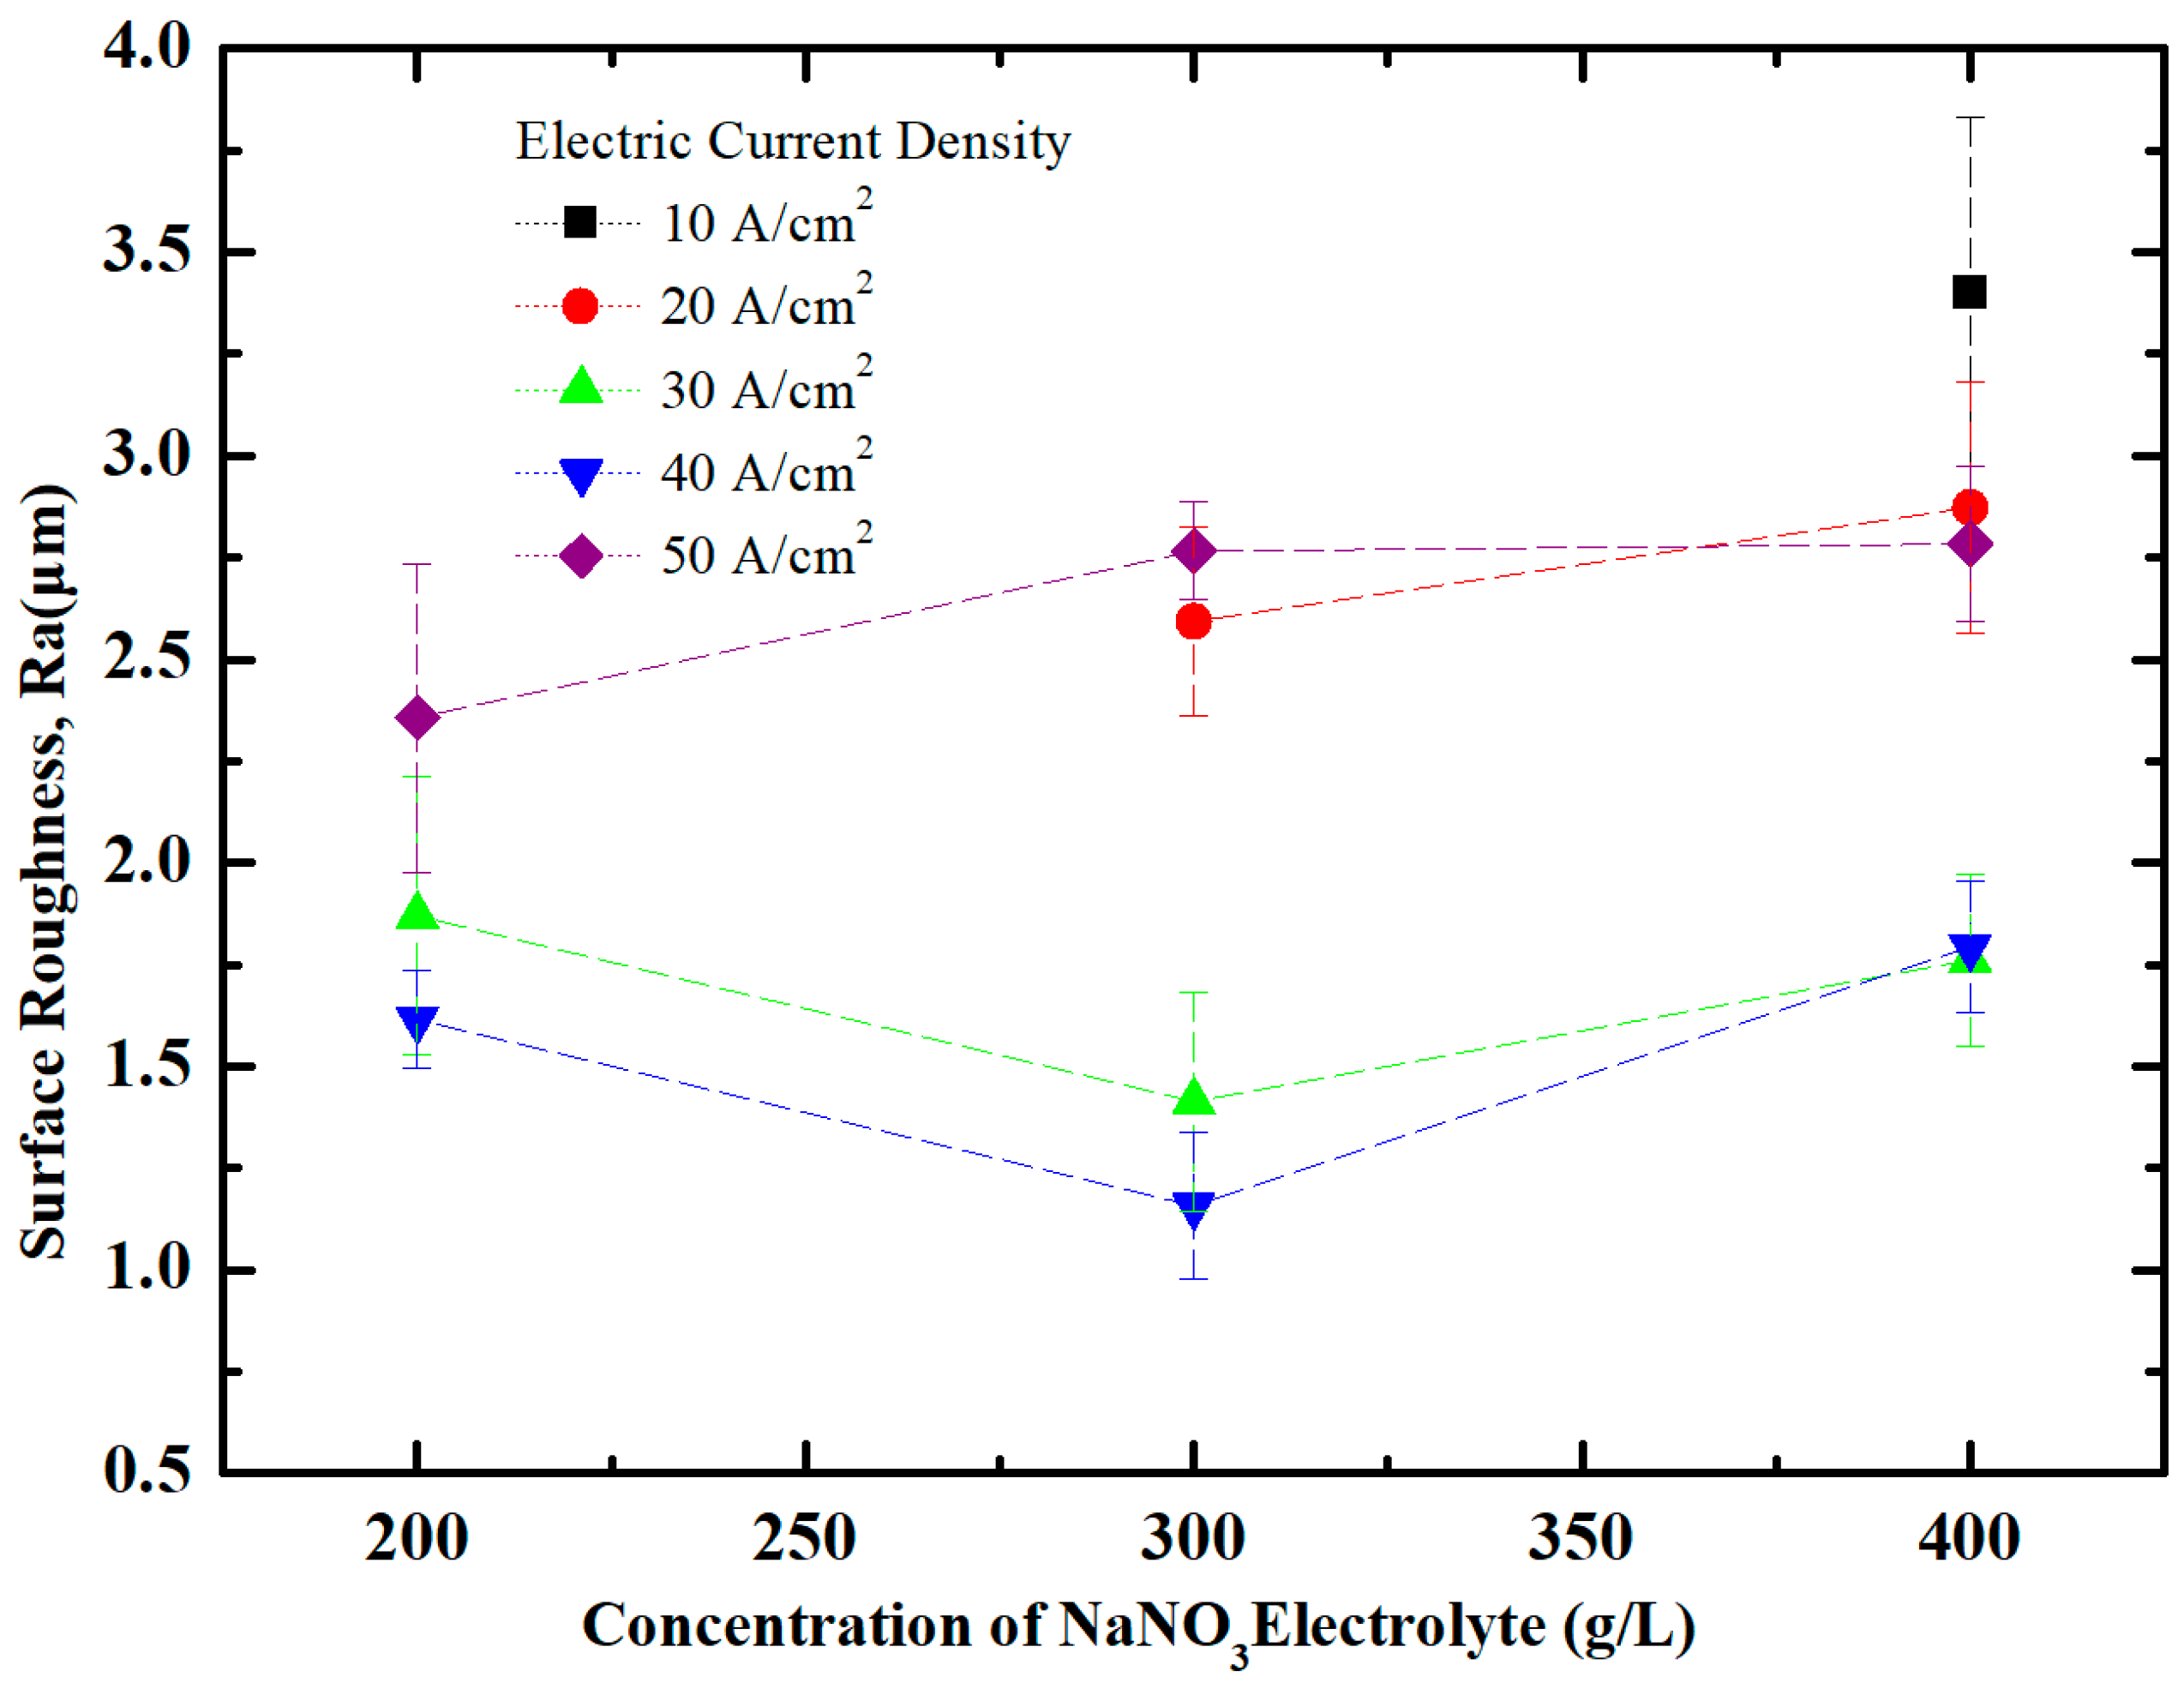
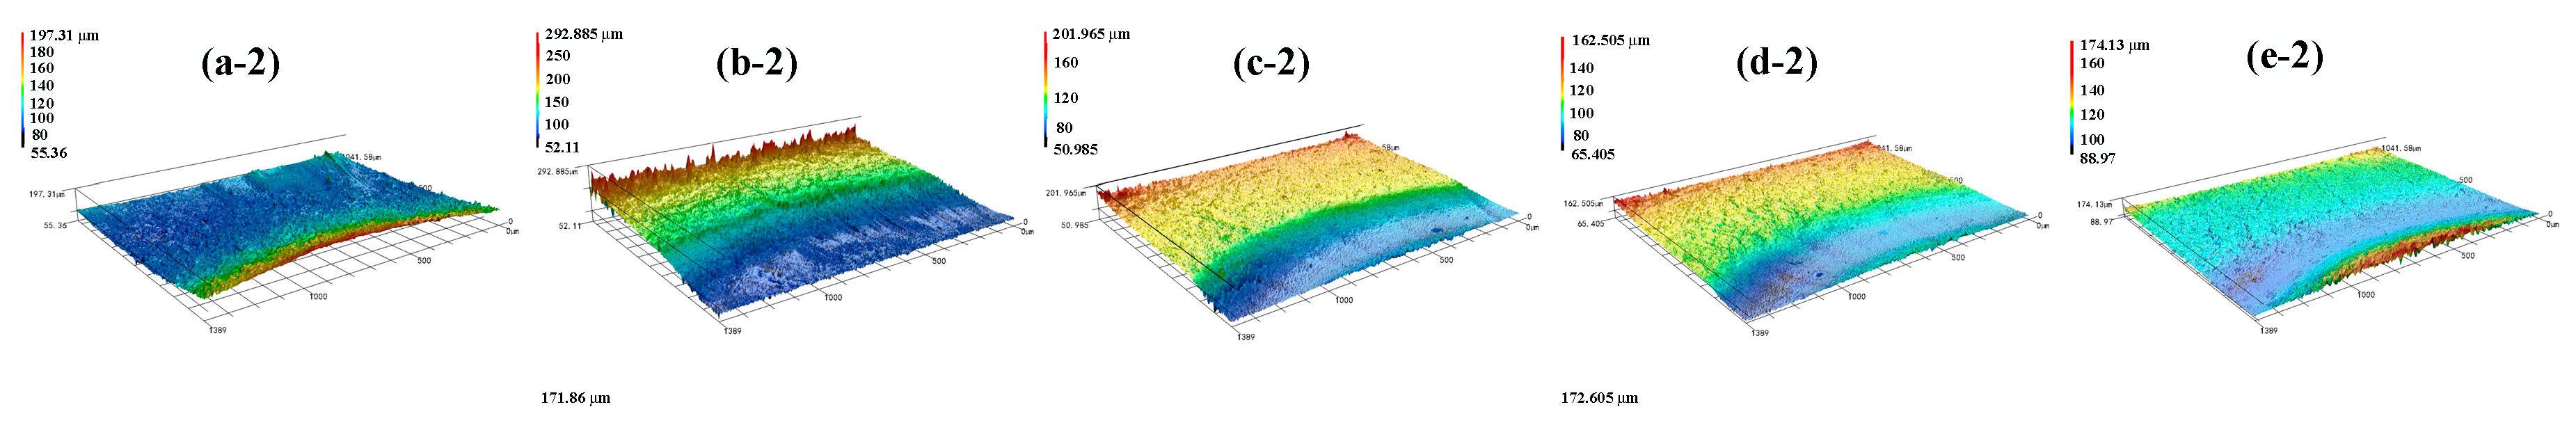
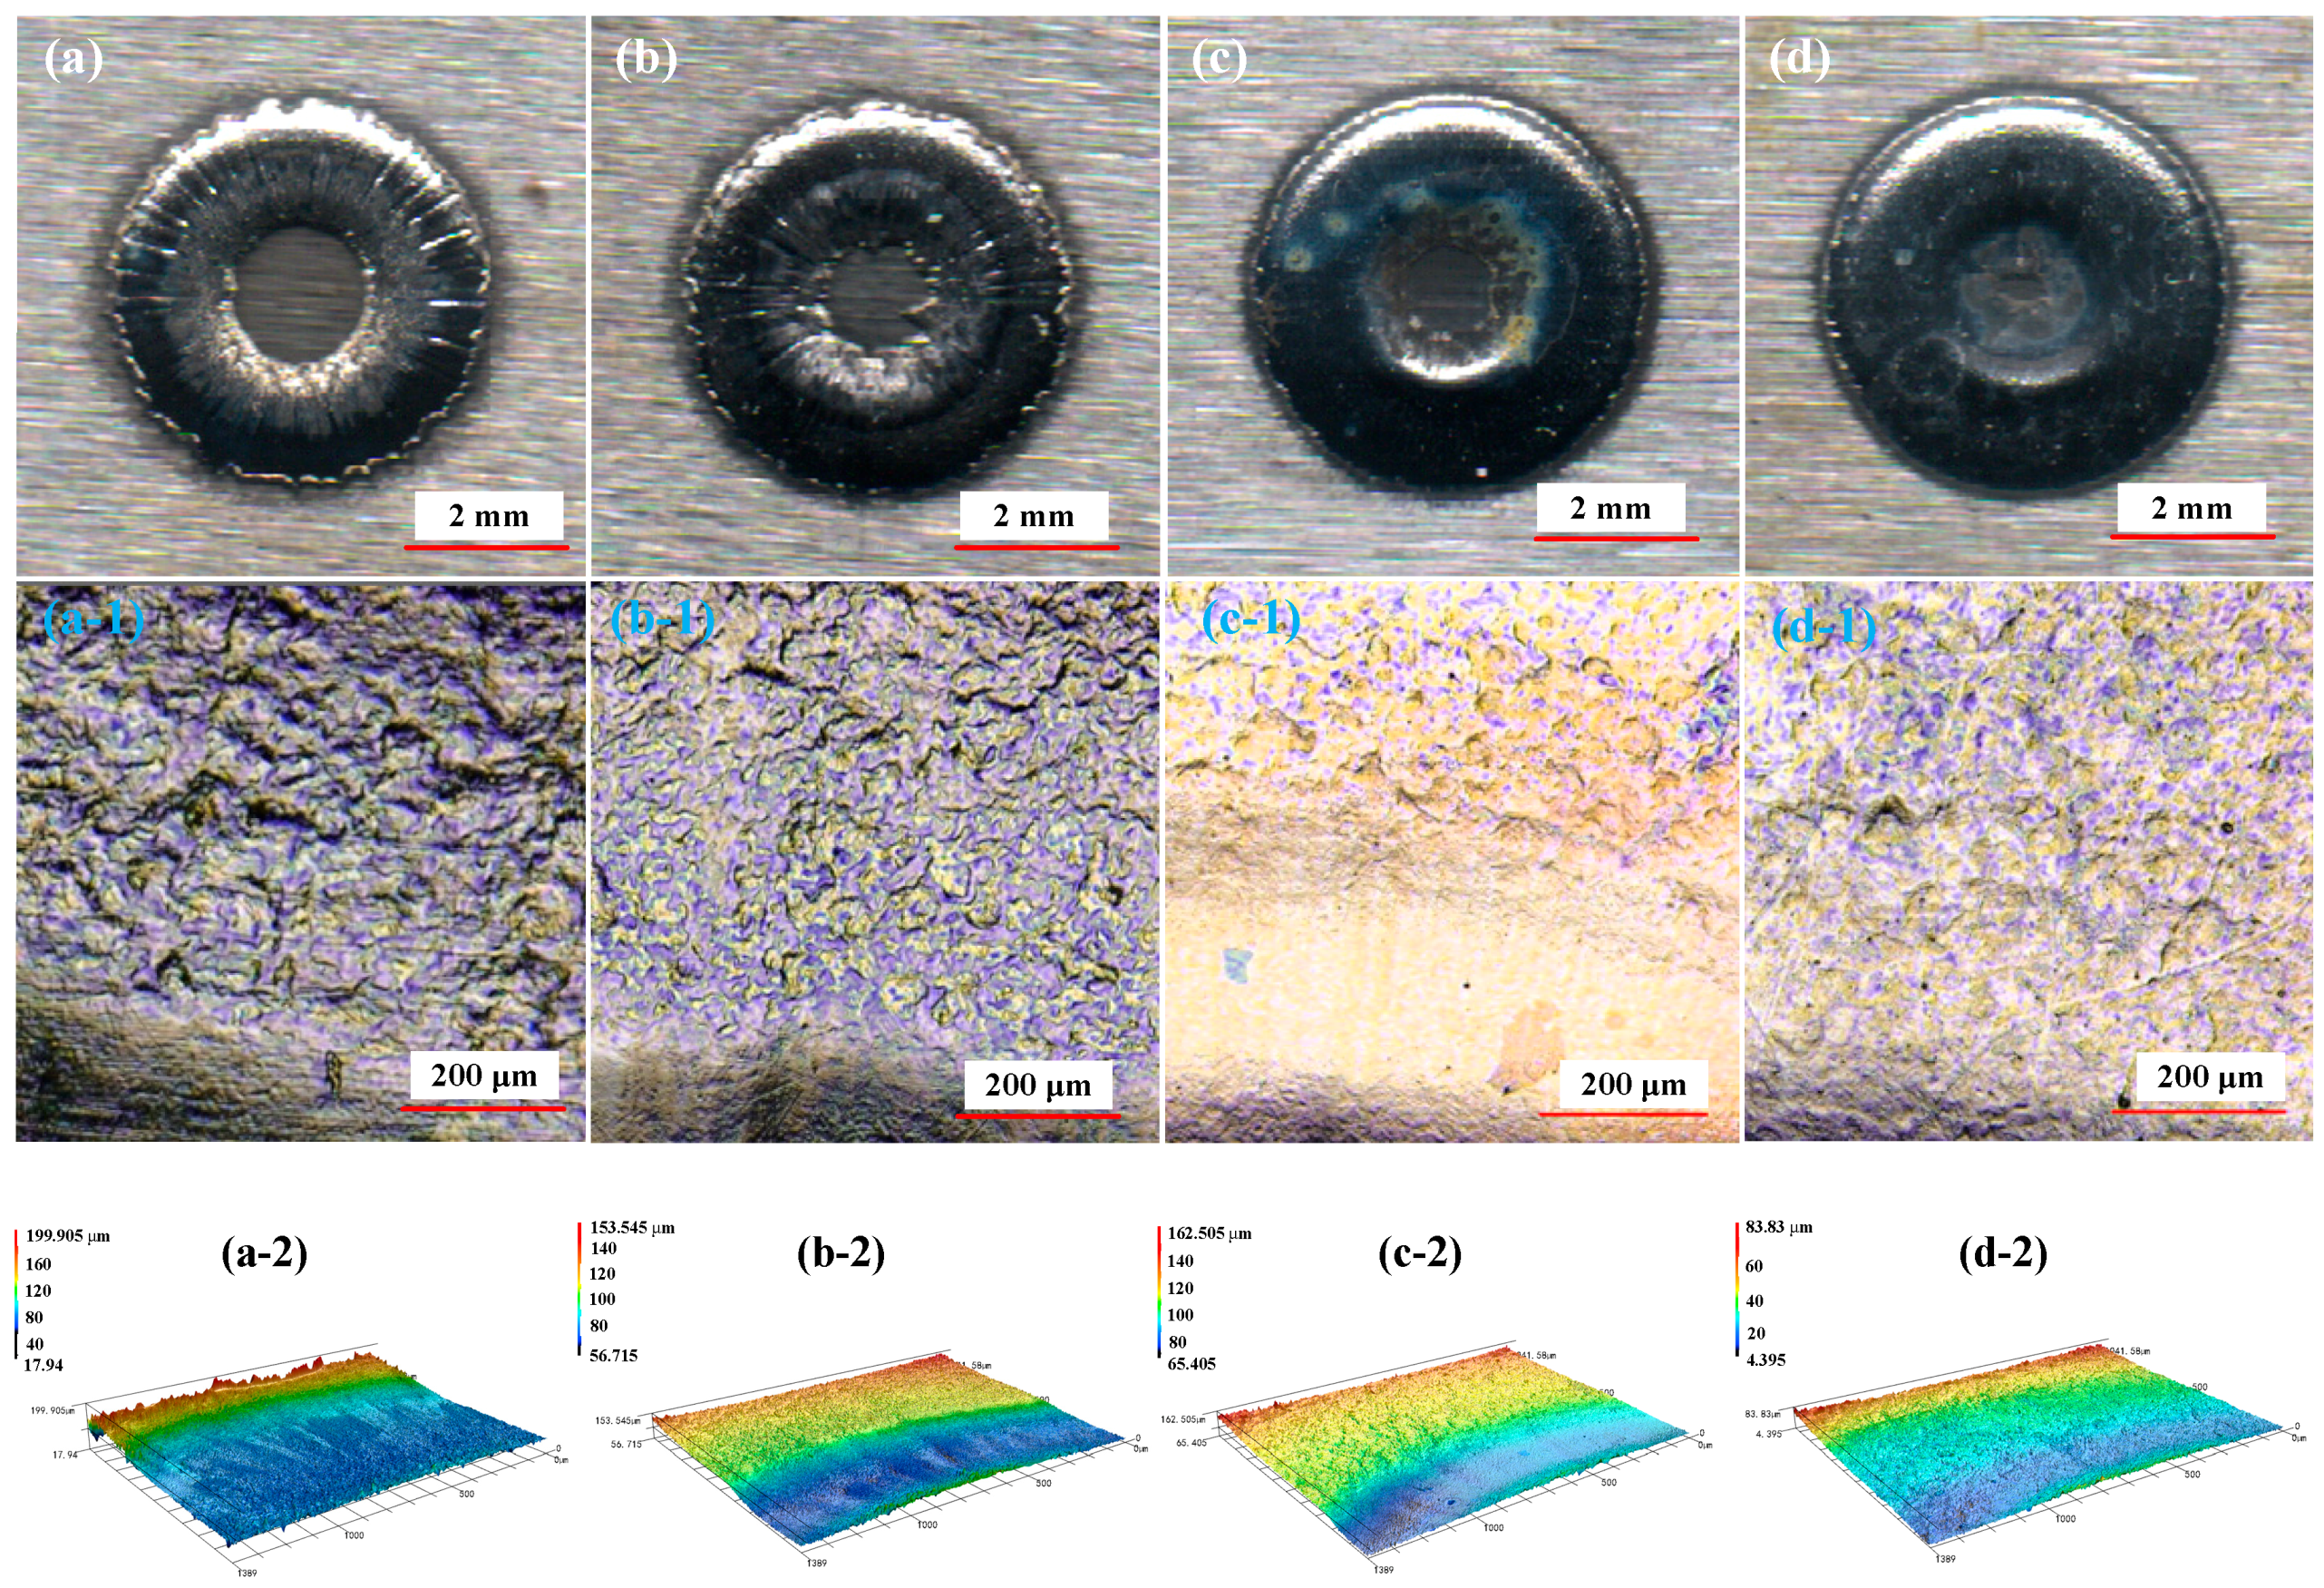
5.1. Effect of NaNO3 Electrolyte Concentration on Surface Quality of Workpiece

The slight passivation would occur on the surface of 35CrMo steel in the NaNO3 electrolyte. The workpiece protected by the passive film could not be machined under low electrolyte concentration and low current density. Figure 15 shows the surface roughness of the workpiece at different electrolyte concentrations. The mean values with large error under low electrolyte concentration and low current density were discarded. It was found that the workpiece surface roughness dropped first, and then rose with the increasing of electrolyte concentration and the workpiece had the minimum surface roughness at an electrolyte concentration of 300 g/L.
Figure 15 shows that the workpiece had the minimum surface roughness at a current density of 40 A/cm2. So, under this circumstance, the surface morphology of the workpiece after machining at different concentrations of NaNO3 electrolyte is shown in Figure 16.
Figure 16 shows that the workpiece had a rough surface when the concentration was low. The machining surface became exquisite with increasing electrolyte concentration. The workpiece had the best surface quality at a concentration of 300 g/L, while the surface roughness increased again with the continuous increasing of the electrolyte concentration. The surface morphology of workpieces at different concentrations at a current density of 300 g/L is shown in Figure 16(a-1–d-1). It can be seen that the workpiece had a rough surface when the concentration was low. The machining surface became exquisite with the increasing of the electrolyte concentration.

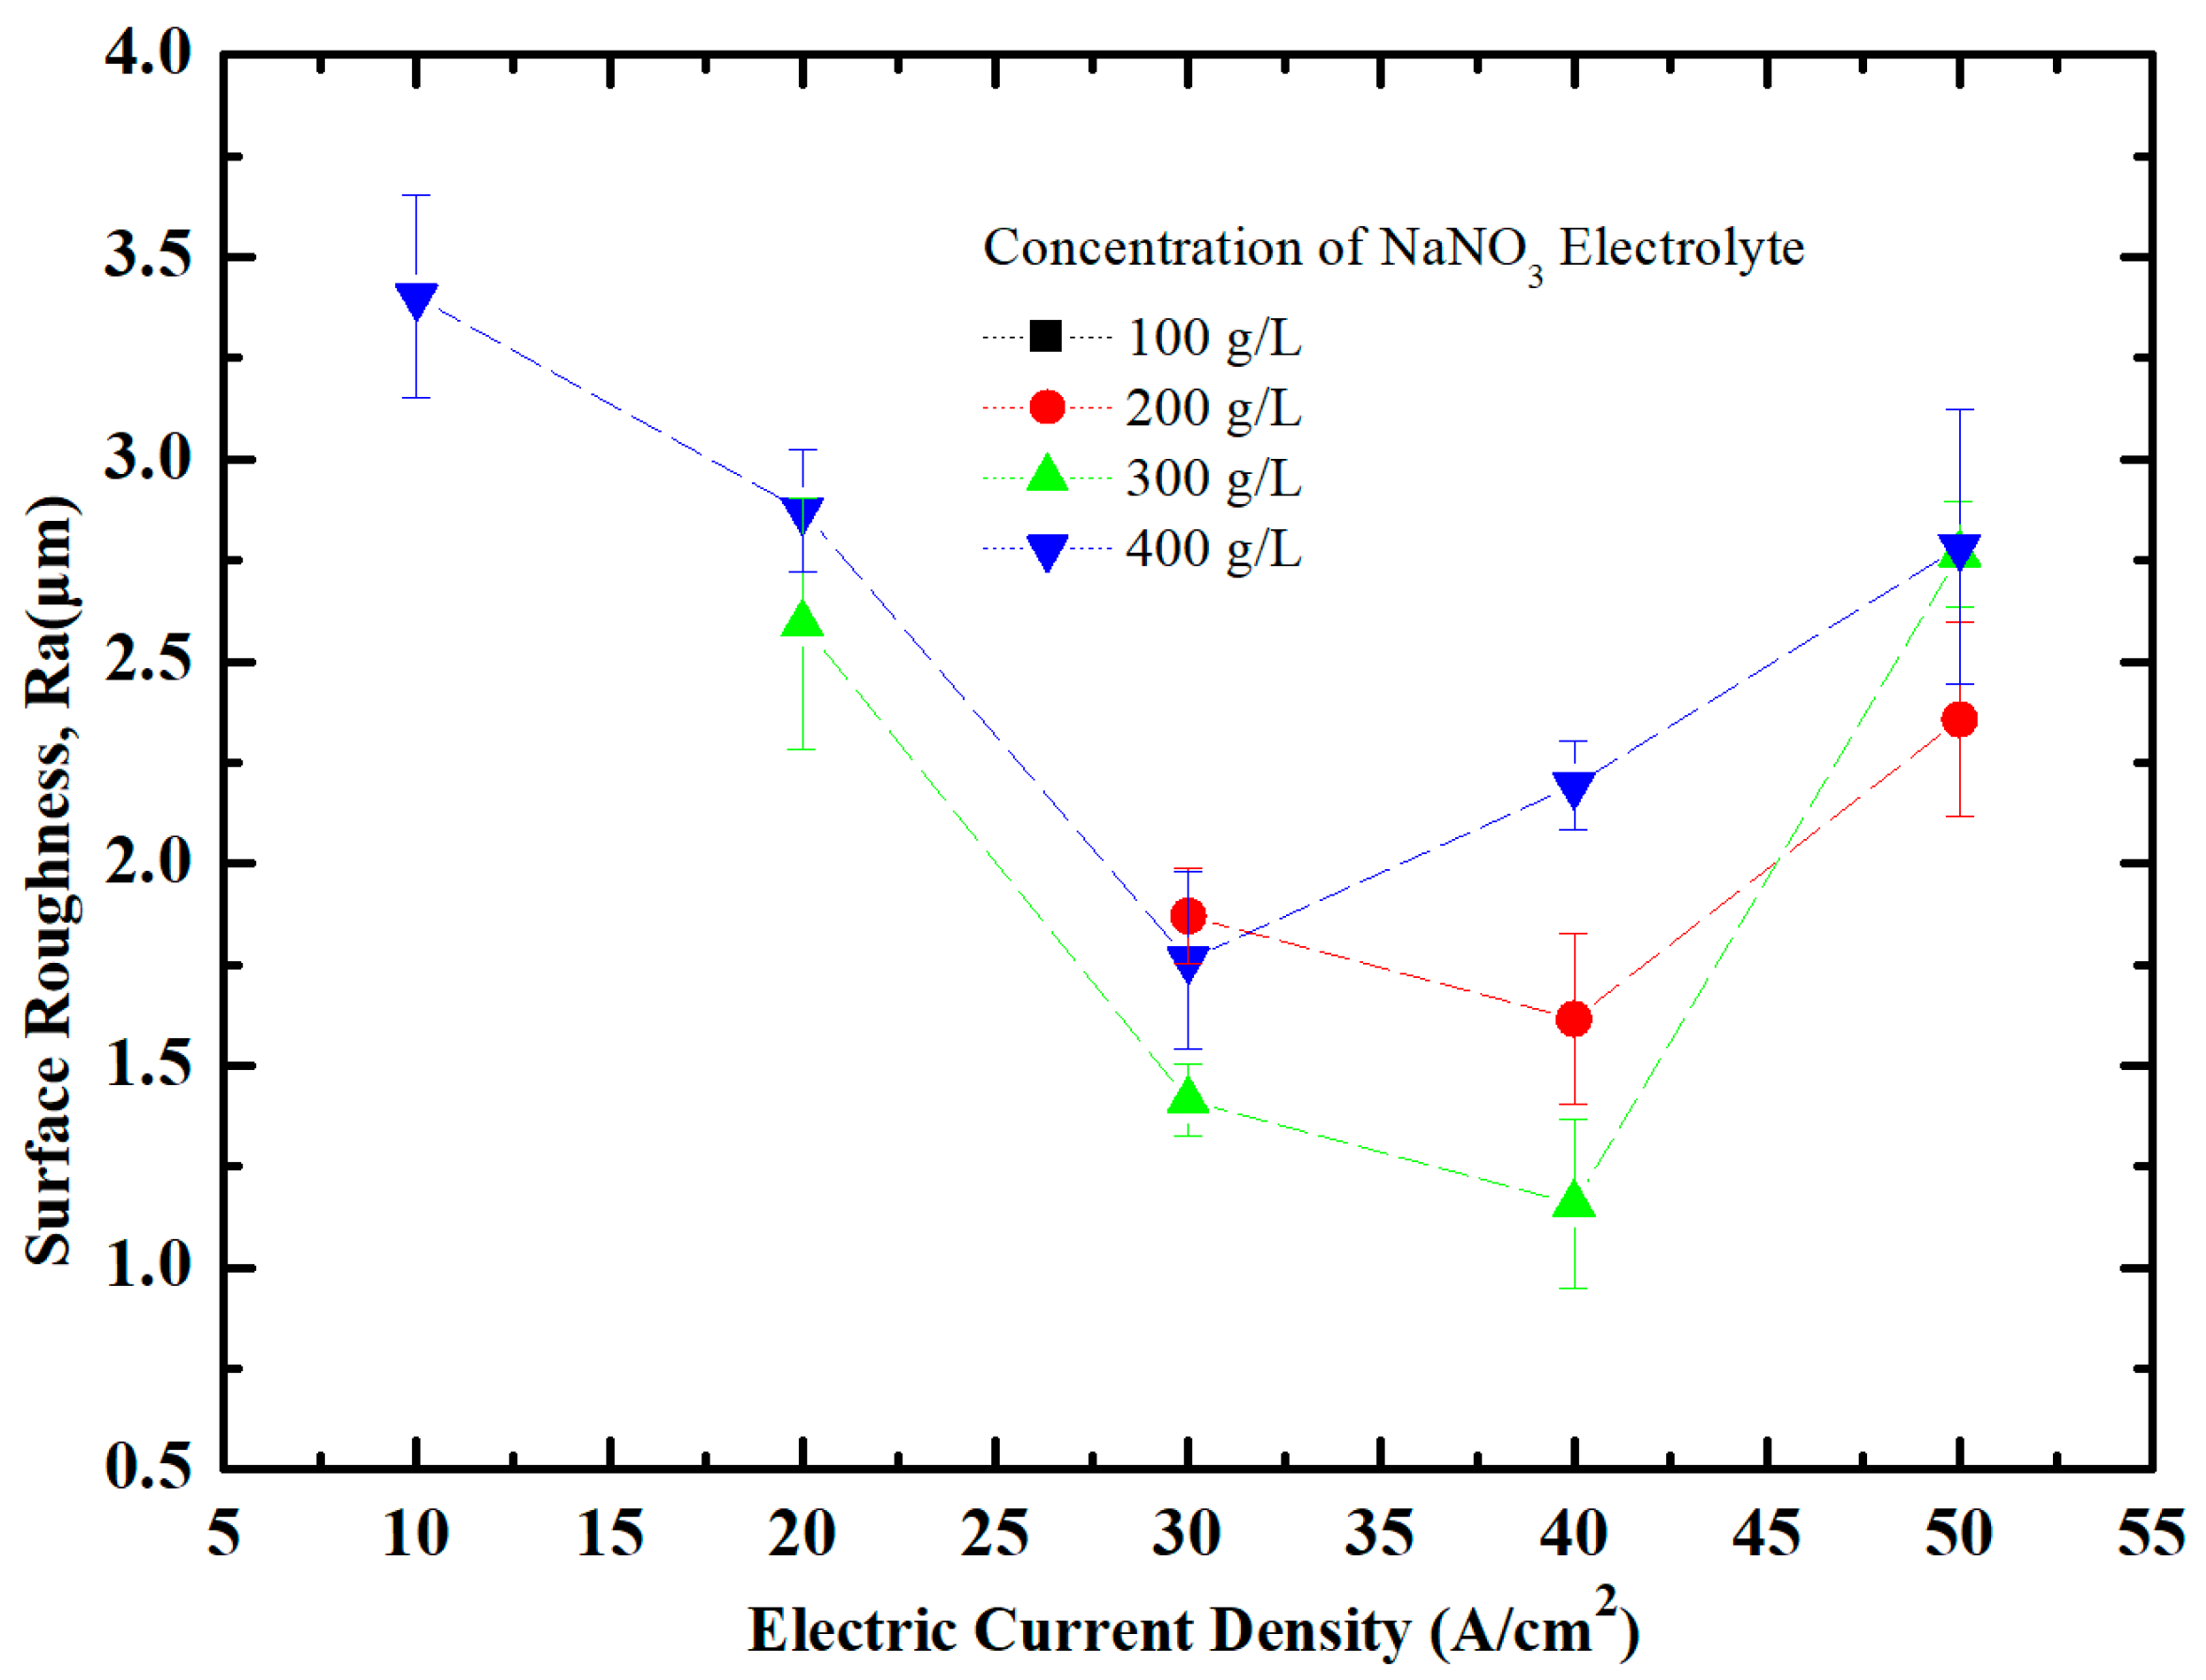
5.2. Effect of Current Density on Surface Quality of Workpiece

Figure 17 shows the surface roughness of workpiece at different current densities. It can be seen that valid data cannot be obtained under low current density. The workpiece surface roughness at the same electrolyte concentration dropped first, and then increased with the increasing of current density. The best surface quality was obtained at a current density of 30–40 A/cm2.
The surface morphology of workpieces at different current densities is shown in Figure 18. It can be seen that the electrochemical machining could not be performed at a low current density. The surface of the workpiece was sags and crests. The surface of the machining domain became smooth with increasing current density. The surface morphology is shown in Figure 18(a-1–d-1). It can be seen that the surface of the workpiece became smooth gradually and the surface quality became better. The best surface quality was obtained at a current density of 40 A/cm2.

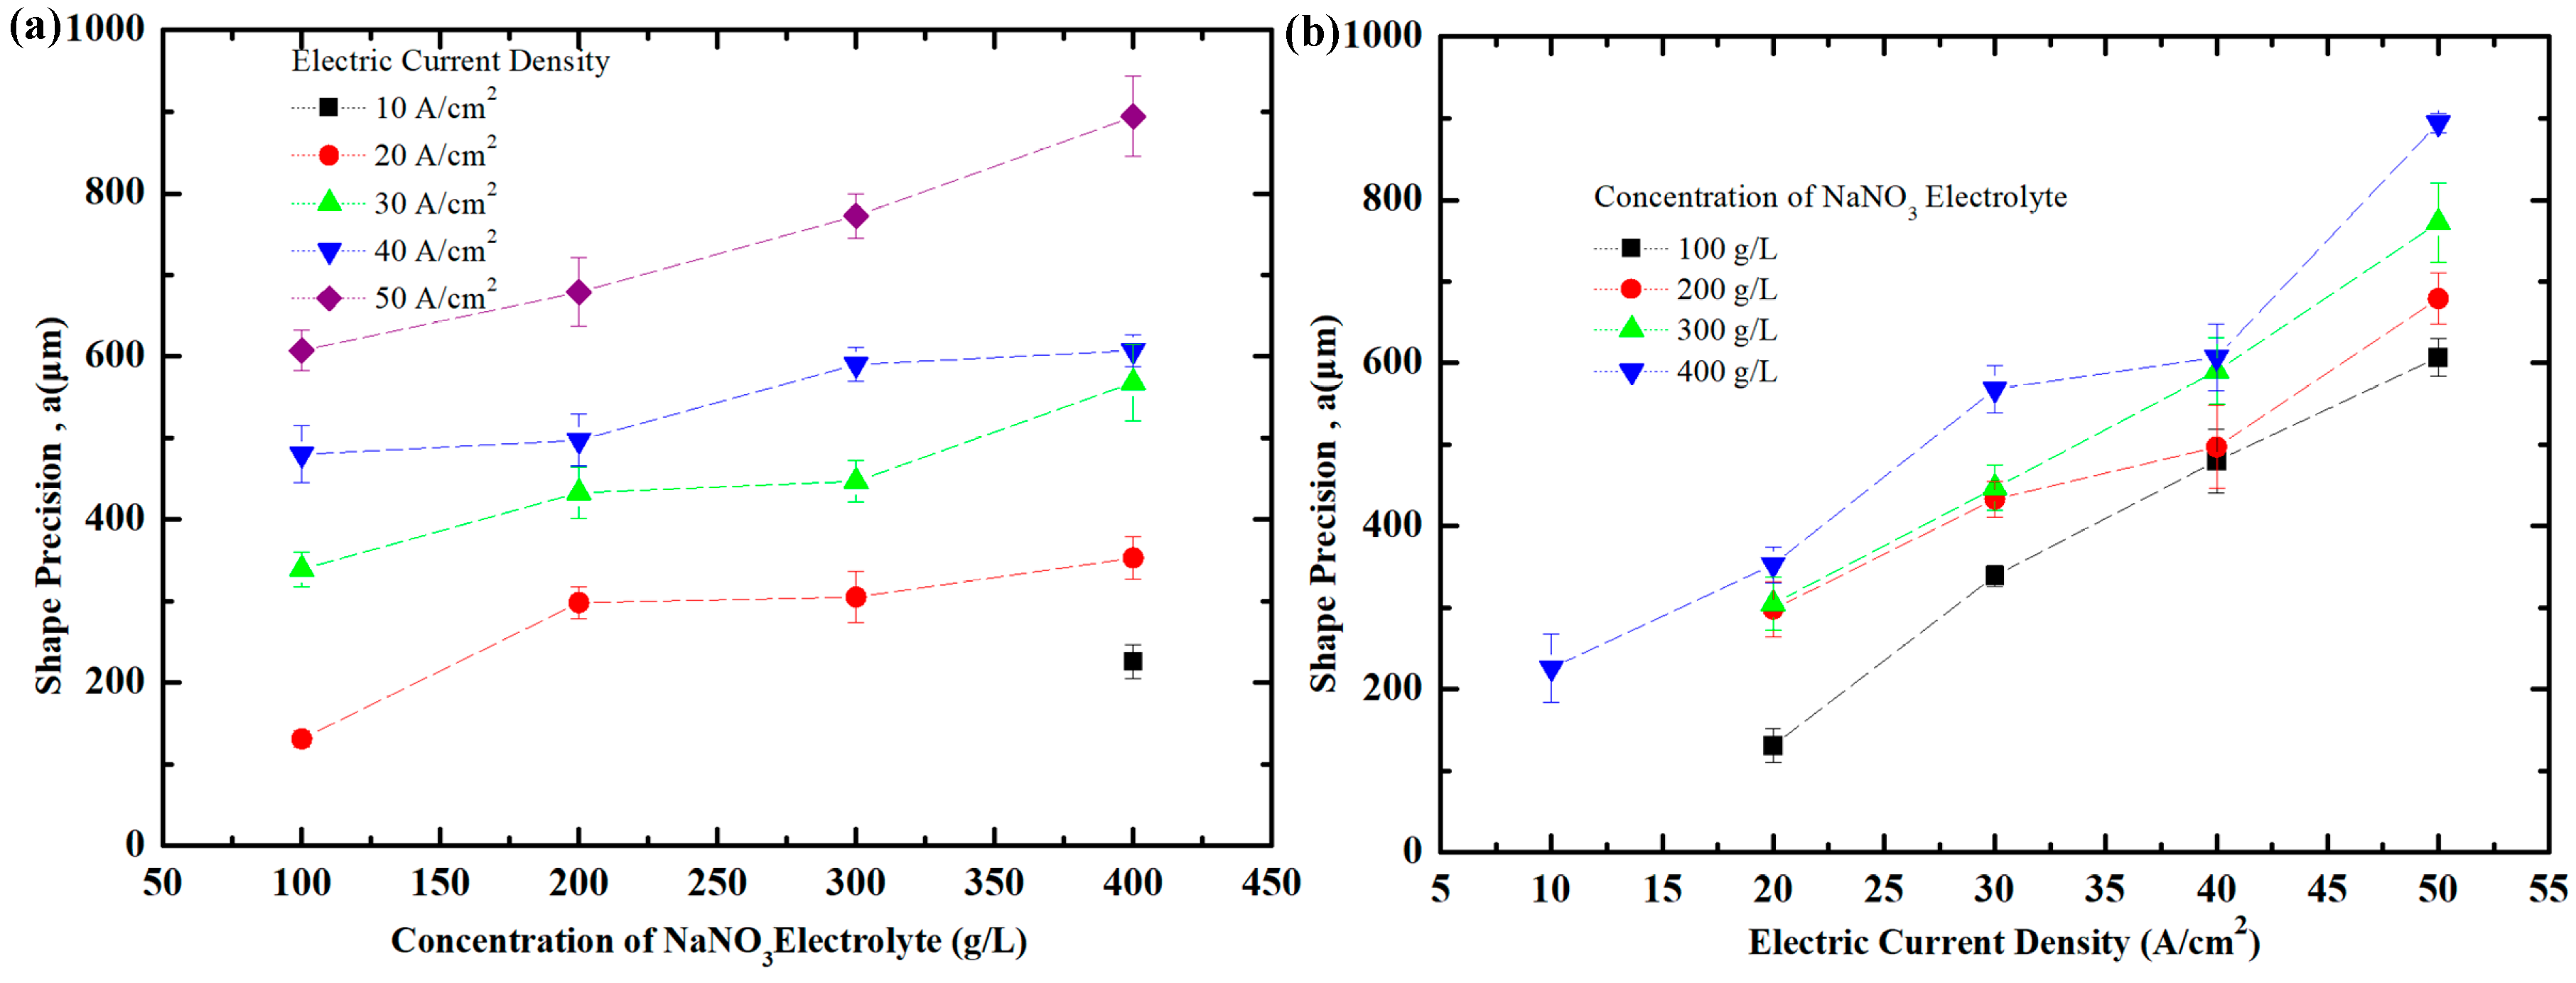
5.3. Effect of Current Density and NaNO3 Electrolyte Concentration on Shape Precision of Workpiece

Figure 19 shows the shape precision of the excircle at different current densities and different electrolyte concentrations. It can be found that the shape precision increased with increasing electrolyte concentration, which was similar to the machining in the other two electrolytes. It can be assumed that although the machining efficiency increased, machining error also increased at high electrolyte concentrations.
It can be seen from Figure 18 that the diameter of the excircle increased gradually and the workpiece had a bad shape precision with increasing electrolyte concentration. At the same time, the corrosion of the inner circle was severe at every electrolyte concentration. Figure 19b shows the shape precision at different current densities in the NaNO3 electrolyte. The machining error increased with the increasing of the current density, which was similar to the machining in the other two electrolytes.

5.4. Electrolytic Reaction Principle of 35CrMo Steel in NaNO3 Electrolyte

Combining with the phenomenon in the experiment, the reaction of the electrode during the machining can be described as follows [30]:
(1) Anodic reaction
① The addition of Cr and Mo is due to improve the quench hardening capability. However, Cr was oxidized on the surface of machined metal in NaNO3 electrolyte; Cr2O3 oxidation is a filam that cannot be dissolved which was formed when the metal at anodic was in a passivation state. And then the metal was in a transpassivation state with the increasing of the electrode potential. Cr2O3 was oxidized further to:
Cr 2 O 3 + 4 H 2 O 6 e Cr 2 O 7 2 + 8 H +
② Fe on the surface was oxidized and dissolved in the solution:
3 Fe 2 + + NO 3 + 4 H + 3 Fe 3 + + NO + 2 H 2 O
Fe3+ combined with the OH in the solution and Fe(OH)3 was generated.
(2) Cathodic reaction
Only hydrogen was generated because there were no ions whose electrode potential were more positive than the H+.
2 H + + 2 e H 2
The experimental phenomenon was similar to the machining in the NaClO3 electrolyte. There were a lot of bubble on the cathodic and a reddish-brown sediment was generated in the solution.

6. Conclusions

The experimental system built in this study has a stable performance for conducting the ECM experiment. The ECM process of 35CrMo steel in the NaCl solution had high machining efficiency, fast reaction rate and good surface quality. However, the workpiece had low forming precision and the reaction could not be controlled easily because of the high activity of the electrolyte. At the same time, the stray corrosion was severe and the unprocessed area was affected seriously as well. 35CrMo steel could not be machined at a low current density and low electrolyte concentration in the NaClO3 solution because of passivation. The surface far away from the machined domain had a slight stray corrosion owning to passivation when the current density was 30 A/cm2 and the electrolyte concentration was 200 g/L in the NaClO3 electrolyte. 35CrMo could not be machined at a low current density and low electrolyte concentrations in the NaNO3 solution because of passivation like the process in the NaClO3 solution. The corrosion of the center of the machined domain was severe at a current density of 30 A/cm2 and an electrolyte concentration of 200 g/L. Compared with the experimental result, it can be concluded that the lowest surface roughness and the best shape precision of the 35CrMo steel workpiece during ECM would be obtained when the current density was 30 A/cm2 and the electrolyte concentration was 200 g/L in the NaClO3 electrolyte. The results in this paper can provide a theoretical basis for the effective machining of complex parts such as downhole turbine blades.

Author Contributions

H.Z. wrote the manuscript, H.X. conducted the experiments, S.L. designed the input structures and analyzed the data, W.Y. designed the mechanical part of experimental system, P.Z. designed the control part of experimental system.

Funding

This work is financially supported by National Key R&D Program of China (2017YFC0805800).

Acknowledgments

The support from Laboratory of Tribology and Surface Engineering in China University of Petroleum-Beijing and the help from Na Lu appreciated.

Conflicts of Interest

The authors declare no conflict of interest.

References

  1. Li, W.; Zhou, H.; Liu, W.; Chao, H.; Gu, Y.X. Drilling difficulties and countermeasures for deep and ultra-deep wells in Kara Jeddah block, Fergana basin. Drill. Product. Technol. 2017, 1, 18–20. [Google Scholar]
  2. Zheng, X.T.; Wu, K.W.; Wang, W.; Yu, J.Y.; Xu, J.M.; Ma, L.W. Low cycle fatigue and ratcheting behavior of 35CrMo structural steel at elevated temperature. Nucl. Eng. Des. 2017, 314, 285–292. [Google Scholar] [CrossRef]
  3. Hu, Z.; Fan, J.; Wu, S.; Dai, H.; Liu, S. Characteristics of metal magnetic memory testing of 35CrMo steel during fatigue loading. Metals 2018, 8, 119. [Google Scholar] [CrossRef]
  4. Liang, G.; Chen, S.H.; Zhou, Y.J.; Mao, D.H. Numerical simulation and experimental study of an ultrasonic waveguide for ultrasonic casting of 35CrMo steel. J. Iron Steel Res. Int. 2016, 23, 772–777. [Google Scholar] [CrossRef]
  5. Wang, W.; Zheng, X.; Yu, J.; Lin, W.; Wang, C.; Xu, J. Time-dependent ratcheting of 35CrMo structural steel at elevated temperature considering stress rates. Mater. High Temp. 2017, 34, 172–178. [Google Scholar] [CrossRef]
  6. Xiao, Z.; Huang, Y.; Liu, Y. Plastic deformation behavior and processing maps of 35CrMo steel. J. Mater. Eng. Perform. 2016, 25, 1219–1227. [Google Scholar] [CrossRef]
  7. Xiao, Z.; Huang, Y.; Liu, H.; Wang, S. Hot tensile and fracture behavior of 35CrMo steel at elevated temperature and strain rate. Metals 2016, 6, 210. [Google Scholar] [CrossRef]
  8. Huang, Y.; Wang, S.; Xiao, Z.; Liu, H. Critical condition of dynamic recrystallization in 35CrMo steel. Metals 2017, 7, 161. [Google Scholar] [CrossRef]
  9. Wang, S.; Huang, Y.; Xiao, Z.; Liu, Y.; Liu, H. A modified Johnson-Cook model for hot deformation behavior of 35CrMo steel. Metals 2017, 7, 337. [Google Scholar] [CrossRef]
  10. Lohrengel, M.M.; Rataj, K.P.; Münninghoff, T. Electrochemical machining—Mechanisms of anodic dissolution. Electrochim. Acta 2016, 201, 348–353. [Google Scholar] [CrossRef]
  11. Rama Rao, S.; Padmanabhan, G. Linear modelling of the electrochemical machining process using full factorial design of experiments. J. Adv. Mech. Eng. 2013, 1, 13–23. [Google Scholar]
  12. Florence, T.; Dharmalingam, S.; Ragupathy, V.; Satishkumar, P. Machinablity study on electrochemical machining—A review. Int. J. ChemTech Res. 2015, 7, 2596–2600. [Google Scholar]
  13. Wang, G.Q.; Li, H.S.; Qu, N.S.; Zhu, D. Investigation of the hole-formation process during double-sided through-mask electrochemical machining. J. Mater. Process. Technol. 2016, 234, 95–101. [Google Scholar] [CrossRef]
  14. Ayyappan, S.; Sivakumar, K. Investigation of electrochemical machining characteristics of 20MnCr5 alloy steel using potassium dichromate mixed aqueous NaCl electrolyte and optimization of process parameters. Proc. Inst. Mech. Eng. Part B J. Eng. Manuf. 2015, 229, 1984–1996. [Google Scholar] [CrossRef]
  15. Ayyappan, S.; Sivakumar, K. Enhancing the performance of electrochemical machining of 20MnCr5 alloy steel and optimization of process parameters by PSO-DF optimizer. Int. J. Adv. Manuf. Technol. 2016, 82, 2053–2064. [Google Scholar] [CrossRef]
  16. Ayyappan, S.; Sivakumar, K. Experimental investigation on the performance improvement of electrochemical machining process using oxygen-enriched electrolyte. Int. J. Adv. Manuf. Technol. 2014, 75, 479–487. [Google Scholar] [CrossRef]
  17. Britto, P.A.; Lenin, N. Optimization of process parameters of ECM by RSM on AISI 202 steel. Carbon Sci. Technol. 2015, 7, 28–33. [Google Scholar]
  18. Kirchner, V.; Cagnon, L.; Schuster, R.; Ertl, G. Electrochemical machining of stainless steel microelements with ultrashort voltage pulses. Appl. Phys. Lett. 2001, 79, 1721–1723. [Google Scholar] [CrossRef]
  19. Das, M.K.; Kumar, K.; Barman, T.K.; Sahoo, P. Optimization of surface roughness and MRR in electrochemical machining of EN31 tool steel using grey-Taguchi approach. Procedia Mater. Sci. 2014, 6, 729–740. [Google Scholar] [CrossRef]
  20. Klocke, F.; Harst, S.; Zeis, M.; Klink, A. Modeling and simulation of the microstructure evolution of 42CrMo4 steel during electrochemical machining. Procedia CIRP 2018, 68, 505–510. [Google Scholar] [CrossRef]
  21. Singh, R.; Gandotra, N.; Solaiyappan, A. Study of different work materials effect on surface roughness in electrochemical machining process. Int. J. Res. Eng. Technol. 2015, 4, 505–513. [Google Scholar]
  22. Asokan, P.; Ravikumar, R.; Jeyapaul, R.; Santhi, M. Development of multi-objective optimization models for electrochemical machining process. Int. J. Adv. Manuf. Technol. 2008, 39, 55–63. [Google Scholar] [CrossRef]
  23. Senthilkumar, C.; Ganesan, G.; Karthikeyan, R. Study of electrochemical machining characteristics of Al/SiCp composites. Int. J. Adv. Manuf. Technol. 2009, 43, 256–263. [Google Scholar] [CrossRef]
  24. Rao, S.R.; Padmanabhan, G. Effect of process variables on metal removal rate in electrochemical machining of Al-B4C composites. Arch. Appl. Sci. Res. 2012, 4, 1844–1849. [Google Scholar]
  25. Kalaimathi, M.; Venkatachalam, G.; Makhijani, N.; Agrawal, A.; Sivakumar, M. Investigations on machining of Monel 400 alloys using electrochemical machining with sodium nitrate as electrolyte. Appl. Mech. Mater. 2014, 592–594, 467–472. [Google Scholar] [CrossRef]
  26. Kalaimathi, M.; Venkatachalam, G.; Sivakumar, M. Experimental investigations on the electrochemical machining characteristics of Monel 400 alloys and optimization of process parameters. Jordan J. Mech. Ind. Eng. 2014, 8, 143–151. [Google Scholar]
  27. Martin, A.; Eckart, C.; Lehnert, N.; Hackert-Oschätzchen, M.; Schubert, A. Generation of defined surface waviness on tungsten carbide by jet electrochemical machining with pulsed current. Procedia CIRP 2016, 45, 231–234. [Google Scholar] [CrossRef]
  28. Kapil, G. Advanced Manufacturing Technologies: Modern Machining, Advanced Joining, Sustainable Manufacturing (Materials Forming, Machining and Tribology), 1st ed.; Springer: Berlin, Germany, 2017. [Google Scholar]
  29. Zhang, C.; Zhang, Y.; Chen, X.; Li, W.; Liu, G. Investigation of the electrochemical dissolution behavior of tungsten during electrochemical machining. Int. J. Adv. Manuf. Technol. 2018, 49, 1–8. [Google Scholar] [CrossRef]
  30. Sekar, T. Experimental Investigation on Electrochemical Machining; LAP LAMBERT Academic Publishing: Washington, DC, USA, 2017. [Google Scholar]
Figure 1. (a) Experimental system of electrochemical machining. (b) Design of experimental setup system: (1) flow pump with high pressure; (2) relief valve; (3) filter; (4) pressure regulating valve; (5) pressure gauge; (6) tool cathode; (7) power supply; (8) tool anode; (9) filter.
Metals 08 00509 g001
Figure 2. (a) Workpiece block; (b) Tool electrode; (c) Workpiece installation device.
Metals 08 00509 g002
Figure 3. (a) Detection of surface roughness; (b) Detection of shape precision.
Metals 08 00509 g003
Figure 4. Surface roughness of workpiece at different concentration in NaCl electrolyte.
Metals 08 00509 g004
Figure 5. Surface morphology of workpiece at different concentration of NaCl electrolyte: (a) 40 A/cm2, 50 g/L; (b) 40 A/cm2,100 g/L; (c) 40 A/cm2, 150 g/L; (d) 40 A/cm2, 200 g/L. Micromorphology of workpiece local surface at different current density in NaCl electrolyte: (a-1) 40 A/cm2, 50 g/L; (b-1) 40 A/cm2, 100 g/L; (c-1) 40 A/cm2, 150 g/L; (d-1) 40 A/cm2, 200 g/L. 3D profile of workpiece local surface at different current density in NaCl electrolyte: (a-2) 40 A/cm2, 50 g/L; (b-2) 40 A/cm2, 100 g/L; (c-2) 40 A/cm2, 150 g/L; (d-2) 40 A/cm2, 200 g/L.
Metals 08 00509 g005
Figure 6. Surface roughness of workpiece at different current density.
Metals 08 00509 g006
Figure 7. Surface morphology of workpiece at different current density in NaCl electrolyte: (a) 100 g/L, 10 A/cm2; (b) 100 g/L, 20 A/cm2; (c) 100 g/L, 30 A/cm2; (d) 100 g/L, 40 A/cm2; (e) 100 g/L, 50 A/cm2. Micromorphology of workpiece local surface at different current density in NaCl electrolyte: (a-1) 100 g/L, 10 A/cm2; (b-1) 100 g/L, 20 A/cm2; (c-1) 100 g/L, 30 A/cm2; (d-1) 100 g/L, 40 A/cm2; (e-1) 100 g/L, 50 A/cm2. 3D profile of workpiece local surface at different current density in NaCl electrolyte: (a-2) 100 g/L, 10 A/cm2; (b-2) 100 g/L, 20 A/cm2; (c-2) 100 g/L, 30 A/cm2; (d-2) 100 g/L, 40 A/cm2; (e-2) 100 g/L, 50 A/cm2.
Metals 08 00509 g007
Figure 8. (a) Shape precision at different concentration of NaCl electrolyte; (b) Shape precision at different current density in NaCl electrolyte.
Metals 08 00509 g008
Figure 9. Surface roughness of workpiece at different concentration in NaClO3 electrolyte.
Metals 08 00509 g009
Figure 10. Surface morphology of workpiece at different concentration of NaClO3 electrolyte: (a) 30 A/cm2, 100 g/L; (b) 30 A/cm2, 200 g/L; (c) 30 A/cm2, 300 g/L; (d) 30 A/cm2, 400 g/L. Micromorphology of workpiece local surface: (a-1) 30 A/cm2, 100 g/L; (b-1) 30 A/cm2, 200 g/L; (c-1) 30 A/cm2, 300 g/L; (d-1) 30 A/cm2, 400 g/L. 3D profile of workpiece local surface: (a-2) 30 A/cm2, 100 g/L; (b-2) 30 A/cm2, 200 g/L; (c-2) 30 A/cm2, 300 g/L; (d-2) 30 A/cm2, 400 g/L.
Metals 08 00509 g010
Figure 11. Surface roughness of workpiece at different current density.
Metals 08 00509 g011
Figure 12. Surface morphology of workpiece at different current density in NaClO3 electrolyte: (a) 200 g/L, 10 A/cm2; (b) 200 g/L, 20 A/cm2; (c) 200 g/L, 30 A/cm2; (d) 200 g/L, 40 A/cm2; (e) 200 g/L, 50 A/cm2. Micromorphology of workpiece local surface: (a-1) 200 g/L, 10 A/cm2; (b-1) 200 g/L, 20 A/cm2; (c-1) 200 g/L, 30 A/cm2; (d-1) 200 g/L, 40 A/cm2; (e-1) 200 g/L, 50 A/cm2. 3D profile of workpiece local surface: (a-2) 200 g/L, 10 A/cm2; (b-2) 200 g/L, 20 A/cm2; (c-2) 200 g/L, 30 A/cm2; (d-2) 200 g/L, 40 A/cm2; (e-2) 200 g/L, 50 A/cm2.
Metals 08 00509 g012
Figure 13. (a) Shape precision at different concentration of NaClO3 electrolyte; (b) Shape precision at different current density under NaClO3 electrolyte.
Metals 08 00509 g013
Figure 14. Polarization curve of NaClO3.
Metals 08 00509 g014
Figure 15. Surface roughness of workpiece at different concentration in NaNO3 electrolyte.
Metals 08 00509 g015
Figure 16. Surface morphology of workpiece at different concentration of NaNO3 electrolyte: (a) 40 A/cm2, 100 g/L; (b) 40 A/cm2, 200 g/L; (c) 40 A/cm2, 300 g/L; (d) 40 A/cm2, 400 g/L. Micromorphology of workpiece local surface: (a-1) 40 A/cm2, 100 g/L; (b-1) 40 A/cm2, 200 g/L; (c-1) 40 A/cm2, 300 g/L; (d-1) 40 A/cm2, 400 g/L. 3D profile of workpiece local surface: (a-2) 40 A/cm2, 100 g/L; (b-2) 40 A/cm2, 200 g/L; (c-2) 40 A/cm2, 300 g/L; (d-2) 40 A/cm2, 400 g/L.
Metals 08 00509 g016
Figure 17. Surface roughness of workpiece at different current density.
Metals 08 00509 g017
Figure 18. Surface morphology of workpiece at different current density in NaNO3 electrolyte: (a) 300 g/L, 10 A/cm2; (b) 300 g/L, 20 A/cm2; (c) 300 g/L, 30 A/cm2; (d) 300 g/L, 40 A/cm2; (e) 300 g/L, 50 A/cm2. Micromorphology of workpiece local surface: (a-1) 300 g/L, 10 A/cm2; (b-1) 300 g/L, 20 A/cm2; (c-1) 300 g/L, 30 A/cm2; (d-1) 300 g/L, 40 A/cm2; (e-1) 300 g/L, 50 A/cm2. 3D profile of workpiece local surface: (a-2) 300 g/L, 10 A/cm2; (b-2) 300 g/L, 20 A/cm2; (c-2) 300 g/L, 30 A/cm2; (d-2) 300 g/L, 40 A/cm2; (e-2) 300 g/L, 50 A/cm2.
Metals 08 00509 g018aMetals 08 00509 g018b
Figure 19. (a) Shape precision at different concentration in NaNO3 electrolyte; (b) Shape precision at different current density in NaNO3 electrolyte.
Metals 08 00509 g019
Table 1. Chemical composition of 35CrMo steel.
ElementCSiMnCrMoNiCuP/S
Composition0.32~0.400.17~0.370.40~0.700.80~1.100.15~0.25≤0.30≤0.30≤0.035
Table 2. Electron potential of element and its ion.
Element Cr Cr 3 + Fe Fe 2 + Mo Mo 3 + O 2 OH Cl 2 Cl
Potential−0.740−0.440−0.220+0.401+1.36

