Abstract
The deformation temperature of Super-Duplex Stainless Steels (SDSS) is a key factor defining the number of phases, their proportions, and their arrangement in space, with the main role for the hot plastic processing on the industrial scale. The main scope of the study was to determine the optimal forging temperature of UNS S32750 Super-Duplex Stainless Steel by means of the SEM-EBSD technique. The alloy was forged at different temperatures between 800 °C and 1300 °C, after which the most representative samples were analysed by SEM-EBSD. Microstructural characteristics as nature, distribution, morphology, and relative proportion of constituent phases, grain form, homogeneity, and dynamic recrystallization of the structure were analysed in relation to forging temperature. Primary phases as δ-Fe and γ-Fe were identified in all structural states of the steel, irrespective of the deformation temperature. Secondary phases σ-(Cr-Fe) and χ-(Fe-Cr-Mo), identified only under 1050 °C, have a strong negative effect on hot formability because they are fragile. The conclusion was that the optimal forging temperature range for the UNS S32750 steel is 1050–1300 °C because between these temperatures the structure is composed only of ferrite and austenite, without other harmful secondary alloy phases. Due to the dynamic recrystallization, the plasticity of the material also increases in this thermal range.
1. Introduction
With a high chromium content, Super-Duplex Stainless Steels (SDSSs) presents very good mechanical characteristics [1,2,3] and a remarkable resistance to acids, acid chlorides, caustic solutions and other very aggressive environments from the chemical and petrochemical industry, cellulose and paper industry, marine and nuclear industry, and so forth [4,5,6], replacing often the stainless steels from the 300 series and the super-austenitic steels alloyed with nickel and nickel based alloys. The SDSS microstructure is constituted from almost equal parts of austenite and ferrite. They combine the best properties of stainless austenite and ferrite steels: the presence of ferrite in their structure ensures high mechanical and corrosion resistance level and the presence of austenite grants a good tenacity [7,8]. Unfortunately, these steels show a low hot plasticity [9], which makes it difficult to deform them sometimes at high temperatures [10,11]. In order to obtain SDSS with optimal mechanical properties and corrosion resistance, it is necessary to know in detail the secondary phase precipitation kinetics, the precipitation morphology, and the effect of the alloying elements on the different properties. In the SDSS, the ferritic phase is unstable due to its high alloying content, so a wide variety of secondary phases can precipitate in the temperature range 300–1100 °C during isothermal aging or any other thermal treatment, but also during welding or hot plastic deformation [5,6,7]. In addition to the main constituent phases, δ-Fe (ferrite) and γ-Fe (austenite), the following phases can be found in the structure of duplex stainless steels: phase α’, secondary austenite γ2, phase σ, phase Κ, phase R, phase π, phase τ, phase G, Cr2N and CrN chromium nitrides, and M7C3 and M23C6 carbides [12,13,14,15], with a negative effect on the corrosion resistance and plasticity [16,17].
A large part of the defects in components made of SDSS occur due to the improper hot deformation regime, so controlling the main parameters of hot plastic deformation is extremely important in order to obtain products with high reliability. The capacity of a material to be hot deformed without cracking depends on many parameters, requiring a study of great complexity. The plasticity of duplex stainless steels is much lower than that of a pure ferritic steel and just a little less than that of a pure austenitic steel. The two main phases from SDSS microstructure (austenite and ferrite) have very different physical and mechanical properties [18], resulting in distinct behaviours at deformation. The plasticity of ferrite is higher and the deformation resistance is much lower than that of austenite; at the same time, the hardening rate is higher and the recrystallization is slower in the austenite. The different deformation characteristics of the two phases lead to an unevenness of the deformation in the steel volume, generating internal stresses and sometimes causing cracks or micro-cracks, especially in forging. Manufacturing processes, like forging, are implying the shaping of the material by using localized compressive forces and during the hot forging process, the coarse grain structure of steels is refined, leading to a substantial improvement in mechanical properties. Secondary processing, such as heat treating, can also be used to further refine the structure of the steel. In the forging processes of SDSS, a special care is mandatory for the heating and cooling stages, considering the fact that secondary deleterious phases are formed mainly during these periods [19]. For example, it was found that the σ and τ phases are formed due to Cr diffusion towards the grain boundaries during slow cooling after forging [19,20]. It was also shown that σ phase precipitation is a very slow process and small grain sizes and low contents of σ phase are found in the material after soft cooling [21,22], σ phase precipitating mainly in the ferrite-austenite grain boundaries area and around inclusions or incoherent grain boundaries [19,23]. Regardless of the deformation mode, the temperature can improve the hot formability of the steel. By increasing the temperature, the risk of cracking is reduced. On the other hand, by choosing an inappropriate deformation temperature, the emergence of fragile intermetallic phases may be favoured; so determining the optimal temperature range of hot plastic deformation for SDSS is of utmost importance.
2. Materials and Methods
In order to determine the best hot plastic deformation temperature of the UNS S32750 super-duplex stainless steel, 21 cylindrical samples were deformed by upsetting in the temperature range of 800–1300 °C (using 25 °C temperature steps), at a constant deformation degree of 30%. The steel was delivered in the forged and solution hardened state (considered as the initial structural state). Samples heating was carried out in a NABERTHERM HTC 08-16 heating and heat treatment furnace (Nabertherm GmbH, Lilienthal, Germany), at temperatures 20 °C higher than the deformation temperature, considering also the cooling of the samples from the time they are removed from the furnace until they are deformed at the hydraulic press. Taking into account the samples dimensions [24], but considering also the kinetics of deleterious secondary phases formation and dissolution [25], the holding duration at the heating temperature was set at 20 min for each sample, including the transitory time needed to reach the heating temperature (the samples were fed into the preheated furnace one at a time and placed individually on the furnace hearth) and the time required for temperature homogenization throughout the volume of the samples. At the end of heating, the temperature of each sample was verified by using a laser pyrometer and, after that, the hot upsetting of the samples was carried out on a 200 tons-force hydraulic press. Samples used in the experimental program had a cylindrical geometric configuration, with a diameter of 18 mm and a height of 27 mm.
After upsetting, a number of 10 representative samples were selected to be investigated from a microstructural point of view by the SEM-EBSD (Electron Backscattered Diffraction) technique: the initial sample (hot forged and solution hardened) and the samples forged at 800 °C, 850 °C, 900 °C, 950 °C, 1000 °C, 1050 °C, 1100 °C, 1200 °C, and 1300 °C. Samples were cut with a Metkon MICRACUT 200 Precision Cutting Machine (Metkon Instruments Inc., Bursa, Turkey) with diamond disc and then metallographically polished: they were hot-mounted in a conductive Buehler KonductoMet resin at 138 °C, with a 10 min holding time at that temperature. Samples were initially metallographically ground from 180 to 1200-grit SiC paper, in 6 steps (60 s/step, rotating the samples 90° after each step), then polished with 6 μm and 1 μm polycrystalline diamond suspension (180 s/step), super-polished with 0.5 μm and 0.05 μm alumina suspension (120 s/step), and finally vibro-polished with 0.02 μm colloidal silica (43.2 ks). These operations were performed on a Metkon Digiprep ACCURA automatic grinding (Metkon Instruments Inc., Bursa, Turkey) and polishing machine for metallographic samples preparation. The machine offers both the central application of the pressing force and the individual force on each sample. After the grinding and polishing operation, an additional vibro-polishing step was performed on a Buehler VibroMet2 machine (Buehler, Lake Bluff, Illinois, IL, USA), to improve the surface quality of the samples. The vibro-polishing operation lasted 12 h and was performed using a Buehler MicroFloc polishing cloth and Buehler MasterMet2 final polishing suspension (0.02 µm colloidal silica). The schematic representation of the reference system for the analysed samples is shown in Figure 1.
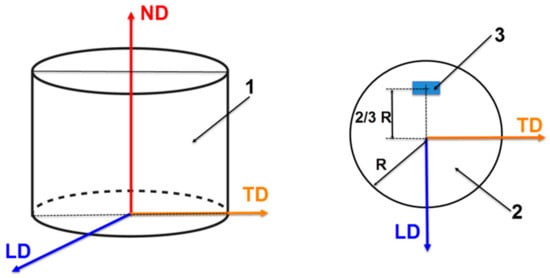
Figure 1.
The schematic representation of the reference system for the analysed samples. 1: the initial sample; 2: the LD-TD section from the middle of the sample; 3: the position of the SEM investigated area; LD: longitudinal direction; TD: transverse direction; ND: normal direction.
The microstructural analysis, performed with an SEM microscope-TESCAN Vega II-XMU (TESCAN, Brno, Czech Republic) fitted with a BRUKER Quantax e-Flash 1000 EBSD detector (Bruker Corporation, Billerica, MA, USA), was meant to highlight the main features of UNS S32750 super-duplex steel in the structural states considered: in the initial state (hot forged and solution hardened) and in the deformed state, after hot deformation at different temperatures between 800 °C and 1300 °C. In order to accurately determine the phase composition, the following phases were taken into consideration: phase δ-Fe, indexed in the cubic system (229), spatial group Im3m; phase γ-Fe, indexed in the cubic system (225), spatial group Fm3m; phase σ-(Fe-Cr), indexed in orthorhombic system (136), spatial group P42/mnm; phase χ-(Fe-Cr-Mo), indexed in the cubic system (217), spatial group I43 m.
For the as-received state (forged and solution hardened), an SEM-EDS analysis (scanning electron microscopy-energy dispersive spectroscopy) was also performed in order to quantify the alloying elements distribution and to compute the distribution of phases for the investigated microstructural state. Although the SEM-EDS technique has its own limitations in quantifying the chemical composition of a sample, this analysis is trustworthy considering that a number of five random fields (at the same magnification) were analysed and the average chemical composition was determined via statistical processing of data. For the steel and for each observed phase, the absolute and the relative errors were also specified for each alloying element. The SEM-EDS analysis was performed using a BRUKER Quantax xFlash 6/30 EDS detector (Bruker Corporation, Billerica, MA, USA), mounted on the TESCAN Vega II-XMU SEM microscope (TESCAN, Brno, Czech Republic).
In order to determine the optimal forging temperature of the UNS S32750 super-duplex stainless steel, the microstructural observations made after the SEM-EBSD analysis are described for the sample in the initial structural state and for the samples deformed by upsetting at 9 temperatures between 800 °C and 1300 °C. Characteristics as the nature, distribution, morphology and relative proportion of constituent phases, homogeneity, and dynamic recrystallization of structure, were analysed in relation to forging temperature.
3. Results
3.1. Microstructural Analysis of As-Received UNS S32750 SDSS Alloy (Forged and Solution Hardened)
The super-duplex stainless steel was delivered in the forged and solution hardened state. Figure 2 shows some representative distribution maps for the alloying elements (Fe, Cr, Ni, Mo, Cu, W, Mn, Si, V) and phases in the as-received UNS S32750 SDSS alloy (the initial structural state–forged and solution hardened), determined via SEM-EDS analysis.
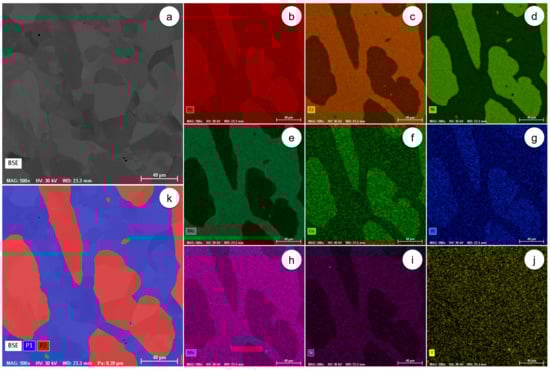
Figure 2.
The representative distribution maps of alloying elements and phases in the as-received UNS S32750 SDSS alloy: (a) the microstructure of the analysed field; (b) the SEM-EDS distribution of Fe; (c) the SEM-EDS distribution of Cr; (d) the SEM-EDS distribution of Ni; (e) the SEM-EDS distribution of Mo; (f) the SEM-EDS distribution of Cu; (g) the SEM-EDS distribution of W; (h) the SEM-EDS distribution of Mn; (i) the SEM-EDS distribution of Si; (j) the SEM-EDS distribution of V; (k) the computed distribution of phases in the microstructure of the analysed field.
Additionally, a series of representative SEM-EBSD composite images (×200) resulting from the microstructural analysis of the super-duplex stainless steel in the initial structural state is shown in Figure 3. The microstructure has a homogeneous character, consisting only of the two basic phases: the δ-Fe (ferrite) phase, acting as a metal matrix, and the γ-Fe (austenite) phase, with elongated grains of irregular shape and different sizes. No further secondary phase has been detected. The proportion of the two main phases in this state can be estimated to be about 50% ferrite (δ-Fe) and 50% austenite (γ-Fe), with a slight surplus in terms of the amount of ferrite δ-Fe.
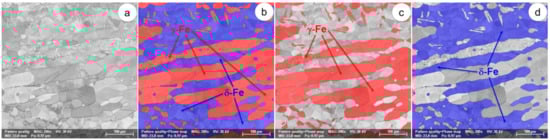
Figure 3.
The SEM-EBSD composite images (×200) for the as-received UNS S32750 SDSS alloy (the initial microstructural state): (a) the microstructure of the analysed field; (b) the distribution of phases in the microstructure of the analysed field; (c) the distribution of the γ-Fe phase; (d) the distribution of the δ-Fe phase.
Table 1, Table 2 and Table 3 are showing the average chemical composition (wt % and at %) for the initial UNS S32750 steel, together with the ferrite and austenite compositions (wt % and at %) present in the initial structural state. Considering the alloying elements and phases distribution for the initial state (Figure 2) and the average chemical composition obtained through SEM-EDS analysis (Table 1, Table 2 and Table 3), one can observe that the average chemical composition measured for the investigated alloy (Table 1) is meeting the specifications for an industrial UNS S32750 SDSS. Additionally, it can be seen that the δ-Fe phase is enriched in Cr, Mo, W, and Si (Cr and Mo are ferrite stabilizing elements) and lean in Fe, Ni, Mn, and Cu, when compared to the γ-Fe phase (Ni and Cu are austenite stabilizing elements) and vice versa. These observations were consistent with previous works by the authors [19,26,27].

Table 1.
The average chemical composition of the UNS S32750 steel in the initial state.
Table 2.
The average chemical composition of ferrite (δ-Fe phase) found in the structure of the UNS S32750 steel in the initial state.
Table 3.
The average chemical composition of austenite (γ-Fe phase) found in the structure of UNS S32750 steel in the initial state.
3.2. Microstructural Analysis of UNS S32750 SDSS Alloy Forged at 800–1000 °C
Figure 4 and Figure 5 show a series of representative SEM-EBSD composite images (×200 and ×1000, respectively) resulting from the microstructural investigation of UNS S32750 super-duplex stainless steel in the structural state obtained after forging at 800 °C, which shows that the microstructure of the alloy is relatively homogeneous, but consists of grains fragmented by the deformation process. The SEM-EBSD analysis revealed the presence of the same two main phases, in approximately equal amounts: the δ-Fe (ferrite) acting as a metal matrix and the γ-Fe phase (austenite) exhibiting elongated, irregular grains of different shapes and sizes dispersed in the matrix. Phase σ-(Fe-Cr) was detected in the structure of the steel forged at 800 °C in a relatively small proportion, but this secondary phase is undesirable in the composition of any type of super duplex steel, having detrimental effects on the properties of the steel, even in small fractions. No other secondary deleterious phases such as, for example, the χ-(Fe-Cr-Mo) phase, were detected in the steel forged at 800 °C.
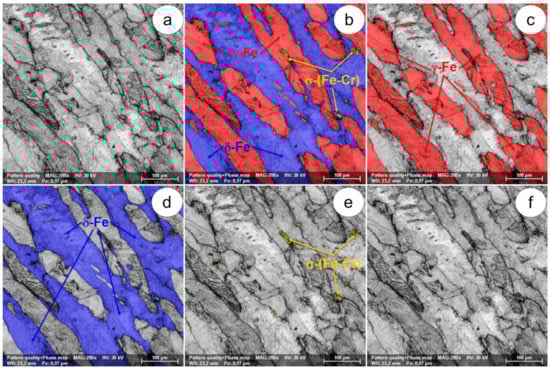
Figure 4.
The SEM-EBSD composite images (×200) obtained after forging at 800 °C: (a) the microstructure of the analysed field; (b) the distribution of the existing phases in the microstructure of the analysed field; (c) the distribution of the γ-Fe phase; (d) the distribution of the δ-Fe phase; (e) the distribution of the σ-(Fe-Cr) phase; (f) the distribution of the χ-(Fe-Cr-Mo) phase.
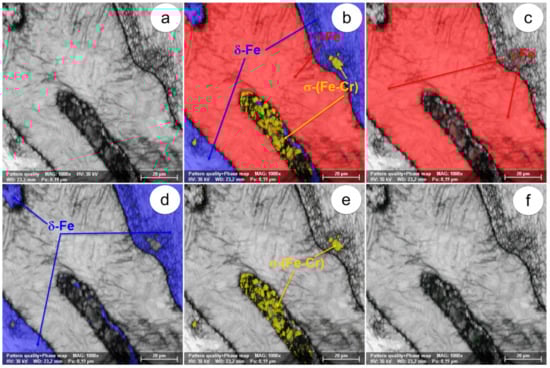
Figure 5.
The SEM-EBSD composite images (×1000) obtained after forging at 800 °C: (a) the microstructure of the analysed field; (b) the distribution of the existing phases in the microstructure of the analysed field; (c) the distribution of the γ-Fe phase; (d) the distribution of the δ-Fe phase; (e) the distribution of the σ-(Fe-Cr) phase; (f) the distribution of the χ-(Fe-Cr-Mo) phase.
After forging at 850 °C, the microstructure presented a more heterogeneous character compared to the previous sample forged at 800 °C, as can be seen from Figure 6 (×200) and Figure 7 (×1000).
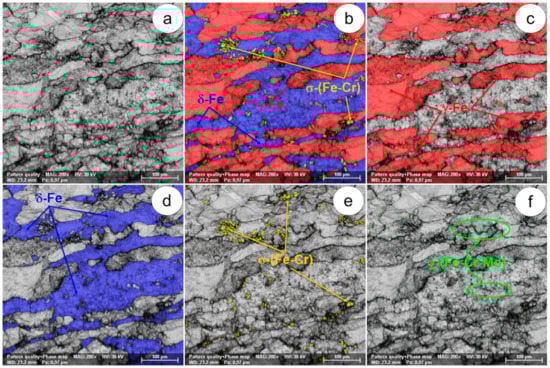
Figure 6.
The SEM-EBSD composite images (×200) obtained after forging at 850 °C: (a) the microstructure of the analysed field; (b) the distribution of existing phases in the microstructure of the analysed field; (c) the distribution of the γ-Fe phase; (d) the distribution of the δ-Fe phase; (e) the distribution of the σ-(Fe-Cr) phase; (f) the distribution of the χ-(Fe-Cr-Mo) phase.
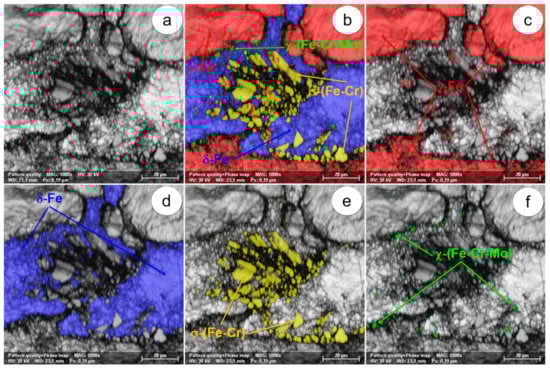
Figure 7.
The SEM-EBSD composite images (×1000) obtained after forging at 850 °C: (a) microstructure of the analysed field; (b) the distribution of existing phases in the microstructure of the analysed field; (c) the distribution of the γ-Fe phase; (d) the distribution of the δ-Fe phase; (e) the distribution of the σ-(Fe-Cr) phase; (f) the distribution of the χ-(Fe-Cr-Mo) phase.
As a result of the deformation process, the degree of grain fragmentation is higher than after forging at 800 °C. SEM-EBSD analysis revealed the presence of the two main phases, a phase acting as a metal matrix (ferrite δ-Fe), the other phase showing elongated grains of irregular shape and different size (austenite γ-Fe), dispersed in the matrix. Phase χ-(Fe-Cr-Mo) is a metastable phase which, in most cases, turns into phase σ-(Fe-Cr), especially when the holding time for the investigated material at the heating temperature is prolonged (χ → σ). The very low proportion of the χ-(Fe-Cr-Mo) phase can be associated with its metastable characteristics.
Analysing the images in Figure 8 (×200) and Figure 9 (×1000), it can be noticed that after forging at 900 °C, the microstructure of the UNS S32750 super-duplex stainless steel exhibits a higher degree of inhomogeneity, consisting of grains more fragmented as compared to the structure obtained by forging at lower temperatures. The SEM-EBSD analysis revealed the presence of the main phases: the δ-Fe (ferrite) phase behaving as a metal matrix and the γ-Fe (austenite) phase being dispersed in the ferritic matrix, with elongated grains of irregular shape and different sizes. The two harmful secondary phases, σ-(Fe-Cr) and χ-(Fe-Cr-Mo), were also identified. At the same time, it can be observed that forging at 900 °C leads, on the one hand, to an increase in the proportion of σ-(Fe-Cr) and, on the other hand, to a reduction of the grain dimensions of this secondary phase. The σ-(Fe-Cr) particles are disposed both in the δ-Fe/γ-Fe interface area and inside the δ-Fe phase matrix. The χ-(Fe-Cr-Mo) phase is similar to the one observed after forging at 850 °C, with small spheroidal particles located in the interfaces between the main δ-Fe/γ-Fe phases. Phase χ-(Fe-Cr-Mo) is detected in a relatively low proportion due to its metastable character.
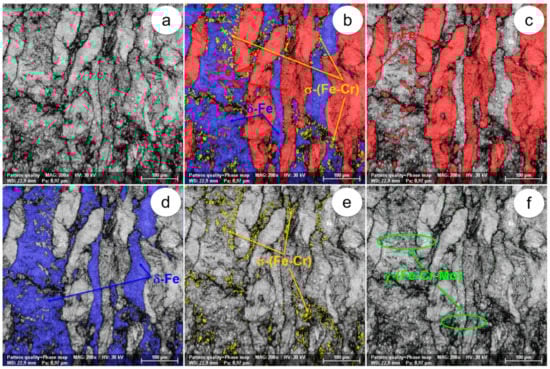
Figure 8.
The SEM-EBSD composite images (×200) obtained after forging at 900 °C: (a) the microstructure of the analysed field; (b) the distribution of existing phases in the microstructure of the analysed field; (c) the distribution of the γ-Fe phase; (d) the distribution of the δ-Fe phase; (e) the distribution of the σ-(Fe-Cr) phase; (f) the distribution of the χ-(Fe-Cr-Mo) phase.
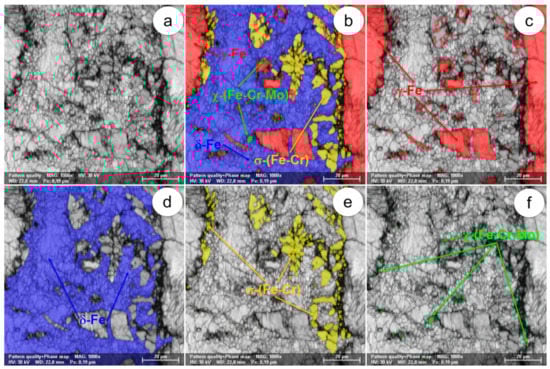
Figure 9.
The SEM-EBSD composite images (×1000) obtained after forging at 900 °C: (a) the microstructure of the analysed field; (b) the distribution of existing phases in the microstructure of the analysed field; (c) the distribution of the γ-Fe phase; (d) the distribution of the δ-Fe phase; (e) the distribution of the σ-(Fe-Cr) phase; (f) the distribution of the χ-(Fe-Cr-Mo) phase.
From the analysis of Figure 10 and Figure 11, it can be seen that after hot forging at 950 °C, the microstructure of UNS S32750 super-duplex stainless steel is more homogeneous compared to that obtained after forging at 900 °C, with grains fragmented as a result of the deformation process.
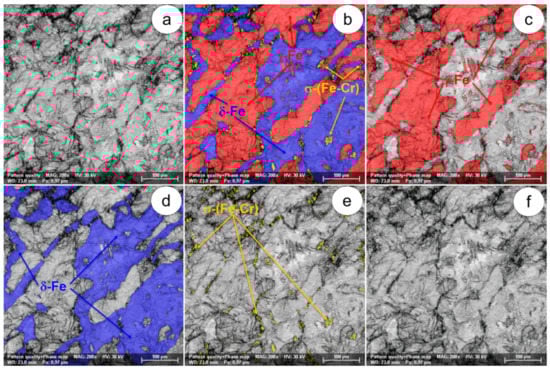
Figure 10.
The SEM-EBSD composite images (×200) obtained after forging at 950 °C: (a) the microstructure of the analysed field; (b) the distribution of existing phases in the microstructure of the analysed field; (c) the distribution of the γ-Fe phase; (d) the distribution of the δ-Fe phase; (e) the distribution of the σ-(Fe-Cr) phase; (f) the distribution of the χ-(Fe-Cr-Mo) phase.
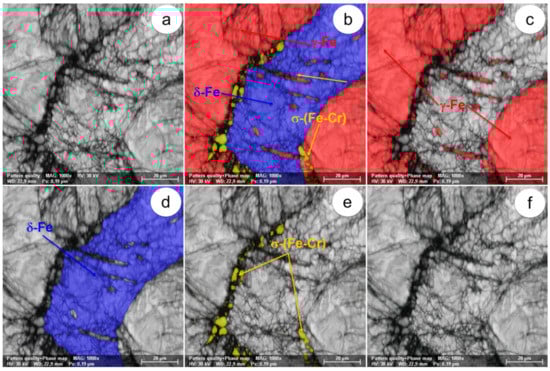
Figure 11.
The SEM-EBSD composite images (×1000) obtained after forging at 950 °C: (a) the microstructure of the analysed field; (b) the distribution of existing phases in the microstructure of the analysed field; (c) the distribution of the γ-Fe phase; (d) the distribution of the δ-Fe phase; (e) the distribution of the σ-(Fe-Cr) phase; (f) the distribution of the χ-(Fe-Cr-Mo) phase.
The fragmentation degree of the grains is lower compared to that corresponding to forging at 900 °C, which suggests a slight increase in plasticity. The SEM-EBSD analysis revealed the presence of the main phases: the δ-Fe (ferrite) phase, which behaves like a metal matrix, and the γ-Fe (austenite) phase, with elongated grains of irregular shape and different sizes, dispersed in the δ-Fe matrix. In this case, only σ-(Fe-Cr) could be identified. At the same time, it is observed that forging at 950 °C results in both a decrease in the proportion of the σ-(Fe-Cr) phase and in a reduction of the particle size of this secondary phase. The σ-(Fe-Cr) particles are predominantly disposed along the δ-Fe/γ-Fe interfaces.
After hot forging at 1000 °C, the UNS S32750 steel presents a relatively homogeneous microstructure, with grains fragmented by the forging process (Figure 12 and Figure 13). The degree of grain fragmentation is lower compared with that obtained after forging at 950 °C, which can be associated with an increase in plasticity. The SEM-EBSD analysis revealed the presence of the main phases: δ-Fe (ferrite), acting as a metal matrix and γ-Fe (austenite), distributed in the δ-Fe matrix in the form of elongated grains. The secondary phase σ-(Fe-Cr) is also detected, this being disposed of in the interface area δ-Fe/γ-Fe. The fraction of the σ-(Fe-Cr) phase and its grain dimensions are very low after forging at 1000 °C.
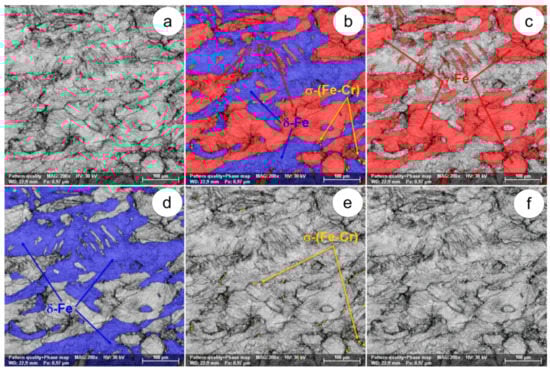
Figure 12.
The SEM-EBSD composite images (×200) obtained after forging at 1000 °C: (a) the microstructure of the analysed field; (b) the distribution of existing phases in the microstructure of the analysed field; (c) the distribution of the γ-Fe phase; (d) the distribution of the δ-Fe phase; (e) the distribution of the σ-(Fe-Cr) phase; (f) the distribution of the χ-(Fe-Cr-Mo) phase.
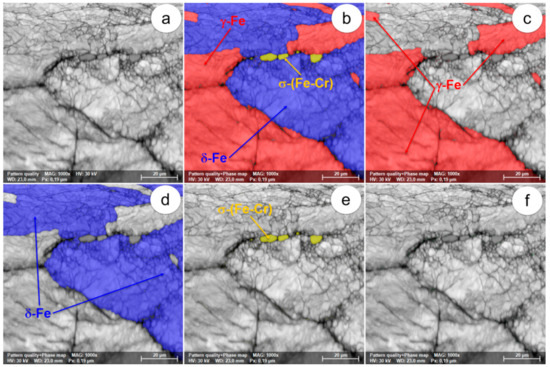
Figure 13.
The SEM-EBSD composite images (×1000) obtained after forging at 1000 °C: (a) the microstructure of the analysed field; (b) the distribution of existing phases in the microstructure of the analysed field; (c) the distribution of the γ-Fe phase; (d) the distribution of the δ-Fe phase; (e) the distribution of the σ-(Fe-Cr) phase; (f) the distribution of the χ-(Fe-Cr-Mo) phase.
3.3. Microstructural Analysis of UNS S32750 SDSS Alloy Forged at 1050 °C
Figure 14 and Figure 15 show that after forging at 1050 °C, the microstructure of UNS S32750 super-duplex stainless steel has a relatively homogeneous character, with deformed grains, and their degree of fragmentation was reduced compared to the structures obtained at lower temperatures.
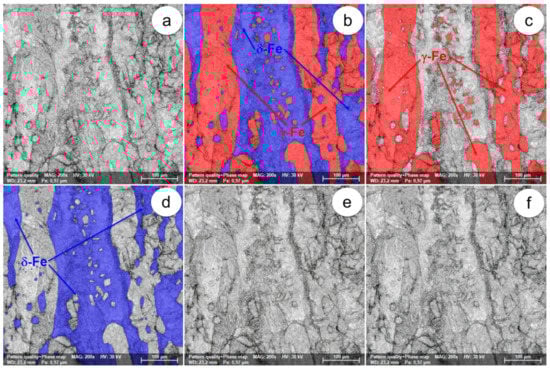
Figure 14.
The SEM-EBSD composite images (×200) obtained after forging at 1050 °C: (a) the microstructure of the analysed field; (b) the distribution of existing phases in the microstructure of the analysed field; (c) the distribution of the γ-Fe phase; (d) the distribution of the δ-Fe phase; (e) the distribution of the σ-(Fe-Cr) phase; (f) the distribution of the χ-(Fe-Cr-Mo) phase.
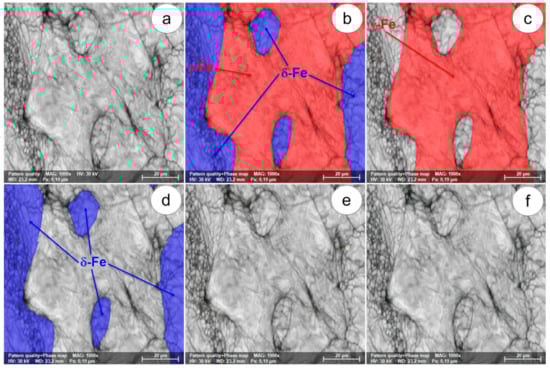
Figure 15.
The SEM-EBSD composite images (×1000) obtained after forging at 1050 °C: (a) microstructure of the analysed field; (b) the distribution of existing phases in the microstructure of the analysed field; (c) the distribution of the γ-Fe phase; (d) the distribution of the δ-Fe phase; (e) the distribution of the σ-(Fe-Cr) phase; (f) the distribution of the χ-(Fe-Cr-Mo) phase.
The two basic phases are present: a phase acting as a metal matrix, identified as the δ-Fe (ferrite) phase, and another dispersed phase, with elongated grains of irregular shape and different dimensions, identified as the γ-Fe phase (austenite); the volume fractions of the two phases are approximately equal. It should be noted that no further secondary phases (phase σ or phase χ) were detected in the composition after forging at 1050 °C. The initialization of the dynamic recrystallization also takes place because, especially in the phase δ-Fe (ferrite), inside the microstructure of the material appear a series of small recrystallized grains, surrounded by a deformed and unrecrystallized grain matrix.
3.4. Microstructural Analysis of UNS S32750 SDSS Alloy Forged at 1100–1300 °C
Analysing the images shown in Figure 16, it can be observed that after forging at 1100 °C, the microstructure of UNS S32750 steel is homogeneous with deformed grains and the degree of fragmentation is lower compared to the previous temperatures. Only the two main phases are present: the metal matrix, identified as the δ-Fe (ferrite) phase and a dispersed phase with elongated, irregular grains, of different sizes, identified as the γ-Fe phase (austenite). With the increase of the forging temperature at 1100 °C, the consolidation of the ferrite occurs due to the decrease of the austenite fraction. No other undesired secondary phase was detected in the composition after forging at 1100 °C. With the increase of the forging temperature, an intensification of the dynamic recrystallization can also be observed because the proportion of the recrystallized grains is higher.
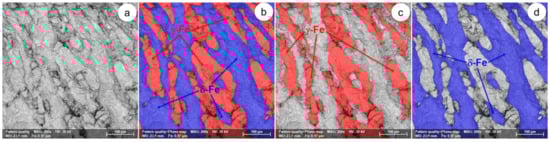
Figure 16.
The SEM-EBSD composite images (×200) obtained after forging at 1100 °C: (a) microstructure of the analysed field; (b) the distribution of existing phases in the microstructure of the analysed field; (c) the distribution of the γ-Fe phase; (d) the distribution of the δ-Fe phase.
Analysing the SEM-EBSD images shown in Figure 17, it can be noticed that the microstructure of the UNS S32750 steel is homogeneous after forging at 1200 °C, the fragmentation degree of the deformed grains being reduced. Only the two main phases were indexed: the δ-Fe (ferrite) as a metal matrix and the diffused γ-Fe phase (austenite), with elongated, irregular grains of different sizes. With the increase of the forging temperature at 1200 °C, the δ-Fe phase consolidation continues due to the decrease of the γ-Fe phase fraction, the two phases being present in different proportions (the ferrite proportion increases and correspondingly, the proportion of austenite decreases). No further undesired secondary phase has been detected in the steel composition after forging at 1200 °C. It can also be noticed that with the increase of the forging temperature, the dynamic recrystallization is intensified.
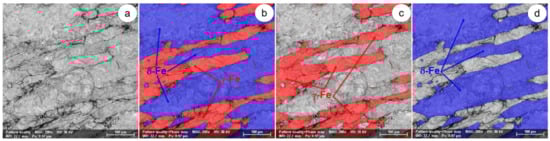
Figure 17.
The SEM-EBSD composite images (×200) obtained after forging at 1200 °C: (a) the microstructure of the analysed field; (b) the distribution of existing phases in the microstructure of the analysed field; (c) the distribution of the γ-Fe phase; (d) the distribution of the δ-Fe phase.
SEM-EBSD images presented in Figure 18 show that after forging at 1300 °C, the UNS S32750 super-duplex stainless steel has a homogeneous microstructure with a low fragmentation degree of the deformed grains. Only two main phases have been identified: the metal matrix phase δ-Fe (ferrite) and the dispersed γ-Fe phase (austenite) with irregular, elongated grains (sometimes even acicular) and of different sizes. It can be noted that with the increase of the forging temperature at 1300 °C, the consolidation of the δ-Fe phase is intensified due to the decrease of the γ-Fe phase fraction. No further undesired secondary phase was detected in the steel composition after forging at 1300 °C. With the increase of the forging temperature, the dynamic recrystallization is also intensified.
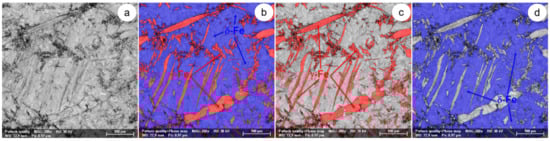
Figure 18.
The SEM-EBSD composite images (×200) obtained after forging at 1300 °C: (a) the microstructure of the analysed field; (b) the distribution of existing phases in the microstructure of the analysed field; (c) the distribution of the γ-Fe phase; (d) the distribution of the δ-Fe phase.
4. Discussion
During the hot plastic deformation of super-duplex stainless steels, there are numerous structural changes which alter the mechanical properties and the corrosion resistance [28,29,30,31]. Many of these refer to ferrite because the ferrite diffusion rates are 100 times higher than those in austenite as a result of the less compact bcc crystalline network. In addition, the solubility of ferrite elements decreases as temperature decreases, increasing the probability of precipitation during heating.
In view of the experimental results obtained from the SEM-EBSD analysis of UNS S32750 steel plastically deformed at temperatures between 800 °C and 1300 °C, useful observations are revealed regarding the variation of microstructural characteristics according to the forging temperature, thus being possible to establish the optimal range of hot forging temperatures. It can be observed that the δ-Fe (ferrite) and γ-Fe (austenite) phases are the main phases in the UNS S32750 super-duplex stainless steel, being identified in all structural states which have been analysed, regardless the deformation temperature. The δ-Fe (ferrite) phase acts as a metal matrix and the γ-Fe (austenite) phase is found in the form of a dispersed phase with elongated grains of irregular shape and different sizes. Secondary phases σ-(Fe-Cr) and χ-(Fe-Cr-Mo) have a strong negative effect on the hot formability of the steel because they are fragile, generating cracks/micro-cracks during the plastic deformation process. These secondary phases are undesirable in super-duplex stainless steels as they weaken the mechanical properties and the corrosion resistance. The SEM-EBSD analysis showed that the σ-(Fe-Cr) phase appears in the UNS S32750 super-duplex stainless steel at forging temperatures higher than 800 °C. Particles of σ-(Fe-Cr) phase have a quasi-polyhedral shape and small size, and are generally located at the boundaries between ferrite grains and austenite grains, but also inside of the ferritic phase matrix. This harmful secondary phase develops in the steel as the forging temperature rises, so it is noticeable that the proportion and the size of σ-(Fe-Cr) particles increase for forging temperatures up to 900 °C, after which both of them decrease, so that phase σ-(Fe-Cr) disappears completely during forging above 1050 °C.
At forging temperatures ranging from 850 °C to 900 °C, another secondary phase, χ-(Fe-Cr-Mo), emerges in the structure of the analysed steel in the form of small and relatively spherical particles, located in the area of the boundaries between ferrite and austenite grains. At deformation temperatures above 950 °C, the χ-(Fe-Cr-Mo) phase completely disappears from the microstructure.
In the frame of hot ductility drop, the duplex microstructure of UNS S32750 steel and the formation of deleterious secondary phases in inadequate thermomechanical processing conditions causes some embrittlement in the alloy, which finally leads to premature failure and hot cracking during or after forging, similar aspects being reported by other researchers as well [9,10,11,32]. The precipitation of harmful intermetallic phases in SDSS alloys leads to the formation of Cr depleted zones [5,6,7], with a high negative impact on hot ductility and also on corrosion resistance, generating cracks or micro-cracks during thermomechanical processing [33,34,35,36].
At forging temperatures exceeding 1050 °C, the microstructure of the UNS S32750 super-duplex stainless steel is made up only of ferrite and austenite (δ-Fe and γ-Fe phases), with no other harmful secondary phases. Generally, it can be appreciated that the two main phases are found to be in approximately equal fractions. At these temperatures, the initialization and the intensification of dynamic recrystallization have been observed. Especially in the case of the δ-Fe (ferrite) phase, in the microstructure of the steel, a small series of recrystallized grains are present, surrounded by a matrix of unrecrystallized deformed grains. Above 1050 °C, the degree of fragmentation of the deformed grains is noticeably reduced, suggesting an increase in the plasticity of the steel. When the forging temperature exceeds 1100 °C, the δ-Fe (ferrite) consolidation phenomenon occurs due to the decrease of the γ-Fe (austenite) phase fraction.
5. Conclusions
A balanced structure of super-duplex stainless steels is achieved by establishing a suitable thermal deformation regime so as to avoid the formation of fragile phases. Considering the experimental results obtained from the SEM-EBSD microstructural analysis, it can finally be concluded that the optimal forging temperature range for the UNS S32750 super-duplex stainless steel is 1050–1300 °C. After deformation between these temperatures, the structure of the material is composed only of δ-Fe (ferrite) and γ-Fe (austenite), without other harmful secondary alloy phases. At the same time, in this temperature range, the dynamic recrystallization of the structure also takes place and, therefore, the plasticity of the material increases considerably. Such a structure provides good plasticity for the hot forging of industrial UNS S32750 super-duplex stainless steel, with the avoidance of cracks and micro-cracks.
Author Contributions
M.L.A., V.D.C., N.S. and E.M.C. contributed equally in conceiving, designing and performing the experiments; analyzing the data, and writing the paper.
Funding
This research was funded by Unitatea Executiva pentru Finantarea Invatamantului Superior, a Cercetarii, Dezvoltarii si Inovarii, Romania, grant number PN-III-P2-2.1-BG-2016-0367 (104 BG/2016).
Acknowledgments
This work was supported by a grant of the Romanian National Authority for Scientific Research, CCCDI–UEFISCDI, Project PN-III-P2-2.1-BG-2016-0367, contract No. 104 BG/2016.
Conflicts of Interest
The authors declare no conflict of interest. The founding sponsors had no role in the design of the study; in the collection, analyses, or interpretation of data; in the writing of the manuscript, and in the decision to publish the results.
References
- Lee, K.M.; Cho, H.S.; Choi, D.C. Effect of isothermal treatment of SAF 2205 duplex stainless steel on migration of δ/γ interface boundary and growth of austenite. J. Alloys Compd. 1999, 285, 156–161. [Google Scholar] [CrossRef]
- Tavares, S.S.M.; Pardal, J.M.; De Souza, J.A.; Neto, J.M.; Da Silva, M.R. Magnetic phase quantification of the UNS S32750 superduplex stainless steel. J. Alloys Compd. 2006, 416, 179–182. [Google Scholar] [CrossRef]
- Sozanska, M.; Klyk-Spyra, K. Investigation of hydrogen induced cracking in 2205 duplex stainless steel in wet H2S environments after isothermal treatment at 675, 750 and 900 °C. Mater. Charact. 2006, 56, 399–404. [Google Scholar] [CrossRef]
- Luo, H.; Dong, C.F.; Xiao, K.; Li, X.G. Characterization of passive film on 2205 duplex stainless steel in sodium thiosulphate solution. Appl. Surf. Sci. 2011, 258, 631–639. [Google Scholar] [CrossRef]
- Xiong, J.; Tan, M.Y.; Forsyth, M. The corrosion behaviors of stainless steel weldments in sodium chloride solution observed using a novel electrochemical measurement approach. Desalination 2013, 327, 39–45. [Google Scholar] [CrossRef]
- Yousefieh, M.; Shamanian, M.; Saatchi, A. Optimization of the pulsed current gas tungsten arc welding (PCGTAW) parameters for corrosion resistance of super duplex stainless steel (UNS S32760) welds using the Taguchi method. J. Alloys Compd. 2011, 509, 782–788. [Google Scholar] [CrossRef]
- Tavares, S.S.M.; Silva, V.G.; Pardal, J.M.; Corte, J.S. Investigation of stress corrosion cracks in a UNS S32750 superduplex stainless steel. Eng. Fail. Anal. 2013, 35, 88–94. [Google Scholar] [CrossRef]
- Zanotto, F.; Grassi, V.; Balbo, A.; Monticelli, C.; Zucchi, F. Stress corrosion cracking of LDX 2101 duplex stainless steel in chloride solutions in the presence of thiosulphate. Corros. Sci. 2014, 80, 205–212. [Google Scholar] [CrossRef]
- Nilsson, J.O. Super duplex stainless steels. J. Mater. Sci. Technol. 1992, 8, 685–700. [Google Scholar] [CrossRef]
- Muthupandi, V.; Bala Srinivasan, P.; Shankar, V.; Seshadri, S.K.; Sundaresan, S. Effect of nickel and nitrogen addition on the microstructure and mechanical properties of power beam processed duplex stainless steel (UNS 31803) weld metals. Mater. Lett. 2005, 59, 2305–2309. [Google Scholar] [CrossRef]
- Bhatt, R.B.; Kamat, H.S.; Ghosal, S.K.; De, P.K. Influence of nitrogen in the shielding gas on corrosion resistance of duplex stainless steel welds. J. Mater. Eng. Perform. 1999, 8, 591–597. [Google Scholar] [CrossRef]
- Southwick, P.D.; Honeycombe, R.W.K. Precipitation of M23C6 at austenite/ferrite interfaces in duplex stainless steel. Met. Sci. 1982, 16, 475–482. [Google Scholar] [CrossRef]
- Unnikrishnan, K.; Mallik, A.K. Aging behaviour of a duplex stainless steel. Mater. Sci. Eng. A 1987, 95, 259–265. [Google Scholar] [CrossRef]
- Duprez, L.; Cooman, B.D.; Akdut, N. Microstructure evolution during isothermal annealing of a standard duplex stainless steel type 1.4462. Steel Res. 2000, 71, 417–422. [Google Scholar] [CrossRef]
- Nowacki, J.; Lukojc, A. Microstructural transformations of heat affected zones in duplex steel welded joints. Mater. Charact. 2006, 56, 436–441. [Google Scholar] [CrossRef]
- Maetz, J.Y.; Douillard, T.; Cazottes, S.; Verdu, C.; Kléber, X. M23C6 carbides and Cr2N nitrides in aged duplex stainless steel: A SEM, TEM and FIB tomography investigation. Micron 2016, 84, 43–53. [Google Scholar] [CrossRef] [PubMed]
- Pohl, M.; Storz, O.; Glogowski, T. Effect of intermetallic precipitations on the properties of duplex stainless steel. Mater. Charact. 2007, 58, 65–71. [Google Scholar] [CrossRef]
- Martin, G.; Caldemaison, D.; Bornert, M.; Pinna, C.; Véron, M.; Chéhab, B.; Fourmentin, R.; Mithieux, J.D.; Yerra, S.K.; Delannay, L.; et al. Determination of high temperature micro-scale strain distribution—Application to duplex stainless steels. In Proceedings of the Duplex Stainless Steel International Conference & Exhibition—Duplex World 2010, Beaune, France, 13–15 October 2010; Charles, J., Ed.; KCI Publishing: Kleve, Germany, 2011. [Google Scholar]
- Cojocaru, V.D.; Răducanu, D.; Angelescu, M.L.; Vintilă, A.N.; Șerban, N.; Dan, I.; Cojocaru, E.M.; Cinca, I. Influence of Solution Treatment Duration on Microstructural Features of an Industrial Forged UNS S32750/1.4410/F53 Super Duplex Stainless Steel (SDSS) Alloy. JOM 2017, 69, 1439–1445. [Google Scholar] [CrossRef]
- Hosseini, V.A.; Karlsson, L.; Wessman, S.; Fuertes, N. Effect of Sigma Phase Morphology on the Degradation of Properties in a Super Duplex Stainless Steel. Materials 2018, 11, 933. [Google Scholar] [CrossRef] [PubMed]
- Fernandez Bordin, S.; Limandri, S.; Ranalli, J.M.; Castellano, G. EBSD spatial resolution for detecting sigma phase in steels. Ultramicroscopy 2016, 171, 177–185. [Google Scholar] [CrossRef] [PubMed]
- Kim, S.-K.; Kang, K.-Y.; Kim, M.-S.; Lee, J.-M. Low-Temperature Mechanical Behavior of Super Duplex Stainless Steel with Sigma Precipitation. Metals 2015, 5, 1732–1745. [Google Scholar] [CrossRef]
- Chun, E.J.; Baba, H.; Terashima, K.; Nishimoto, K.; Saida, K. Prediction of σ phase precipitation in type 316FR stainless steel weld metal. Q. J. Jpn. Weld. Soc. 2013, 31, 168–172. [Google Scholar] [CrossRef]
- Eyres, N.R.; Hartree, D.R.; Ingham, J.; Jackson, R.; Sarjant, R.J.; Wagstaff, J.B. The calculation of variable heat flow in solids. Philos. Trans. R. Soc. A 1946, 240, 1–57. [Google Scholar] [CrossRef]
- Ferro, P. A dissolution kinetics model and its application to duplex stainless steels. Acta Mater. 2013, 61, 3141–3147. [Google Scholar] [CrossRef]
- Cojocaru, V.D.; Șerban, N.; Angelescu, M.L.; Cotruț, M.C.; Cojocaru, E.M.; Vintilă, A.N. Influence of Solution Treatment Temperature on Microstructural Properties of an Industrially Forged UNS S32750/1.4410/F53 Super Duplex Stainless Steel (SDSS) Alloy. Metals 2017, 7, 210. [Google Scholar] [CrossRef]
- Cojocaru, V.D.; Șerban, N.; Angelescu, M.L.; Cojocaru, E.M.; Cinca, I.; Răducanu, D.; Vintilă, A.N. Effect of short duration solution treatment at temperatures below 1000 °C on σ-phase precipitation in a super duplex stainless steel alloy. Materialwissenschaft und Werkstofftechnik 2018, 49, 530–537. [Google Scholar] [CrossRef]
- Fargas, G.; Anglada, M.; Mateo, A. Effect of the annealing temperature on the mechanical properties, formability and corrosion resistance of hot-rolled duplex stainless steels. J. Mater. Process. Technol. 2009, 209, 1770–1782. [Google Scholar] [CrossRef]
- Davanageri Mahesh, B.; Narendranath, S.; Kadoli, R. Influence of Heat Treatment on Microstructure, Hardness and Wear Behavior of Super Duplex Stainless Steel AISI 2507. Am. J. Mater. Sci. 2015, 5, 48–52. [Google Scholar]
- Maki, T.; Furuhara, T.; Tsuzaki, K. Microstructure Development by Thermomechanical Processing in Duplex Stainless Steel. ISIJ Int. 2001, 41, 571–579. [Google Scholar] [CrossRef]
- Kashiwar, A.; Phani Vennela, N.; Kamath, S.L.; Khatirkar, R.K. Effect of solution annealing temperature on precipitation in 2205 duplex stainless steel. Mater. Charact. 2012, 74, 55–63. [Google Scholar] [CrossRef]
- Ciuffini, A.F.; Barella, S.; Di Cecca, C.; Gruttadauria, A.; Mapelli, C.; Mombelli, D. Isothermal Austenite–Ferrite Phase Transformations and Microstructural Evolution during Annealing in Super Duplex Stainless Steels. Metals 2017, 7, 368. [Google Scholar] [CrossRef]
- Pettersson, N.; Wessman, S.; Thuvander, M.; Hedström, P.; Odqvist, J.; Pettersson, R.F.A.; Hertzman, S. Nanostructure evolution and mechanical property changes during aging of a super duplex stainless steel at 300 °C. Mater. Sci. Eng. A 2015, 647, 241–248. [Google Scholar] [CrossRef]
- Zhang, Z.; Jing, H.; Xu, L.; Han, Y.; Zhao, L.; Zhang, J. Influence of microstructure and elemental partitioning on pitting corrosion resistance of duplex stainless steel welding joints. Appl. Surf. Sci. 2017, 394, 297–314. [Google Scholar] [CrossRef]
- Hoseinpoor, M.; Momeni, M.; Moayed, M.H.; Davoodi, A. EIS assessment of critical pitting temperature of 2205 duplex stainless steel in acidified ferric chloride solution. Corros. Sci. 2014, 80, 197–204. [Google Scholar] [CrossRef]
- Yi, H.L.; Ryu, J.H.; Bhadeshia, H.K.D.H.; Yen, H.W.; Yang, J.R. Low-alloy duplex, directly quenched transformation-induced plasticity steel. Scr. Mater. 2011, 65, 604–607. [Google Scholar] [CrossRef]


© 2018 by the authors. Licensee MDPI, Basel, Switzerland. This article is an open access article distributed under the terms and conditions of the Creative Commons Attribution (CC BY) license (http://creativecommons.org/licenses/by/4.0/).