Numerical Simulation on the Origin of Solidification Cracking in Laser Welded Thick-Walled Structures

 ,
, 
 and
and 
Abstract
1. Introduction
2. Materials and Methods
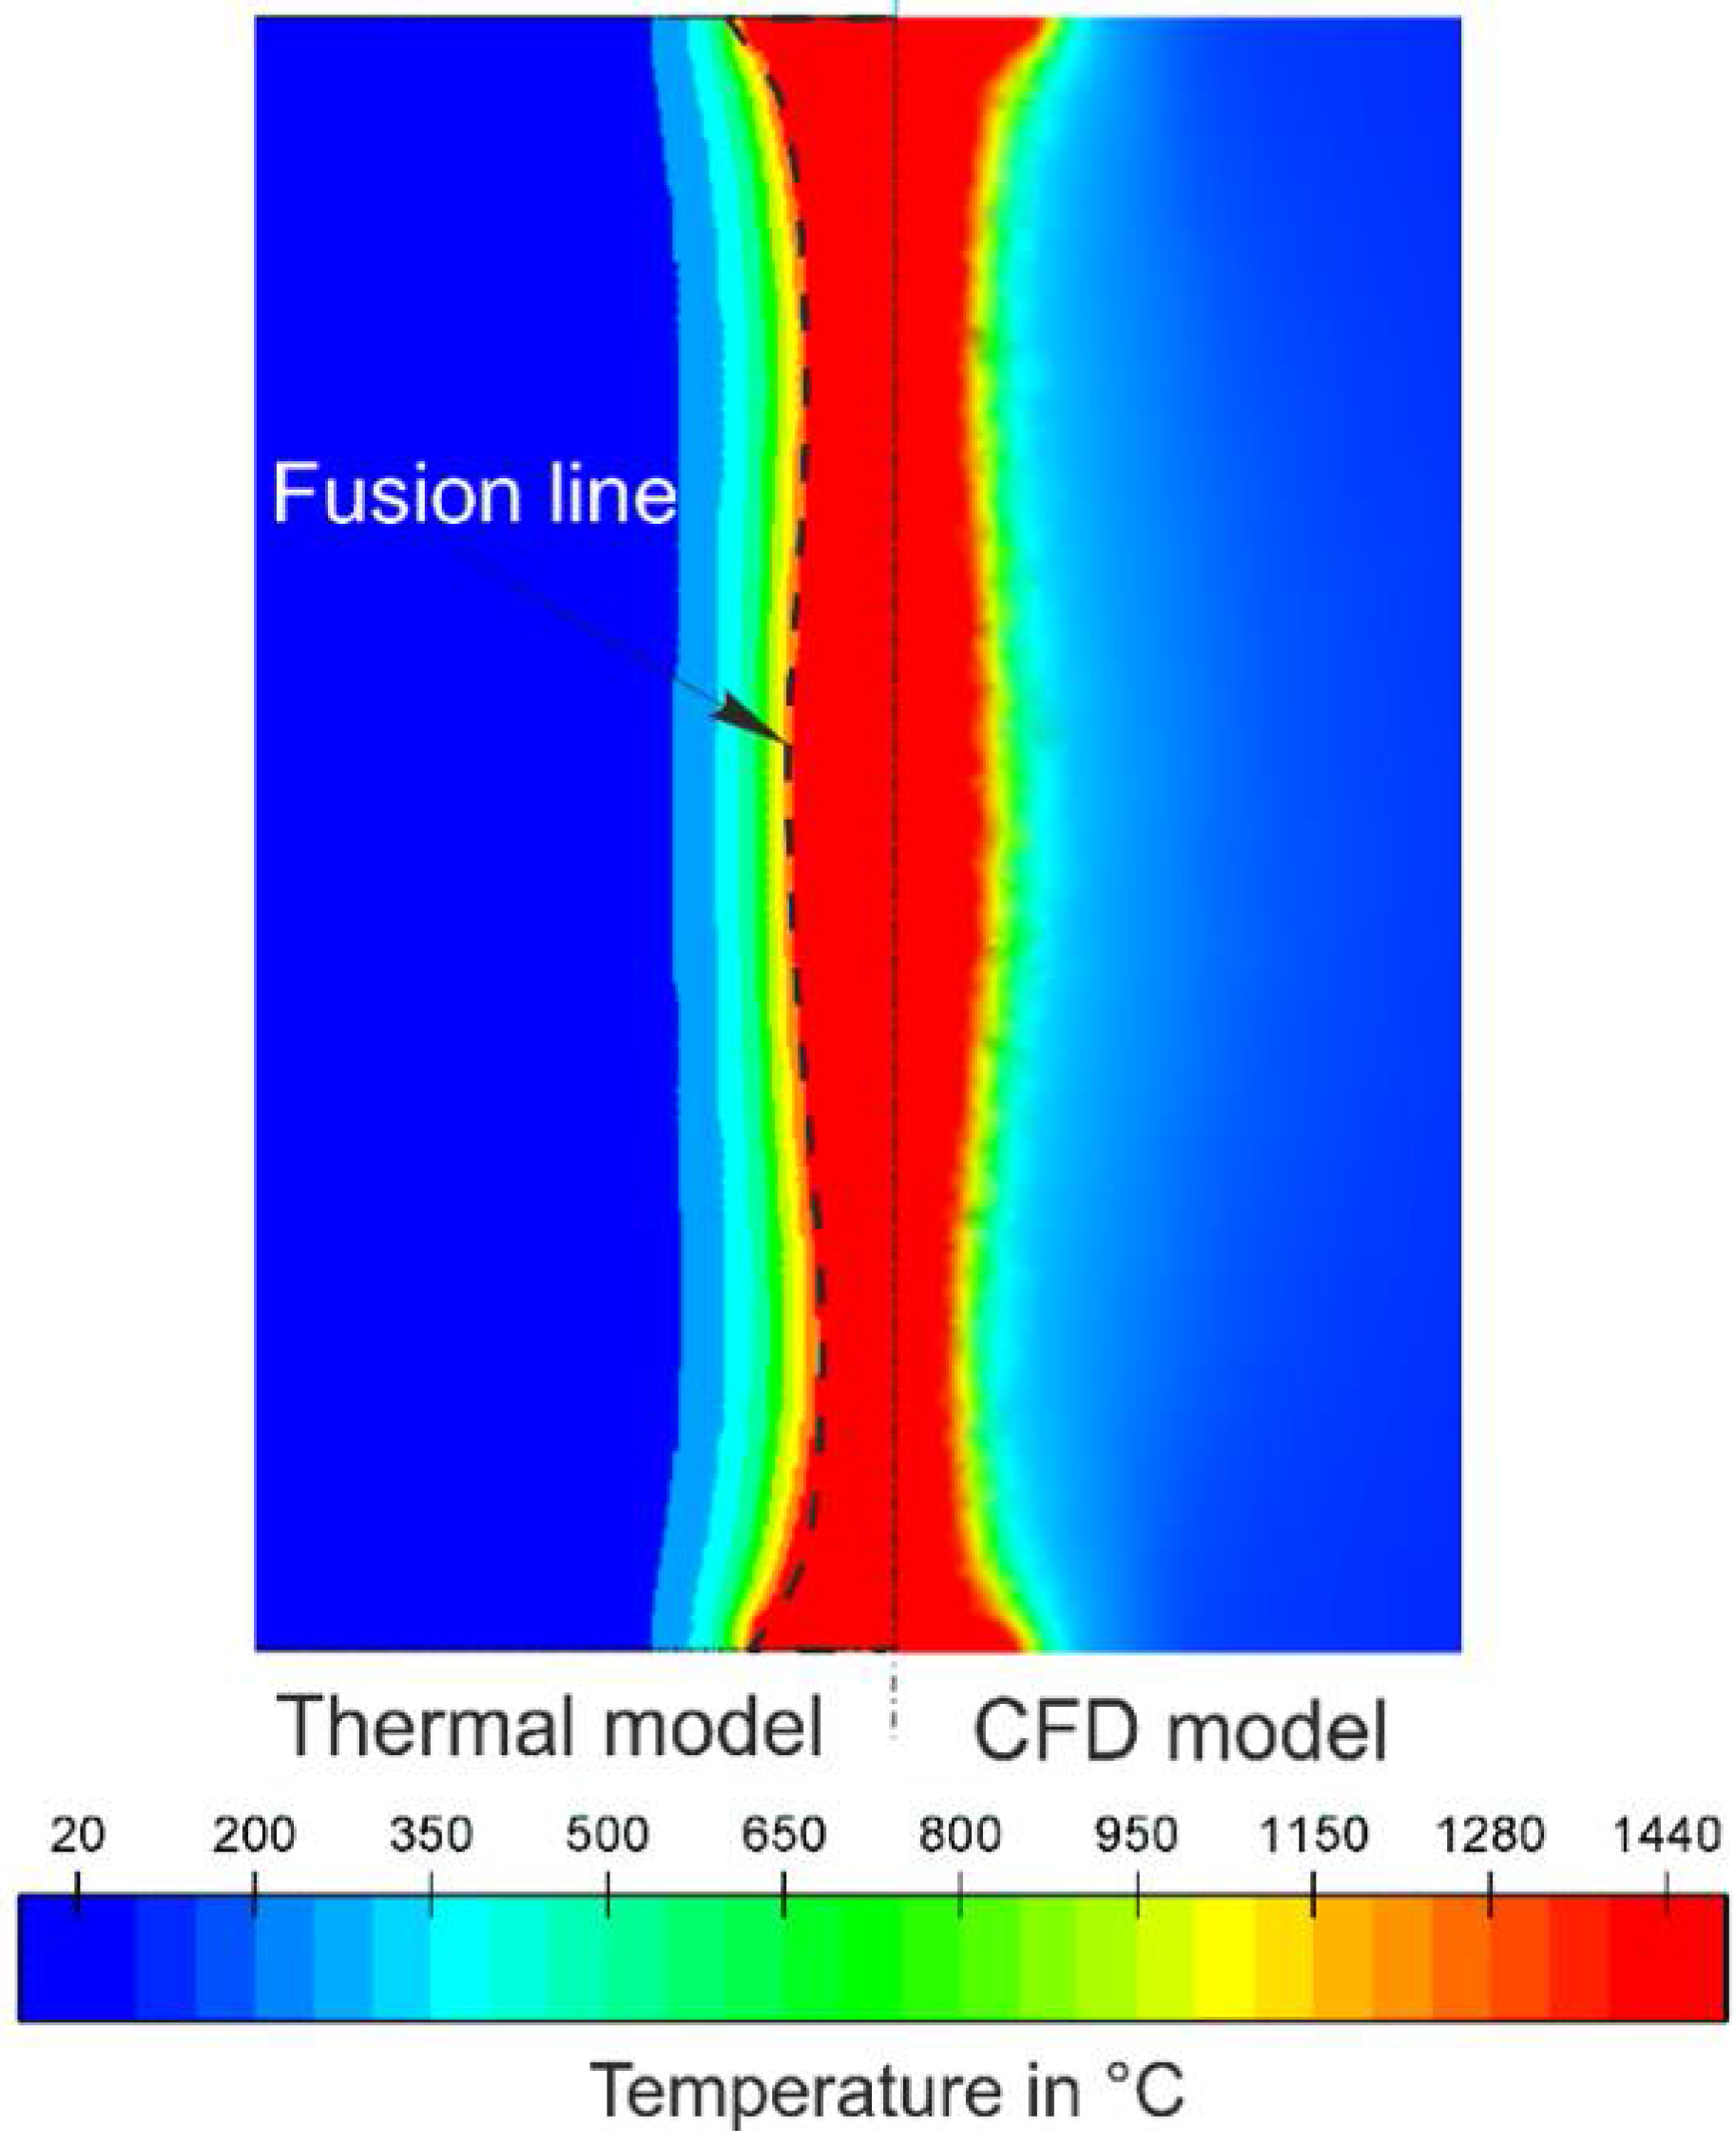
- CFD model: Calculation of the heat and mass transport in the weld pool to analyze the weld pool shape.
- Thermal FEM model: The CFD-obtained weld pool geometry is used as a heat source in the calculation of the temperature field.
- Mechanical FEM model: Using the calculated transient temperature field as a thermal load in the mechanical model to evaluate the stress field.
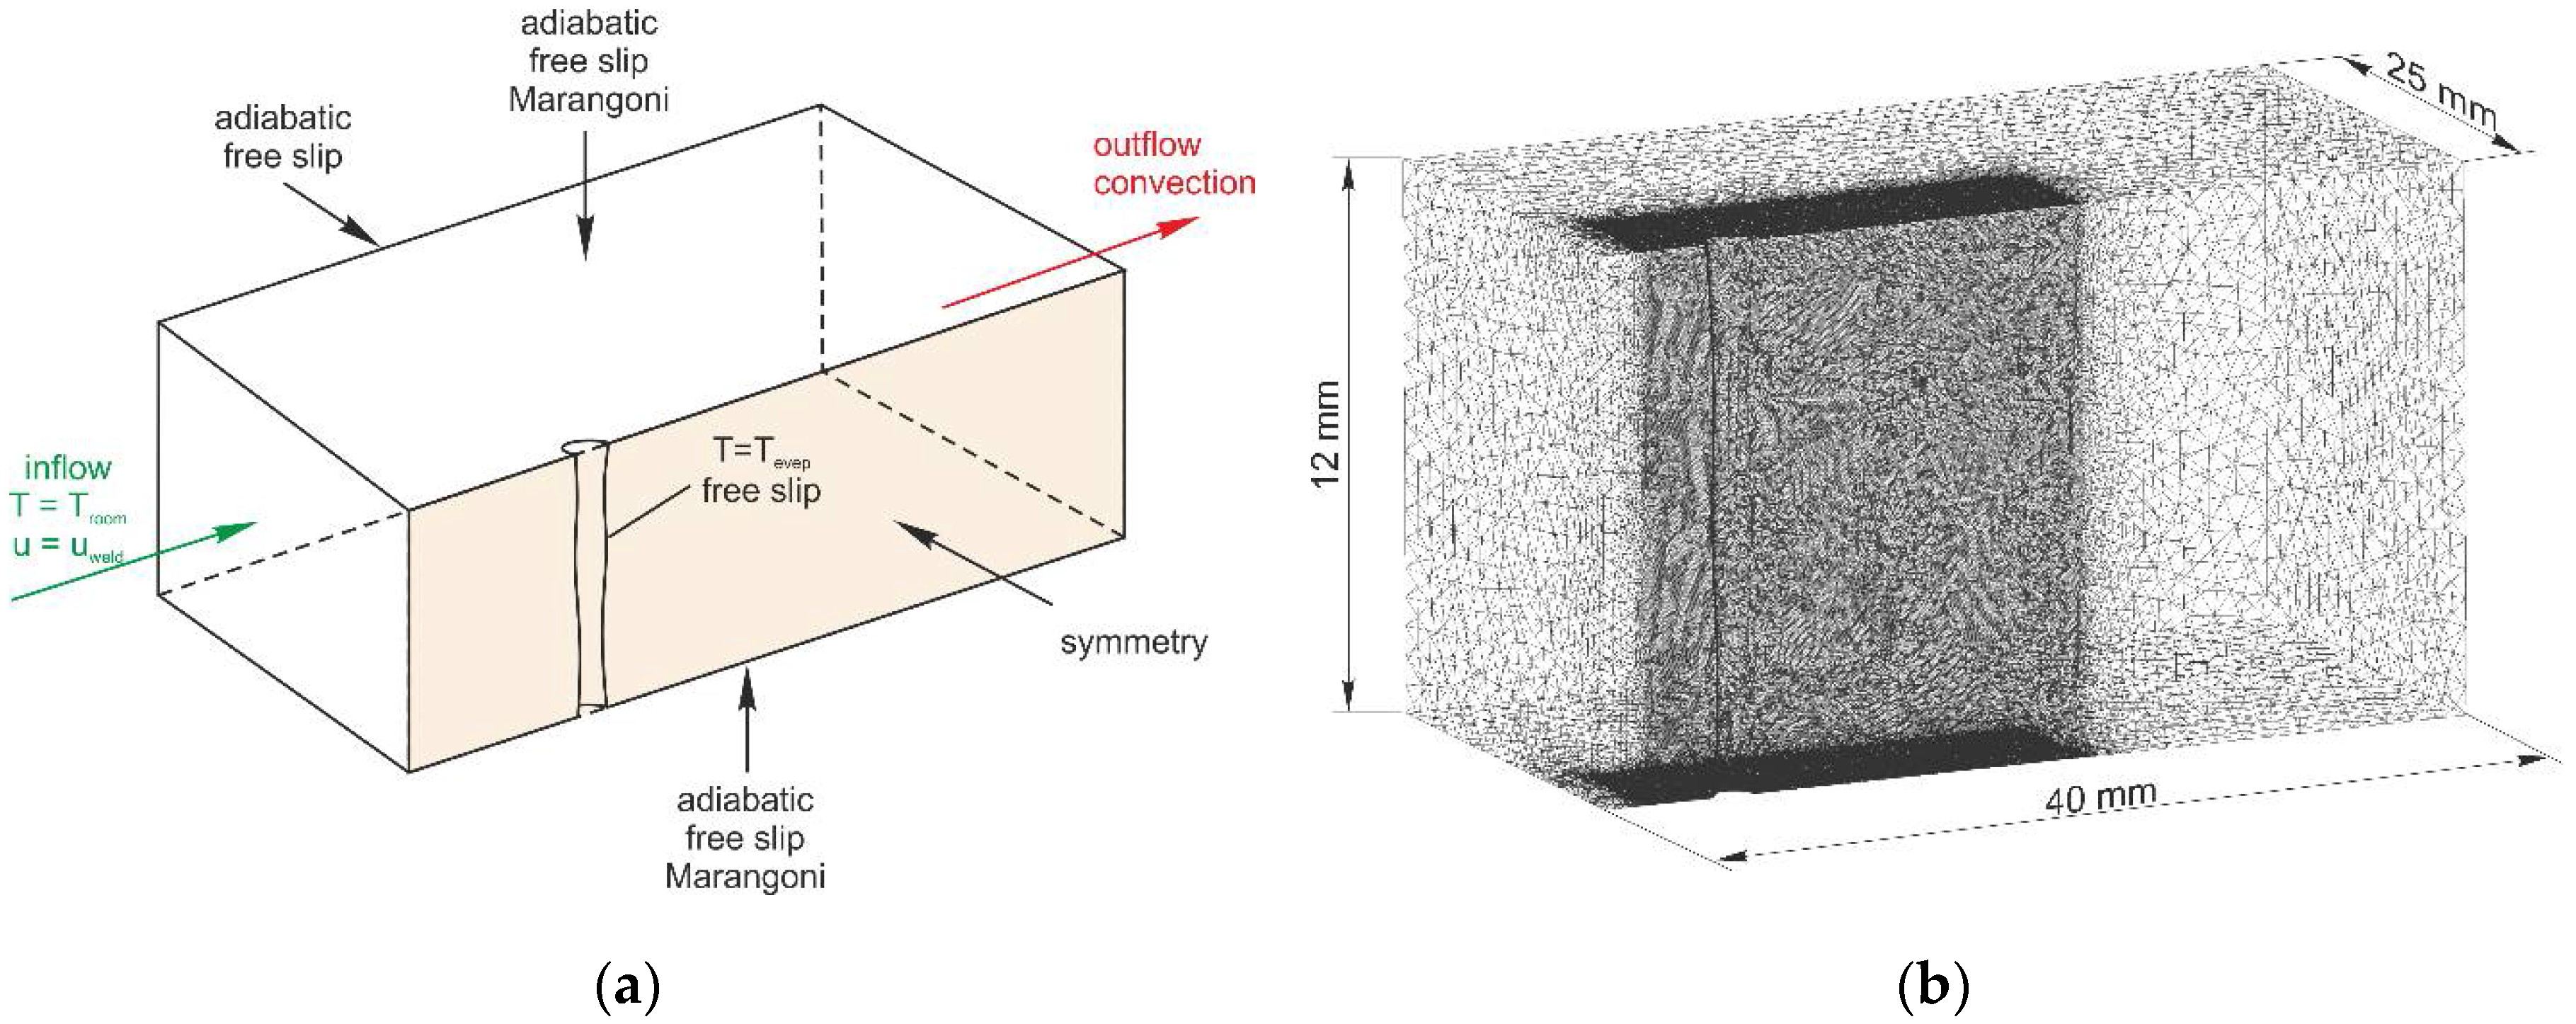
2.1. CFD Model
- Transient approach until reaching a quasi-steady-state.
- Adapted size of the computational domain.
- Fixed free surface geometry.
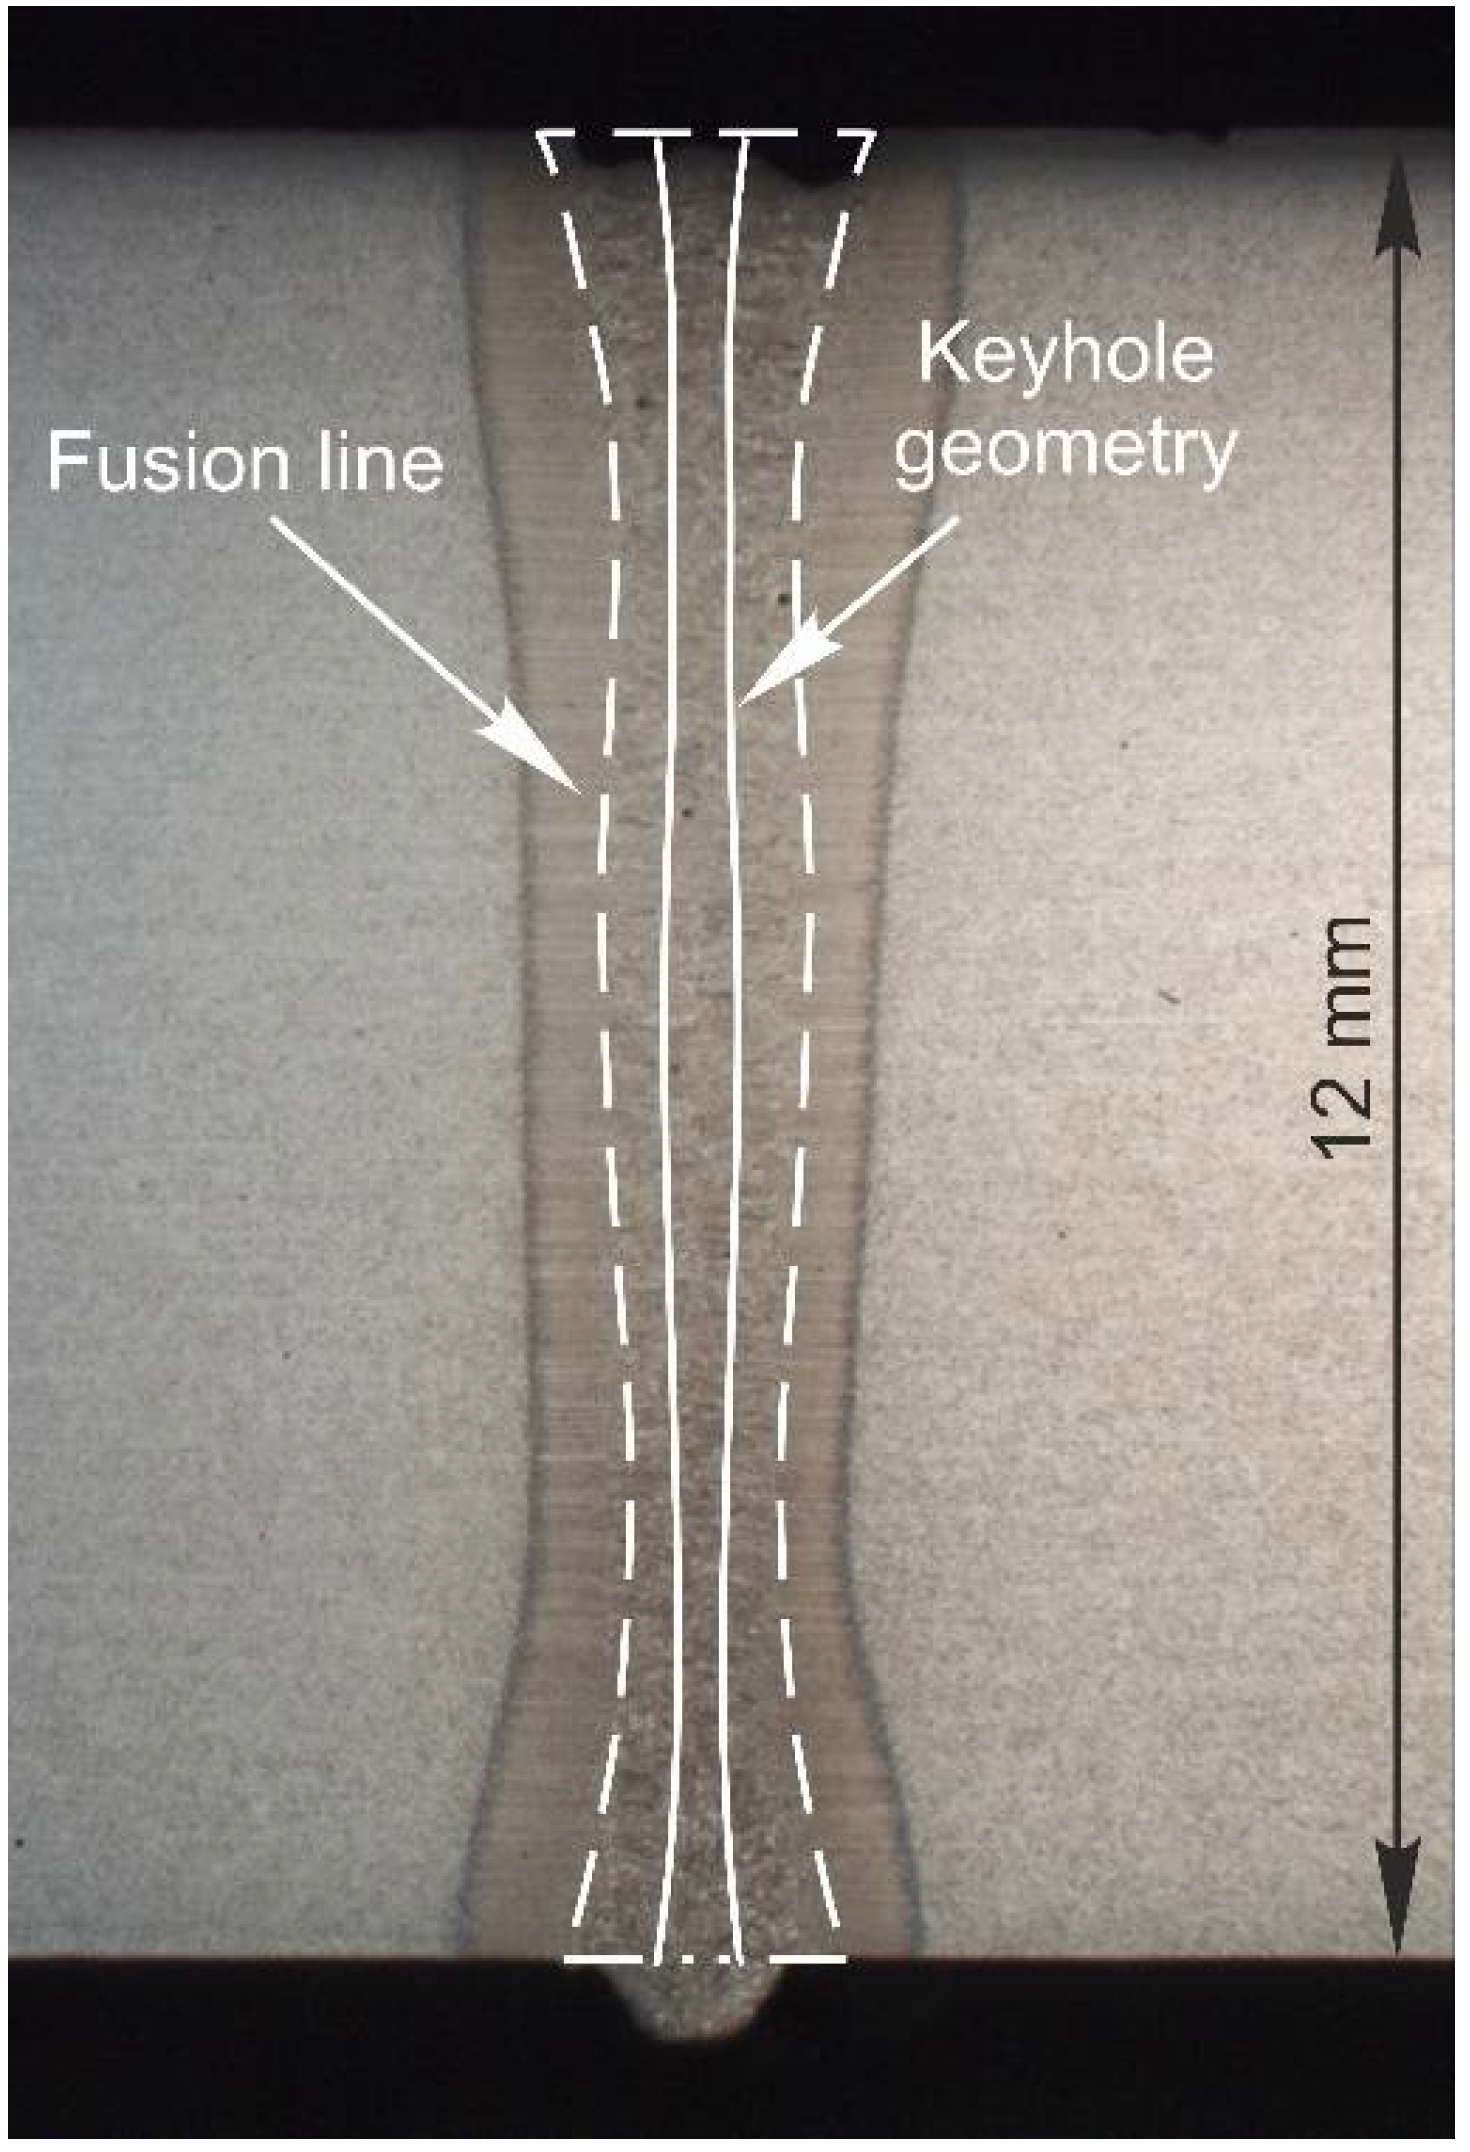
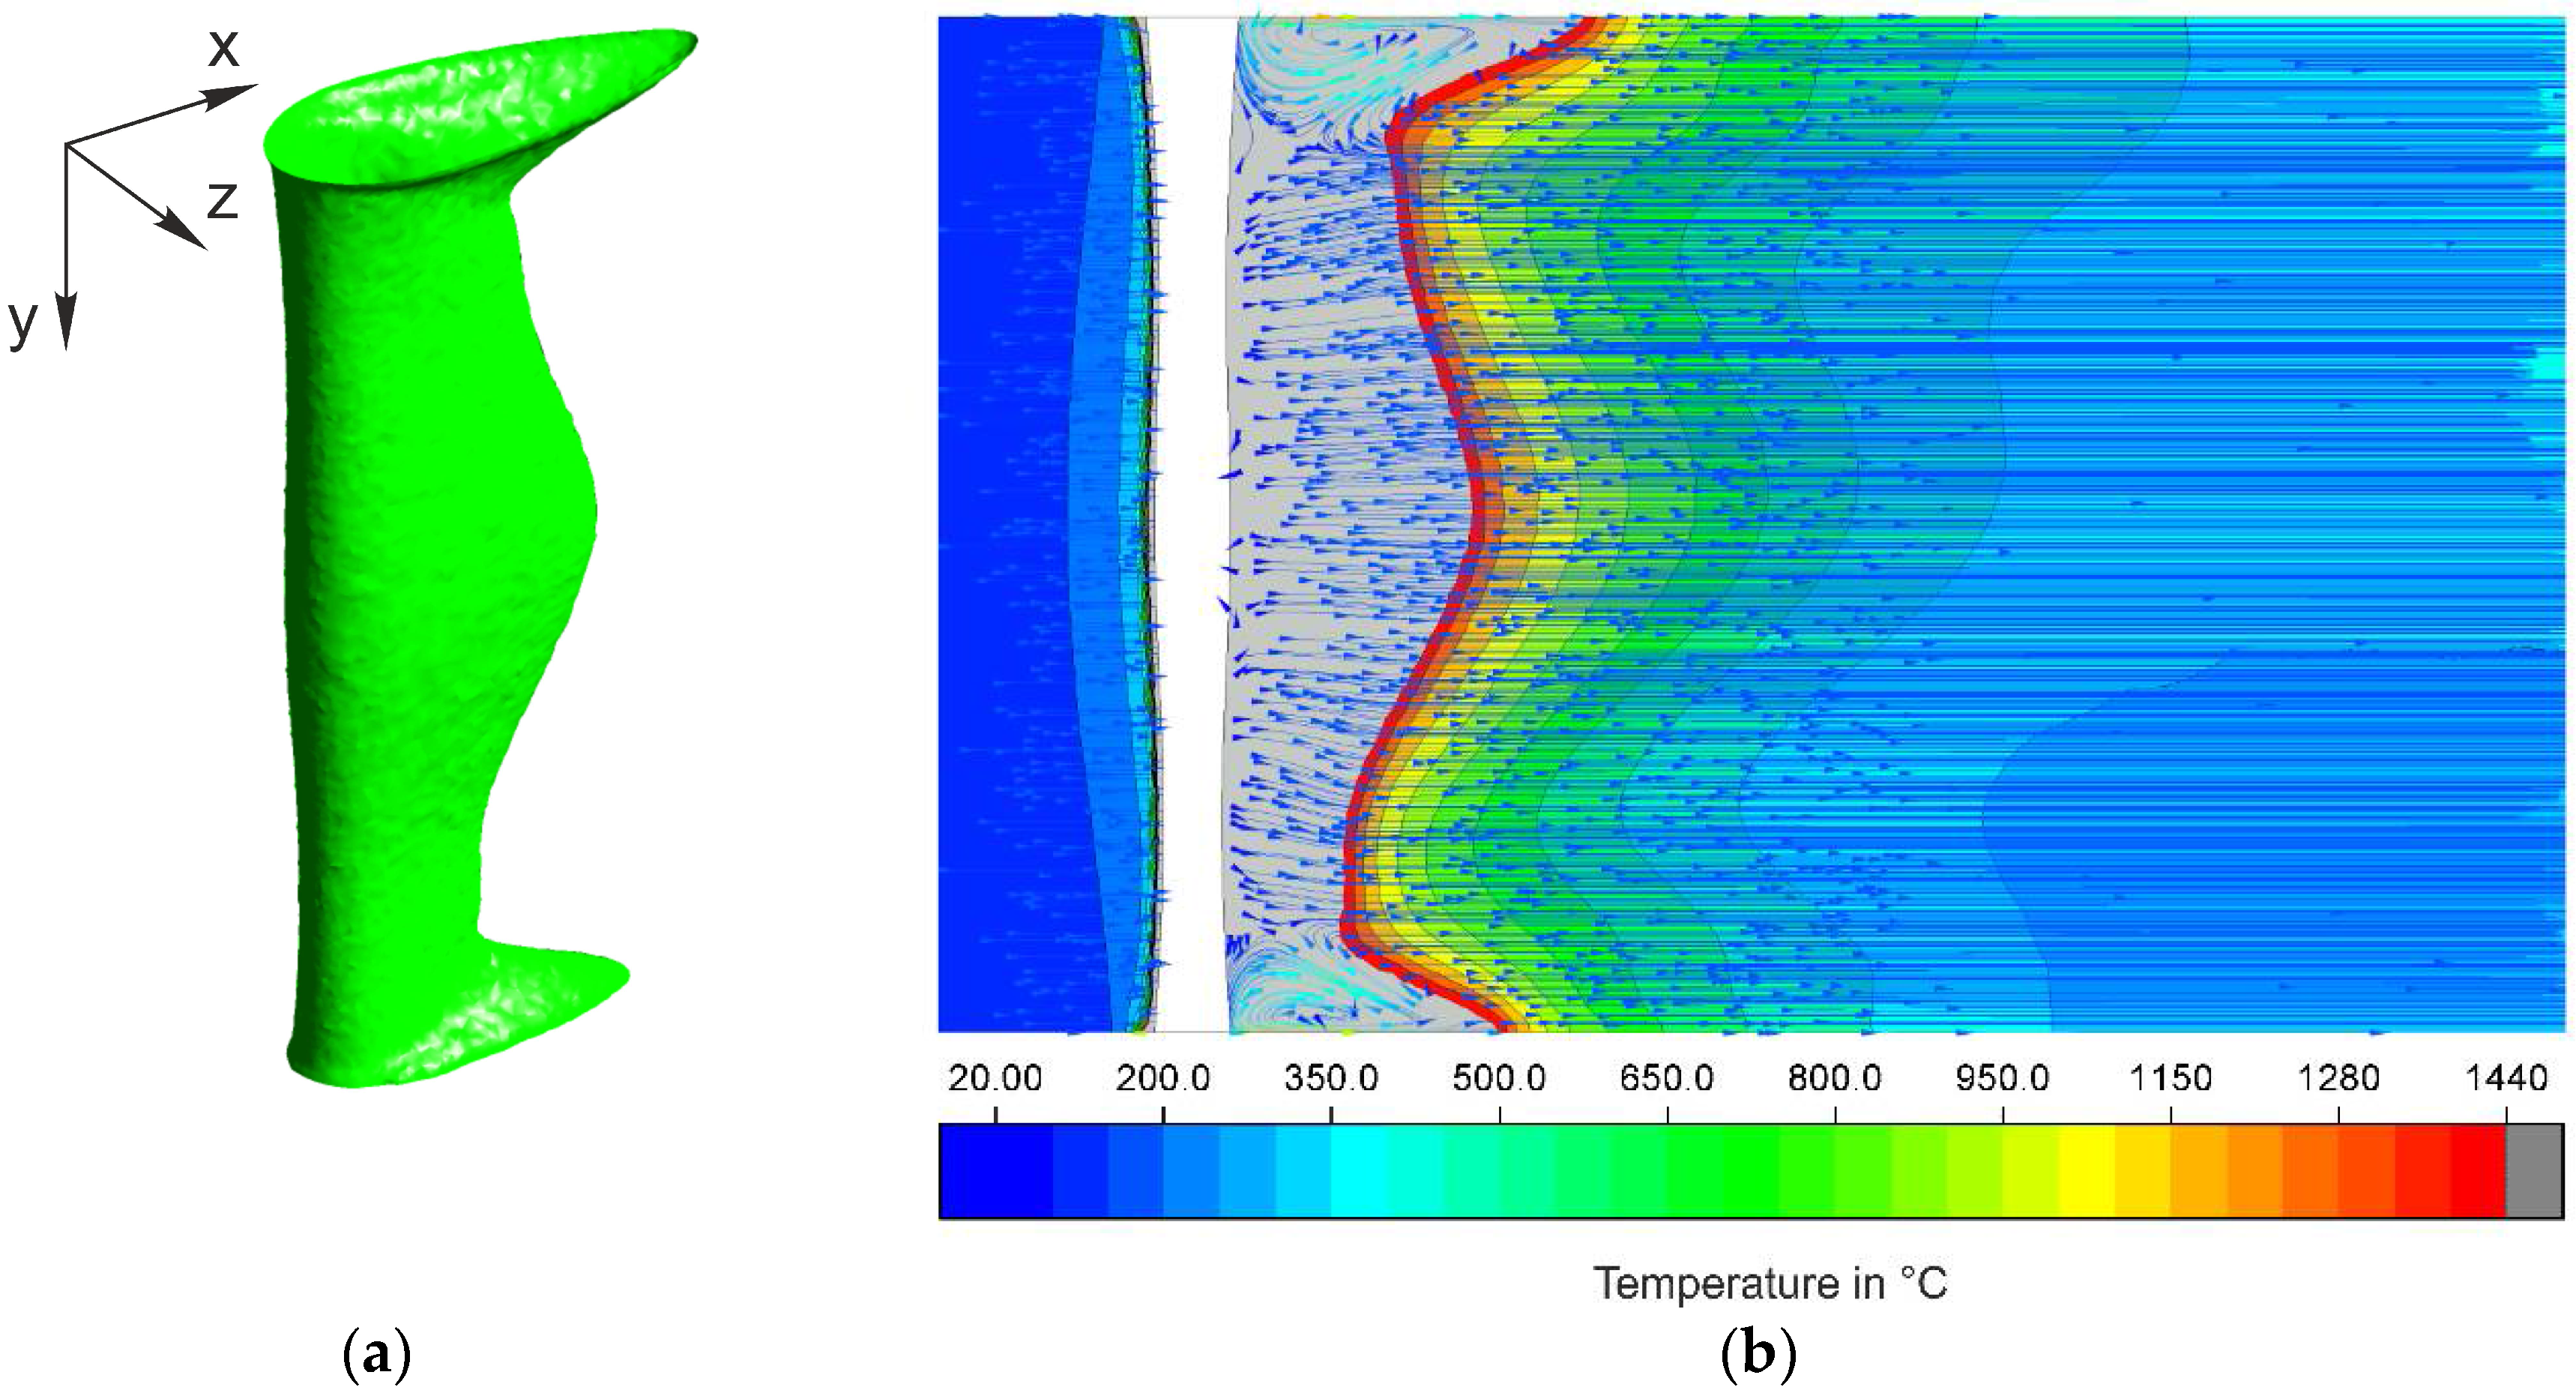
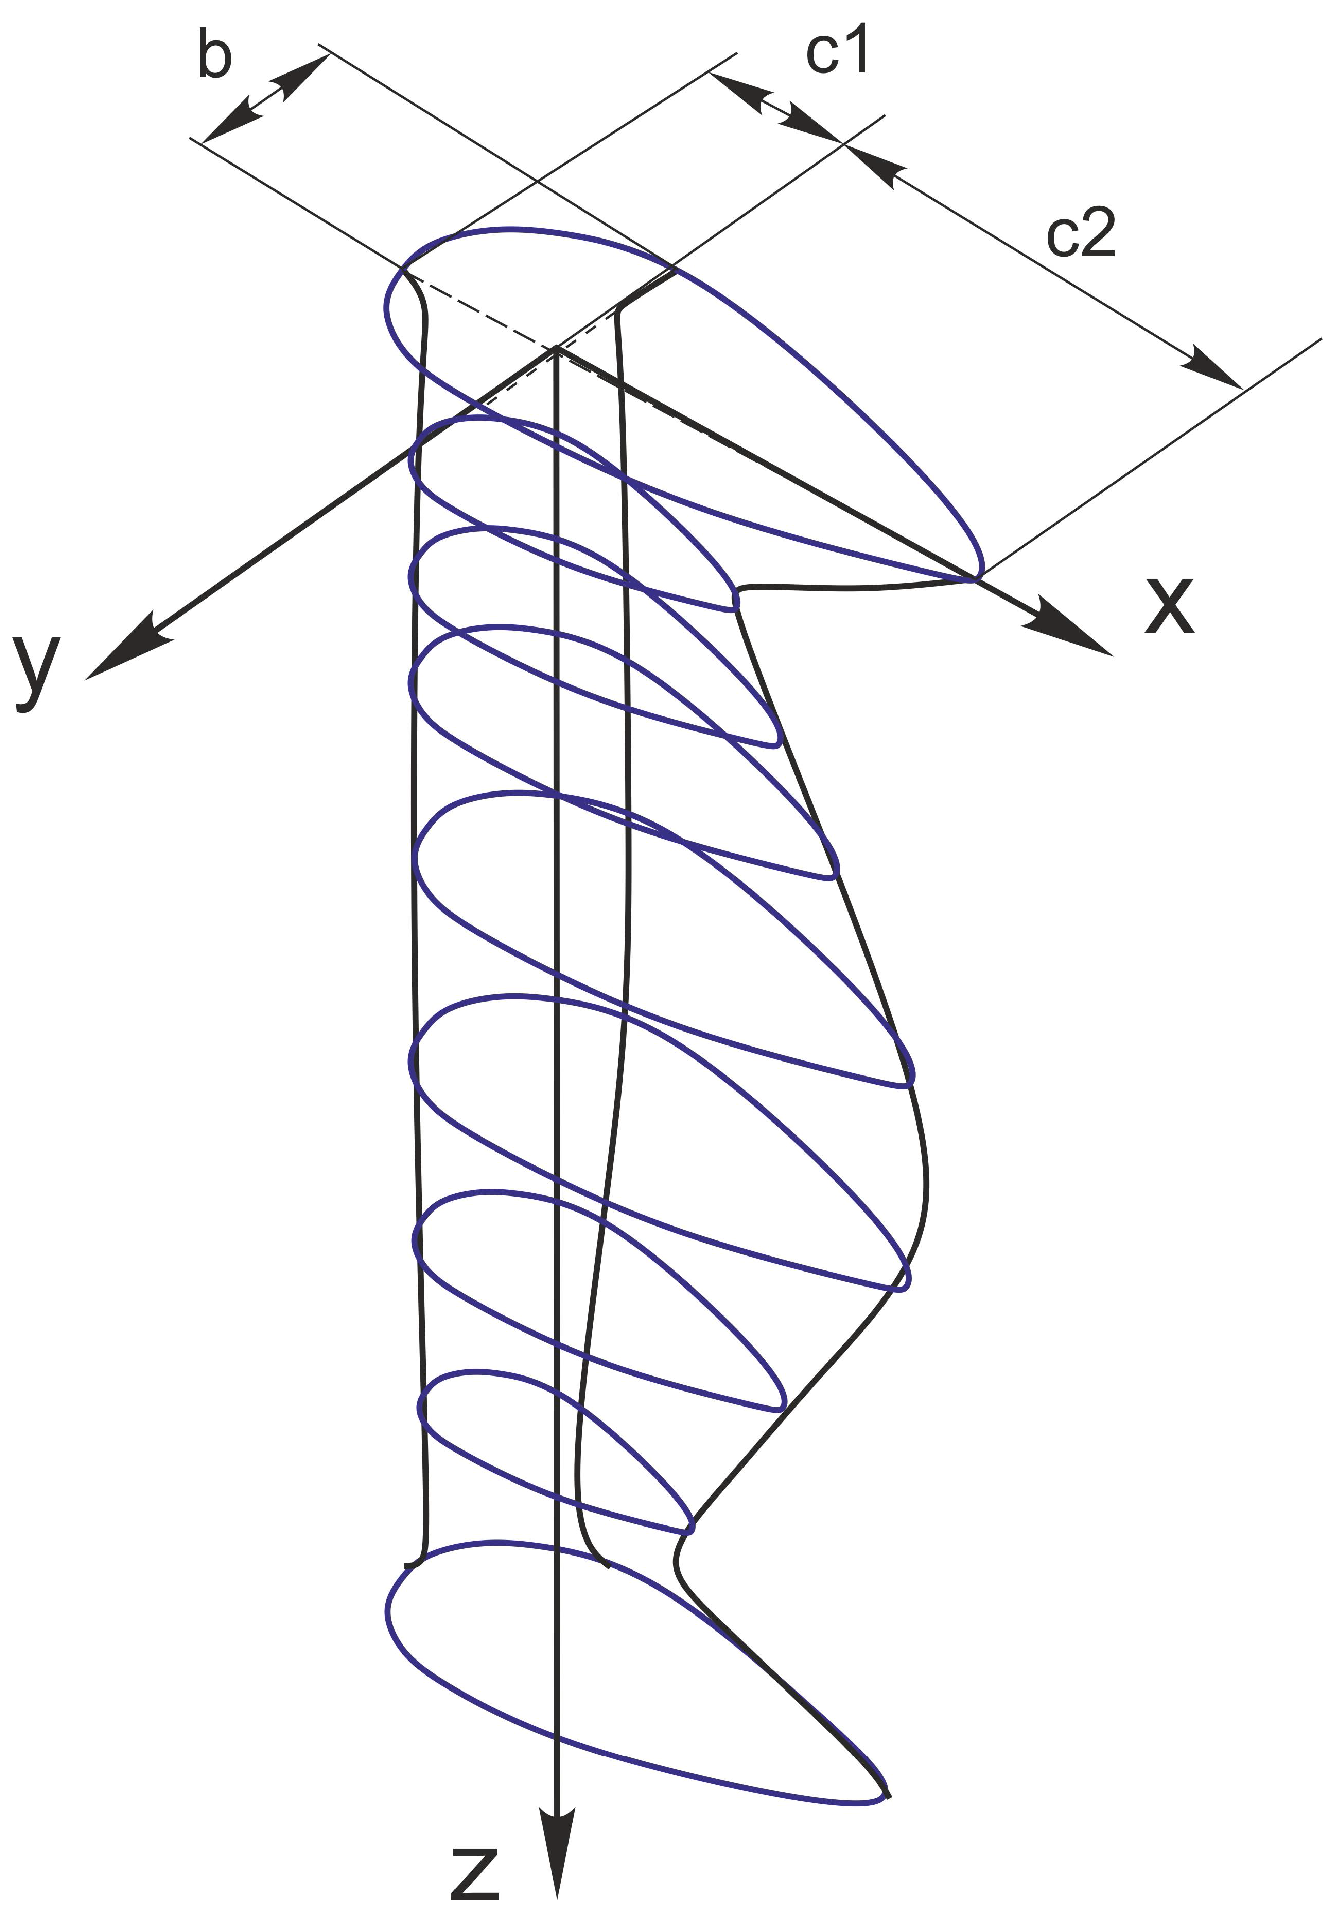
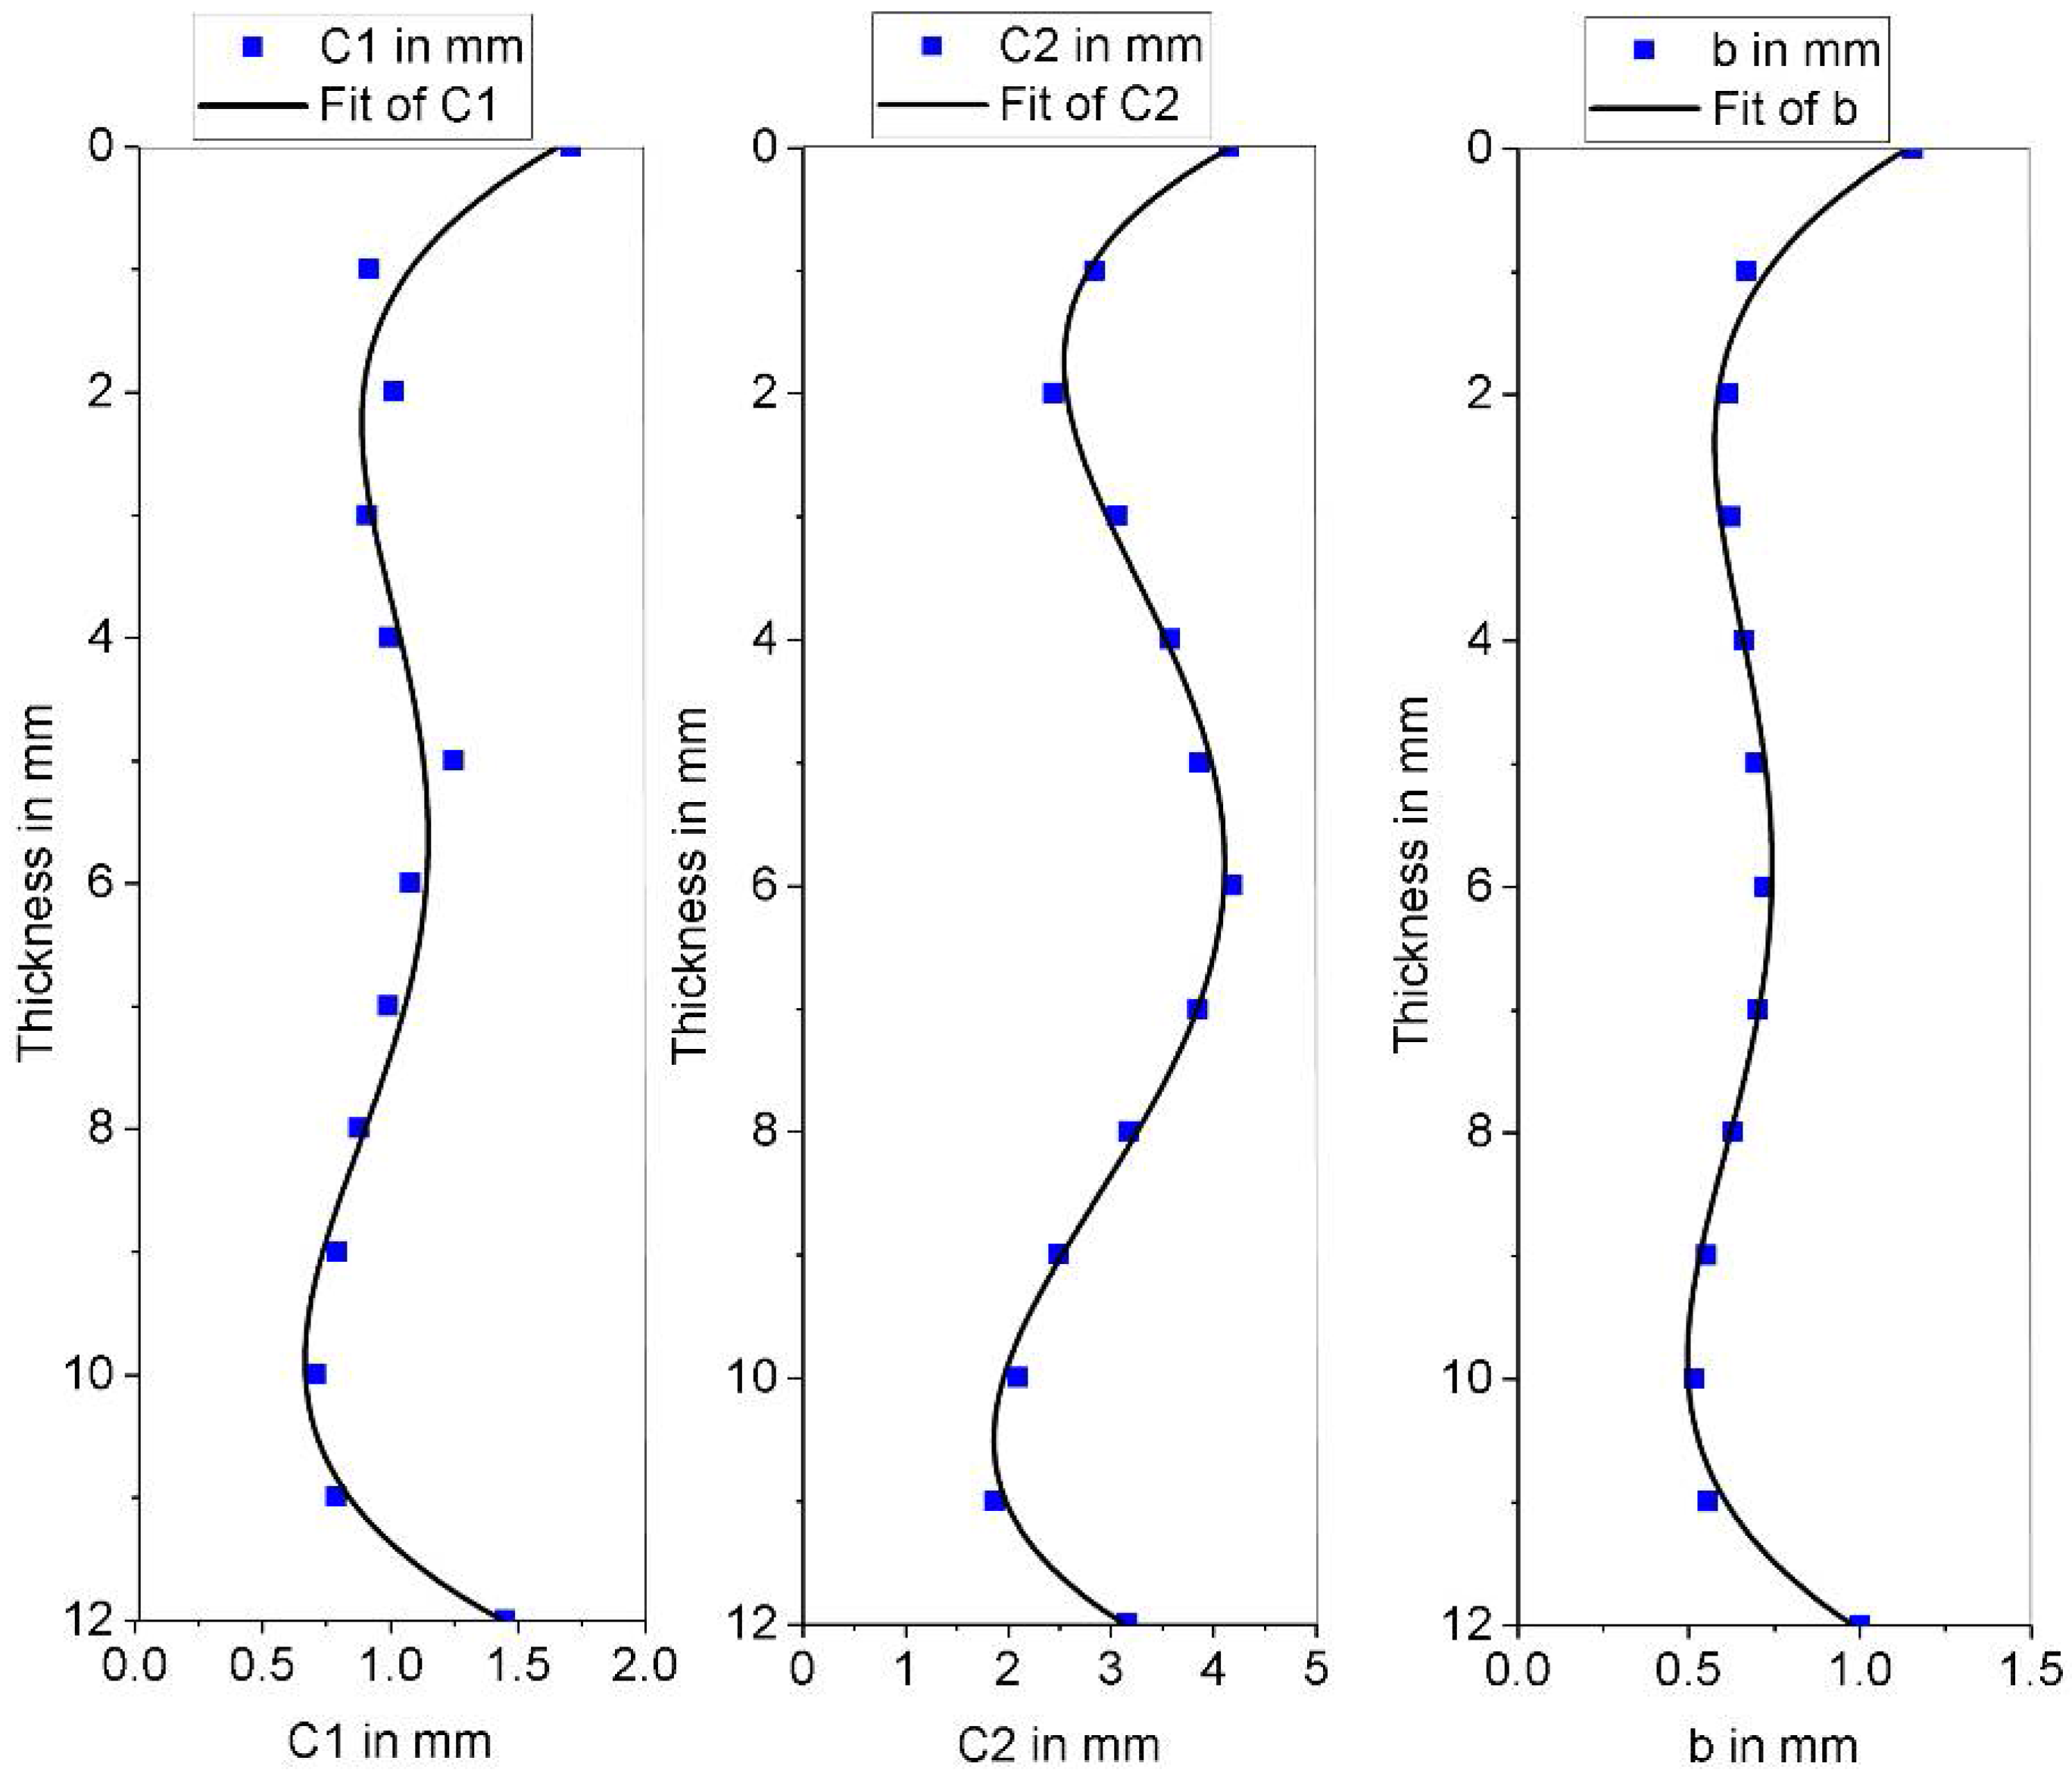
- Approximated simplified and fixed keyhole geometry from the weld cross-section (see Figure 4), used as a model parameter to adapt the numerical to the experimental results. Thus, effects caused by keyhole oscillations were not considered.
- Shear stress due to the interaction of metal vapor and liquid metal was not considered.
- Heat losses by radiation were neglected due to the high relation of volume versus surface of the plate.
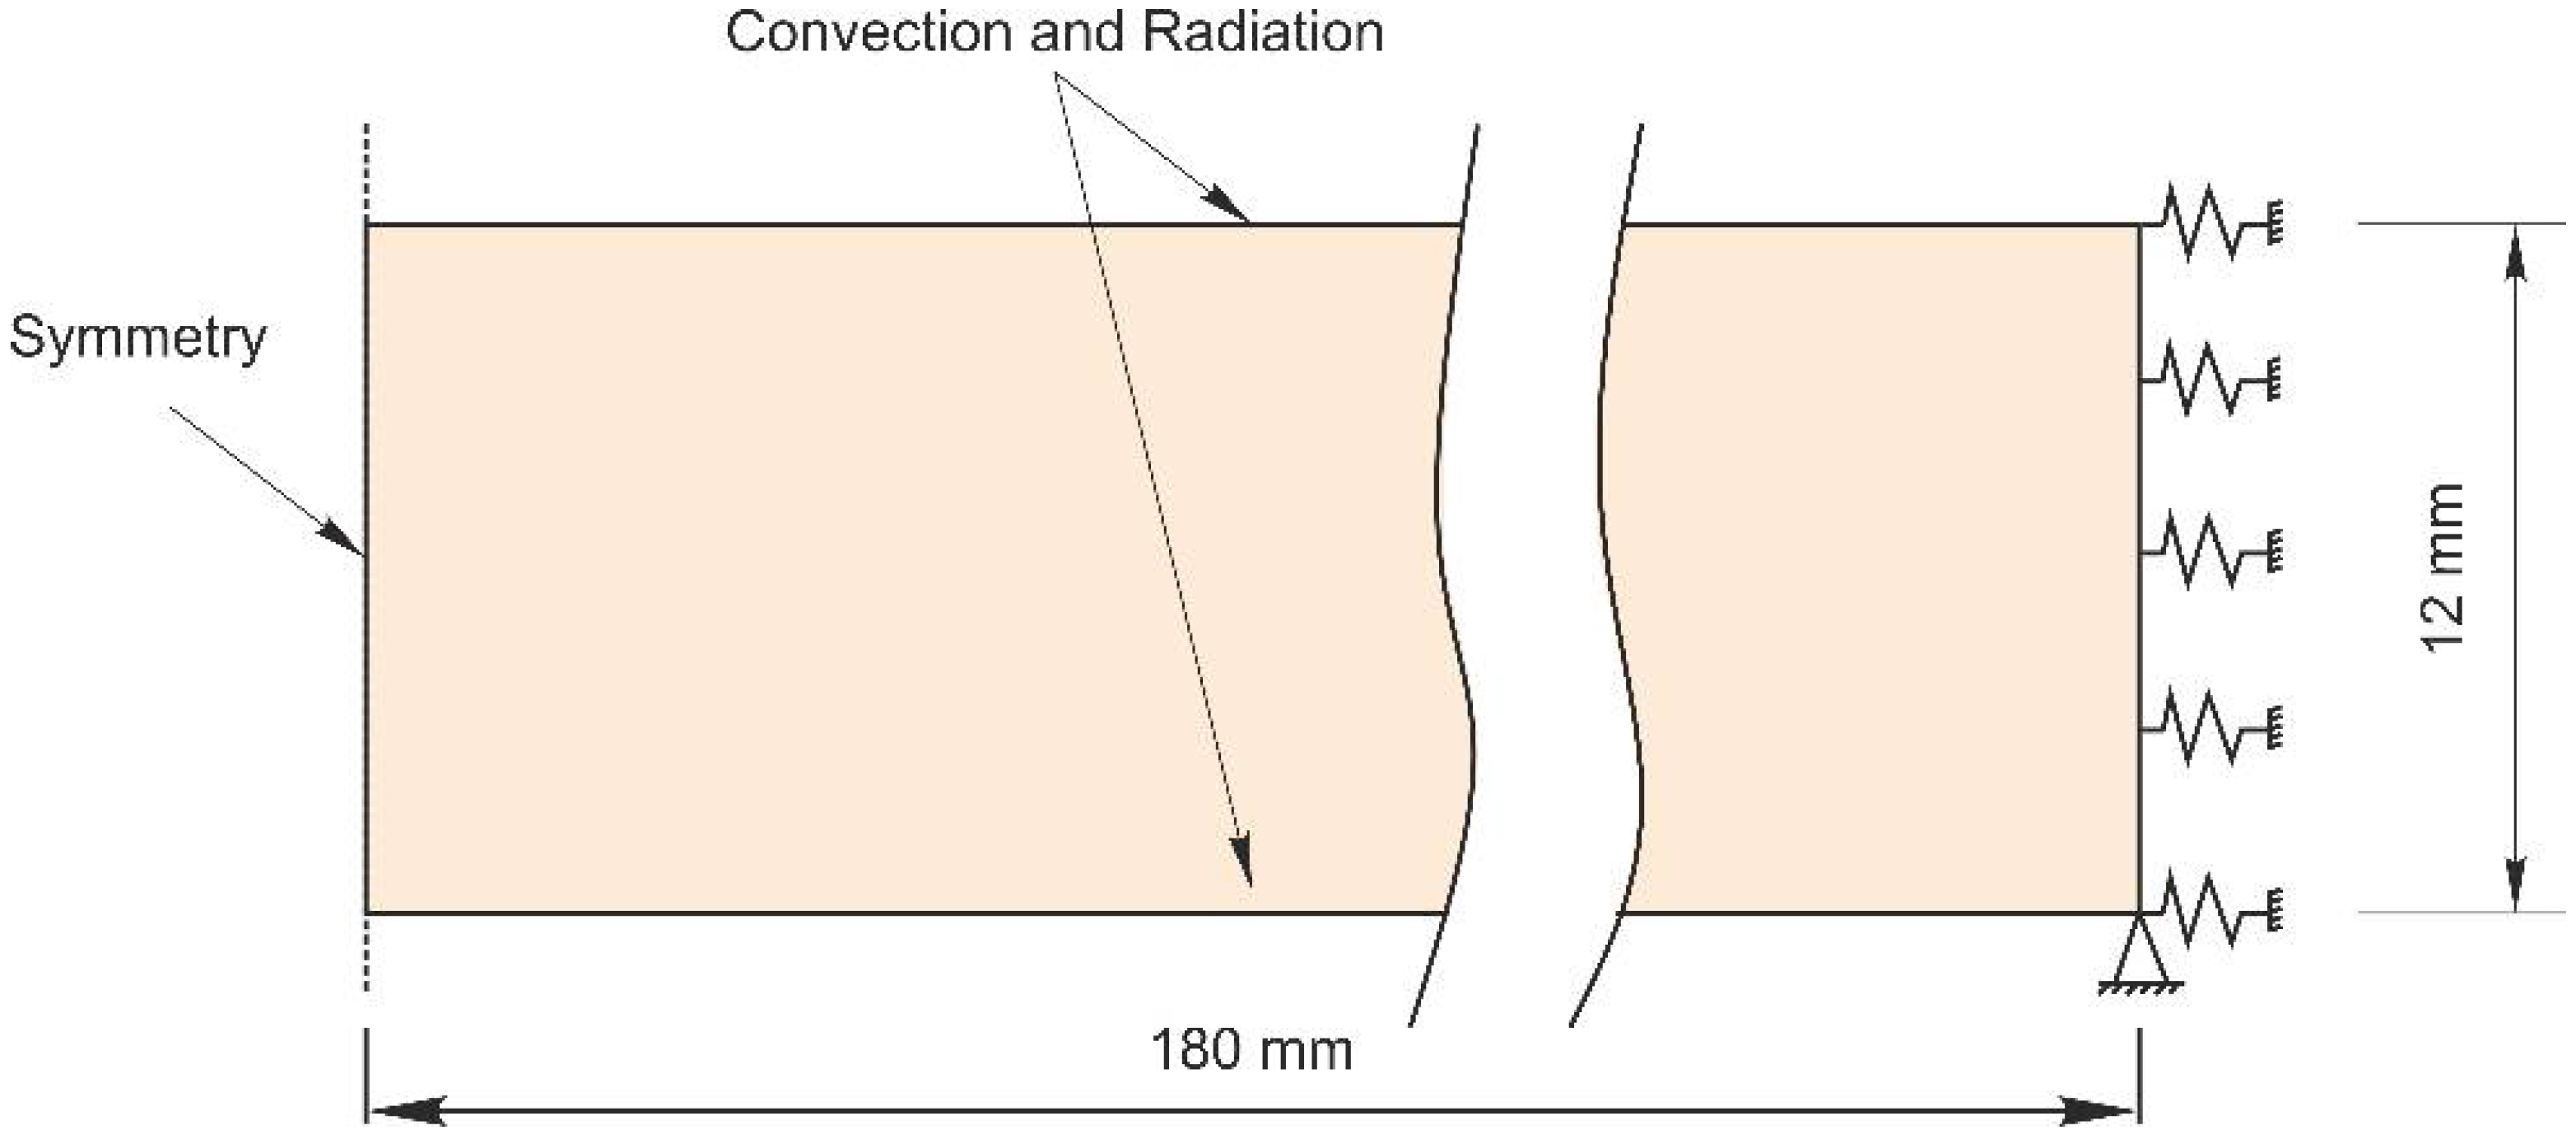
2.2. Thermo-Mechanical Model
3. Results and Discussion
4. Conclusions
Author Contributions
Funding
Conflicts of Interest
References
- Kelly, S.M.; Brown, S.W.; Tressler, J.F.; Martukanitz, R.P.; Ludwig, M.J. Using hybrid laser-arc welding to reduce distortion in ship panels. Weld. J. 2009, 88, 32–36. [Google Scholar]
- Apblett, W.R.; Pellini, W.S. Factors Which Influence Weld Hot Cacking. Weld. Res. Suppl. 1954, 33, 83–90. [Google Scholar]
- Prokhorov, N.N. Resistance to hot tearing of cast metals during solidification. Russ. Cast. Prod. 1962, 2, 172–175. [Google Scholar]
- Prokhorov, N.N. The problem of the strength of metals while solidifying during welding. Svar. Proizv. 1956, 6, 5–11. [Google Scholar]
- Prokhorov, N.N. The Technological Strength of Metals while Crystallising during Welding. Svar. Proizv. 1962, 4, 1–8. [Google Scholar]
- Zacharia, T. Dynamic Stresses in Weld Metal Hot Cracking. Weld. Res. Suppl. 1994, 73, 164–172. [Google Scholar]
- Feng, Z.; David, S.A.; Zacharia, T.; Tsai, C.L. Quantification of Thermomechanical Conditions for Weld Solidification Cracking. Sci. Technol. Weld. Join. 1997, 2, 11–19. [Google Scholar] [CrossRef]
- Feurer, U. Influence of alloy composition and solidification conditions on dendrite arm spacing, feeding and hot tearing properties of aluminium alloys. In Proceedings of the International Symposium on Engineering Alloys, Delft, The Netherlands, 3–4 March 1977; pp. 131–145. [Google Scholar]
- Shida, T.; Okumura, H.; Kawada, Y. Effects of welding parameters and prevention of defects in deep penetration electron beam welding of heavy section steel plates. Weld. World 1979, 17, 196–207. [Google Scholar]
- Tsukamoto, S.; Irie, H. Mechanism of locally delayed solidification in electron beam welding. Weld. Int. 1991, 5, 177–183. [Google Scholar] [CrossRef]
- Tsukamoto, S.; Irie, H. Welding defects and molten metal behaviour in low speed electron beam welding. Weld. World 1985, 23, 130–140. [Google Scholar]
- Gebhardt, M.O.; Gumenyuk, A.; Rethmeier, M. Solidification cracking in laser GMA hybrid welding of thick-walled parts. Sci. Technol. Weld. Join. 2014, 19, 209–213. [Google Scholar] [CrossRef]
- Gebhardt, M.O.; Quiroz Penaranda, V.; Gumenyuk, A.; Rethmeier, M. Restraint effects on stresses and strains in single-run high power laser beam welding of thick plates. Math. Model. Weld Phenom. 2010, 9, 1011–1033. [Google Scholar]
- Barbetta, L.D. Solidification Flaw and Porosity Formation in Hybrid Laser: GMA Welding of Thick API 5L X70 Steel Plates; Universidade Federal de Santa Catarina: Florianópolis, Brazil, 2014. [Google Scholar]
- Schaefer, M.; Kessler, S.; Scheible, P.; Graf, T. Modulation of the laser power to prevent hot cracking during laser welding of tempered steel. J. Laser Appl. 2017, 29, 42008. [Google Scholar] [CrossRef]
- Satoh, K.; Ueda, Y.; Kiharak, H. Recent trend of researches on restraint stresses and strains for weld cracking. Trans. JWRI 1972, 42, 53–68. [Google Scholar] [CrossRef]
- Matsubuchi, K. Analysis of Welded Structure; Pergamon Press: Oxford, UK, 1980. [Google Scholar]
- Wongpanya, P.; Boellinghaus, T. Residual Stress Distribution in Competing S 1100 QL Butt-Welds Dependent on Plate Thickness and Restraint Length. In Proceedings of the Conference on High Strenght Steels for Hydropower Plants, Takasaki, Japan, 20–22 July 2009; pp. 1–11. [Google Scholar]
- Cross, C.E.; Böllinghaus, T. The Effect of Restraint on Weld Solidiflcation Cracking in Aluminium. Weld. World 2005, 2, 458–463. [Google Scholar]
- Bachmann, M.; Avilov, V.; Gumenyuk, A.; Rethmeier, M. Numerical simulation of full-penetration laser beam welding of thick aluminium plates with inductive support. J. Phys. D 2011, 45, 35201. [Google Scholar] [CrossRef]
- Bachmann, M.; Avilov, V.; Gumenyuk, A.; Rethmeier, M. About the influence of a steady magnetic field on weld pool dynamics in partial penetration high power laser beam welding of thick aluminium parts. Int. J. Heat Mass Transf. 2013, 60, 309–321. [Google Scholar] [CrossRef]
- Artinov, A.; Bachmann, M.; Rethmeier, M. Equivalent heat source approach in a 3D transient heat transfer simulation of full-penetration high power laser beam welding of thick metal plates. Int. J. Heat Mass Transf. 2018, 122, 1003–1013. [Google Scholar] [CrossRef]
- Sysweld Material Database; ESI Group: Paris, France, 2009.
- Gebhardt, M.O.; Gumenyuk, A.; Rethmeier, M. Numerical analysis of hot cracking in laser-hybrid welded tubes. Adv. Mater. Sci. Eng. 2013, 2013, 1–8. [Google Scholar] [CrossRef]
- Quiroz, V.; Gebhardt, M.; Gook, S. Hot cracking in high power laser beam welding of thick high strength structural steels under restraint conditions. In Proceedings of the ICALEO 2010—29th International Congress on Applications of Lasers & Electro-Optics, Anaheim, CA, USA, 26–30 September 2010; pp. 225–232. [Google Scholar]
- Schuster, J. Heißrisse in Schweißverbindungen—Entstehung, Nachweis und Vermeidung; DVS-Berich 233; DVS-Verlag: Düsseldorf, Germany, 2004. [Google Scholar]
- Lampa, C.; Kaplan, A.F.H.; Powell, J.; Magnusson, C. An analytical thermodynamic model of laser welding. J. Phys. D 1997, 30, 1293–1299. [Google Scholar] [CrossRef]
- Rahman Chukkan, J.; Vasudevan, M.; Muthukumaran, S.; Ravi Kumar, R.; Chandrasekhar, N. Simulation of laser butt welding of AISI 316L stainless steel sheet using various heat sources and experimental validation. J. Mater. Process. Technol. 2015, 219, 48–59. [Google Scholar] [CrossRef]
- Kumar, S.; Kundu, A.; Venkata, K.A.; Evans, A.; Truman, C.E.; Francis, J.A.; Bhanumurthy, K.; Bouchard, P.J.; Dey, G.K. Residual stresses in laser welded ASTM A387 Grade 91 steel plates. Mater. Sci. Eng. A 2013, 575, 160–168. [Google Scholar] [CrossRef]
- Dal, M.; Fabbro, R. An overview of the state of art in laser welding simulation. Opt. Laser Technol. 2015, 78, 1–13. [Google Scholar] [CrossRef]
- Cross, C.E. On the Origin of Weld Solidification Cracking. In Hot Cracking Phenomena in Welds; Springer: Berlin, Germany, 2005; pp. 3–18. [Google Scholar]


| C | Si | Mn | P | S | Cr | Cu | Mo | Fe |
|---|---|---|---|---|---|---|---|---|
| 0.088 | 0.34 | 1.38 | 0.011 | 0.002 | 0.048 | 0.020 | 0.007 | Bal. |
| Parameters | Value |
|---|---|
| Laser power | 14 kW |
| Welding speed | 2 m/min |
| Focal position | −2 mm |
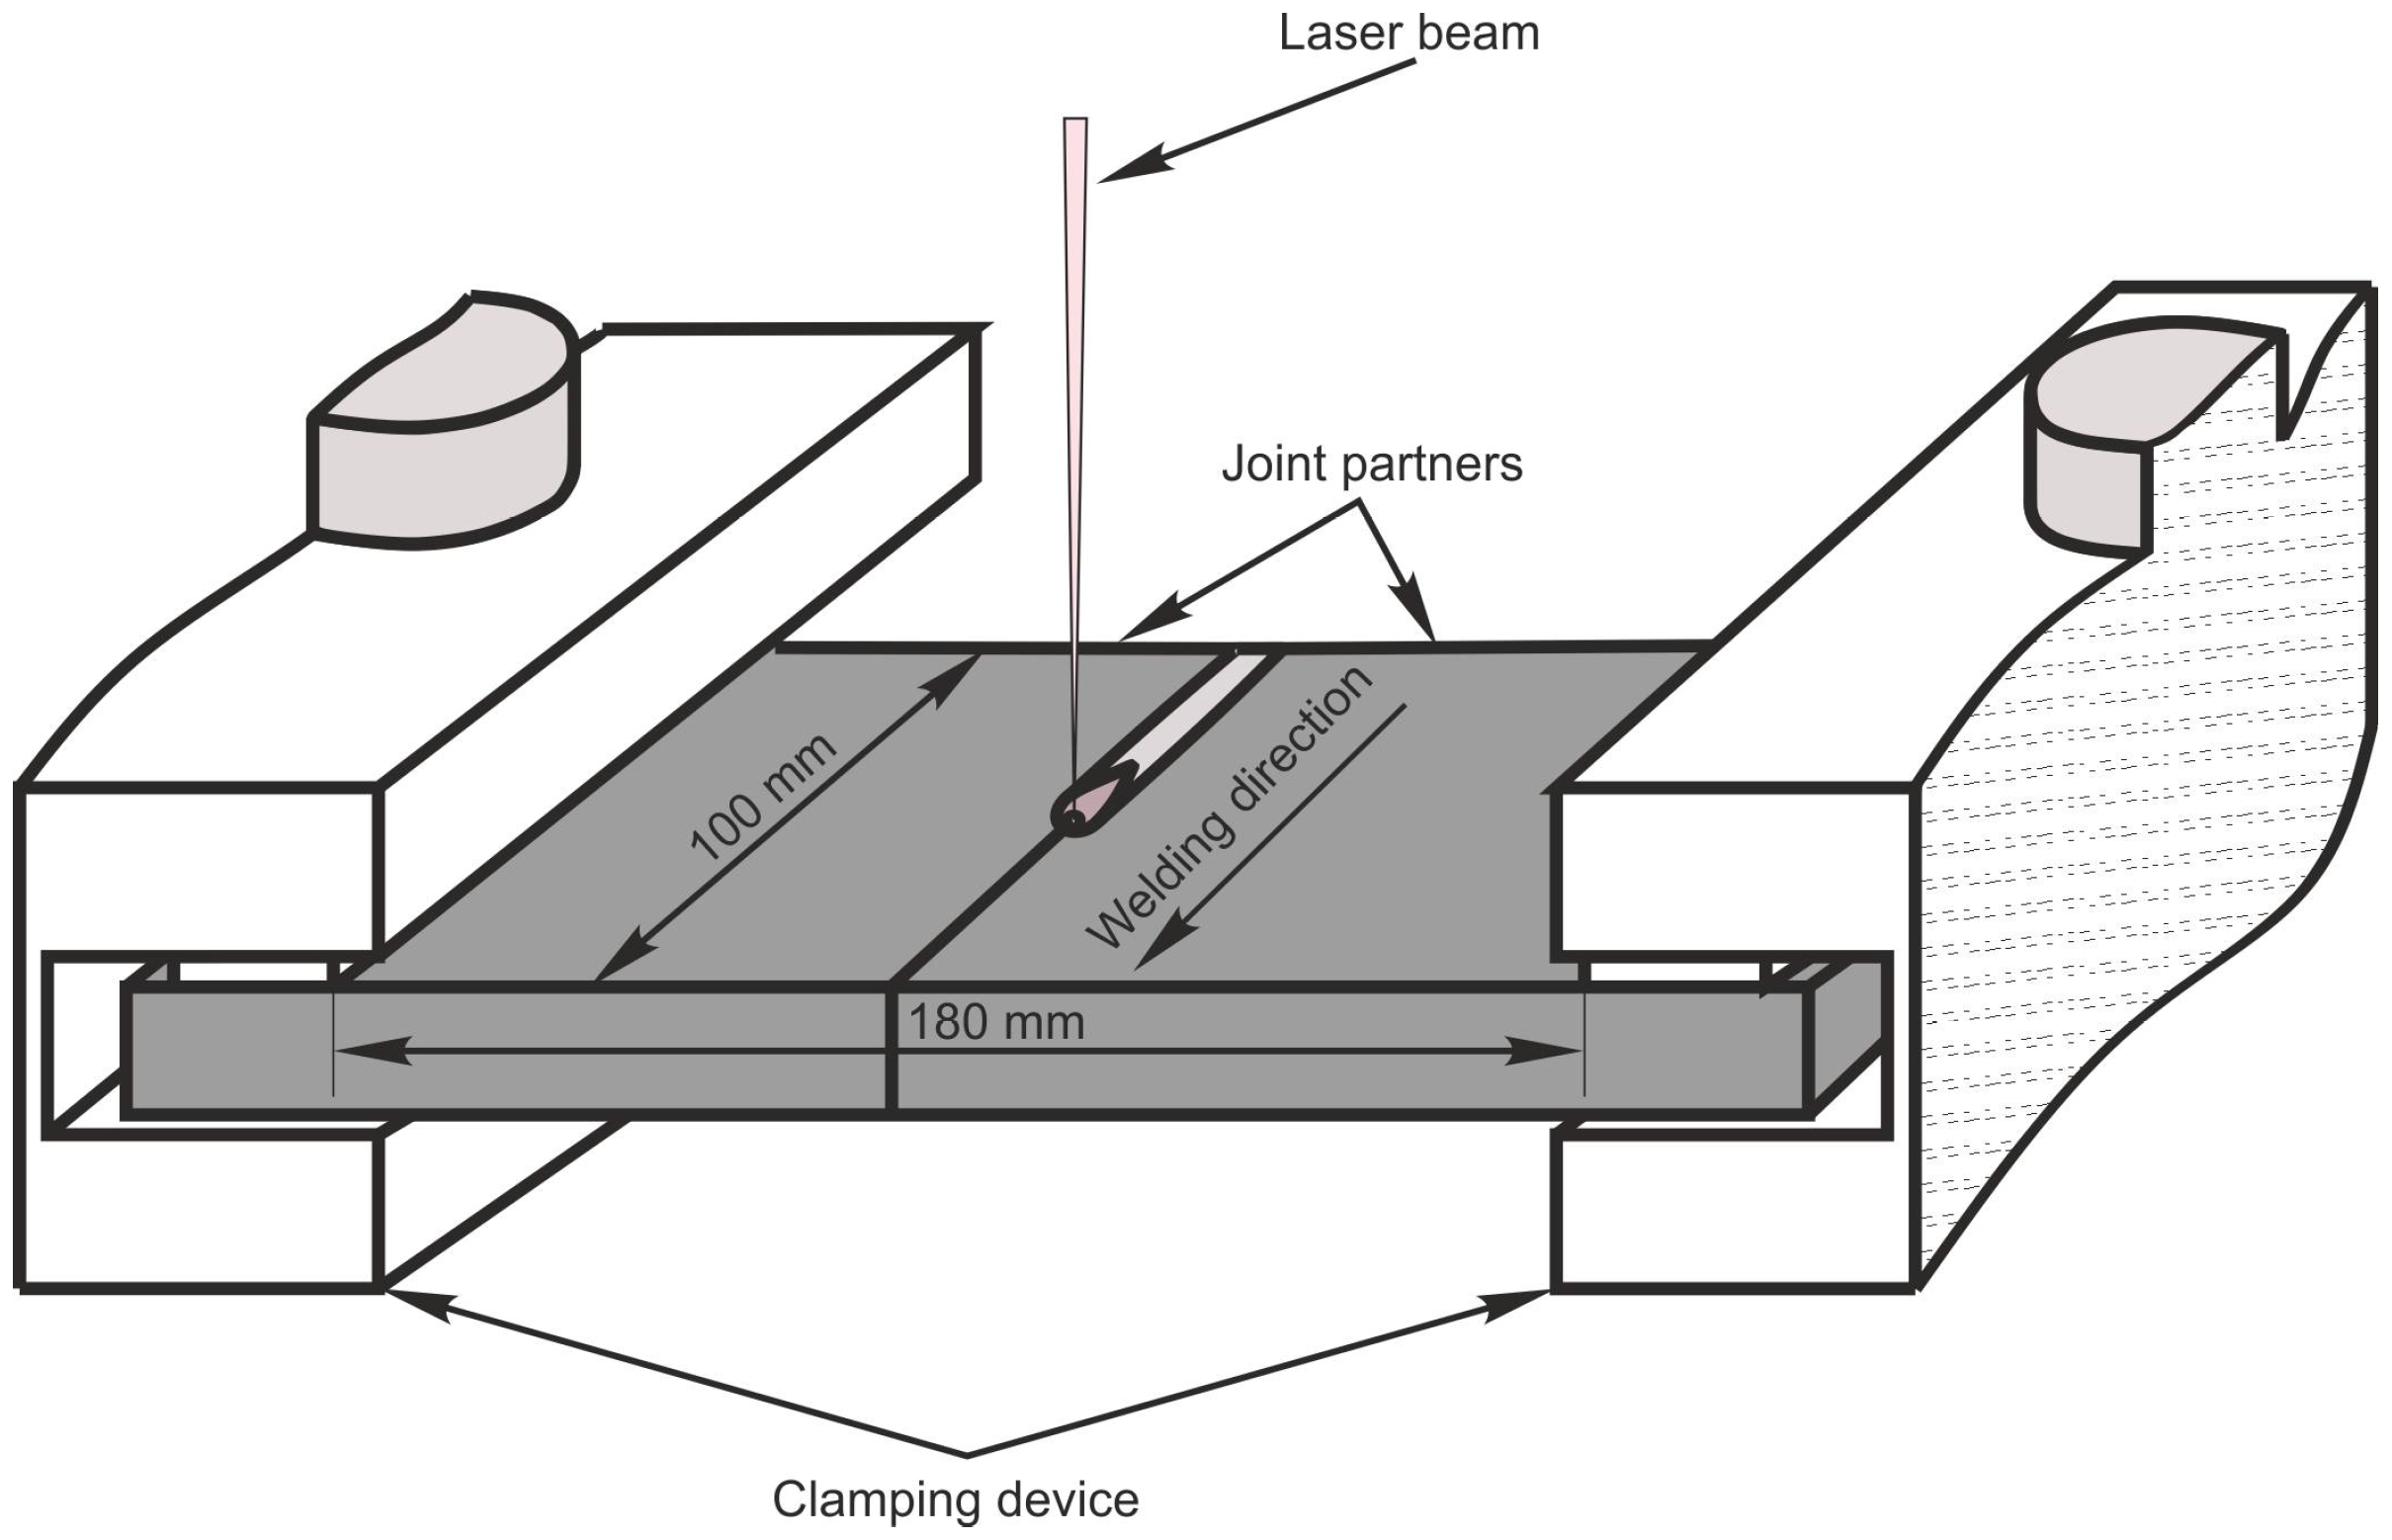
| Weld seam length | 100 mm |
| Plate thickness | 12 mm |
| Shielding gas | N2 |
| Restraint intensity | 12.6 kN/(mm·mm) |
© 2018 by the authors. Licensee MDPI, Basel, Switzerland. This article is an open access article distributed under the terms and conditions of the Creative Commons Attribution (CC BY) license (http://creativecommons.org/licenses/by/4.0/).
Share and Cite
Bakir, N.; Artinov, A.; Gumenyuk, A.; Bachmann, M.; Rethmeier, M. Numerical Simulation on the Origin of Solidification Cracking in Laser Welded Thick-Walled Structures. Metals 2018, 8, 406. https://doi.org/10.3390/met8060406
Bakir N, Artinov A, Gumenyuk A, Bachmann M, Rethmeier M. Numerical Simulation on the Origin of Solidification Cracking in Laser Welded Thick-Walled Structures. Metals. 2018; 8(6):406. https://doi.org/10.3390/met8060406
Chicago/Turabian StyleBakir, Nasim, Antoni Artinov, Andrey Gumenyuk, Marcel Bachmann, and Michael Rethmeier. 2018. "Numerical Simulation on the Origin of Solidification Cracking in Laser Welded Thick-Walled Structures" Metals 8, no. 6: 406. https://doi.org/10.3390/met8060406
APA StyleBakir, N., Artinov, A., Gumenyuk, A., Bachmann, M., & Rethmeier, M. (2018). Numerical Simulation on the Origin of Solidification Cracking in Laser Welded Thick-Walled Structures. Metals, 8(6), 406. https://doi.org/10.3390/met8060406