Article

Investigations into the Surface Strain/Stress State in a Single-Crystal Superalloy via XRD Characterization

1
School of Materials Science and Engineering, Beihang University, Beijing 100191, China
2
ICMMO/SP2M, University Paris-Sud, bat. 410, 91405 Orsay, France
*
Authors to whom correspondence should be addressed.
Metals 2018, 8(6), 376; https://doi.org/10.3390/met8060376
Submission received: 21 April 2018 / Revised: 19 May 2018 / Accepted: 21 May 2018 / Published: 23 May 2018

Abstract

:
The present study was aimed at determining the surface strain/stress state in an Ni-based single-crystal (SC) superalloy that was subjected to two different cooling rates from solid solution temperature through using the X-ray diffraction (XRD) method. The normal stresses σ 11 s and σ 22 s were determined, then the Von Mises stresses ( σ V M s ) were derived from them. Field emission gun scanning electron microscope (FEG-SEM) and transmission electron microscope (TEM) micrographs were taken to illustrate the strain/stress state change. The precipitation of the secondary γ′ phases in the γ phase and the formation of the dislocation in the interphase upon a slower cooling rate caused the γ phase lattice distortion to increase, so a larger σ V M s of the γ phase was realized in comparison to the faster cooling sample. For both of the two cooling modes, we found that the σ V M s of the γ′ phase increased due to the growth of the γ′ phase during the aging process. Also, the aging process led to pronouncedly anisotropic lattice mismatches in the {331} and {004} planes. In addition, the surface strain/stress states of a cylinder sample and a tetragonal sample were also studied using a faster cooling rate, and σ 11 s and σ 22 s were analyzed to explain the influence of the shape factor on the stress anisotropy in the [001] and [ 1 1 ¯ 0 ] orientations. The strain in the [001] orientation of the γ phase is more sensitive to the shape change.

1. Introduction

Gas turbine blades that are exposed to high temperature combustion gas during operation are made by a precision casting process of Ni-based single-crystal superalloys [1,2]. A large thermal stress is usually caused by the temperature gradient through the thickness direction due to the using of an internal air-cooling system in the blades [3,4,5]. The stress causes surface recrystallization, thermal barrier coating (TBC) separation, and fatigue crack nucleation that are detrimental to the blades [6,7,8]. During the generation process of these detrimental behaviors, the surface strain/stress state is changed sensitively [9]. So, it is of great importance to evaluate the surface strain/stress state, which can effectively understand these behaviors.
For the study of the surface strain/stress state, the X-ray diffraction method with higher resolution and better surface sensitivity is usually adopted and many methodologies have been proposed, such as the sin 2   Ψ method [10] and the Willianmson–Hall method [11,12,13]. Specific to single-crystal (SC) samples, the ‘Ortner’ method [14] is the most commonly used. In the last 20 years, works have been conducted to investigate the strain/stress state in SC nickel-based superalloys. The strain/stress state of Ni-based SC superalloy samples that went through thermo-mechanical fatigue, creep-deformation, and shot-peening have been experimentally studied [15,16,17]. B. Marty. et al. [18] studied the internal stress state of the SC superalloy SRR99 with an NiAl coating by XRD. Thermal mechanical fatigue and untested samples were prepared, then the residual stresses in the γ/γ′ phase of the surface (close to the coating) and bulk were determined. Marty et al. concluded that compared to the untested sample, the γ′ stress in three orientations of {001} planes in the surface zone (close to the coating) were not equivalent. This conclusion is consistent with the observation of the anomalous rafting in this zone. Amélie Morançais et al. [19] researched the effect of shot-peening on the low-cycle fatigue life of AM1 superalloy by XRD. Compressive stresses of up to 1000–1400 MPa were found on the surface layer by XRD. These effects were proved both by experiments and finite element calculations. The result showed that the increase of the fatigue lifetime due to the compressive stresses was between a factor of 4 and 10.
In the previous works dealing with Ni-based SC superalloys strain/stress research, the macro-stress was always involved, and its correlations with the material performance were discussed [15,16,17,20]. However, the Ni-based SC superalloys were composed of an fcc γ-matrix and coherently aligned L12-ordered γ′-precipitates and had a unique two-phases mismatch structure [21,22], which has not been taken into consideration in the aforementioned works. So, the lattice distortion, induced by the phase structure and these phases’ lattice misfit, should be involved, and its relations to the γ/γ′ strain/stress have not been fully elucidated up to now. In this paper, samples of different lattice distortion levels, induced by different dislocation deposits and the γ′-precipitation phenomenon, were discussed to study the effects of lattice distortion on the γ/γ′ phase surface strain/stress state. Cylinder samples subjected to two different cooling rates from solid solution temperature were analyzed to carry out this experiment. Apart from studying the surface strain/stress change caused by different solid solution cooling rates, the sample shape factor is also studied. A cylinder sample and a tetragonal sample that experienced the faster cooling speed were used, and they can roughly imitate the cross section and the longitudinal section of the blades, respectively. All of the tested samples were of [110] orientation. Thus, the anisotropy of the strain/stress in the two orientations [001] and [ 1 1 ¯ 0 ] , which were parallel to the (110) plane, could be detected. Moreover, the effect of the aging process on the surface strain/stress was also discussed.

2. Experimental Procedure

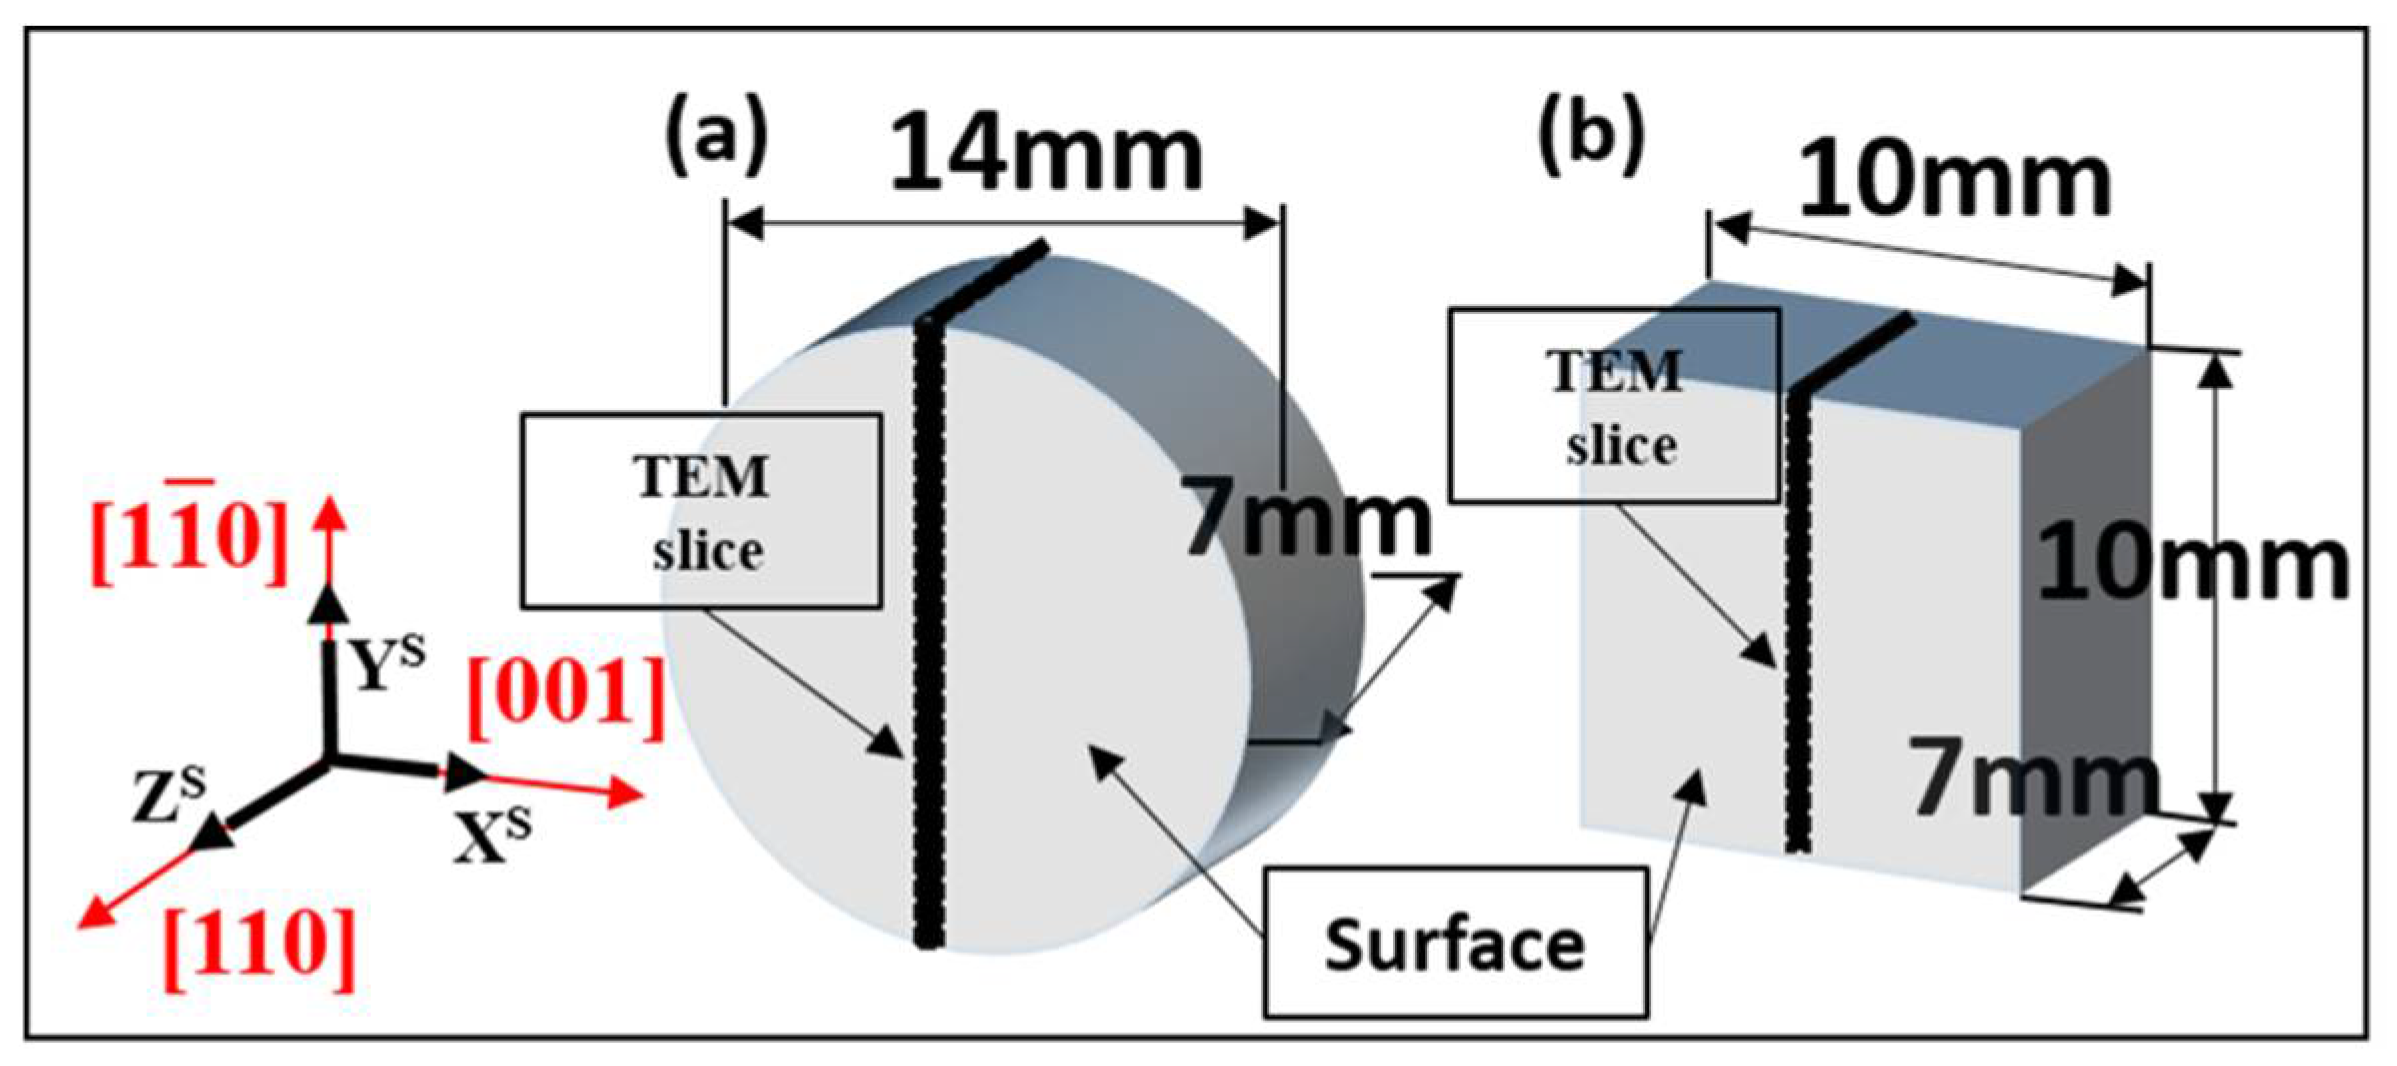
2.1. Material and Heat Treatment

The nominal composition of the SC superalloy used in this experiment is: (2–3) Cr, (4.5–5) Co, (7.5–8) Mo, (5.5–6) Al, (1–2) Re, (6–6.5) Ta, and the remainder Ni (wt. %). The SC rods are 150 mm in length and 14 mm in diameter and they are grown along the [110] direction by the high-rate solidification (HRS) method. Its axial orientation deviates within 6 deg from the [110] direction measured by Laue-back reflection. As can be seen in Figure 1, the experimental samples are cylinder and tetragonal and they are cut from the same rod using wire cut electrical discharge machining (WEDM). The size of the cylinder is Φ 14 mm × 7 mm and the tetragonal is a × a × c = 10 mm × 10 mm × 7 mm. For the tetragonal samples, the [001] and the [ 1 1 ¯ 0 ] crystal orientations are perpendicular to the adjacent square sides, respectively.
For the heat treatment regime, the solution treatment is 1295 °C/2 h + 1300 °C/4 h + 1305 °C/2 h + 1310 °C/4 h + 1315 °C/6 h + 1320 °C/4 h and the subsequent aging treatment is 1080 °C /2 h + 870 °C/32 h. Moreover, two different cooling modes from the solid solution temperature to room temperature were executed; one is directly placing a sample in water (20 °C) after taking it out of the furnace; the other one is cooling a sample in the furnace at a cooling rate of 5 °C/min. Five sample conditions are shown in Table 1. Then, we determined the surface strain/stress state in the middle area of the surface. FEG-SEM (FEI company, Eindhoven, Holland) and TEM (FEI company, Portland, OR, USA) were used to make microstructural investigations. The SEM samples were mechanically polished up to a mirror finish on the surface referred to in Figure 1. To reveal the γ/γ’ microstructure, samples were etched in a solution made of 4 g CuSO4, 20 mL HCl, and 20 mL H2O for 10 s. Microstructural observations were performed by a Quanta 200F field emission gun scanning electron microscope (FEI company, Eindhoven, Holland). Samples for TEM analysis were cut from the black position by the WEDM, as shown in Figure 1, by means of machining into thin discs of Φ 3 mm in diameter. The small discs were mechanically thinned by grinding using metallographic abrasion paper progressively to ~30 μm in thickness followed by twin-jet electrochemical polishing using an electrolyte of 10% perchloric acid and 90% ethanol at a temperature below −20° C. TEM observation was conducted in an FEI Tecnai G2 F20 TEM (FEI Company, Portland, OR, USA) operating at 200 kV. The incidence plane for the electron beam was (001). The microstructural investigations were carried out after the determination of the surface strain/stress by XRD (Rigaku, Tokyo, Japan).

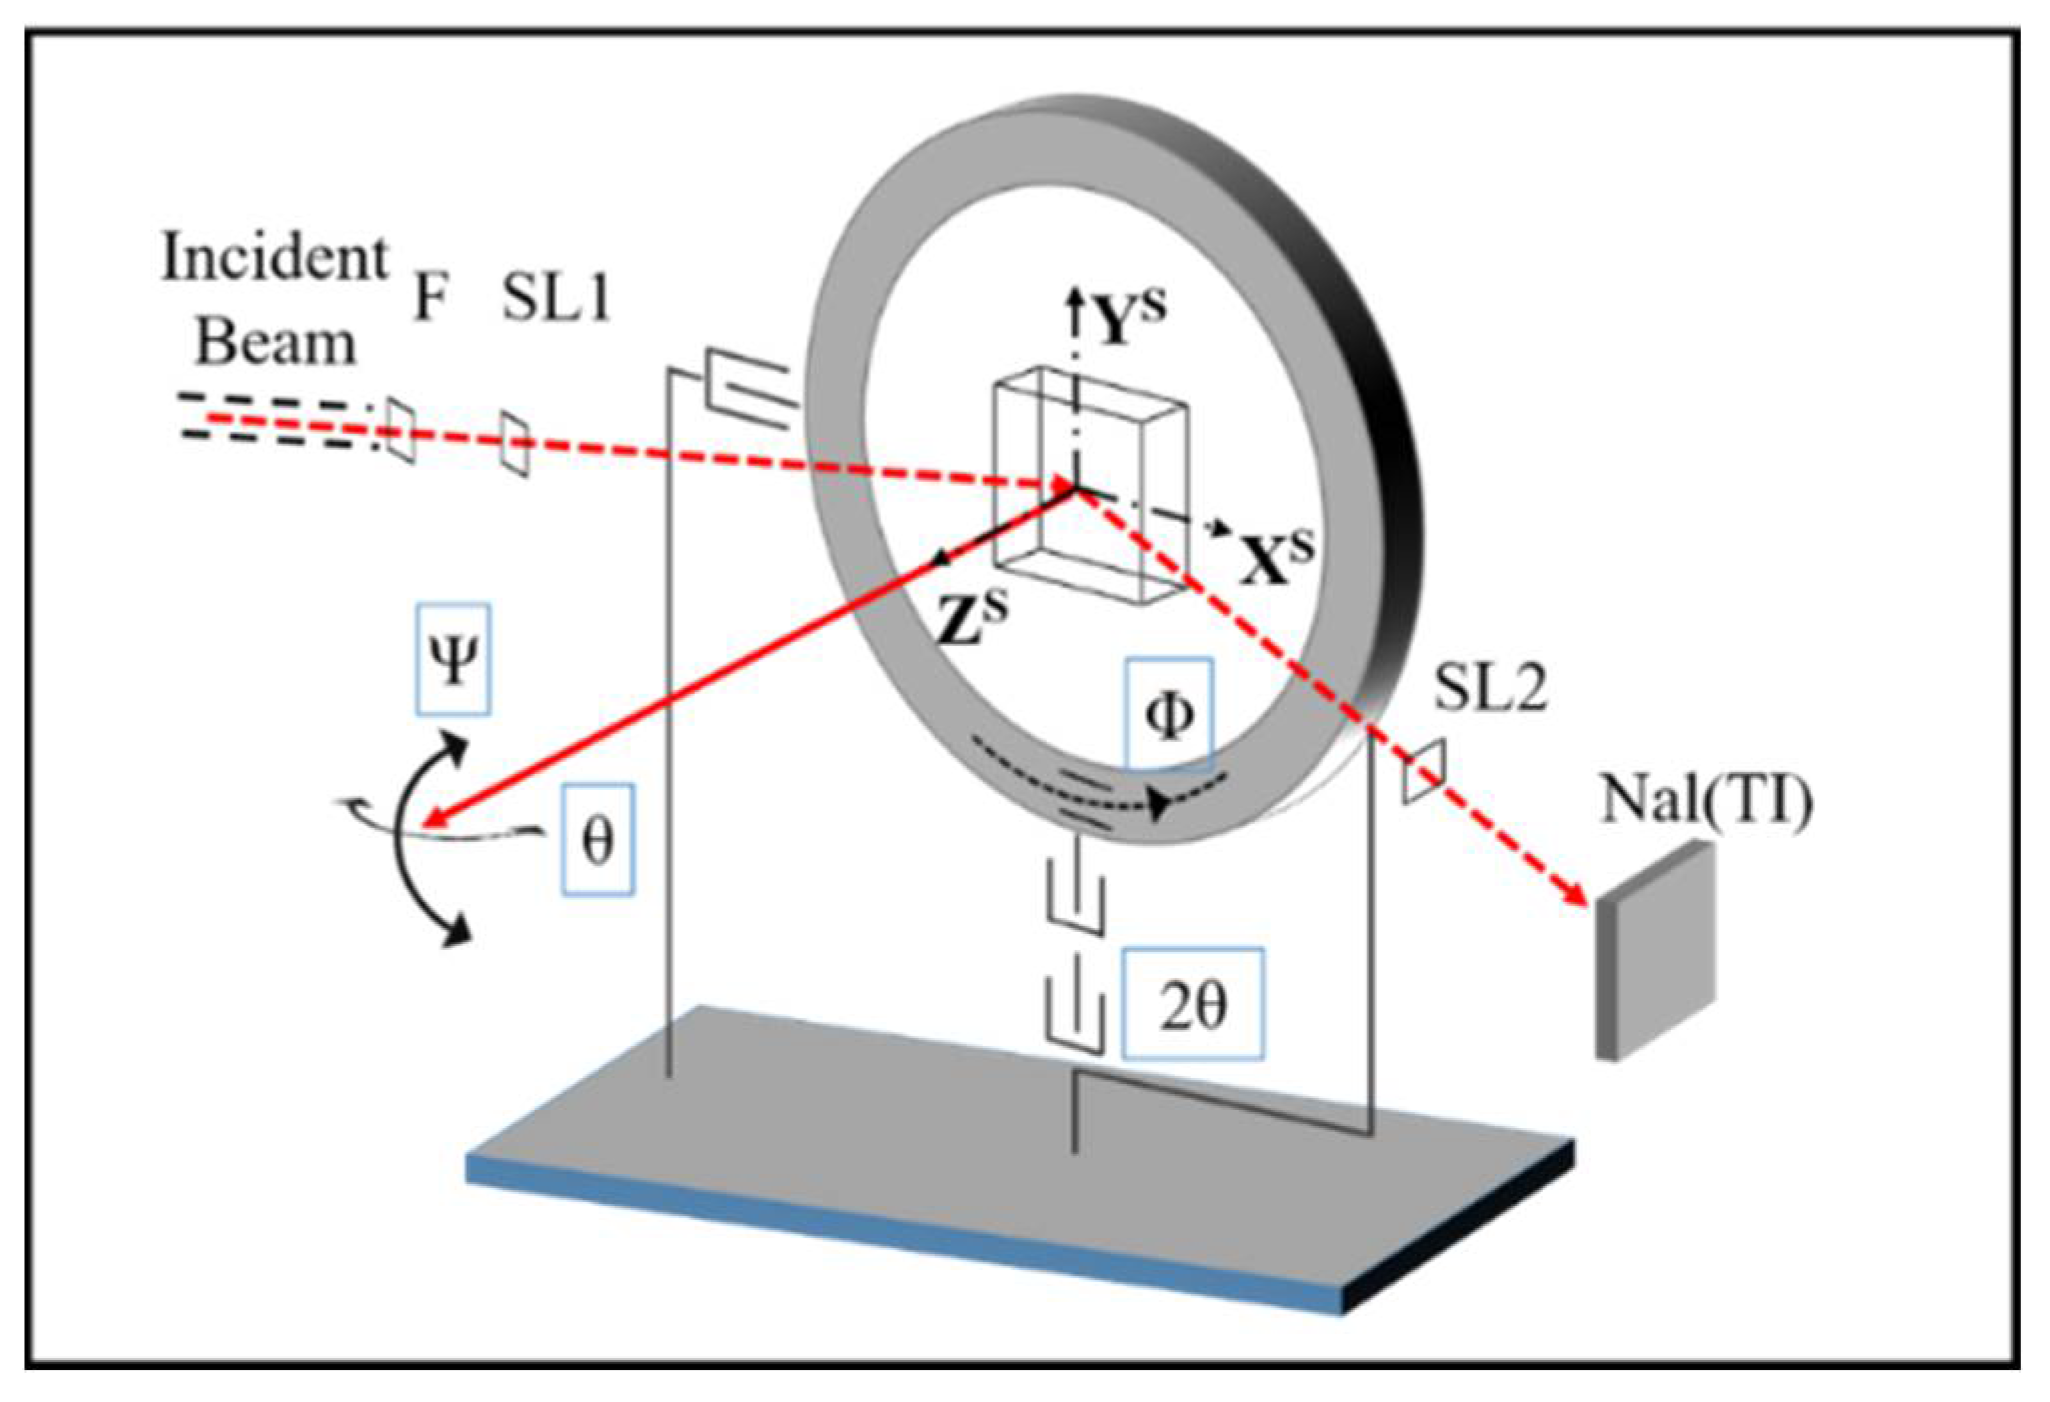
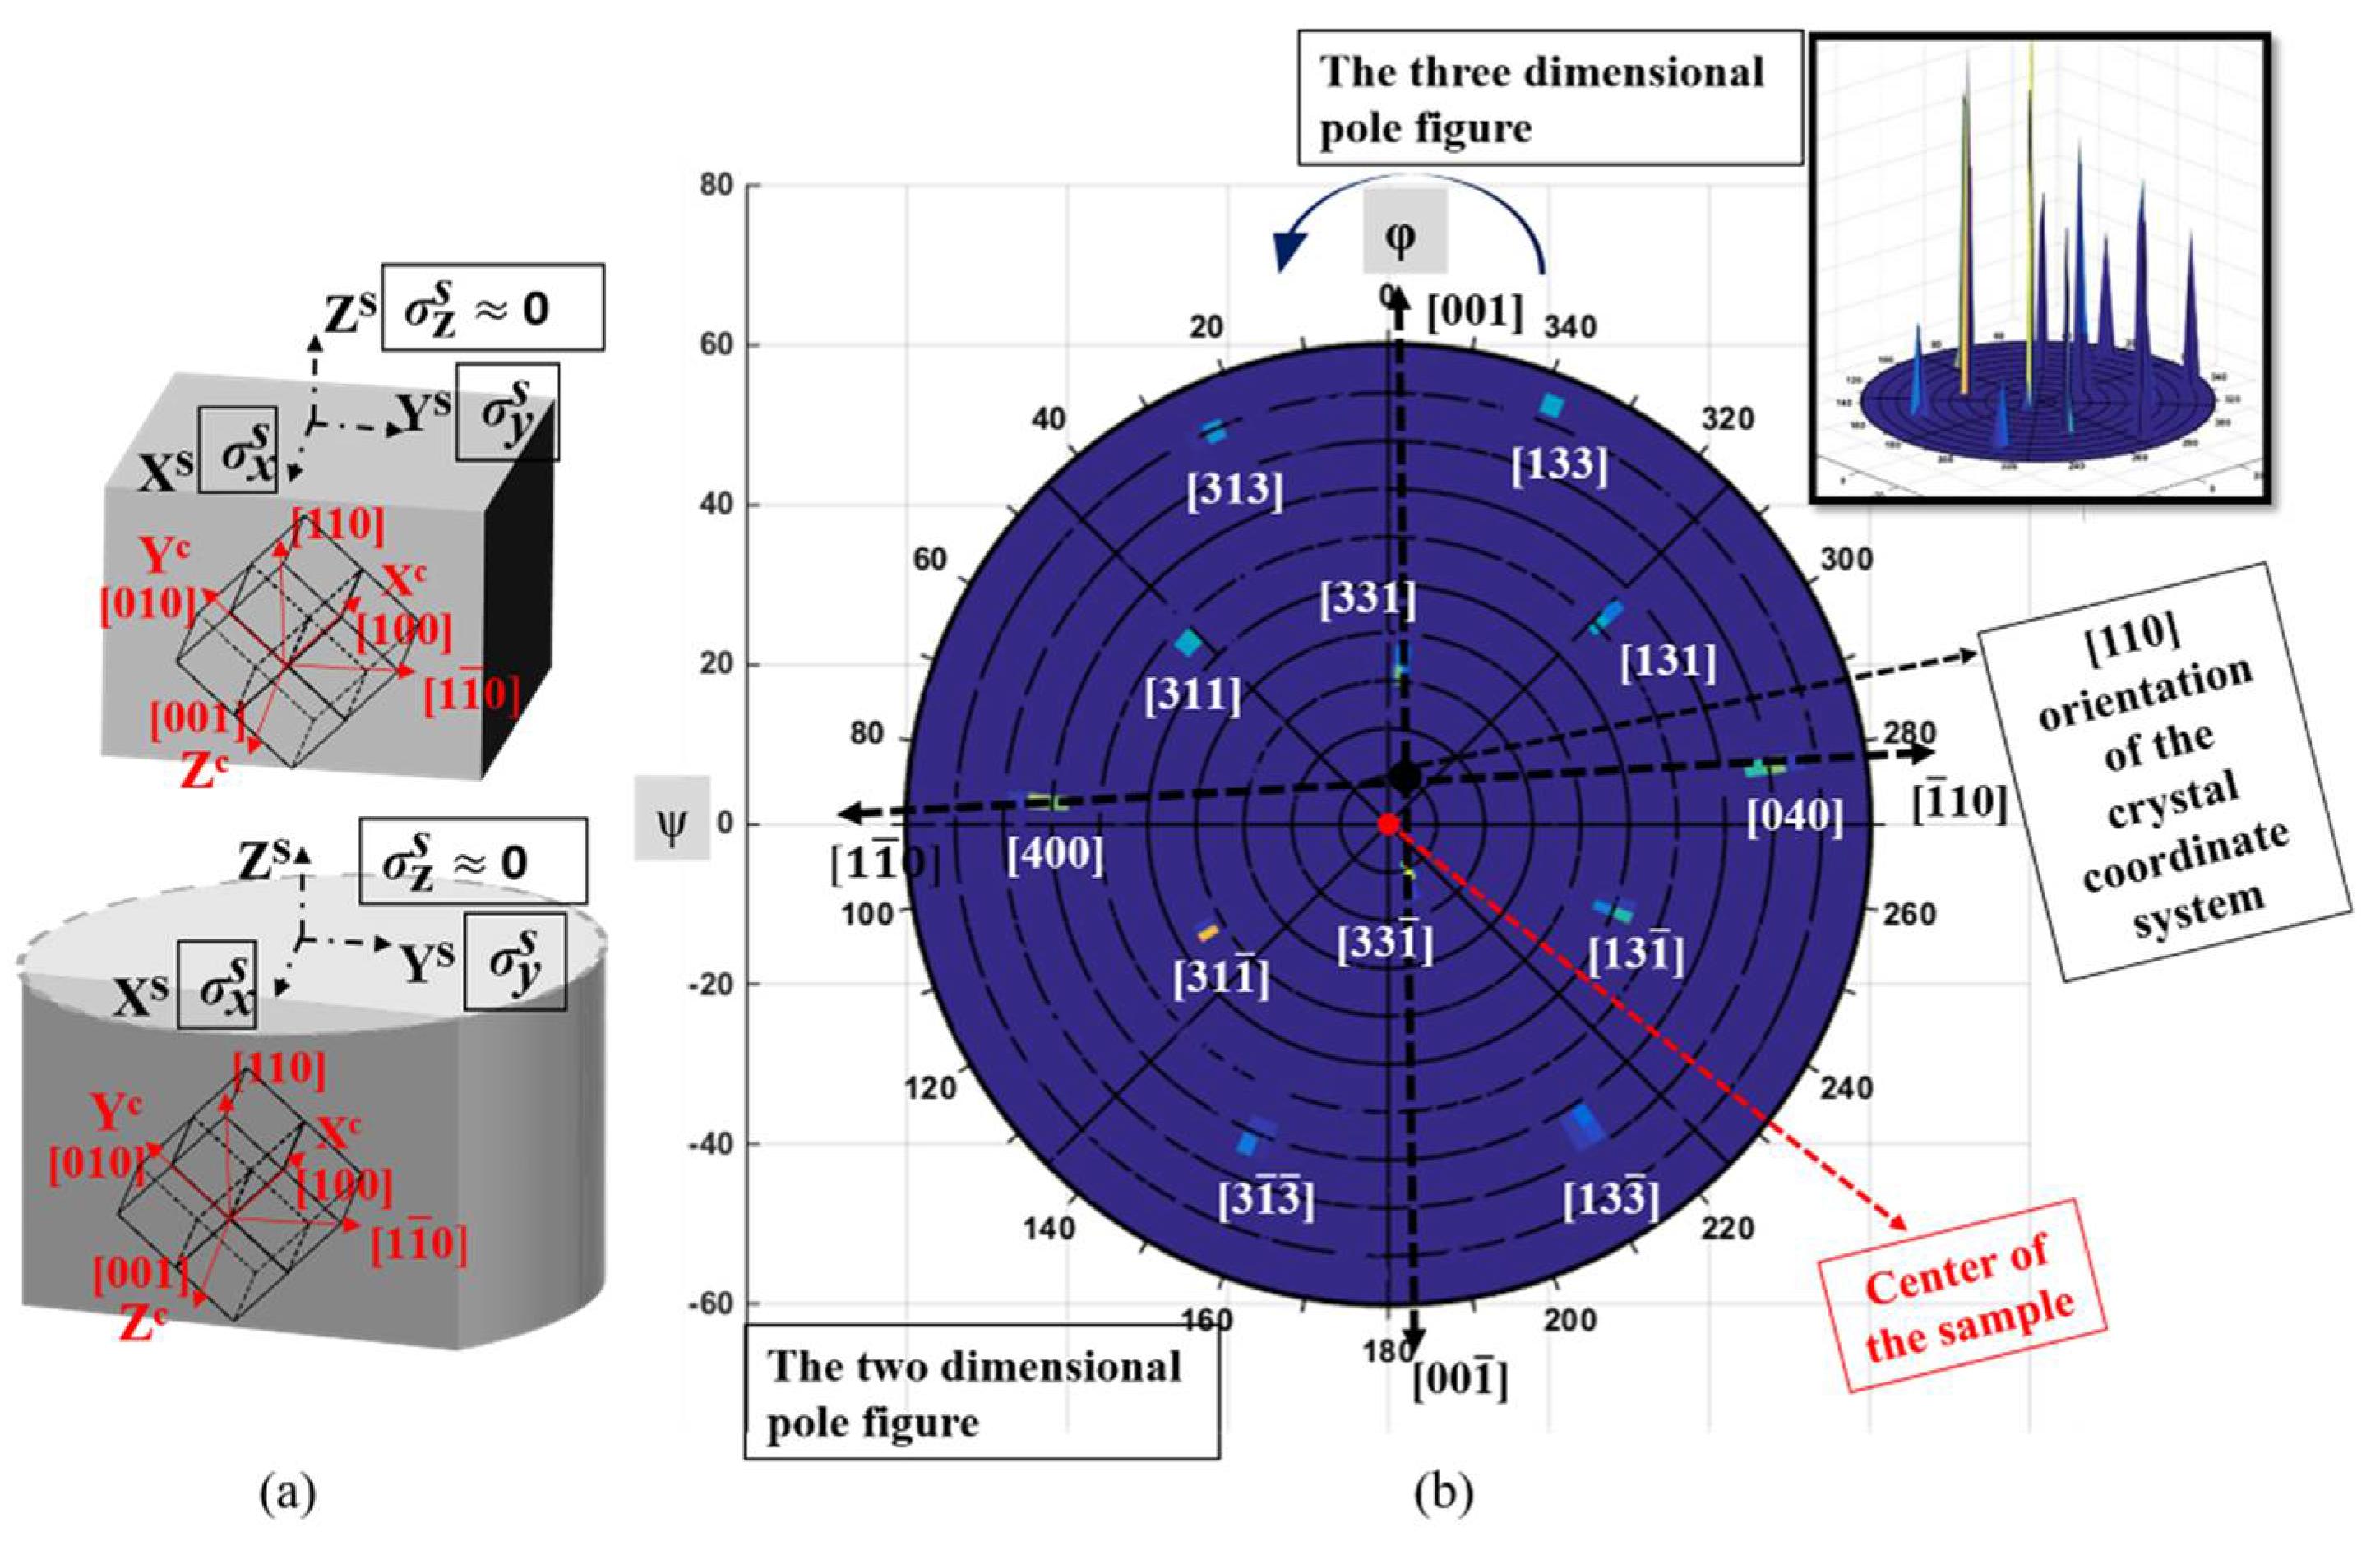
2.2. Determination Process of the Surface Strain/Stress State

The surface strain/stress measurement on all of the five samples was performed in a pole figure attachment on a D/MAX2200pc diffractometer of Rigaku, Tokyo, Japan. The schematic of the pole figure attachment geometry is shown in Figure 2.
The diffractometer is calibrated with Si polycrystalline powder. The incident wavelength (Cu Kα1) was 1.54 Å and the applied beam size is Φ 5 mm. We substituted the Sola slit (SL1 and SL2) for the divergence slit to obtain a parallel light source, which can increase the signal-to-noise ratio (SNR). For the Ni-based SC superalloy, the penetration depth of X-ray diffraction is only 10–15 μm. So, there must be an electrochemical polishing before the strain/stress determination to eliminate the influence of grinding. The final electrolytic depth is up to 100 μm.
As illustrated in Figure 3, six {331} reflection and two {004} reflection diffracting positions are recorded on the pole figure with their fixed value of the 2θ angle. Then, all of the positions were refined for each maximum of intensity. During this step, intensity profiles were fitted using a pseudo-Voigt or a Gaussian function to obtain the position corresponding to the maximum of intensity. Finally, θ–2θ scans were realized to record the diffraction peaks. The crystal orientation and the relevant d-spacings that were used to calculate the strain/stress tensors can finally be obtained from the above measurement. The principle and brief introduction of the stress measurement and the relevant calculation as well as the involved elastic constants are described in the next paragraph. Details can be seen elsewhere in the papers [17,23].
As a typical two-phase (γ/γ′) coherent structure, a doublet fitting of these six {331} and two {004} diffraction peaks was performed in this paper. The final diagram of a typical doublet fitting of the (400) (a) and (331) (b) reflections of the studied samples are shown as Figure 4. The XRD peak profile was modeled by a Gaussian function, and the restraint on the intensity ratio for the γ and γ′ subpeaks was approximately 1:3 with an assumed volume proportion of Ni and Ni3Al [12]. The center of gravity corresponding to the 2θ positions in each subpeak was regarded as the diffraction angle of the two phases. The individual d-spacings of the γ/γ′ subpeaks in all of the six {331} reflections and two {004} reflections can be obtained by Bragg’s law. Then, the components of the crystal strain tensors ε i j c ( γ ) and ε i j c ( γ ) (i, j = 1, 3; ij) on the crystal coordinate system (red coordinate system in Figure 3a) as well as the misfits can be derived based on the individual d-spacings of the γ/γ′ subpeaks. For the calculation process from crystal strain tensors to crystal stress tensors, we set the flexibility coefficients c11 = 250,800 MPa, c12 = 150,000 MPa, and c44 = 123,500 MPa with reference to the pure nickel’s compliance matrices cij [18]. The final stress tensors that were required are sample stress tensors, σ i j s ( γ ) (i, j = 1, 3; ij) and σ i j s ( γ ) (i, j = 1, 3; ij) are their components, and they are on the sample orthogonal coordinate system (the black coordinate system in Figure 3a). Thus, the transition matrix from the sample coordinate system to the crystal coordinate system is required and it can be obtained by the Euler angles that are derived from the pole figure. Moreover, the error bar of the sample stresses in the following text comes from the least-squares minimization when we process the experimental data. Details are shown in Appendix A.
In this diffraction method, it is difficult to know the reference state (the stress-free lattice parameters). However, the penetration depth of XRD in our study is shallow. It is supposed that the stress in the normal direction to the sample surface is zero (σ33 = 0). Then, the relative d0γ/d0γ′ can be derived [24,25].

3. Results

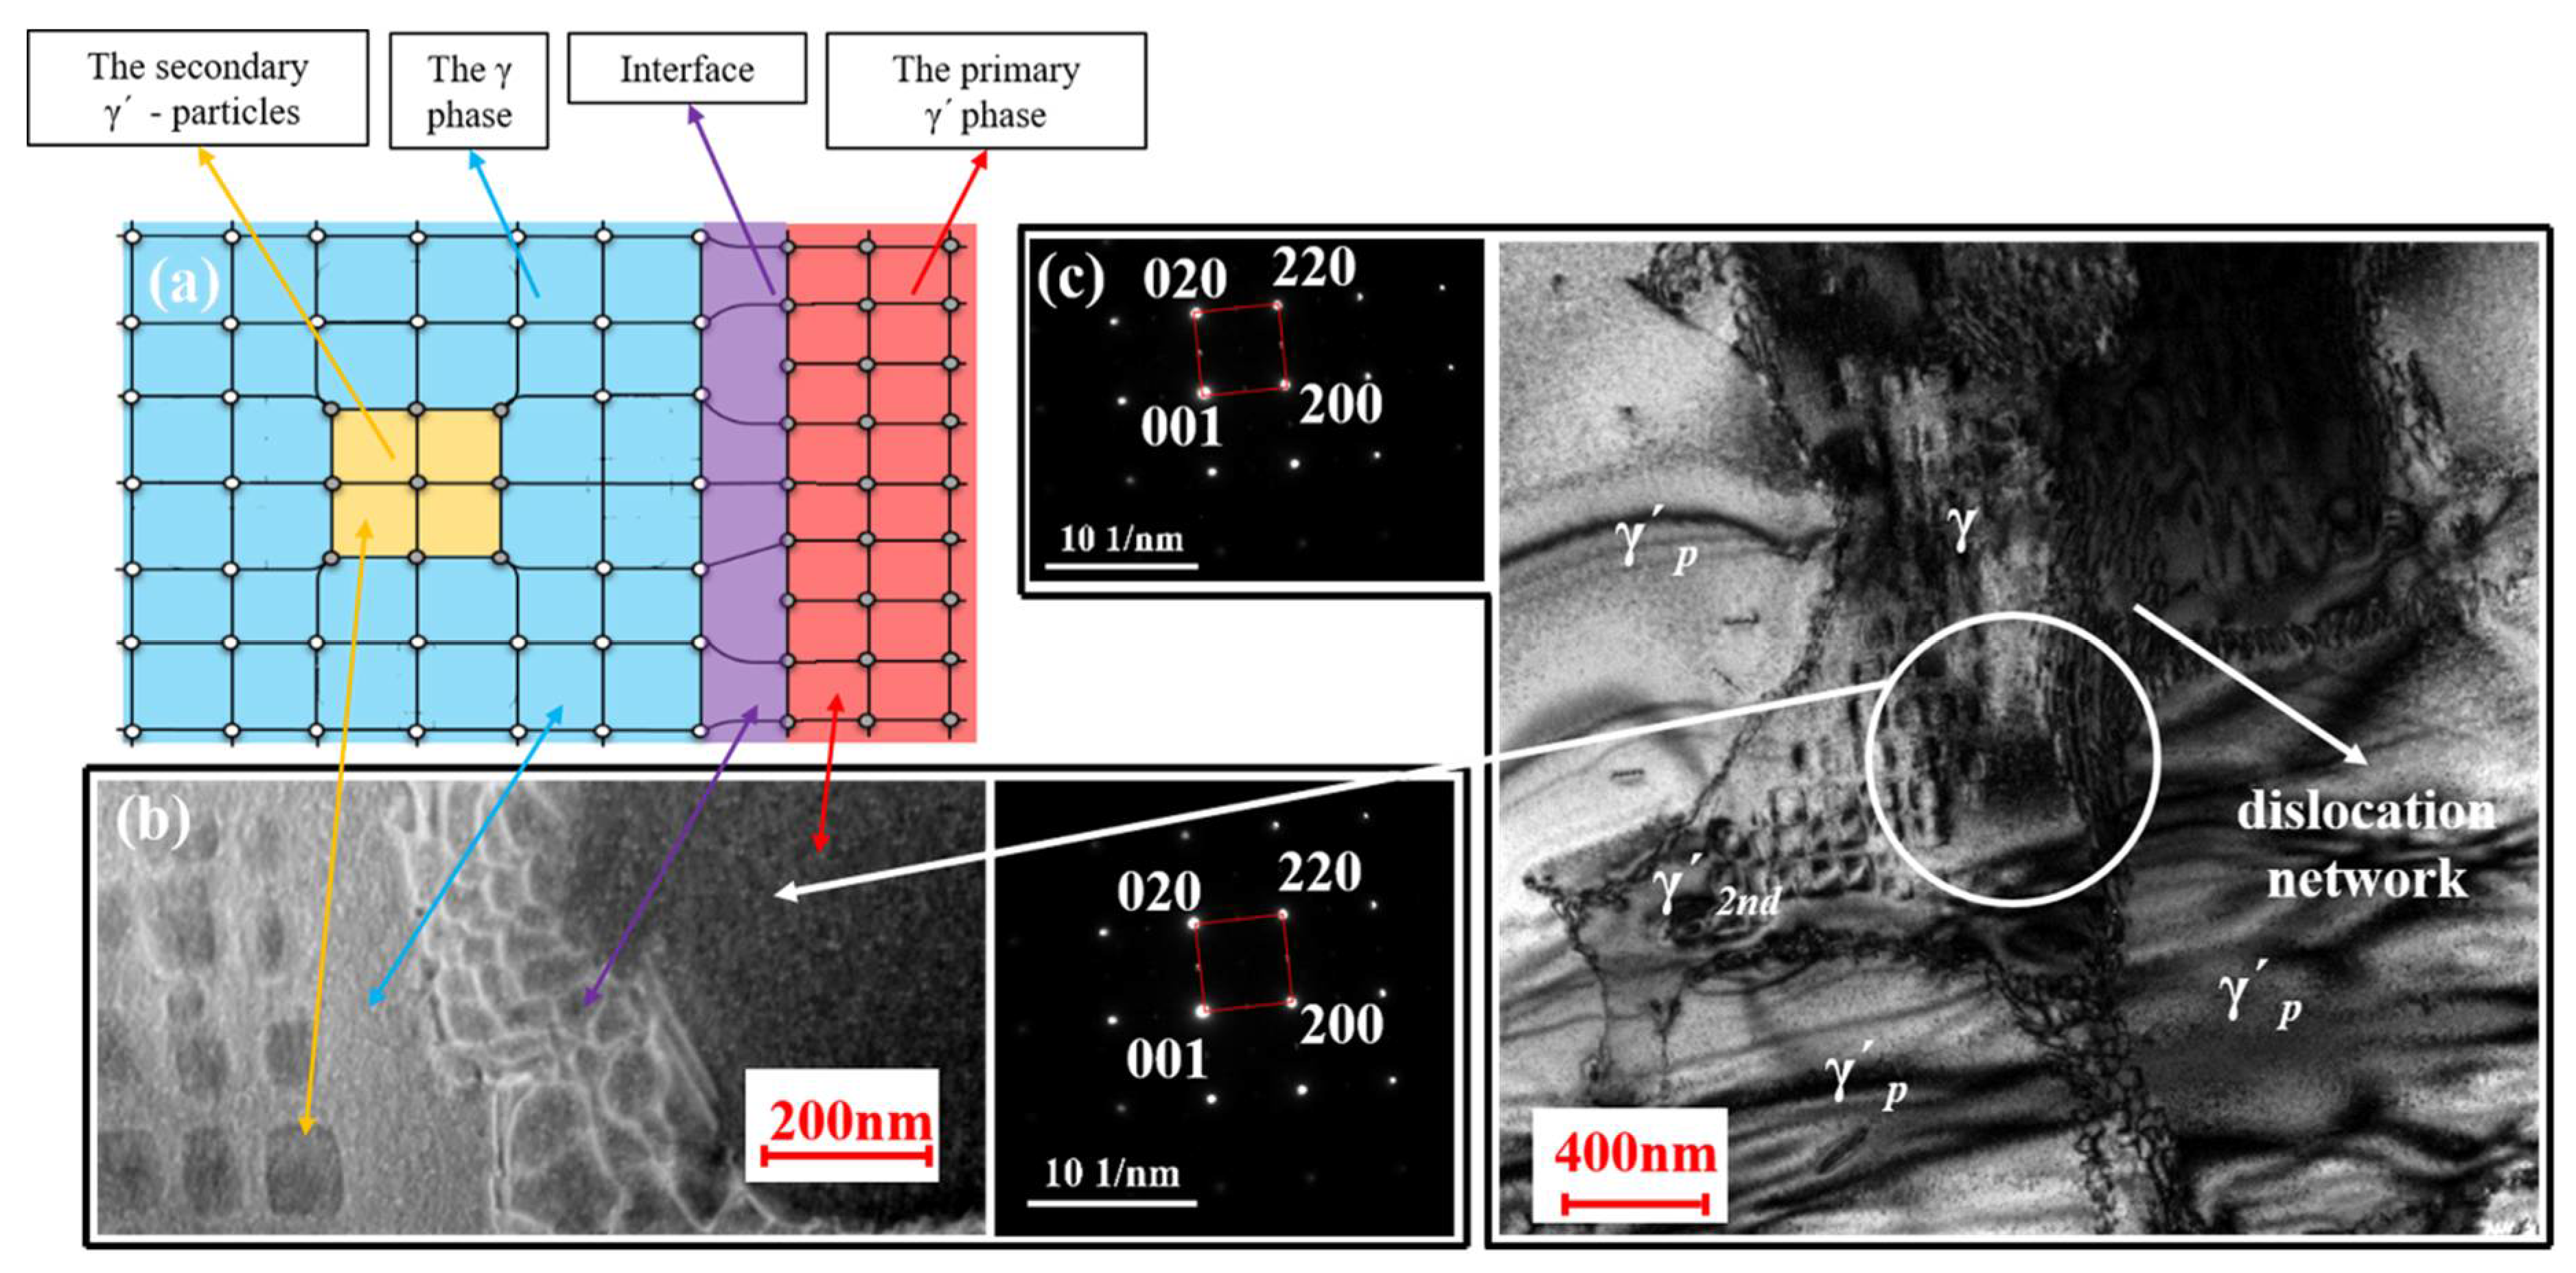
3.1. Microstructure Observation

The microstructure of the specimens is shown as Figure 5. For the furnace cooling, circle (FC-C) sample, the primary γ′-particles feature an irregular shape and are very large. Additionally, smaller secondary γ′-precipitates have formed in the γ-matrix. According to Radis et al., these secondary γ′-precipitates appear because of a second nucleation bursting during a slower cooling speed [26]. Aging results in a larger amount of secondary γ′-particles growing in the γ-matrix for the furnace cooling, circle, aging (FC-C-A) sample and they are all well-aligned along the direction of [001]. Moreover, an obvious dislocation network appears in the interface. For the water cooling mode, the precipitates in the samples are well-aligned and exhibit a cubic morphology with a uniform size. This is a well-known standard microstructure for the Ni-based single-crystal superalloys [27].
We can obviously see that an increase in cooling rate leads to a refinement of the microstructure. Furthermore, the γ′ phase cube edge length and the γ-channel width decrease as the cooling speed increases. In contrast to the water cooling mode, the microstructure in the furnace cooling mode is inhomogeneous.

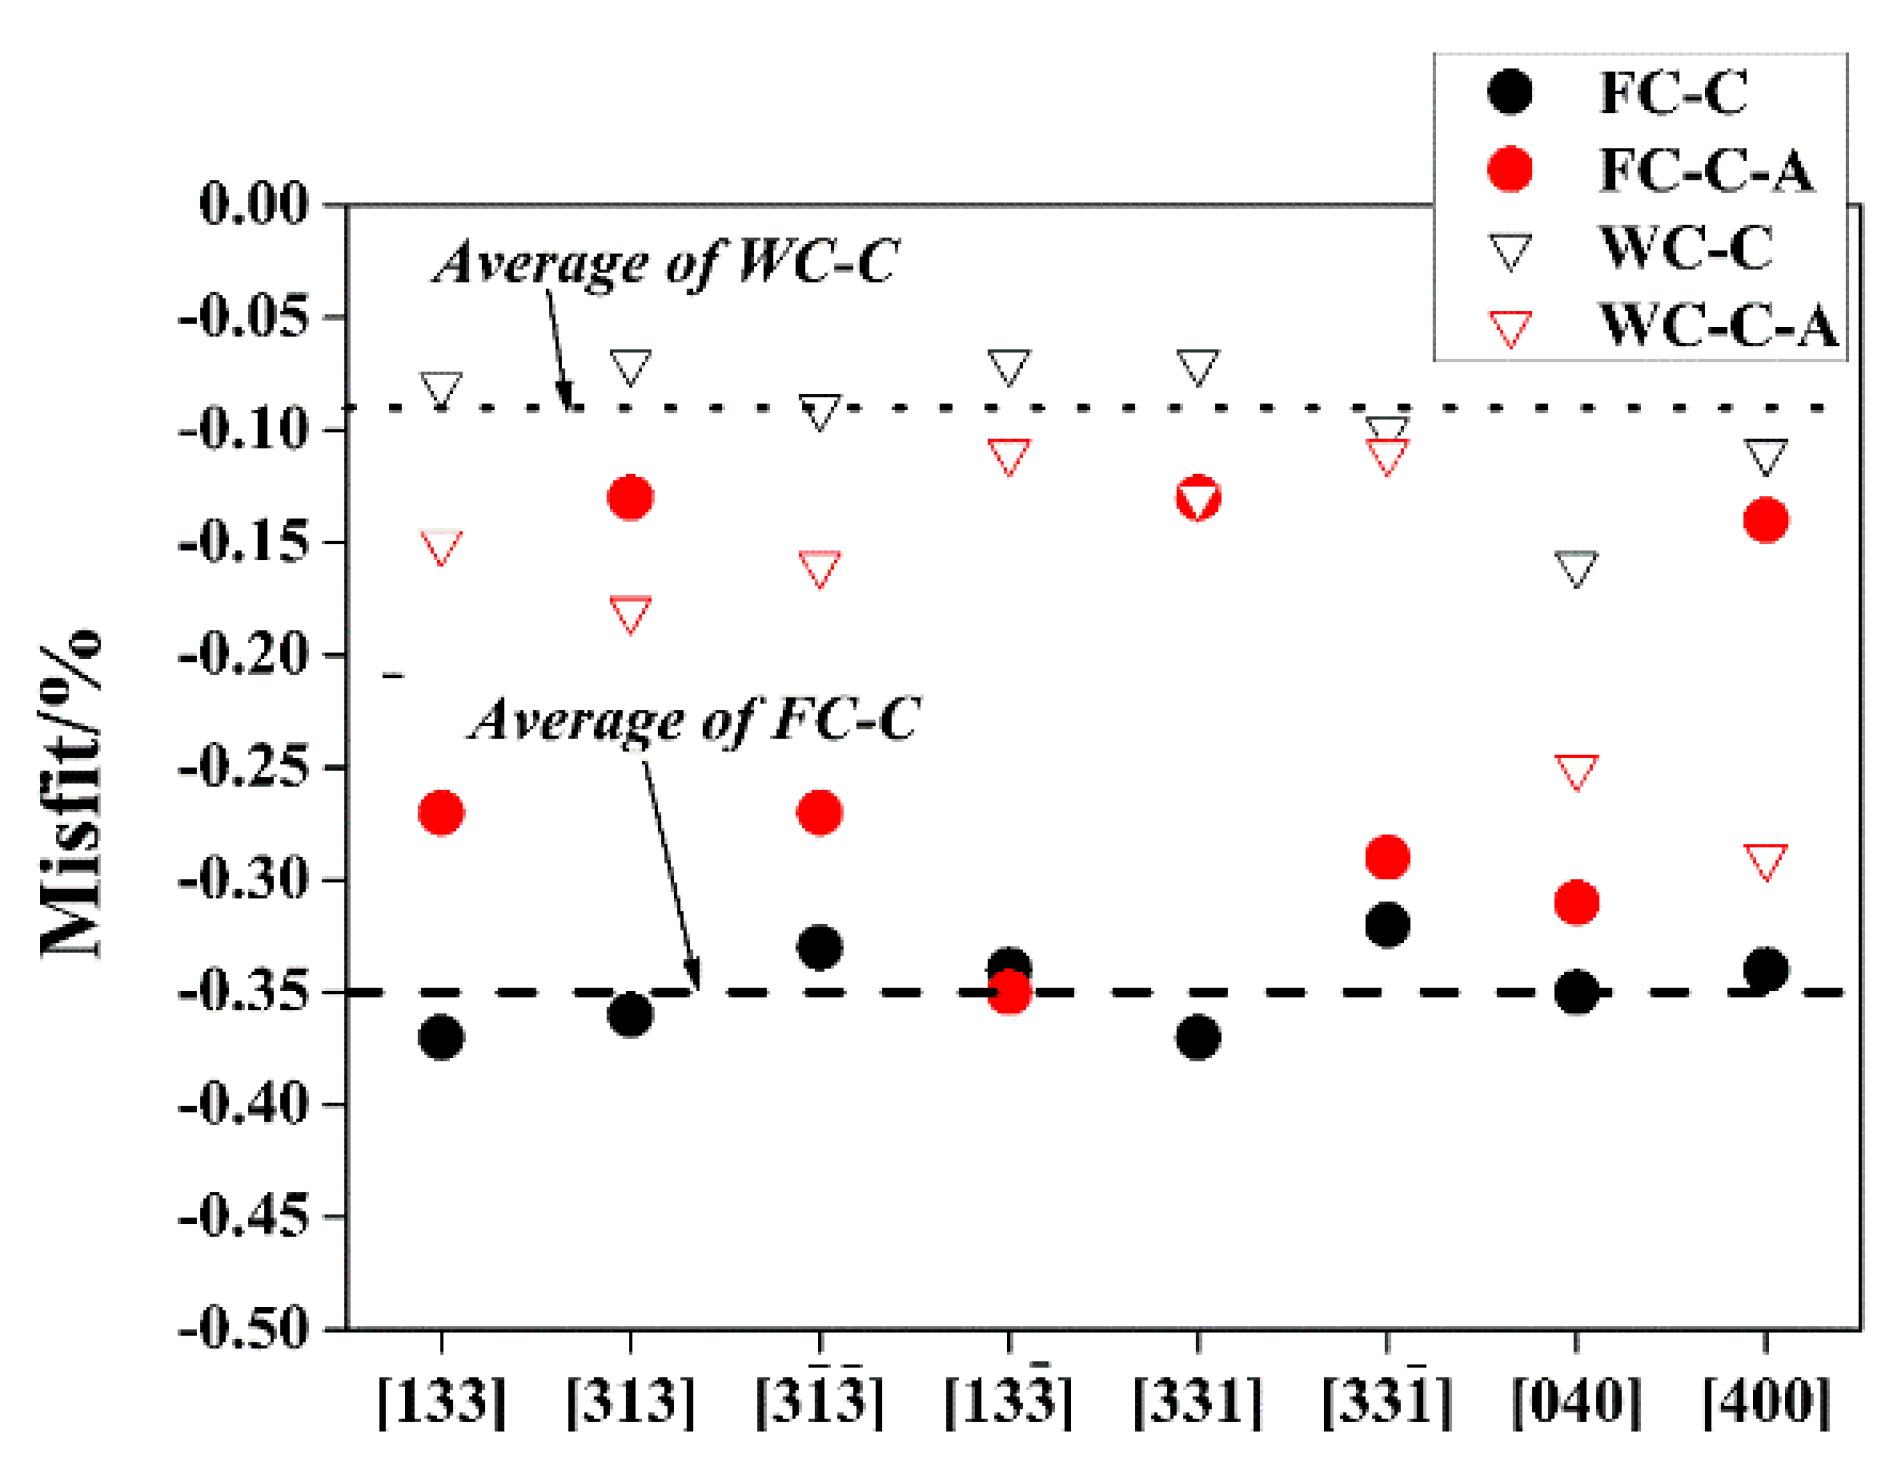
3.2. Lattice Parameter and Mismatch

In the [110] pole figure, the [100] orientation and the [010] orientation can be found but the [001] orientation cannot be found. The crystal faces (331) and (001) belong to the same crystal axe [ 1 1 ¯ 0 ] . So, we use a[001] = [(a[331] + a[331]/2] × √19 to approximate the lattice parameter in the [001] orientation. Then, the lattice parameters in the three orientations ([100], [010], and [001]) can be obtained.
It can be seen that the lattice parameters (in Table 2) of the γ′ phase in the water cooling, circle (WC-C), FC-C, and water cooling, square (WC-S) samples are roughly the same. It is sufficient to elucidate the stability of the γ′ phase size in the solid solution process. After aging for 32 h, the lattice parameters of the γ′ phase in the water cooling, circle, aging (WC-C-A) sample and the FC-C-A sample increase. The aging process changes the γ′ phase size stability. For the γ phase, the distortion c/a of the WC-C and WC-S samples is about 1.0003, but the distortion c/a of the FC-C sample is about 1.0011. The FC-C sample is larger in lattice constant and volume. After aging, the distortion c/a of the WC-C-A γ phase further decreases but the sample volume expands.
As shown in the Figure 6, compared to the WC-C and FC-C samples, the mismatches of both the WC-C-A and FC-C-A samples in the {331} and {004} planes are strongly anisotropic. Also, it is obvious that, compared to the water cooling mode, the mismatch is much more negative in the furnace cooling mode.

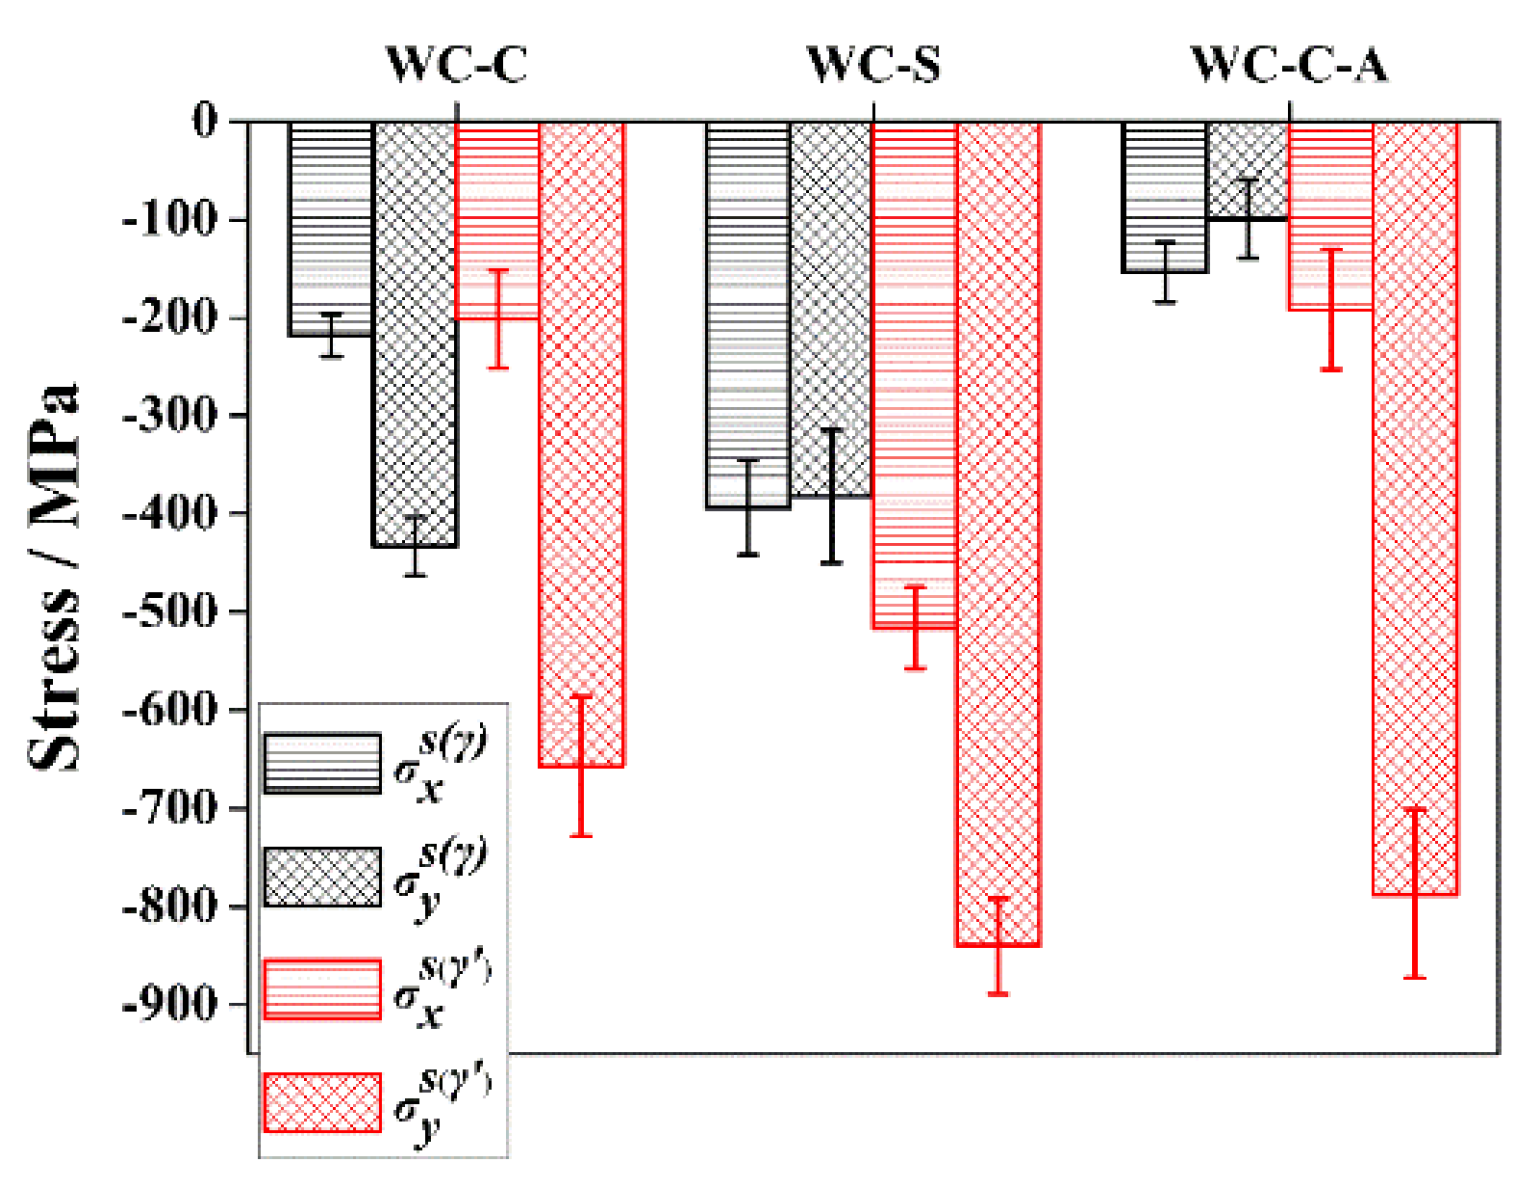
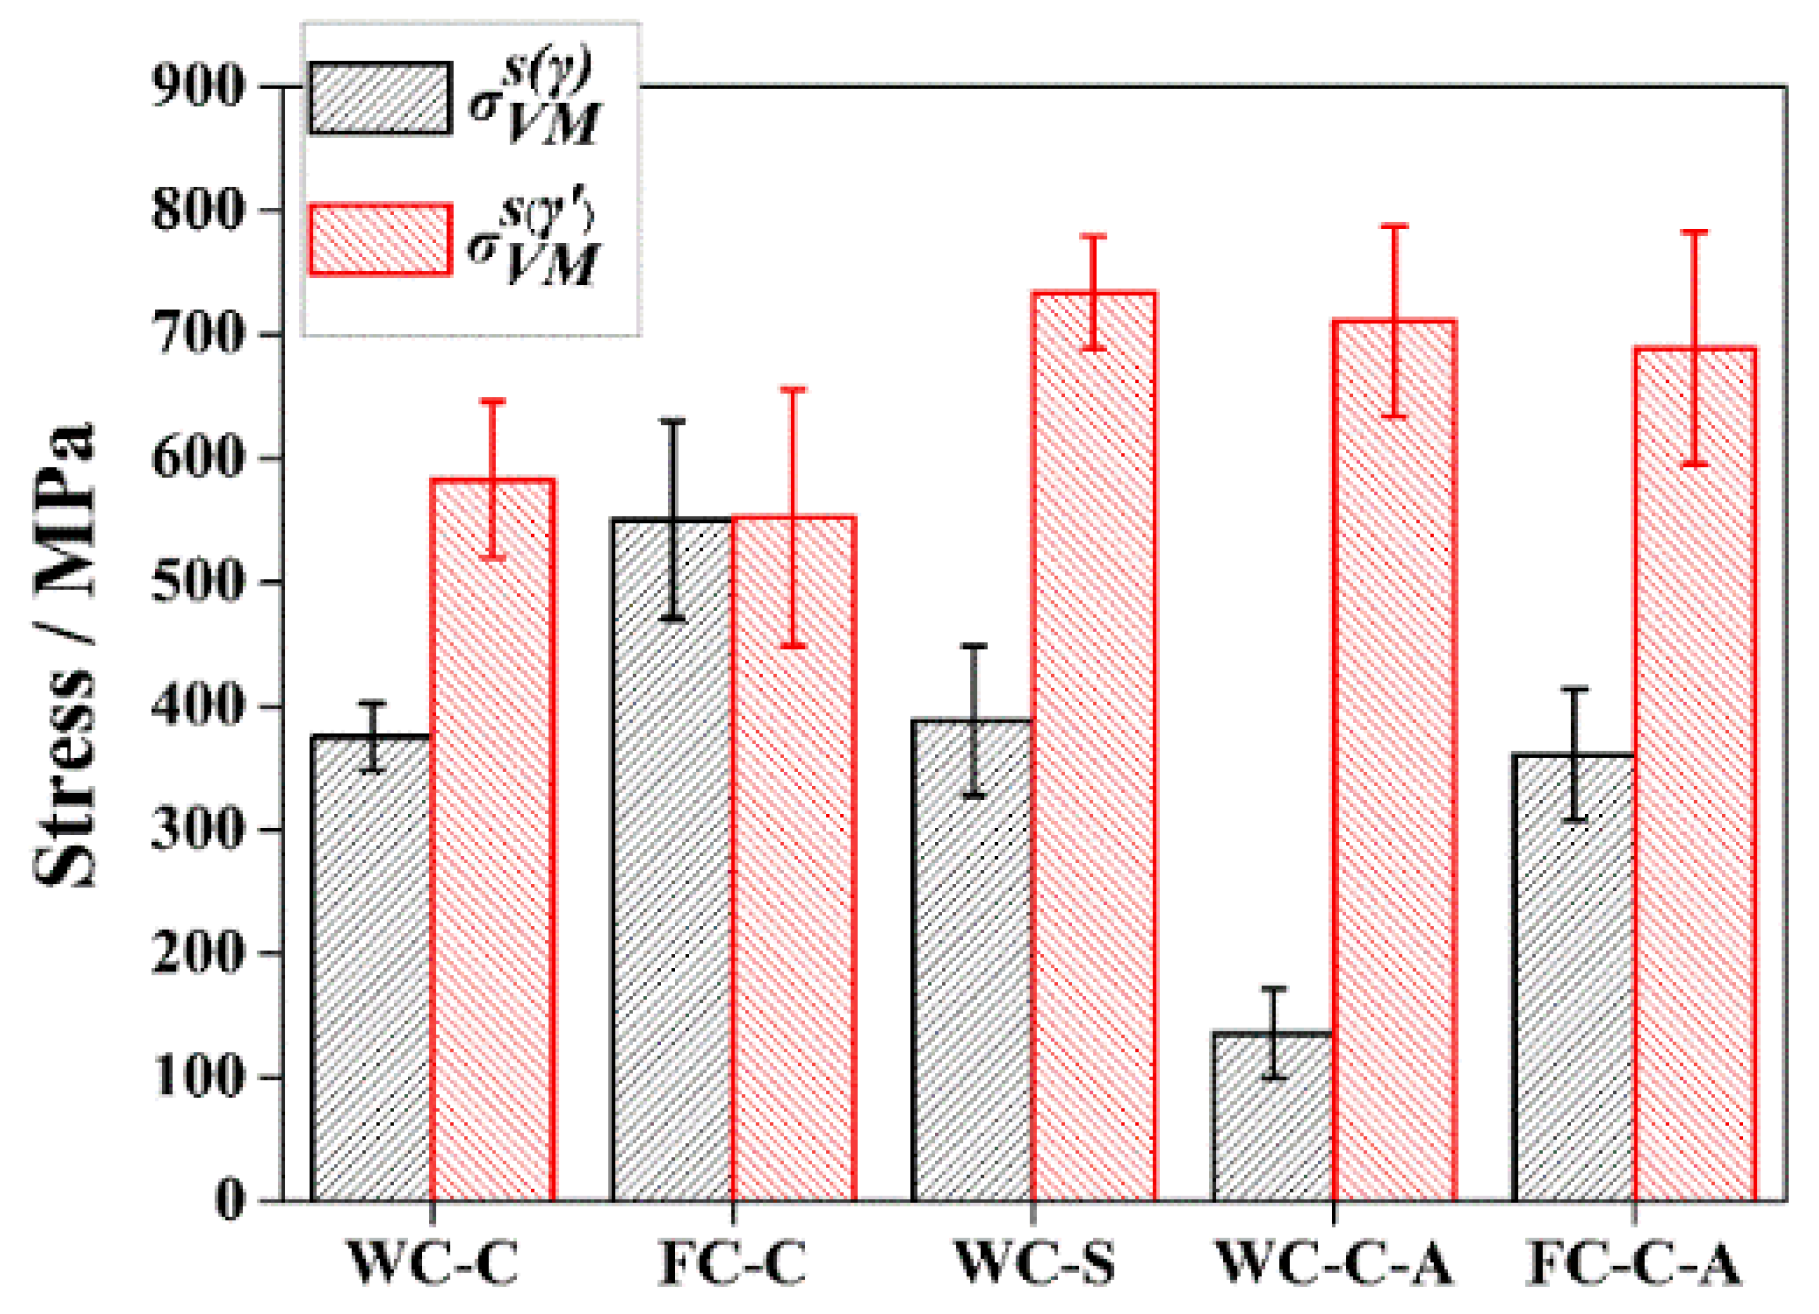
3.3. Surface Strain/Stress State

3.3.1. σ x s , σ y s for γ/γ′ Phases

We are not interested in all of the stress components of the stress tensors σijs(γ) (i, j = 1, 3; ij) and σijs(γ′) (i, j = 1, 3; ij). The shear stresses σ 12 s , σ 13 s , and σ 23 s are ignored in this paper, which are smaller compared to the normal stresses ( σ 11 s , σ 22 s ). Normal stresses ( σ 11 s , σ 22 s ) correspond to σ x s , σ y s in Figure 3a. We can see the stress anisotropy in the [001] and [ 1 1 ¯ 0 ] orientations via σ x s and σ y s , since the stress directions of σ x s and σ y s approximately overlap with the [001] and [ 1 1 ¯ 0 ] orientations in the crystal coordinate system, respectively.
In the γ phase, focusing on the WC-C sample, the stress values in the two studied directions are σ x s ( γ ) = −220 ± 20 MPa and σ y s ( γ ) = −435 ± 30 MPa (Figure 7), respectively, and σ y s ( γ ) ≈ 2 σ x s ( γ ) . As for the WC-S sample, the stresses have no obvious difference in the σ x s and σ y s directions; they are approximately −385 MPa. Moreover, in the WC-C-A sample, the stress in the γ phase is reduced to a negligible range (the absolute value is around 100 MPa) but the γ’ remains a relatively larger stress value. For the γ′ phase, WC-C:WC-S:WC-C-A( σ y s ( γ ) / σ x s ( γ ) ) = 4:2:5. This is because σ x s ( γ ) increases more than σ y s ( γ ) when we change the sample shape from cylinder to tetragonal; and only σ y s ( γ ) increases when we compare the WC-C-A sample with the WC-C sample.

3.3.2. Von Mises Stress of γ/γ′ Phases

The Von Mises stress is a yield criterion that can be expressed as follows: under a certain deformation condition, when the equivalent stress in a point of the stressed object reaches a certain value, the point begins to enter the plastic state. In this paper, the Von Mises condition of plane stress questions is adopted, because the σ33 and the shear stresses are ignored.
σ V M s = σ x 2 σ x σ y + σ y 2
The σ V M s can be regarded as a comprehensive parameter to compare the surface stress with different samples.
As shown in Figure 8, after solution, the σ V M s of the FC-C sample is larger than that of the WC-C sample in the γ phase and approximately the same in the γ′ phase. The σ V M s of the WC-S sample is larger than that of the WC-C sample in the γ′ phase and approximately the same in the γ phase. After aging, the σ V M s of the FC-C-A sample is larger than that of the WC-C-A sample in the γ phase and approximately the same in the γ′ phase. Comparing WC-C-A to WC-C as well as FC-C-A to FC-C, the σ V M s of the γ phases increases but that of the γ′ phases decreases. Specifically, the σ V M s of the γ phase is reduced by about 200 MPa, and that of the γ′ phase is increased by about 130 MPa.

4. Discussion

The stress and strain tensor of γ phases and the stress and strain tensor of γ′ phases were mutually independent in this study because the stress tensors σijγ and σijγ′ (i, j = 1, 3; ij) were respectively calculated by the diffraction angles 2θiγ and 2θiγ (1 ≤ i ≤ 8). In addition, both of the two phases showed the same stress sign. This was because the d0 values were calculated by the stress plane state principle but did not assume fixed d0 values. The stress tensors reflected the surface stress state variation between different samples. The derived stress ( σ V M s ) could be regarded as the degree of lattice distortion, which can act as a sensitive parameter to characterize the SC superalloy’s microstructure. The derived stress might be produced from two parts: one was the thermal stress induced by the different cooling rates between the sample surface and core region [28,29]; the other one was caused by the dislocation depositing in the γ/γ′ interphase and the secondary γ′-particles precipitating in the γ matrix [30,31,32].
Referring to the experiment results, the stress variation of the γ phases can be explained. As shown in Figure 5b,e, in the furnace cooling mode samples, coarsening primary γ′ phases and secondary γ′-particles can be found. Figure 9a is a schematic diagram of the local lattice mismatch between secondary γ′-particles and the matrix in the FC-C-A sample. Obviously, the existence of secondary γ′-particles increases the matrix lattice distortion. It leads to the σ V M s of the γ phases increasing. Furthermore, the secondary γ′-particles are inhomogeneous and randomly distributed in the FC-C sample (Figure 5b) but all align in the [001] direction in the FC-C-A sample (Figure 5e). This is because in the FC-C sample the fine nucleation of secondary γ′-particles grows and becomes cubic during the aging process. This process decreases the σ V M s of the FC-C γ phases because of the decrease of the secondary γ′-particles’ elastic energies [33]. In addition to secondary γ′-particles, the dislocation at the γ/γ′-interface also influences the two phases’ lattice distortion and then the stress. In the FC-C-A sample, the dislocation network at the γ/γ′-interface minimizes the coherency strain. As a result, the misfit and the lattice distortion of the γ phase are larger compared to that in the WC-C-A samples. This leads to the σ V M s of the FC-C-A γ phase increasing.
After aging, the γ′ phase σ V M s enhances. The observed γ′ phase σ V M s change during the aging process is consistent with the lattice distortion variation. The lattice distortion change can be demonstrated by the change in the lattice parameters as well as the mismatches. The lattice parameters of the WC-C and FC-C γ′ phases are approximately the same, as are the WC-C-A and FC-C-A samples. However, the lattice distortion aggravation can be found after aging if we compare the WC-C-A sample to the WC-C sample, and the same result can be found if comparing the FC-C-A sample to FC-C sample. Erdong Wu [20] explained that the precipitation, growth, and cubing of the γ′ cause lattice distortion variation in the water cooling mode samples (WC-C and WC-C-A). The small spheroid γ′ particles with higher elastic and interfacial energies precipitate during the solution heat treatment, and the process leads to a certain amount of lattice distortion of the γ′ particles. Then, in the aging process, the spheroid γ′ particles overcome the linear stress and the shear stress on the interfaces that are induced by the high elastic energy to grow and form cubes, resulting in the aggravated lattice distortion. For the furnace cooling mode samples with more negative mismatches, the elastic energies of the γ′ phases are higher. Additionally, the large elastic energies should also hinder γ′ phase lattice deformation during γ′ phase growth. As for the mismatches (as shown in Figure 6), the mismatches of both the WC-C-A and FC-C-A samples are strongly anisotropic in the {331} and {004} planes; obviously, the lattice distortion increases. The anisotropy seems to be caused by the different solubilities and dislocation behaviors in the vertical and horizontal channels of the γ phase during aging [34].
For the FC-C and FC-C-A samples, the deposition of the dislocations at the γ/γ′ interface and the precipitation of the secondary γ′-particles in the γ channel influence the γ phase stress, and the aging process influences the γ′ phase stress; however, for WC-C, WC-S, and WC-C-A samples, the surface stress is mainly a kind of thermal stress influenced by the elastic modulus, the thermal expansion coefficient, and the sample shape. By observing Figure 8, in contrast to the σ V M s of the WC-C sample and the WC-S sample, we can conclude that the surface stress that is induced by the water cooling mode can change via shape variation in the SC superalloy and that the γ′ phase is the main phase that burdens this variation. This can also illustrate the role of γ′ phases in strengthening the alloy. As shown in Figure 7, for the influence of the shape factor on the surface stress anisotropy, the γ phases are more sensitive. We can regard the circle cross-section sample (WC-C) as an equal boundary constraint in all of the surface directions. Its γ phase stress ratio in the [001] direction and the [ 1 1 ¯ 0 ] direction ( σ x s ( γ ) : σ y s ( γ ) = 1:2) is approximately equal to the elastic modulus ratio (E[001]:E[110] ≈ 1:2 [35]). The square cross-section sample (WC-S) does not have an equal boundary constraint, σ x s ( γ ) : σ y s ( γ ) = 1:1. Obviously, compared to the WC-C sample, the strain of the WC-S sample in the smaller elastic modulus direction ([001]) varies more. We can conclude that the stress in the [001] orientation of the γ phase is more sensitive to the shape change than that in the [ 1 1 ¯ 0 ] orientation. After aging, for the γ phase of the WC-C-A sample, the stress anisotropy is eliminated and the stresses in σ x s ( γ ) and σ y s ( γ ) decrease to negligible values. However, for the γ′ phases, there exists an intrinsic stress in the γ′ phase. Erdong Wu’s research [17] on a complete heat-treated DD10 single-crystal superalloy by neutron diffraction also showed a tetragonal distortion with c/a >1. In addition, the angular distortions of the γ′ phase are enhanced during the aging treatment. Therefore, it is hard to judge the influence of the water cooling mode on the γ′ phase surface stress anisotropy. In the future, more work will be put forward to study the problem.

5. Conclusions

An efficient acquisition and data processing strategy has been developed in order to study the surface strain/stress state. Preliminary results on characteristic samples show clear and complex variations of the γ/γ′ phases’ strain/stress state.
The cooling modes have a bigger impact on the lattice distortion of the γ phase while having a smaller impact on the lattice distortion of the γ′ phase. This is because the secondary γ′-particles precipitation and the dislocation network deposition due to different cooling modes mainly influence the γ phase lattice distortion.
The WC-C sample has a stress anisotropy in the [001] and [ 1 1 ¯ 0 ] orientations, and the stress ratio of the two directions in the γ phase is equal to its elastic modulus ratio. Moreover, for the γ phase, the stress in the [001] orientation is more sensitive to the shape change than that in the [ 1 1 ¯ 0 ] orientation.
After aging, the mismatches are strongly anisotropic in the {400} and {331} planes. Meanwhile, the σ V M s of the γ′ phase increases for all of the cooling mode samples. The growth and cubing of the γ′ phase during aging is the cause.

Author Contributions

H.D. and S.G. contributed to the conception of the study; H.D. and V.J. contributed significantly to analysis and manuscript preparation; H.D., L.Q., and L.-D.Z. performed the data analyses and wrote the manuscript; S.L. and Y.P. helped perform the analysis with constructive discussions.

Funding

This research received no external funding.

Acknowledgments

The work was financially supported by grants from National Natural Science Foundation of China (Nos. U1435207, 51671015, 51771007) and the National Defense Basic Scientific Research Project of China (No. A2120132006).

Conflicts of Interest

There is no conflict of interest in this paper and the founding sponsors had no role in the design of the study.

Appendix A

Seeing the Reference [17] (Morançais, A.; M. Fèvre. Residual stress determination in a shot-peened nickel-based single-crystal superalloy using X-ray diffraction. J. Appl. Crystallogr. 2015, 48, 1764). In this part, we no longer emphasize the derivation of the strain/stress tensor but explain how the error tensor is derived.
Referring to Section 2.2 Relationship between the metric coefficients and the Bragg peak position in reference [16].
Equation (29) in reference [17]:
h i h j g i j = d c a l 2 = 4 s i n 2 θ c a l m 2 λ 2 ,   i , j = 1 , 3 .
Equation (30) in reference [17]:
h a b g b d a 2 = 0 ,   a = 1 , N ,   b = 1 , 6 .
With Equation (31) in reference [17]:
[ h ] = [ h 1 2 k 1 2 l 1 2 2 k 1 l 1 2 h 1 l 1 2 h 1 k 1 h 2 2 k 2 2   l 2 2 2 k 2 l 2 2 h 2 l 2 2 h 2 k 2 h N 2 k N 2 l N 2 2 k N l N 2 h N l N 2 h N k N ] .
Equation (32) in reference [17]:
[ g ] = [ g 11 , g 22 , g 33 , g 23 , g 13 , g 12 ] T .
Equation (33) in reference [17]:
[ d 2 ] = [ 4 s i n 2 θ 1 m 2 λ 2 , , 4 s i n 2 θ N m 2 λ 2 ] T .
Equation (34) in reference [17]:
[ g ] = ( [ h ] T [ h ] ) 1 [ h ] T [ d 2 ] .
In this section, the final result needed is the metric tensor [g] calculated by Equation (30), but Equation (30) usually has no solution. So, we obtain the solution [g] by solving the Equation (34) in the sense of the least-squares minimization that minimizes h a b g b d a 2 2 . Thus, the contravariant components g i j of the metric tensor can be obtained. Substituting g i j into Equation (29), [ d c a l 2 ] can be obtained. [ d a 2 ] is derived from the 2θ values that were measured during the experiment process. The error comes from the difference between [ d c a l 2 ] and [ d a 2 ] ; details are shown as below.
[ m ] = [ Δ σ 11 2 Δ σ 12 2 Δ σ 13 2 Δ σ 21 2 Δ σ 22 2 Δ σ 23 2 Δ σ 31 2 Δ σ 32 2 Δ σ 33 2 ]
[ m ] = [ T ] { [ C ] ( [ V a r E p s 1 ] [ C ] T ) [ T ] T }
[ V a r E p s 1 ] = a 4 | [ d c a l 2 ] [ d c a l 2 ] T [ d a 2 ] [ d a 2 ] T n 6 | ( [ h ] T [ h ] ) 1
[ T ] is the transformation tensor from the sample coordinate system to the crystal coordinate system. [ C ] is the stiffness tensor. Δ σ 11 and Δ σ 22 are the errors shown in this article. n is the number of diffraction planes that are measured during the experiment.
In fact, [ m ] is related to the diffraction planes chosen. In this work, not only {400} planes and {331} planes but also {311} planes were measured as can be seen in Figure 3. However, errors are larger when the 2θ values of {311} planes are used to calculate the stress tensors. This is because the {311} planes have a smaller diffraction angle compared to {400} planes and {331} planes, and more 2θ deviation can be processed when the diffraction peaks are fitted with them.

References

  1. Reed, R.C. The Superalloys: Fundamentals and Applications; Cambridge University Press: Cambridge, UK, 2006. [Google Scholar]
  2. Du, W.; Li, J. Solidification and microsegregation behaviors of Nickel-based single crystal superalloy solidified at medium cooling rate. Trans. Nonferr. Met. Soc. China 1998, 8, 84–88. [Google Scholar] [CrossRef]
  3. Dong, T.; Gao, C. Effect of substrate orientations on microstructure evolution and stability for single crystal superalloys in rapid solidification process. Mater. Des. 2017, 128, 218–230. [Google Scholar] [CrossRef]
  4. Han, J.C.; Dutta, S. Gas Turbine Heat Transfer and Cooling Technology. EPFL 2001, 9, 82. [Google Scholar] [CrossRef]
  5. Bunker, R.S. A Review of Shaped Hole Turbine Film-Cooling Technology. J. Heat Transf. 2005, 127, 441–453. [Google Scholar] [CrossRef]
  6. Kim, T.W.; Kang, D.H.; Yeom, J.T. Continuum damage mechanics-based creep–fatigue-interacted life prediction of nickel-based superalloy at high temperature. Scr. Mater. 2007, 57, 1149–1152. [Google Scholar] [CrossRef]
  7. Huang, Z.W.; Wang, Z.G.; Zhu, S.J. Thermomechanical fatigue behavior and life prediction of a cast nickel-based superalloy. Mater. Sci. Eng. A 2006, 432, 308–316. [Google Scholar] [CrossRef]
  8. Burgel, R.; Portella, P.D.; Preuhs, J. Recrystallization in Single Crystals of Nickel Base Superalloys. Superalloys 2000, 5, 229–238. [Google Scholar] [CrossRef]
  9. Huang, Q.; Ren, J.X. Surface integrity and its effects on the fatigue life of the nickel-based superalloy GH33A. Int. J. Fatigue 1991, 13, 322–326. [Google Scholar] [CrossRef]
  10. Dalaei, K.; Karlsson, B. Stability of shot peening induced residual stresses and their influence on fatigue lifetime. Mater. Sci. Eng. A 2011, 528, 1008–1015. [Google Scholar] [CrossRef]
  11. Pandya, S.G.; Corbett, J.P. Structural characterization and X-ray analysis by Williamson–Hall method for Erbium doped Aluminum Nitride nanoparticles, synthesized using inert gas condensation technique. Physica E 2016, 79, 98–102. [Google Scholar] [CrossRef]
  12. Aly, K.A.; Khalil, N.M. Estimation of lattice strain for zirconia nano-particles based on Williamson–Hall analysis. Mater. Chem. Phys. 2017, 193, 182–188. [Google Scholar] [CrossRef]
  13. Kurlyandskaya, G.V.; Lukshina, V.A. Induced magnetic anisotropy features in FeCrSiBNbCu nanocrystalline alloy: Role of stress distribution proven by direct X-ray measurements. J. Alloys Compd. 2013, 566, 31–36. [Google Scholar] [CrossRef]
  14. Ortner, B. Simultaneous determination of the lattice constant and elastic strain in cubic single crystal. Adv. X-ray Anal. 1985, 29, 113–118. [Google Scholar]
  15. Wu, E.; Sun, G. Neutron Diffraction Study of Strain/Stress States and Subgrain Defects in a Creep-Deformed, Single-Crystal Superalloy. Metall. Mater. Trans. A 2013, 45, 139–146. [Google Scholar] [CrossRef]
  16. Wu, E.; Li, J. Neutron and X-ray Diffraction Study of Internal Stress in Thermomechanically Fatigued Single-Crystal Superalloy. Metall. Mater. Trans. A. 2008, 39, 3141–3148. [Google Scholar] [CrossRef]
  17. Morançais, A.; Fèvre, M. Residual stress determination in a shot-peened nickel-based single-crystal superalloy using X-ray diffraction. J. Appl. Crystallogr. 2015, 48, 1761–1776. [Google Scholar] [CrossRef]
  18. Marty, B.; Moretto, P. X-ray study on single crystal superalloy SRR99: Mismatch γ/γ′, mosaicity and internal stress. Acta Mater. 1997, 45, 791–800. [Google Scholar] [CrossRef]
  19. Morançais, A.; Morançais, A. Influence of Residual Stresses on the Fatigue Life of a Shot-Peened Nickel-Based Single Crystal Superalloy: From Measurements to Modeling. In Superalloys 2016, Proceedings of the 13th Intenational Symposium of Superalloys, Seven Springs, PA, USA, 11–15 September 2016; John Wiley & Sons, Inc.: Hoboken, NJ, USA, 2016. [Google Scholar]
  20. Wu, E.; Sun, G. A neutron diffraction study of lattice distortion, mismatch and misorientation in a single-crystal superalloy after different heat treatments. Acta Mater. 2013, 61, 2308–2319. [Google Scholar] [CrossRef]
  21. Volek, A.; Pyczak, F. Partitioning of Re between γ and γ′ phase in nickel-base superalloys. Scr. Mater. 2005, 52, 141–145. [Google Scholar] [CrossRef]
  22. Ma, S.Y.; Ren, N.N.; Zhang, J.X. Observation of morphology and stress distribution around dislocation in Ni3Al on the atomic scale. Solid State Commun. 2015, 211, 4–9. [Google Scholar] [CrossRef]
  23. Huang, W.-J.; Ji, V. Strain and stress analysis on Zn multicrystal film by XRD method. Trans. Nonferr. Met. Soc. China 2006, 16, s735–s738. [Google Scholar] [CrossRef]
  24. M’Cirdi, L. Experimental approach of a crystallographic cleavage criterion in a cast aged duplex stainless steel. Acta Mater. 2001, 49, 3879–3887. [Google Scholar] [CrossRef]
  25. François, M.; Ferreira, C.; Guillén, R. Approximate Analytical Formulae to Evaluate the Uncertainty in X-ray Stress Analysis. Mater. Sci. Forum 2005, 490–491, 124. [Google Scholar] [CrossRef]
  26. Kuhn, H.A.; Biermann, H. An X-ray study of creep-deformation induced changes of the lattice mismatch in the γ′-hardened monocrystalline nickel-base superalloy SRR 99. Acta Metall. Mater. 1991, 39, 2783–2794. [Google Scholar] [CrossRef]
  27. Dirand, L.; Cormier, J. Measurement of the effective γ/γ′ lattice mismatch during high temperature creep of Ni-based single crystal superalloy. Mater. Charact. 2013, 77, 32–46. [Google Scholar] [CrossRef]
  28. Mohamed, I.F.; Yonenaga, Y. Age hardening and thermal stability of Al–Cu alloy processed by high-pressure torsion. Mater. Sci. Eng. A 2015, 627, 111–118. [Google Scholar] [CrossRef]
  29. Kang, Z.; Yanzhong, L. Experimental study on cool down characteristics and thermal stress of cryogenic tank during LN2 filling process. Appl. Therm. Eng. 2018, 130, 951–961. [Google Scholar] [CrossRef]
  30. Wilson, B.C.; Hickman, J.A.; Fuchs, G.E. The effect of solution heat treatment on a single-crystal Ni-based superalloy. JOM 2003, 55, 35–40. [Google Scholar] [CrossRef]
  31. Ma, S.; Lv, X. Core structure and strengthening mechanism of the misfit dislocation in nickel-based superalloys during high-temperature and low-stress creep. J. Alloys Compd. 2018, 743, 372–376. [Google Scholar] [CrossRef]
  32. Ru, Y.; Zhang, H. Improved 1200 °C stress rupture property of single crystal superalloys by γ′-forming elements addition. Scr. Mater. 2018, 147, 21–26. [Google Scholar] [CrossRef]
  33. Grosdidier, T.; Hazotte, A.; Simon, A. Precipitation and dissolution processes in γ/γ ′ single crystal nickel-based superalloys. Mater. Sci. Eng. A 1998, 256, 183–196. [Google Scholar] [CrossRef]
  34. Biermann, H.; Strehler, M.; Mughrabi, H. High-temperature measurements of lattice parameters and internal stresses of a creep-deformed monocrystalline nickel-base superalloy. Metall. Mater. Trans. A 1996, 27, 1003–1014. [Google Scholar] [CrossRef]
  35. Siebörger, D.; Knake, H.; Glatzel, U. Temperature dependence of the elastic moduli of the nickel-base superalloy CMSX-4 and its isolated phases. Mater. Sci. Eng. A 2001, 298, 26–33. [Google Scholar] [CrossRef]
Figure 1. The size and surface orientation of the cylinder (a) and tetragonal (b) samples. SEM investigation is performed on the surface; TEM slices were cut from the black position.
Metals 08 00376 g001
Figure 2. The schematic of the pole figure attachment geometry.
Metals 08 00376 g002
Figure 3. (a) Relationship between the sample surface and the crystal unit cell orientation and (b) the pole figure measured on the WC-C sample.
Metals 08 00376 g003
Figure 4. The diagram of a typical doublet fitting of the (400) (a) and (331) (b) reflections for the WC-C samples and the (400) (c) and (331) (d) reflections for the FC-C samples, where the γ and γ′ structures and their subprofiles are marked to illustrate the reciprocal relationship between them.
Metals 08 00376 g004
Figure 5. The micrographs for different cooling condition samples. The left part of each case is the back-scattered electron SEM image and the micrograph in the right part of each case is the scanning transmission electron microscopy (STEM) image accompanied by its diffraction spots. (γp is the abbreviation for the primary γ′ phase; γ2nd is the abbreviation for the secondary γ′-particles). The SEM images, STEM images and the diffraction spots of WC-C sample (a), FC-C sample (b), WC-S sample (c), WC-C-A sample (d), and FC-C-A sample (e). (f) is the image of the as-cast structure.
Metals 08 00376 g005
Figure 6. The mismatches of some crystal faces of the {331} and {004} family of crystal planes for the samples FC-C and FC-C-A.
Metals 08 00376 g006
Figure 7. The stress of the γ/γ′ phase in the σ x s and σ y s directions for samples WC-C, WC-S, and WC-C-A.
Metals 08 00376 g007
Figure 8. The Von-Mises stress of the γ/γ′ phase for different heat treatment modes and sample shapes.
Metals 08 00376 g008
Figure 9. (a) A schematic diagram of the local lattice mismatch between the secondary γ′-particles (γ2nd), the γ phase, and the primary γ′ phase (γp) in the FC-C-A sample; (b) STEM image corresponding to figure (a), which includes the secondary γ′-particles (γ2nd), the matrix, and the primary γ′ phase (γp) of the FC-C-A sample; (c) TEM images of the sample FC-C-A that clearly presents a complete appearance of the γ phase.
Metals 08 00376 g009
Table 1. The five sample conditions executed in this paper. In the table, WC-C represents Water Cooling, Circle; FC-C represents Furnace Cooling, Circle; WC-S represents Water Cooling, Square; WC-C-A represents Water Cooling, Circle, Aging; FC-C-A represents Furnace Cooling, Circle, Aging.
Sample No.Cross-Section ShapeCooling Conditions
① WC-CCircleWater Cooling after solid solution
② FC-CCircleFurnace cooling to 300 °C after solid solution
③ WC-SSquareWater Cooling after solid solution
④ WC-C-ACircleAging then furnace cooling to 300 °C based on Sample ①
⑤ FC-C-ACircleAging then furnace cooling to 300 °C based on Sample ②
Table 2. Lattice parameters of different samples derived from fitting the {400} reflection and the {331} reflection. The deviations of the derived lattice parameters are in units of the last digit of the calculated values.
SamplesWC-CFC-CWC-SWC-C-AFC-C-A
γγγγγγγγγγ
a/[010]3.583.5743.5863.5743.5853.5753.5843.5753.5823.577
b/[100]3.5783.5743.5863.5743.5863.5753.5843.5743.5833.572
c/[001]3.5813.5783.5903.5783.5853.5793.5853.5813.5903.580

