Article

Glow Discharge Optical Emission Spectrometer Calibration Using Hydrogenated Zr-2.5Nb Alloy Standard Samples

by
Tatyana S. Priamushko
,
Andrey A. Mikhaylov
,
Maria N. Babikhina
,
Viktor N. Kudiiarov
* and
Roman S. Laptev
Division for Experimental Physics, School of Nuclear Science & Engineering, National Research Tomsk Polytechnic University, Tomsk 634050, Russia
*
Author to whom correspondence should be addressed.
Metals 2018, 8(5), 372; https://doi.org/10.3390/met8050372
Submission received: 13 April 2018 / Revised: 16 May 2018 / Accepted: 20 May 2018 / Published: 22 May 2018

Abstract

:
Currently, standard samples of hydrogen-metal systems meeting the requirements of glow discharge optical emission spectrometers (GD-OES) are not available on the market. This article describes the preparation of Zr-Nb-H standard samples and the calibration of GD-OES with the usage of these samples. Samples of Zr-2.5Nb were chosen as the material for sample production. The creation procedure includes five main steps: sample preparation (polishing to an average roughness, Ra, of 0.04 m using sandpaper), annealing, hydrogenation, maintenance in an inert gas atmosphere, and characterization of the samples. The absolute hydrogen concentration in the samples was determined volumetrically and calculated from the weight change. The distribution of hydrogen was studied using GD-OES Profiler 2 by Jobin Yvon Emission Horiba Group. As a result of this work, calibration curves of Zr, H, Nb, O, and other elements were obtained. The calibration errors were in the range of 1–5%.

1. Introduction

Zirconium and its alloys are well-known and established construction materials used in nuclear reactors [1]. They are widely utilized due to their good mechanical properties at high temperatures and their good resistance to corrosion [2]. Zirconium alloys are exploited in these aggressive environments. This may cause changes in the structure due to the penetration of gases into the material. Many macroscopic properties of metals and their alloys depend on hydrogen, which is a common impurity found in structural materials after their usage [3,4,5,6,7,8]. Hydrogen can cause phase transformations leading to hydride formation [9,10,11,12,13,14,15,16], interactions with structural defects modifying the plastic activity of materials [17], the interplay with point defects provoking swelling [18,19,20,21], or so-called hydrogen embrittlement. It makes the development of methods for the protection of zirconium alloys from penetration of hydrogen significant. The main part of these studies is an elemental analysis of the materials, which includes qualitative and quantitative analysis.
Unfortunately, quantitative analysis techniques of hydrogen are limited. Most of the techniques capable of determining hydrogen concentrations need special facilities [22]. For that reason, glow discharge optical emission spectrometry (GD-OES) has been considered a useful technique. GD-OES is a popular method for routine elemental analysis of metals and alloys and depth profiling of various coatings, with a typical depth ranging from nanometers to more than 100 micrometers [23,24]. The equipment’s small-volume vacuum chamber is a Grim-type glow discharge lamp, where the sample is used as a cathode [25]. Ar, Ne, Kr, and their mixtures with each other or with reaction gasses like O2, N2, and H2 are widely used as working gasses in GD-OES. The working gas is injected into the small-volume vacuum chamber with a low pressure (few hundreds of Pa). A high voltage (500–1000 V) is applied to the cathode, and glow discharge plasma is generated between the electrodes [26]. Sample sputtering occurs; meanwhile, the characteristic emissions of the exited atoms are generated. Due to emission wavelength division, it is possible to perform optical elemental analysis.
Compared to other technologies, the main advantage of this method is the high-speed analysis of a sample, which depends on the material reaching 5 microns/min. At the same time, the advantages of it include ease of use, fast sputtering rate, high depth resolution, and excellent sensitivity for low concentrations, multi-element capability, good quantification, and high sample throughput [27,28,29].
However, for performing quantitative analysis of hydrogen by GD-OES, suitable certified reference materials are not available. Thus, the aim of this work is to develop standard Zr-Nb-H samples for calibration of GD-OES.
Usually Zr-1Nb and Zr-2.5Nb are used as construction materials in nuclear reactors in Russia. Moreover, the bigger the concentration ranges of the impurities in the material, the higher the accuracy of the analysis during the measurements in these ranges [29]. Thus, the usage of the Zr-2.5Nb alloy as a material for the standard samples makes the calibration more universal in comparison with calibration by use of Zr-1Nb samples.

2. Materials and Research Methods

2.1. Standard Samples Production

The Zr-2.5Nb samples with dimensions of 20 mm diameter and 2 mm thickness (elemental composition is in Table 1) were polished to the average roughness (Ra) of 0.045 μm because the surface condition has a strong influence on the penetration of hydrogen into the material. The GD-OES technique is also very sensitive to the roughness of the surface of the analyzed specimen [23]. Roughness is a key factor in limiting the depth resolution of analysis and, for example, if the roughness is similar to the thickness of the analyzed layer, severe degradation of depth resolution occurs. Roughness causes the nonuniform removal of the material and modification of the surface topography during the sputtering.
The samples were annealed at the temperature of Ta = 580 °C for ta = 180 min to remove the internal stresses and structural defects. Hydrogenation was performed in hydrogen atmosphere at the temperature of Th = 600 °C and the pressure of Ph = 0.66 atm. The most common method for studying hydrogen sorption by materials is Sievert’s method [30,31], in which hydrogen saturation of the samples comes from gaseous atmosphere. Hydrogen saturation was carried out using an Automated Complex Gas Reaction Controller (Advanced Materials Corporation, Pittsburgh, PA, USA) using Sievert’s method [32]. The usability of the complex and the reliability of the results have been previously checked on LaNi5 samples. After the saturation, in order to achieve a uniform distribution of hydrogen by volume, the samples were maintained in an inert gas atmosphere at the temperature of Tm = 600 °C and the pressure of Pm = 0.66 atm for tm = 5 h, after that, the temperature decreased by 2 °C/min for 3 h. Different concentrations of hydrogen was achieved by variation in hydrogenation time. To determine the concentrations, a melting method was used in an inert gas medium with the registration of hydrogen in a special cell.

2.2. Standart Samples Characterization

The absolute hydrogen concentration in the samples was determined volumetrically [30,31], calculated from the weight change and using the RHEN 602 hydrogen analyzer (LECO, Saint Joseph, MI, USA). The determination of hydrogen distribution was carried out by the use of GD-OES.

2.3. Optimization and Calibration of GD-OES

Samples with the size of 20 × 20 × 1 mm were used for the selection of the optimal Zr-1Nb and Zr-2.5Nb alloys sputtering parameters, as well as for the determination of the sputtering rate. For these aims, a GD Profiler 2 (Jobin Yvon Emission Horiba Group, Longjumeau Cedex, France) was used. The instrument is equipped with a standard GD source with an anode of 4 mm internal diameter.
Two optical spectrometers (poly- and monochromator) are used in Profiler 2. One of the spectrometers is a 0.5 m Paschen-Runge polychromator with a concave grating of 2400 lines/mm. The optical path of the spectrometer is nitrogen purged. The system is equipped with a Czerny–Turner monochromator (0.64 m focal length, blazed planar holographic grating of 2400 lines/mm), which allows the expansion of the instrument’s capabilities to any wavelength of the spectral range. Table 2 presents the monitored analytical emission lines. The samples were cooled at 10 °C by a cold liquid circulating between the sample and the RF power input.
The developed samples were used for the GD-OES instrument’s calibration. The depth of the craters was measured with the help of a T1000 profilometer (Hommel-Etamic, Jenoptik, Germany). A three-dimensional non-contact profilometer MicroMeasure 3D Station (STIHL, Waiblingen, Germany) was used to construct a 3D-image of the craters. The electrical parameters, e.g., plasma impedance, effective power, etc., affecting the sputtering rate, were not monitored in this study since these need the use of special equipment.

3. Results and Discussion

3.1. Sample Characterization

Table 3 represents the results of hydrogen concentrations determination. It is shown that hydrogen concentrations determined by two different methods have a good correlation. Consequently, the concentrations of hydrogen calculated from the weight change that have been confirmed by measurement results using a hydrogen analyzer were chosen as the standard concentrations for the calibration of GD-OES.

3.2. Optimization of GD-OES

To select the optimal sputtering parameters, the measurements were performed 14 times. The pressure was changed from 550 Pa to 800 Pa and the power of the discharge was changed from 30 W to 50 W. The selection was based on the crater shape. Pressure of 700 Pa and power of 40 W were chosen as the optimal parameters due to the flat bottom without concaves and peaks (Figure 1).
Erosion rate was determined from the crater depth, with the average being 5 μm/min. The density of the Zr-2.5Nb alloy is 6.57 g/cm3 (by manufacturer). Relative sputtering rate was calculated with the use of the reference high steel alloy sample JK49, and it is 1.206. The “sputter rate-corrected” mode was chosen for the calibration in this work. To the best of our knowledge, this mode is the best calibration method for the analysis of the complex alloys in a wide range of concentrations.

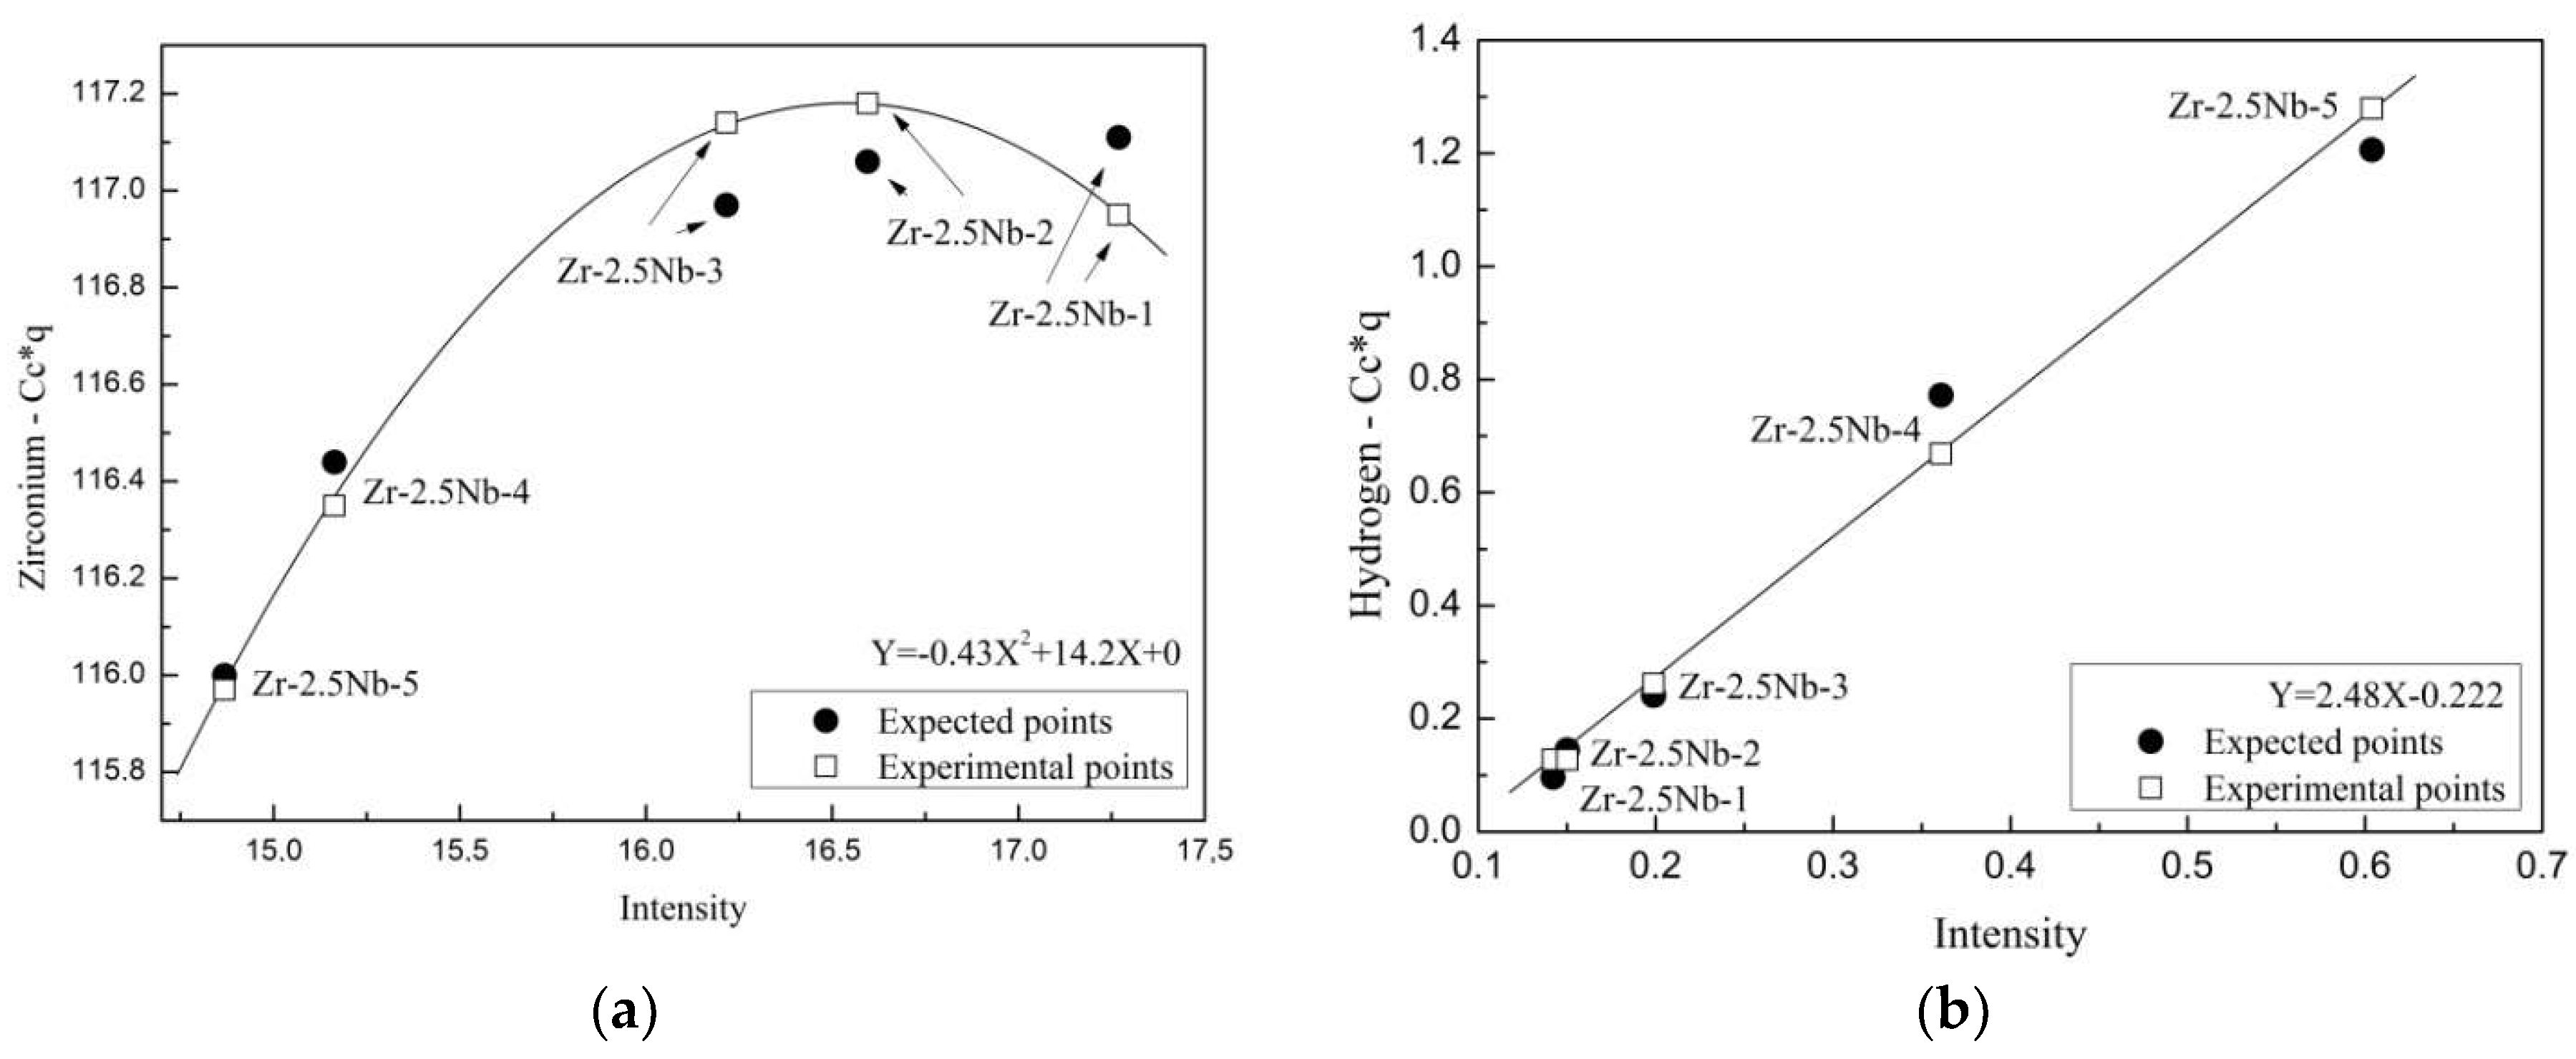
3.3. Calibration of GD-OES with the Use of Zr-2.5Nb Samples

Most of the elements’ curves are straight lines because their concentrations are identical to the standard concentrations in the samples. Figure 2 presents the calibration curves for all the samples of the following elements: C (156.149), Cl (134.730), Hf (286.641), K (766.500), Pb (220.357), and Si (288.162). Cc*q on the y axis is the relative sputtering rate. The relative sputtering rate, i.e., the masses removed per second, is an important parameter in the GD-OES method. The straight lines for the relative sputtering rates of different elements means that the masses removed per second for every element with different concentrations are constant. It is very important for creating a calibration method with high accuracy. It is shown that the intensity changes are negligible. The concentrations of the other elements except Zr, O, Nb, and H determined in the calibration are similar to the announced concentrations.
The element contained in the material in the highest concentrations should have the highest errors in the calibration if the linear approximation is used. However, in analytical applications, empirical functions are used, established by the calibration, and are represented by a higher-order polynomial instead of the direct proportionality [33]. In this case, a two-order polynomial function was used in the calibration of zirconium (Figure 3a). It is shown that the zirconium concentration in the samples decreases with the increasing of the sample number due to increasing of the hydrogen concentration. The sample named with the highest number (e.g., Zr-2.5Nb-5) has the highest concentration of hydrogen (Table 3). The polynomial function lies on the experimental points with high accuracy. The expected points have the same behavior. The determined concentrations of Zr are presented in Table 4 (in weight %). The error of the Zr-calibration has been determined automatically and it is approximately 1%.
Figure 3a presents the calibration curve of oxygen. The concentration of oxygen is not accurately defined by the manufacturer (Table 1) and it is 0.1 weight % (max). Herein, the highest value was chosen as the theoretical concentration to make the range of the O-concentration determination wider. The theoretical concentration is used for the calculation of the experimental concentration. The experimental points don’t correlate with the theoretical points, as expected because of the similar theoretical concentrations of oxygen for each sample (Figure 3a). The error of the O-calibration is approximately 3%. Table 4 represents the results of calibration in weight %. Taking into account these results, we can conclude that the determination of oxygen concentrations was carried out successfully.
Figure 3b shows the results of niobium calibration. It is the same task as the oxygen calibration. The Nb-concentration range is 2.3–2.7 weight % (Table 1). Herein, the value of 2.5 weight % was chosen as a theoretical concentration to make a range of the concentration determination more accurate. It is shown that niobium concentration in the samples decreases with the increasing of the sample number, as for zirconium (Figure 4a). Experimental points lie within the calibration curve with high accuracy. Niobium concentrations determined as weight % are presented in Table 4. All the concentrations lie within the range provided by the manufacturer (Table 1).
The calibration curve is a basis for the quantification. If a sample with the known concentration and sputtering rate deviates from the calibration curve, the quantification of concentration and thickness will be wrong [33]. The calibration curve of hydrogen is represented in Figure 4b. It is shown that the expected and the experimental points are well correlated. Results presented in Table 4 prove the high accuracy of this calibration. Hydrogen is the lightest element and due to this fact, its quantification in metals is a very difficult task. The error of the H-calibration was calculated to be approximately 5%, demonstrating the high-resolution capability of the calibration.

3.4. Measurements of the Other Samples in the Calibration

The application of the performed calibration is the quantitative depth-profile measurements of Zr-Nb-H samples with an unknown concentration of hydrogen. To check the correctness and the accuracy of the calibration, two different samples of Zr2.5Nb (after annealing) and Zr2.5Nb (with hydrogen concentration approximately 0.2 weight %) were chosen.
Figure 5a presents the depth profile of the initial Zr-2.5Nb alloy sample after the annealing. The concentration of Zr is approximately 97 weight %, Nb-2.5 weight %, O-0.1 weight %. Hydrogen is observed only in the pre-surface layer (approximately 500 nm), then its concentration decreases extremely to 0 weight %. Correct depth calculation is one of the main indications of the calibration ability. The depth of crater calculated during the calibration was compared with the depth obtained by the measurements by profilometer. The difference is approximately 0.3 μm.
Figure 5b shows the depth profile of the Zr-1Nb alloy sample after annealing, hydrogenation, and maintenance in an inert gas atmosphere for 5 h. The concentration of hydrogen, as received from the quantification by GD-OES, provides well-fitted results. Zirconium concentration is ≈ 98 weight %, niobium concentration is uniform, 1.3 weight %. Oxygen concentration is lower than 0.1 weight %. The difference between the calculated and measured crater depths is approximately 0.5 μm.

4. Summary

In this work, a method for production of Zr-Nb-H calibration samples was performed. Samples of Zr-2.5Nb alloy were chosen for the research. The annealing, hydrogenation, and maintaining were performed with the usage of Automated Complex Gas Reaction Controller. The temperature of hydrogenation was T = 600 °C and the pressure was p = 0.66 MPa, the temperature at which it was maintained was T = 600 °C at the same pressure. Hydrogen distribution was studied by GD-OES; the absolute hydrogen concentrations were determined volumetrically, calculated from the weight change and using the hydrogen analyzer.
The optimization and calibration of GD-OES were carried out; the sputtering rate of Zr-2.5Nb alloy was determined. The erosion rate was determined from the crater depth, the average is 5 μm/min. The density is 6.57 g/cm3 for Zr-2.5Nb, provided by the manufacturer. The relative sputtering rate was calculated with the use of the reference high steel alloy sample JK49, and it is 1.206. The “sputter rate-corrected” mode was chosen for the calibration in this work. Thus, the result of this work is a set of standard Zr-Nb-H samples. Hydrogen concentrations are approximately in the range of 0.1–1.0 weight %.
In the present work, we increased the range of the investigated concentrations, took into account the sputtering rate of the material, and achieved an increase in the accuracy of calibration due to an increase in the content of niobium in the material in comparison with our previous work [24]. An increase in the content of niobium in the material leads to a more accurate determination of its concentration [29], and as a result, a higher precision of the entire experiment. It is now possible to investigate hydrogen distribution with high accuracy in zirconium materials of nuclear reactors after their operation, or after experiments that simulate operating conditions using the developed technique. This is especially important for the problem of hydrogen embrittlement and hydride rim formation in zirconium claddings [14,15].

Author Contributions

T.S.P. and A.A.M. carried out calibration of GD-OES, analyzed the results, and prepared the paper. M.N.B. performed sample preparation and hydrogen concentration determination. V.N.K. performed hydrogenation of samples, revised the manuscript, and directed the work. R.S.L. carried out testing of calibration samples and analyzed the results.

Funding

This research received no external funding.

Acknowledgments

The research is carried out within the framework of the grant of the Program for Enhancing Competitiveness of Tomsk Polytechnic University.

Conflicts of Interest

The authors declare no conflict of interest.

References

  1. Azevedo, C.R.F. Selection of fuel cladding material for nuclear fission reactors. Eng. Fail. Anal. 2011, 18, 1943–1962. [Google Scholar] [CrossRef]
  2. Hallstadius, L.; Johnson, S.; Lahoda, E. Cladding for performance fuel. Prog. Nucl. Energy 2012, 57, 71–76. [Google Scholar] [CrossRef]
  3. Fukai, Y. The Metal-Hydrogen System; Springer: Berlin/Heidelberg, Germany; New York, NY, USA, 2005; Volume 21. [Google Scholar]
  4. Puls Manfred, P. The Effect of Hydrogen and Hydrides on the Integrity of Zirconium Alloy Components: Delayed Hydride Cracking; MPP Consulting: Oakville, ON, Canada; Springer: London, UK, 2012; 451p. [Google Scholar]
  5. Sawatzky, A.; Ells, C.E. Understanding hydrogen in zirconium. In Zirconium in the Nuclear Industry: Twelfth International Symposium; ASTM STP 1354; ASTM International: West Conshohocken, PA, USA, 2000; pp. 32–48. [Google Scholar]
  6. Zielinski, A.; Sobieszczyk, S. Hydrogen-enhanced degradation and oxide effects in zirconium alloys for nuclear applications. Int. J. Hydrog. Energy 2011, 36, 8619–8629. [Google Scholar] [CrossRef]
  7. Kashkarov, E.B.; Nikitenkov, N.N.; Sutygina, A.N.; Syrtanov, M.S.; Vilkhivskaya, O.V.; Pryamushko, T.S.; Kudiiarov, V.N.; Volesky, L. Effect of titanium ion implantation and deposition on hydrogenation behavior of Zr-1Nb alloy. Surf. Coat. Technol. 2016, 308, 2–9. [Google Scholar] [CrossRef]
  8. Nagase, F. Hydride behavior in Zircaloy cladding tube during high-temperature transients. J. Nucl. Mater. 2011, 415, 117–122. [Google Scholar] [CrossRef]
  9. Motta, A.T.; Chen, L.Q. Hydride formation in zirconium alloys. J. Miner. Met. Mater. Soc. 2012, 64, 1403–1408. [Google Scholar] [CrossRef]
  10. Laptev, R.S.; Lider, A.M.; Bordulev, Y.S.; Kudiiarov, V.N.; Gvozdyakov, D.V. The evolution of defects in zirconium in the process of hydrogen sorption and desorption. Key Eng. Mater. 2016, 683, 256. [Google Scholar] [CrossRef]
  11. Huang, J.-H.; Yeh, M.-S. Gaseous hydrogen embrittlement of a hydrided zirconium alloy. Metall. Mater. Trans. A 1998, 29, 1047–1056. [Google Scholar] [CrossRef]
  12. Kim, Y.S.; Matvienko, Y.G.; Cheong, Y.M.; Kim, S.S.; Kwon, S.C. A model of the threshold stress intensity factor КiH for delayed hydride cracking of Zr-2,5Nb alloy. J. Nucl. Mater. 2000, 278, 251–257. [Google Scholar] [CrossRef]
  13. Nagase, F.; Fuketa, T. Investigation of hydride rim effect on failure of Zircaloy-4 cladding with tube burst test. J. Nucl. Sci. Technol. 2005, 42, 58–65. [Google Scholar] [CrossRef]
  14. Hanson, B.; Shimskey, R.; Lavender, C.; MacFarlan, P.; Eslinger, P. Hydride Rim Formation in Unirradiated Zircaloy. Available online: https://www.energy.gov/sites/prod/files/2013/08/f2/HydrideRimFormationZircaloy.pdf (accessed on 22 March 2018).
  15. Shimskey, R.; Hanson, B.; MacFarlan, P. Optimization of Hydride Rim Formation in Unirradiated Zr-4 Cladding. Available online: https://www.pnnl.gov/main/publications/external/technical_reports/PNNL-22835.pdf (accessed on 22 March 2018).
  16. Steinbruck, M. Hydrogen absorption by zirconium alloys at high temperatures. J. Nucl. Mater. 2004, 334, 58–64. [Google Scholar] [CrossRef]
  17. Pundt, A.; Kirchheim, R. Hydrogen in metals: Microstructural aspects. Annu. Rev. Mater. Res. 2006, 36, 555–608. [Google Scholar] [CrossRef]
  18. Terrani, K.A.; Balooch, M.; Wongsawaeng, D.; Jaiyen, S.; Olander, D.R. The kinetics of hydrogen desorption from and adsorption on zirconium hydride. J. Nucl. Mater. 2010, 397, 61–68. [Google Scholar] [CrossRef]
  19. Kammenzind, B.K.; Berquist, B.M.; Bajaj, R. The long-range migration of hydrogen through ziicaloy in response to tensile and compressive stress gradients. In Zirconium in the Nuclear Industry: Twelfth International Symposium; ASTM STP 1354; ASTM International: West Conshohocken, PA, USA, 2000; pp. 196–233. [Google Scholar]
  20. Shmakov, A.A.; Smirnov, E.A.; Bruchertseifer, H. Hydrogen diffusion and distribution in oxidized zirconium alloys by thermo-release method. Metallofiz. Noveishie Technol. 1999, 21, 35–39. (In Russian) [Google Scholar]
  21. Shi, S.Q. Diffusion-controlled hydride growth near crack tip in zirconium under temperature transients. J. Nucl. Mater. 1999, 275, 318–323. [Google Scholar] [CrossRef]
  22. Takahara, H.; Ishigami, R.; Kodama, K.; Kojyo, A.; Nakamurac, T.; Oka, Y. Hydrogen analysis in diamond-like carbon by glow discharge optical emission spectroscopy. J. Anal. At. Spectrom. 2016, 31, 940–947. [Google Scholar] [CrossRef]
  23. Nelis, T.; Payling, R. Glow Discharge Optical Emission Spectroscopy: A Practical Guide; RSC Analytical Spectroscopy Monographs; The Royal Society for Chemistry: Cambridge, UK, 2003. [Google Scholar]
  24. Mikhaylov, A.A.; Priamushko, T.S.; Babikhina, M.N.; Kudiiarov, V.N.; Heller, R.; Laptev, R.S.; Lider, A.M. Hydrogen calibration of GD-spectrometer using Zr-1Nb alloy. Appl. Surf. Sci. 2017, 432, 85–89. [Google Scholar] [CrossRef]
  25. Marcus, R.K.; Broekaert, J.A.C. Glow Discharge Plasmas in Analytical Spectroscopy; J. Wiley: New York, NY, USA, 2003. [Google Scholar]
  26. Takahara, H.; Shikano, M.; Kobayashi, H. Quantification of lithium in LIB electrodes with glow discharge optical emission spectroscopy (GD-OES). J. Power Sources 2013, 244, 252–258. [Google Scholar] [CrossRef]
  27. Heikkila, I.; Eggertson, C.; Randelius, M.; Caddeo-Johansson, S.; Chasoglou, D. First experiences on characterization of surface oxide films in powder particles by Glow Discharge Optical Emission Spectroscopy (GD-OES). Met. Powder Rep. 2016, 71, 261–264. [Google Scholar] [CrossRef]
  28. Weiss, Z. Calibration methods in glow discharge optical emission spectroscopy: A tutorial review. J. Anal. At. Spectrom. 2015, 30, 1038–1049. [Google Scholar] [CrossRef]
  29. Winchester, M.R.; Payling, R. Radio-frequency glow discharge spectrometry: A critical review. Spectrochim Acta A 2004, 59, 607–666. [Google Scholar] [CrossRef]
  30. Voskuilen, T.; Zheng, Y.; Pourpoint, T. Development of a Sievert apparatus for characterization of high pressure hydrogen sorption materials. Int. J. Hydrog. Energy 2010, 35, 10387–10395. [Google Scholar] [CrossRef]
  31. Cheng, H.H.; Deng, X.X.; Li, S.L.; Chen, W.; Chen, D.M.; Yang, K. Design of PC based high pressure hydrogen absorption/desorption apparatus. Int. J. Hydrog. Energy 2007, 32, 3046–3053. [Google Scholar] [CrossRef]
  32. Gas Reaction Controller, Operation Manual. Advanced Materials Corporation. Available online: http://www.advanced-material.com (accessed on 22 May 2018).
  33. Schubert, C.; Hoffmann, V.; Kummel, A.; Sinn, J.; Hartel, M.; Reuther, A.; Thomalla, M.; Gemming, T.; Eckertcd, J.; Leyense, C. Compositional depth profiling of diamond-like carbon layers by glow discharge optical emission spectroscopy. J. Anal. At. Spectrom. 2016, 31, 2207–2212. [Google Scholar] [CrossRef]
Figure 1. 3D profile of the crater obtained by sputtering with the optimal parameters of 700 Pa and 40 W.
Metals 08 00372 g001
Figure 2. Calibration curves of carbon (156.149), chlorine (134.730), hafnium (286.641), potassium (766.500), lead (220.357), and silicon (288.162).
Metals 08 00372 g002
Figure 3. Calibration curves of (a) oxygen (130.492) and (b) niobium (316.345).
Metals 08 00372 g003
Figure 4. Calibration curves of (a) zirconium (339.203) and (b) hydrogen (121.574).
Metals 08 00372 g004
Figure 5. The depth profile of (a) Zr-2.5Nb alloy after annealing without hydrogenation and (b) Zr-1Nb alloy after annealing, hydrogenation, and maintenance in inert gas atmosphere.
Metals 08 00372 g005
Table 1. Elemental composition of Zr-Nb alloys.
ElementContent, Weight %ElementContent, Weight %ElementContent, Weight %
ZrBalanceCr0.02Mo0.005
Nb(for Zr1Nb)0.9–1.1C0.02Pb0.005
Nb(for Zr2.5Nb)2.4–2.7Ca0.01Ti0.005
O0.1 (max)Al0.008K0.004
Fe0.05Ni0.007Cl0.002
Hf0.05N0.006Mn0.002
Si0.02Cu0.005Li0.0008
Table 2. Analytical emission lines selected.
ElementWavelength, nmElementWavelength, nmElementWavelength, nm
H121.574Fe271.445Ti365.355
O130.492Hf286.641Mo386.416
Cl134.730Si288.162Al396.157
N149.268Nb316.345Ca422.679
C156.149Cu324.759Cr425.439
Pb220.357Zr339.203Li670.800
Mn257.614Ni341.482K766.500
Table 3. Hydrogen concentrations.
SampleHydrogenation Time, minVolumetrically, Weight %Changing of Weight, Weight %
Zr-2.5Nb-1100.07 ± 0.010.08 ± 0.01
Zr-2.5Nb-2130.10 ± 0.010.12 ± 0.01
Zr-2.5Nb-3170.19 ± 0.020.20 ± 0.03
Zr-2.5Nb-4430.63 ± 0.030.64 ± 0.05
Zr-2.5Nb-5570.90 ± 0.071.00 ± 0.09
Table 4. Results of the calibration with the usage of Zr-2.5Nb samples: C1—concentration which was used as average theoretical value, C2—determined concentration during the calibration, % wt—% in weight.
SampleConcentrationZrNbOH
Zr-2.5Nb-1C1, weight %97.1002.5000.1000.080
C2, weight %96.9702.6890.1000.106
Zr-2.5Nb-2C1, weight %97.0602.5000.1000.120
C2, weight %97.1602.6060.0980.106
Zr-2.5Nb-3C1, weight %96.9902.5000.1000.200
C2, weight %97.1302.5970.1080.217
Zr-2.5Nb-4C1, weight %96.5502.5000.1000.640
C2, weight %96.4802.3240.0920.554
Zr-2.5Nb-5C1, weight %96.4002.5000.1001.000
C2, weight %96.8172.1240.1030.956

