Article

Structure and Mechanical Properties of a Copper Combustion Chamber throughout Its Life Cycle

CEMMPRE-Department of Mechanical Engineering, University of Coimbra, Rua Luís Reis Santos, 3030-788 Coimbra, Portugal
*
Author to whom correspondence should be addressed.
Metals 2018, 8(5), 362; https://doi.org/10.3390/met8050362
Submission received: 26 April 2018 / Revised: 12 May 2018 / Accepted: 14 May 2018 / Published: 16 May 2018

Abstract

:
The material of a combustion chamber is subjected to high thermal and mechanical fatigue that can result in premature failure. Nevertheless, there is very little information in the literature concerning its characterization. In this work, the study of some properties of the copper combustion chambers in water heaters throughout their life cycle is described. The microstructure, hardness, morphology, mechanical strength and roughness were evaluated, from the pristine copper sheet to a chamber subjected to 53,000 cycles. Throughout the whole cycle, changes were detected in the organization of the crystalline structure. Both after conformation and after completing the manufacturing process, the material exhibits a preferential orientation according to the direction [110], which is the most favorable to degradation of the material by thermal fatigue. The prevalence of the less dense crystallographic planes of the material in all stages of the life cycle allowed a better diffusion of the oxidant species facilitating the corrosion of the material. The oxidation products did not form a passivated layer and detached from the bulk copper, causing a progressive deterioration of the material.

Graphical Abstract

1. Introduction

Copper is a metal with myriad applications in diverse fields, such as electronics, construction, transportation industry, biology, catalytic processes and sensors [1]. Nevertheless, in some applications, such as structures for nautical applications and heat exchangers, the metal does not present appropriate resistance to corrosion. The combustion chamber of a water heater is a gas-liquid heat exchanger. Hot combustion gases flow through the interior of the so-called skirt, where they intersect the pipes within, where the water is transported to the outer tubes, designated serpentines. These work conditions can induce morphological and microstructural changes of the material, with significant implications, including mechanical fatigue and corrosion. In fact, the corrosion resistance of copper is evident when used in fresh and saline cooling waters [2], but not when subjected to corrosive environments at high temperatures. Nevertheless, there is not much work describing the implications of the evolution of the copper’s properties in terms of performance during a complete life cycle as a heat exchanger in a combustion chamber.
The thermal stresses arise when a heated body is prevented from expanding. Thermal and physical stresses are identical: the thermal stress induced in the material by preventing it from expanding is equivalent to the compression stress that would have to be applied to return it to its original shape if the material had been allowed to freely expand [3]. A high number of thermal cycles induce low-magnitude cyclic stresses that locally trigger dislocations, causing microplasticity. Thus, thermal fatigue can play an important role in surface topography, as in the long term, these dislocations produce internal stresses that develop intrusions and extrusions that arise on the surface of the material [4]. A relationship has been found between grain orientation and surface degradation induced by thermal fatigue in polycrystalline copper, as well as a proportional correspondence between the increased roughness of polycrystalline copper subjected to thermal fatigue and the increase in hardness [4,5].
In components subjected to high fatigue cycles, the crack nucleation stage is the most relevant, as it corresponds to about 90% of the life of the material [6]. For metals with a face-centered cubic (FCC) structure (such as copper), crack nucleation occurs preferentially along grain boundaries, along with the persisting sliding bands, or as a combination of both. Cracks nucleate along grain boundaries as a result of incompatibility of deformation of this zone with the rest of the material, whereas the inclusions and exclusions caused by persistent sliding bands are the main reason why crack nucleation arises along them.
The fatigue process is particularly sensitive to the surface state; in homogeneous materials without significant internal defects, the microcracks always start on the free surfaces [7,8]. The cracks are nucleated at the sites where cyclic plastic deformation has higher values as a result of higher stress concentrations. Although there are always microscopic stress concentrators that significantly affect the material, the surface tension level is very susceptible to surface topography; for example, roughness with a depth of 1 μm can cause a stress increase of about 10% [9]. Crack propagation depends mainly on the direction of the applied force [10,11]. However, the velocity of propagation is greatly increased by corrosion, which accelerates the fatigue cracking process.
Copper is not found in nature in its “pure” form, but is extracted from minerals that contain it [12]. In fact, metals have higher surface energy and therefore present a tendency to return to a state of lower energy, such as an oxide, which is chemically more stable. Therefore, when copper is subjected to the right chemical environment with the appropriate energy input, corrosion reaction will be triggered. When metals are used in applications at high temperatures, they are particularly susceptible to oxidation/corrosion, as the rate of reaction increases exponentially with temperature for both general [13] and pitting corrosion [14].
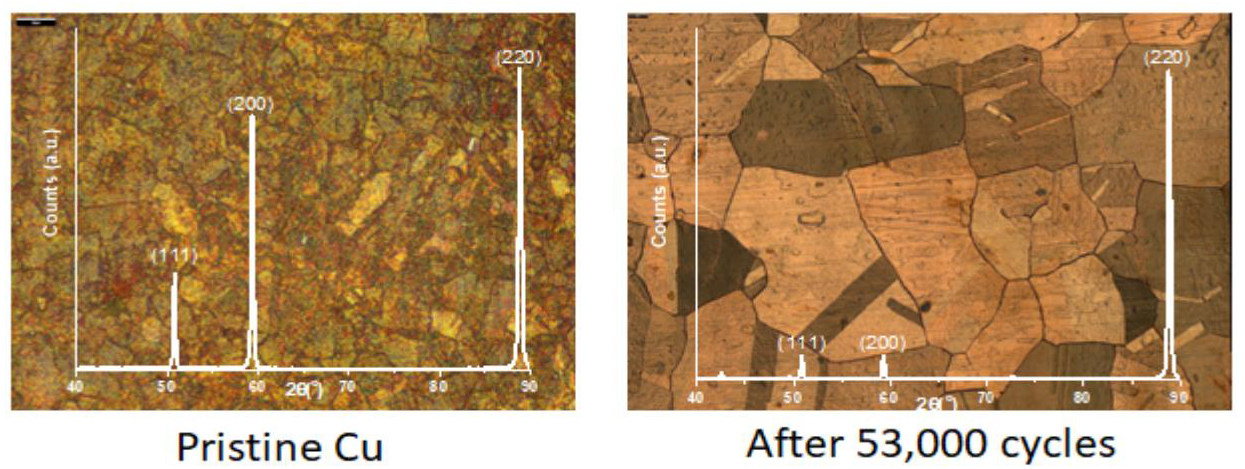
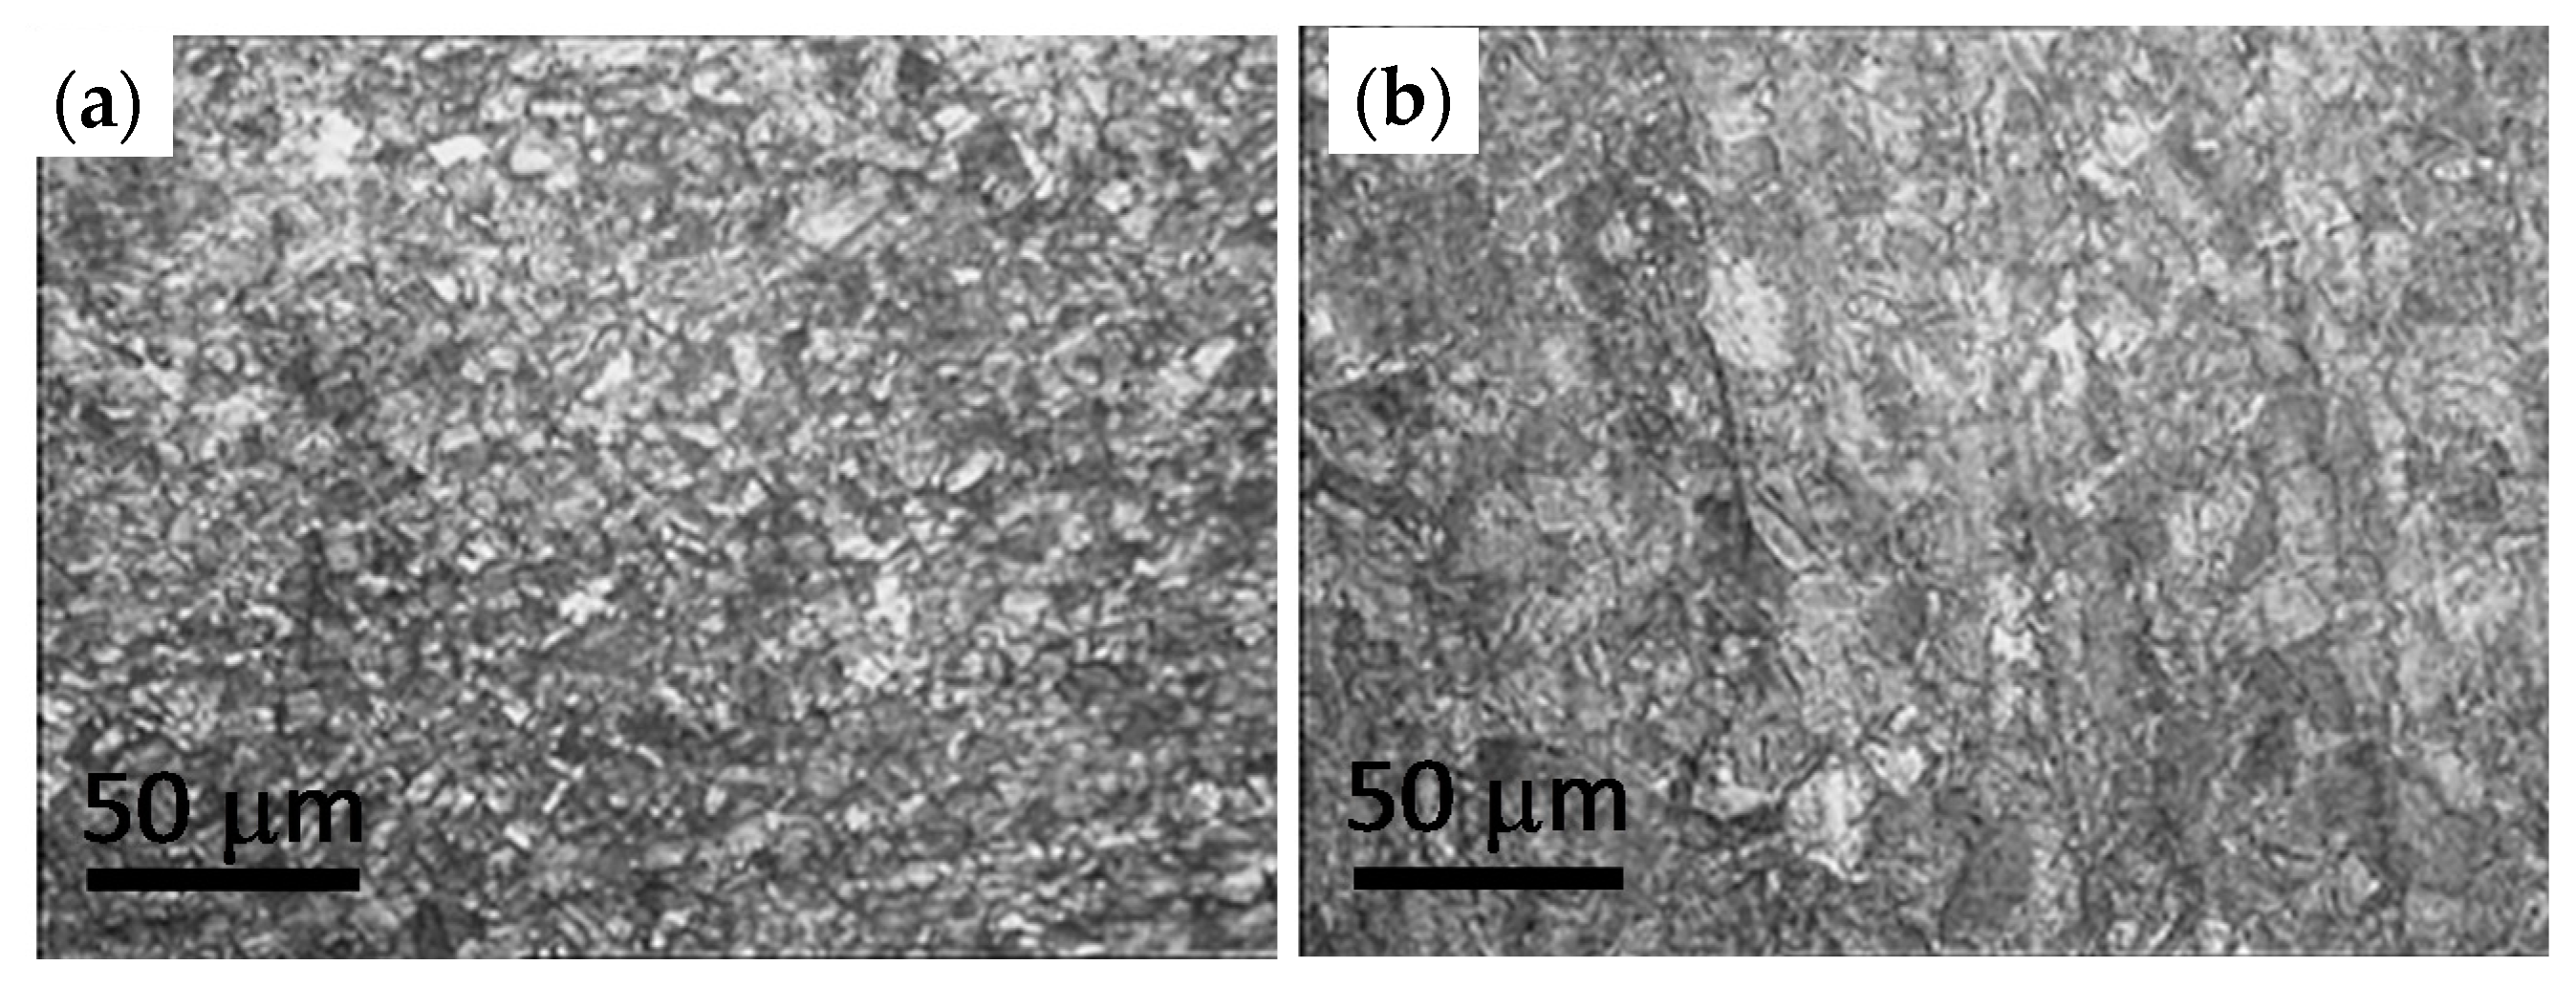
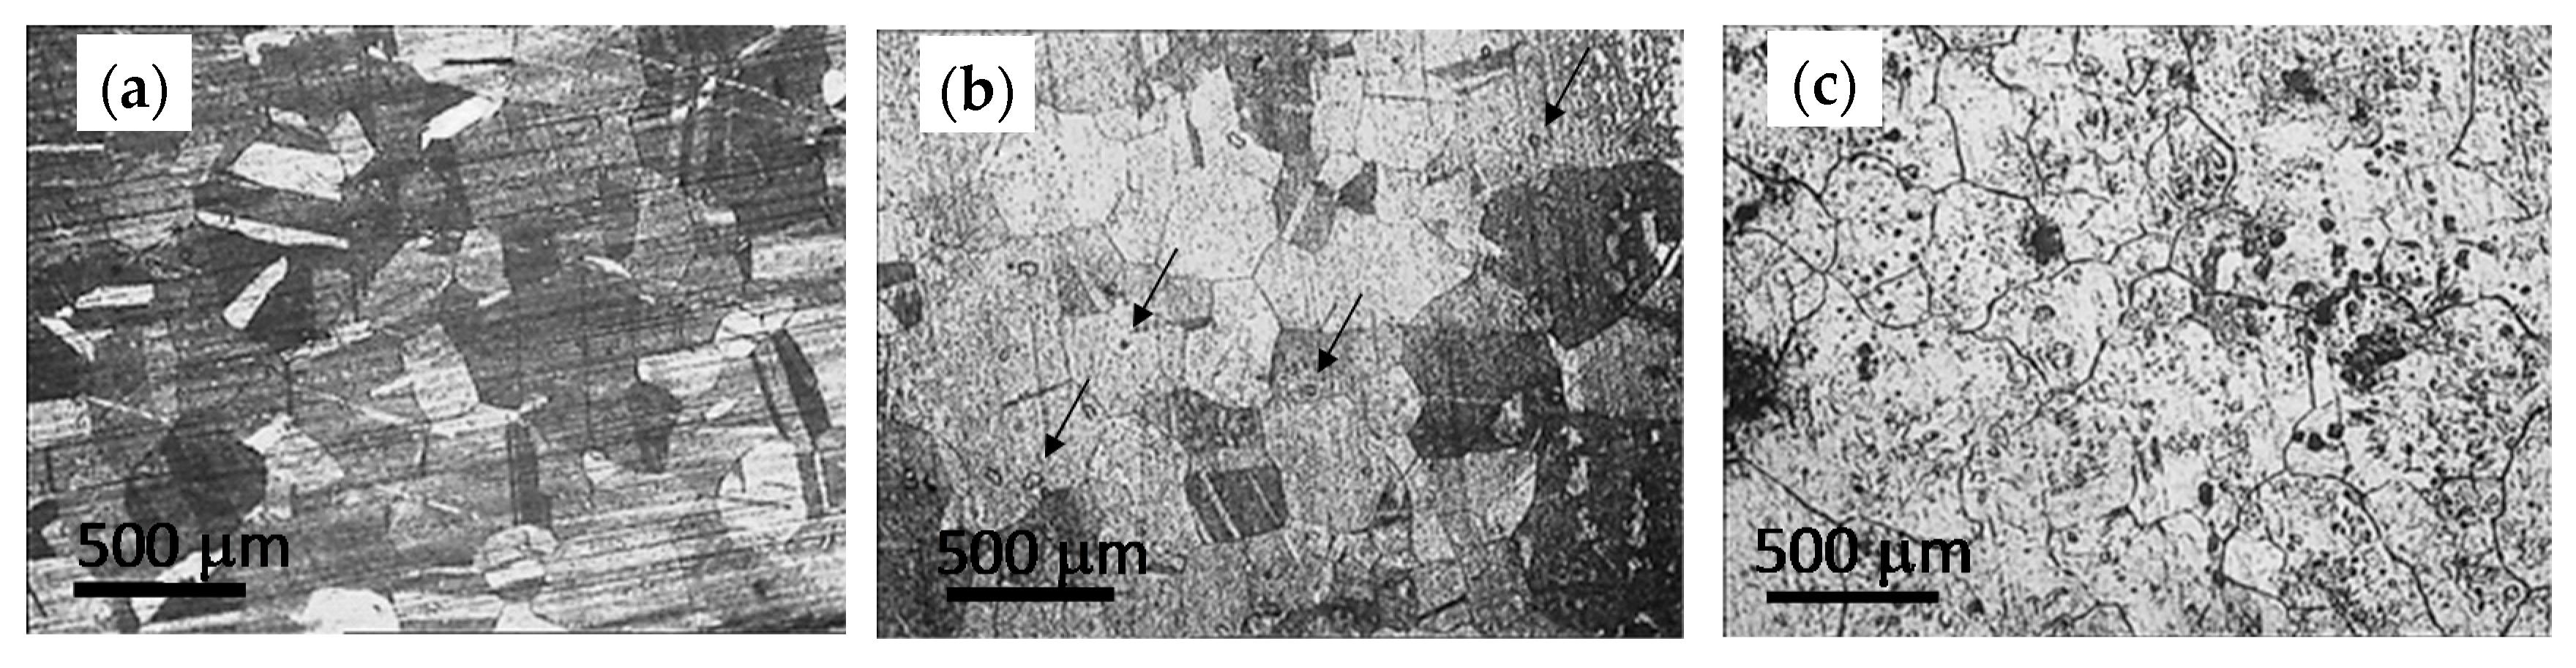
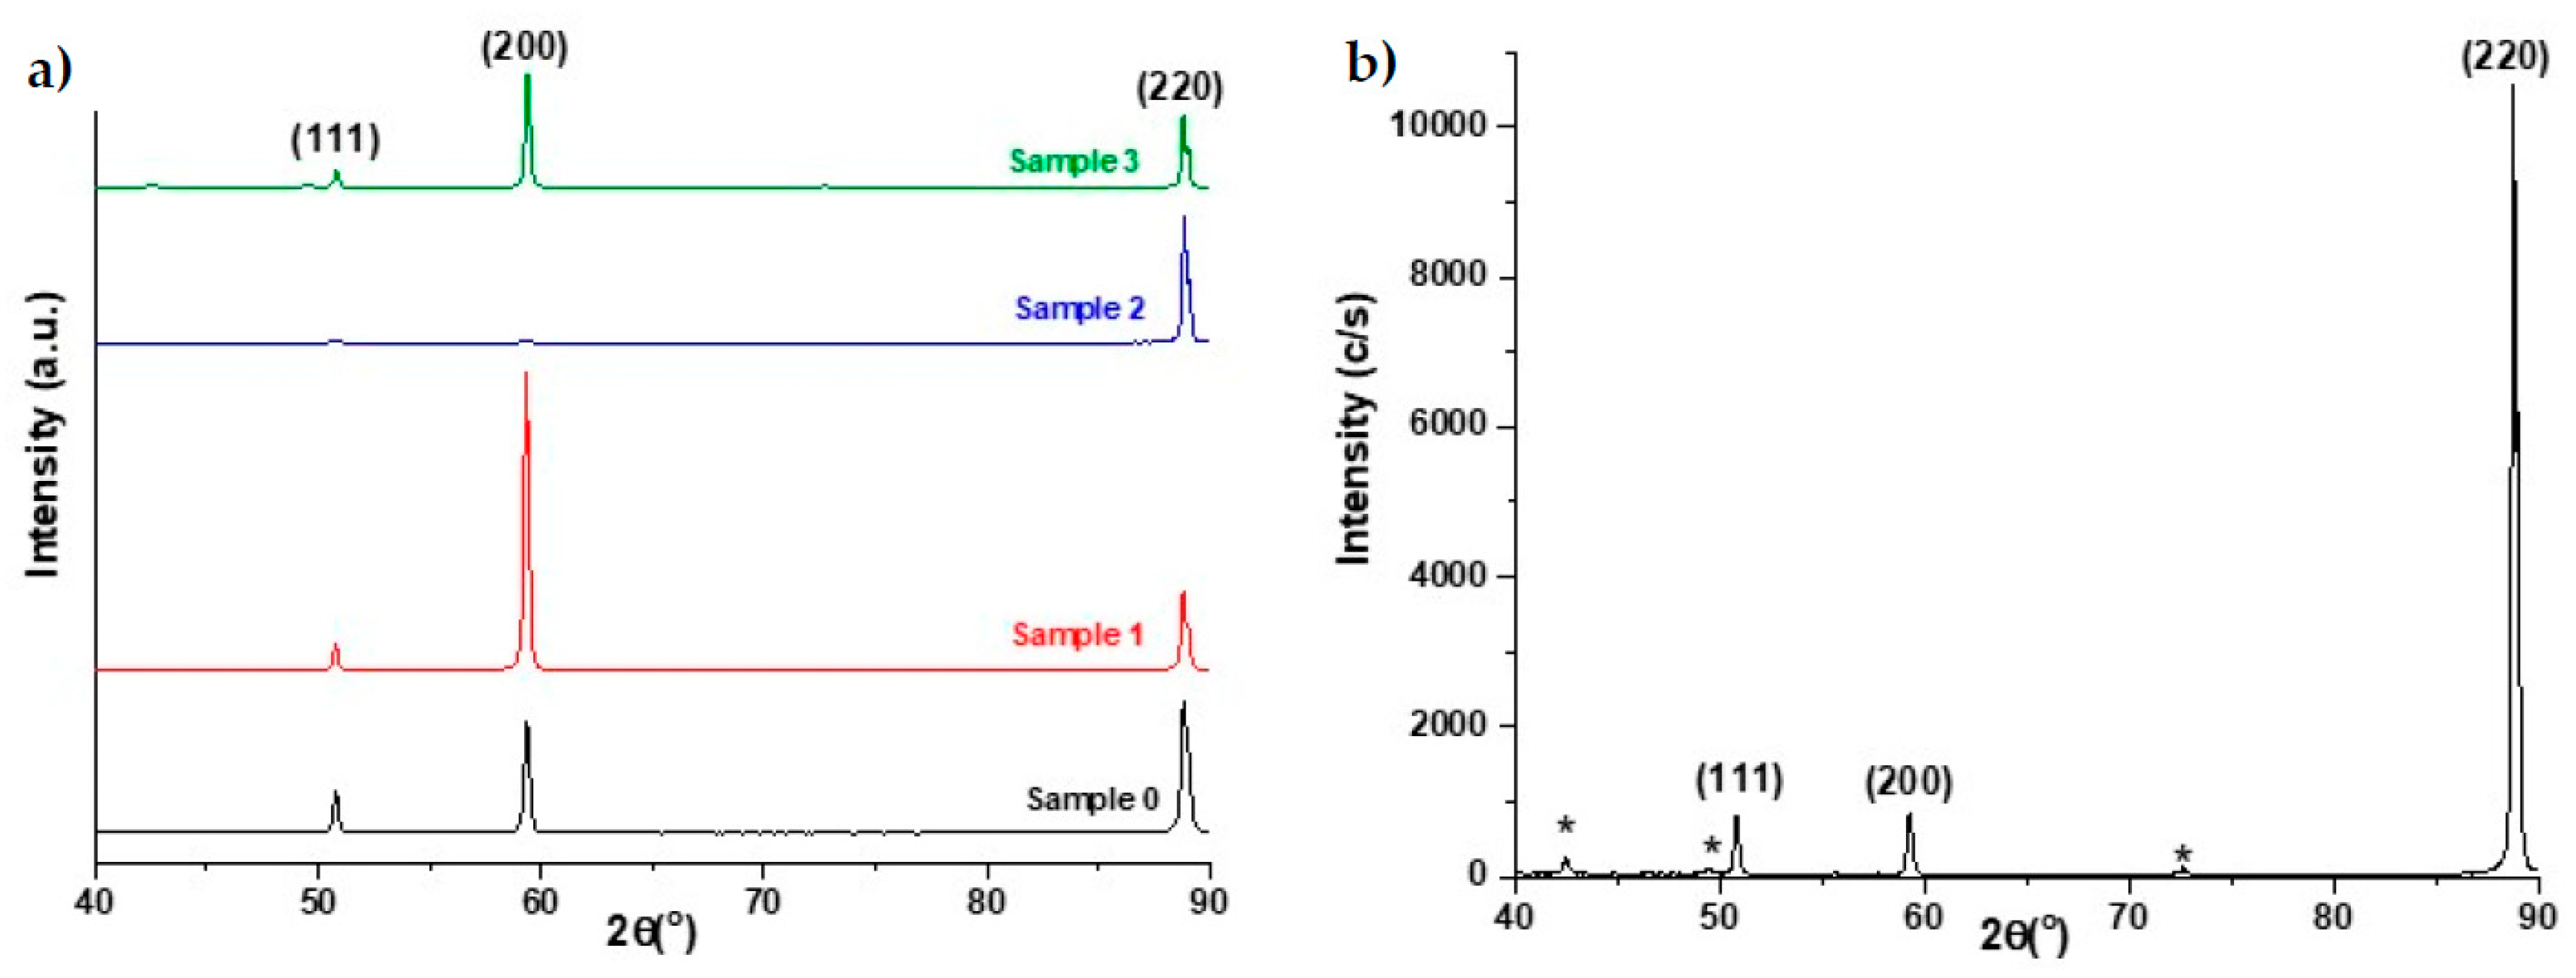
In this work, we describe the results from the characterization of the evolution of structural, surface and mechanical properties of copper used as a combustion chamber during its life cycle; from the copper sheet to the used combustion chamber after 53,000 cycles.

2. Materials and Methods

2.1. Materials

The copper used in this study was from a copper sheet (sample 0), as well as from combustion chambers at four different stages of their life cycles, according to the description in Table 1, where samples 1, 2, 3 and 4 were obtained from the area designated as the skirt.
Each type of sample was characterized in as-received form, without any chemical or physical manipulation, and were designated “as-rec”. All samples were also characterized after a chemical attack with a nitric acid: water (1:1, v/v) solution, at room temperature, for 30 to 60 s, without any further processing. This procedure made it possible to reveal the grain boundaries and to remove the oxide layer in the samples that presented this layer.

2.2. Methods

Metallographic characterization: an optical microscope Axiolab, with a Sony CCD camera, was used for the analysis of the chemically attacked samples. The average grain size was calculated, with a selection of 250 grains for each sample, considering the largest length in each grain.
Structural characterization: The crystalline structures of the sample surfaces were characterized using X’Pert equipment, from Philips, with a cobalt anode (λkα1 = 0.178901 nm). An accelerating voltage of 40 kV, a current of 35 mA, a step of 0.025° and a time per step of 1 s were used in the characterization. For each sample, two diffractograms were collected, whereby the second was obtained after rotating the sample 90° with respect to the orientation of the first diffractogram. No significant changes where found between the two diffractograms of each sample.
Chemical and morphologic characterization: The as-received and chemically etched samples were characterized by scanning electron microscopy (SEM) with a Merlin FEG-SEM, from Zeiss, Jena, Germany. The equipment, besides the secondary electron images, also allows the qualitative evaluation of the chemical composition through energy dispersive spectrometry (EDS).
Topographic characterization: The surface roughness parameters, of both the as-received and chemically attacked surfaces, were evaluated by focus variation microscopy (FVM), using an Alicona instrument, Graz, Austria.
Mechanical properties: Hardness was obtained with a Vickers Hardness test, on the as-received and chemically etched samples, using a Shimadzu HM, equipment, with an applied force of 4.9 N for 15 s. Young’s Modulus (E) was obtained with a vibration test, according to with ASTM 1876-01 procedure [15].

3. Results and Discussion

3.1. Metallographic Characterization

The optical characterization of copper samples 0 and 1 (Figure 1) shows that after the plastic deformation of the copper sheet, to obtain the appropriate conformation for the combustion chamber, there is a slight increase in the grain size (Table 2) and also an orientation of the grains according to the deformation direction, as was expected.
The optical characterization of samples 2, 3 and 4 (Figure 2) unequivocally shows grain growth that occurred due to the thermal treatment that the combustion chamber was subjected in order to weld the pipes to the skirts. All the micrographs present some scratches, because in order to not chemically or physically modify the surfaces, the copper samples were not polished prior to the chemical attack, as this procedure would interfere with the structural integrity of each sample.
The calculated average grain size (Table 2), which did not consider twin boundaries, expresses the observed differences. Although there is a variation in the mean values for samples 2, 3 and 4, these are not statistically significant, so these samples are considered to be very similar in grain size.
Grain growth is normal in crystalline materials when subjected to heat. In fact, grain boundaries are high-energy locations that decrease their entropy by evolving to less energetic states, when the energy is provided. It can also be seen that sample 4 presents a surface with a series of dark regions; these are due to the illumination in the optical microscope and indicate regions that are below the surface and therefore are shaded. These correspond to the beginning of the pit corrosion and are visible due to the removal of the oxides during the chemical attack. In fact, the same type of feature is also visible in sample 3, although with less density (black arrows in Figure 2b), indicating that after only 24 h of continuous work, the corrosion process of the copper combustion chamber has already begun.

3.2. Structural Characterization

The structural evolution of the samples without chemical attack was made by X-ray diffraction (XRD), and the diffraction peaks were identified as the copper diffraction planes, according to reference pattern no. 085-1326 from the International Centre for Diffraction Data (ICDD). The diffractograms of samples 0, 1, 2 and 3 (Figure 3a) and of sample 4 (Figure 3b) show a preferential orientation of the diffraction planes that is different for each type of sample. Nevertheless, the diffraction plane that corresponds to the highest intensity in the reference pattern, plane (111) [16], is the one with the lowest intensity in all copper samples (Table 3).
The copper material from the combustion chamber prepared to be installed in a water heater (Sample 2) shows a strong preferential orientation according to (220) diffraction plane. When the material is preferentially oriented according to the [110] direction, they experience a significant increase in roughness and a proportional increase in hardness when exposed to thermal fatigue. Moreover, the [110] plane direction corresponds to the copper surface with the highest surface energy, 127.7 kJ·mol−1, compared to 87.5 kJ·mol−1 and 68.2 kJ·mol−1 for the [100] and [111] plane directions, respectively [17]. Therefore, the chemical reactivity of the material with a preferential orientation according to the (220) diffraction plane is higher, with a much higher tendency to oxidize. This set of properties/characteristics is the least conducive to good resistance to thermal fatigue and to corrosion resistance. In fact, after 53,000 cycles, the diffractogram clearly shows the existence of diffraction planes identified, according to reference pattern no 003-0892, as copper oxide (cuprite).

3.3. Morphological and Chemical Characterization

The analysis of pristine samples showed that the copper used for the fabrication of the combustion chambers was a high-purity copper. In fact, besides Cu, the EDS characterization of sample 0 (Figure 4) only detected residues of C and O, which are due to the handling of the material, as it was characterized without any cleaning process, as previously justified. The EDS analysis was made under the same conditions for every sample, making it possible to obtain a comparative chemical composition (Table 4).
The results from the chemical composition analysis must be considered very carefully, as the EDS analysis is less standard. Nevertheless, if the analysis is made for the different samples with exactly the same observation parameters—e.g., observation area, accelerating voltage, current and working distance—then the results can be compared, and a trend can be established. However, the values presented can never be considered absolute and will only reveal the tendency of a particular chemical element to increase or decrease its concentration. Considering these limitations, the chemical composition results reveal the presence, in all samples, of carbon due to surface contamination and an increase of oxygen content in samples 3 and 4, with particular relevance for the latter. These results are in agreement with the structural characterization that revealed the presence of cuprite. In fact, the SEM observation of these two samples (Figure 5) shows an exuberant oxide layer in sample 4. Although the oxide layer is not so evident in the surface of sample 3, the elemental map distribution (Figure 5c) of the same area indicates the presence of oxygen. Moreover, it is clear that oxygen distribution is not continuous, suggesting that the oxide layer is not adherent to the metallic bulk material. The detachment of the oxide layer in operative conditions implicates that the oxide does not contribute to forming a passive layer, but rather supports the wear of the material due to its detachment and posterior oxidation cycles.
Also detected on sample 4 were chemical elements that were not found in any other samples, namely sulphur (S) and chlorine (Cl), which were found in higher quantities. The presence of S is due to the reaction with the natural gas used in the combustion process, as this chemical element is added in order to provide odor and serve as an alert if gas leaking is observed. Additionally, it must be considered that both S and Cl reaction with copper is thermodynamically favorable. As already discussed, the preferential orientation presented by the copper of the chamber with 0 h (sample 2) is the most propitious for chemical attack reactions such as oxidation and corrosion. It must be stated that, in addition to the natural gas, these water heaters use a non-stoichiometric excess of air (usually designated as poorly combustible) in order to ensure that all gas is burned and thus to avoid waste. This air excess implies that not all the oxygen will be used in the combustion process, thus contributing to the oxidation process. The oxidation process of copper must be considered, in a broader sense, as the increase of the copper valence number due to its reaction with sulphur, chlorine and oxygen, and not in the restricted sense of a reaction only with oxygen.

3.4. Topographic Characterization

The topographic characterization was obtained through FVM, which made it possible to evaluate the main roughness parameters, namely the average height of the selected area (Sa), the root-mean-square height of the selected area (Sq), and the maximum height of the selected area (Sz). This characterization arose as necessary after observing the chemically attacked samples by SEM (Figure 6). In fact, SEM characterization emphasizes the results observed by optical microscopy, namely with respect to the increase in the grain size, as well as the dimensions of the twins (red arrows in Figure 6). Moreover, the micrographs seem to suggest the increase, both in depth and width, of the grain boundaries. In order to elucidate this aspect, FVM analysis was performed, both on the as-received and chemically attacked materials (Table 5).
In every sample, the values of Sa were the lowest, followed by Sq and finally Sz, as expected, due to the different expression used for their determination [18]. In all as-received samples, all the roughness parameters presented an increase in their values, from sample 0 to sample 4. The difference between samples 0 and 1 is very small; however, due to the increase of grain size, sample 2 presents a significant increase in the roughness parameters. Samples 3 and 4, especially the latter, present the highest values of roughness, due to the formation of the surface oxidized/corroded layer. With respect to the characterization of the chemically attacked surfaces, the roughness parameters are always higher than those presented by the non-attacked samples, mainly because of the increase in the valleys depths corresponding to the attacked grain boundaries, as confirmed by FVM analysis, and as exemplified in Figure 7 for sample 3.

3.5. Mechanical Properties

Hardness results (Table 6) show a substantial increase of this property from sample 0 to sample 1, which is due to plastic deformation hardening. This procedure implies an increase in the number of dislocations, which results in the decrease of the ability for dislocations to move and, consequently, an increase in hardness value. On the other hand, due to the thermal treatment applied in the soldering of the pipes to the skirts of the combustion chamber, a recrystallization process occurs in sample 2 in an effort to form a more thermodynamically stable structure [19]. This recrystallization is accompanied by grain growth, which leads to a dramatic decrease of hardness.
The presence of surface oxides and increasing roughness due to thermal fatigue explain the increase of hardness observed in the surfaces of copper samples 3 and 4 (sample 4b). In fact, in order to better understand the effect of surface roughness, the hardness values were also determined in sample 4 after removing the oxide layer (sample 4a). The obtained value shows an increase, when compared that from sample 2, indicating the contribution of surface roughness, as explained previously [4,5].
Considering that Young’s modulus (E) is an intrinsic property that depends only on the type of chemical bonds, it could be expected that E values should be the same. In fact, the obtained values (Table 7) do not differ very much from those of sample 0.
In order to emphasize the decrease of the mechanical properties with the time of use of the combustion chambers, we made an approximation by calculating the yield stress from the Hall-Petch equation. In fact, conventional polycrystalline metals follow an empirical relationship that expresses the strength of these materials as a function of their grain size. This relationship, which is based on the ability of grain boundaries to hold displacements [20], is called the Hall-Petch relationship. For pure copper, and according to published work [21], the constants to use in Hall-Petch equation are k = 0.112 MN/m^(3/2) and σ0 = 25 MPa, where k is the Hall-Petch constant of the material and σ0 is the yield stress for a monocrystalline structure. Table 8 presents the yield stress σ(d), calculated according to these assumptions.
These results, as expected, also exhibit a strong change in the yield stress value between surfaces 0 and 1 and the remainder. Considering that the yield stress values were calculated from the Hall-Petch relation, the variation observed is quite justifiable. It should be highlighted that the results of this empirical law are approximations, since the yield stress of a material depends on several factors other than the grain size, which are contained in the parameters σ0 and k. These are obtained experimentally, and the published values may not be fully adjusted to the reality of the study material [20]. In addition, it has not been taken into account that samples 3 and 4 do not consist only of copper, since there are oxides and other compounds on their surfaces due to the corrosion caused by operation. Nevertheless, these results give a qualitative indication of the influence that grain size can have on the mechanical strength of the material.

4. Conclusions

This study demonstrated that during the life cycle of a copper combustion chamber, the processes that cause the most significant changes at the microstructural level are the thermal treatment, at 800 °C for approximately 45 min, and the prolonged use of the component. The thermal treatment causes a substantial increase in the grain size and annealing twins of the samples with the consequent decrease of hardness.
The crystalline structure of a copper combustion chamber with 0 h of operation has a preferred orientation in the direction [110]. This is the most favorable orientation to surface degradation caused by thermal fatigue. During the entire life cycle, the structural arrangement presents the plane of highest atomic density (111) as the one with the lowest intensity. The predominance of less compact planes, in which the diffusion of oxidant species is facilitated, promotes oxidation due to operation at high temperatures. The detachment of layers of oxidized material suggests these are not adherent to the material, which is detrimental to the component, since successive oxidation and detachment wears the material, reducing the lifetime.

Author Contributions

Both authors contributed equally to the work.

Acknowledgments

This study was partly supported by FEDER funds through the Operational Program Competitiveness Factors-COMPETE and national funds by FCT-Foundation for Science and Technology under the strategic project PEst-C/EME/UI0285/2013. The authors also acknowledge BOSH Portugal, Aveiro for providing all copper material and exhaustions chambers.

Conflicts of Interest

The authors declare no conflict of interest.

References

  1. Rafique, M.; Shaikh, A.J.; Rasheed, R.; Tahir, M.B.; Bakhat, H.F.; Rafique, M.S.; Rabbani, F. A Review on Synthesis, Characterization and Applications of Copper Nanoparticles Using Green Method. Nano 2017, 12, 1750043. [Google Scholar] [CrossRef]
  2. Copper and Copper Alloys. Available online: http://hedhme.com/content_map/?article_id=437 (accessed on 22 September 2017).
  3. Sehitoglu, H. Thermal and Thermomechanical Fatigue of Structural Alloys. In Fatigue and Fracture, ASM Handbook, 1st ed.; Lampman, S.R., DiMatteo, N.D., Eds.; ASM International: Materials Park, OH, USA, 1996; Volume 19, p. 527. ISBN 978-0-87170-385-9. [Google Scholar]
  4. Aicheler, M.; Sgobba, S.; Arnau-Izquierdo, G.; Taborelli, M.; Calatroni, S.; Neupert, H.; Wuensch, W. Evolution of surface topography in dependence on the grain orientation during surface thermal fatigue of polycrystalline copper. Int. J. Fatigue 2011, 33, 396–402. [Google Scholar] [CrossRef]
  5. Aicheler, M. Influence of grain orientation on evolution of surface features in fatigued polycrystalline copper: A comparison of thermal and uniaxial mechanical fatigue results. J. Phys. Conf. Ser. 2010, 240, 012051. [Google Scholar] [CrossRef]
  6. Klesnil, M.; Lukác, P. Fatigue of Metallic Materials, 2nd ed.; Elsevier Science Ltd.: Amsterdam, The Netherlands, 1993; Volume 71, ISBN 9780444987235. [Google Scholar]
  7. Mughrabi, H. Microstructural mechanisms of cyclic deformation, fatigue crack initiation and early crack growth. Philos. Trans. R. Soc. A 2015, 373, 20140132. [Google Scholar] [CrossRef] [PubMed]
  8. Kocanda, S.; Noordhoff, S. Fatigue Failure of Metals; Springer: Warsaw, Poland, 1978; ISBN 978-90-286-0025-6. [Google Scholar]
  9. Lukás, P. Fatigue Crack Nucleation and Microstructure. In Fatigue and Fracture, ASM Handbook, 1st ed.; Lampman, S.R., DiMatteo, N.D., Eds.; ASM International: Materials Park, OH, USA, 1996; Volume 19, pp. 96–109. ISBN 978-0-87170-385-9. [Google Scholar]
  10. Li, R.H.; Zhang, P.; Zhang, Z.F. Fatigue cracking and fracture behaviors of coarsed-grained copper under cyclic tension-compression and torsion loadings. Mater. Sci. Eng. A 2013, 574, 113–122. [Google Scholar] [CrossRef]
  11. Agbessi, K.; Saintier, N.; Thierry, P.L. Microstructure-based study of the crack initiation mechanisms in pure copper under high cycle multiaxial fatigue loading conditions. Procedia Struct. Integr. 2016, 2, 3210–3217. [Google Scholar] [CrossRef]
  12. World Mineral Production 2008–12, British Geological Survey. Available online: https://www.bgs.ac.uk/downloads/start.cfm?id=2897 (accessed on 21 September 2017).
  13. Bradford, A.S. Fundamentals of Corrosion in Gases. In Corrosion: Fundamentals, Testing and Protection, 1st ed.; Cramer, S.D., Covino, B.S., Jr., Eds.; ASM International: Materials Park, OH, USA, 1987; Volume 13A, pp. 87–90. ISBN 978-0-87170-705-5. [Google Scholar]
  14. Asphahani, A.I.; Silence, W.L. Pitting Corrosion. In Corrosion: Fundamentals, Testing and Protection, 1st ed.; Cramer, S.D., Covino, B.S., Jr., Eds.; ASM International: Materials Park, OH, USA, 1987; Volume 13A, pp. 236–239. ISBN 978-0-87170-705-5. [Google Scholar]
  15. ASTM International. E 1876 Standard Test Method for Dynamic Young’s Modulus, Shear Modulus, and Poisson’s Ratio by Impulse Excitation of Vibration. 2001. Available online: https://www.astm.org/Standards/E1876.htm (accessed on 14 May 2018).
  16. Piedade, A.P.; Vieira, M.T.; Martins, A.; Silva, F. In vitro behaviour of nanocrystalline silver-sputtered thin films. Nanotechnology 2007, 18, 105103–105107. [Google Scholar] [CrossRef]
  17. Vitos, L.; Ruban, A.V.; Skriver, H.L.; Kollár, J. The surface energy of metals. Surf. Sci. 1998, 411, 186–202. [Google Scholar] [CrossRef]
  18. Carvalho, I.; Henriques, M.; Oliveira, J.C.; Alves, C.F.A.; Piedade, A.P.; Carvalho, S. Influence of surface features on the adhesion of Staphylococcus epidermidis to Ag–TiCN thin films. Sci. Technol. Adv. Mater. 2013, 14, 035009–035018. [Google Scholar] [CrossRef] [PubMed] [Green Version]
  19. Tomov, V.; Stoychev, D.S.; Vitanova, I.B. Recovery and recrystallization of electrodeposited bright copper coatings at room temperature. II. X-ray Investigation of Primary Recrystallization. J. Appl. Electrochem. 1985, 15, 887–894. [Google Scholar] [CrossRef]
  20. Hansen, N. Hall-Petch relation and boundary strengthening. Scr. Mater. 2004, 51, 801–806. [Google Scholar] [CrossRef]
  21. Smith, W.F.; Hashemi, J. Foundations of Materials Science and Engineering, 4th ed.; McGraw-Hill: Boston, MA, USA, 2006; pp. 242–243. ISBN 0072953586. [Google Scholar]
Figure 1. Optical micrographs of: (a) chemically etched sample 0; and (b) chemically etched sample 1.
Metals 08 00362 g001
Figure 2. Optical micrographs of: (a) chemically etched sample 2; (b) chemically etched sample 3; and (c) chemically etched sample 4.
Metals 08 00362 g002
Figure 3. DRX diffractograms of the as-received copper: (a) samples 0, 1, 2 and 3; and (b) sample 4, with Cu2O peaks identified by *.
Metals 08 00362 g003
Figure 4. (a) SEM secondary electron micrograph of sample 0, with (b) qualitative spectra of the area correspondent to (a).
Metals 08 00362 g004
Figure 5. SEM secondary electron micrographs of the as-received copper: (a) sample 3; and (b) sample 4. (c) Elemental map distribution of oxygen (Kα transition) of the area shown in (a).
Metals 08 00362 g005
Figure 6. SEM micrographs of chemically attacked copper surfaces: (a) sample 0; (b) sample 1; (c) sample 2; (d) sample 3; (e,f) sample 4. The read arrows highlight the enlargement of the twins.
Metals 08 00362 g006
Figure 7. (a) FVM image of grain boundary (red line, indicated by red arrow) of sample 3. (b) 2D profile corresponding to the red line in (a).
Metals 08 00362 g007
Table 1. Designation and identification of the copper used in this work.
DesignationDescription of the Copper Samples
Sample 0Pristine copper sheet
Sample 1Combustion chamber after copper sheet conformation
Sample 2Combustion chamber after copper sheet conformation and after 45 min in an oven at 800 °C (chamber with 0 h of work).
Sample 3As in sample 2 but with 24 h of continuous work
Sample 4As in sample 2 but with 53,000 cycles * of work.
* Each cycle consists of 1 min of work and 1 min off. Therefore, the combustion chamber sums a total of 883 h of intermittent work.
Table 2. Average grain size determined from the optical micrographs.
SampleGrain Size (μm)
Average ValueStandard Deviation
0103
1235
2349158
328492
4336178
Table 3. Relative intensities of the diffraction planes of the studied copper samples compared with ICDD pattern no. 085-1326.
SamplesRelative Intensity of the Diffraction Plans
(111)(200)(220)
ICDD1004317
Sample 03284100
Sample 1910027
Sample 222100
Sample 31410064
Sample 41011100
Table 4. EDS chemical composition of the as-received copper samples.
SampleChemical Composition (Weight %)
COSiSClKCaCu
05.50.6----------93.9
14.50.6----------94.9
26.61.9----------91.5
38.212.8----------79.0
48.227.60.54.910.02.72.243.9
Table 5. Roughness parameters average values of all as-received (as-rec) and chemically attacked (c.a.) copper samples.
RoughnessSample 0Sample 1Sample 2Sample 3Sample 4
as-recc.a.as-recc.a.as-recc.a.as-recc.a.as-recc.a.
Sa (nm)82939611526225335135348671469
Sq (nm)10411811815532932946050164381864
Sz (nm)736966837143262018313904027,904100,39014,246
Table 6. Vickers hardness values of the copper samples.
Hardness HV
SampleAverage (MPa)s.d.
0608
1831
2543
3648
4a622
4b40062
Table 7. Young’s modulus of the pristine copper samples.
SampleE (GPa)
0104
1104
296
396
496
Table 8. Yield stress of the combustion chamber copper samples.
Sampleσ(d) (MPa)
01174
1995
2214
3235
4218

