Article

Effect of Microstructures on Working Properties of Nickel-Manganese-Copper Cast Iron

by
Daniel Medyński
1,*,
Andrzej Janus
2,
Bartłomiej Samociuk
2 and
Jacek Chęcmanowski
3
1
Faculty of Technical and Economic Sciences, Witelon State University of Applied Science in Legnica, Sejmowa 5A, 59-220 Legnica, Poland
2
Department of Foundry Engineering, Plastics and Automation, Wroclaw University of Science and Technology, Smoluchowskiego 25, 50-372 Wrocław, Poland
3
Department of Advanced Materials Technologies, Wroclaw University of Science and Technology, Smoluchowskiego 25, 50-372 Wrocław, Poland
*
Author to whom correspondence should be addressed.
Metals 2018, 8(5), 341; https://doi.org/10.3390/met8050341
Submission received: 12 April 2018 / Revised: 7 May 2018 / Accepted: 7 May 2018 / Published: 11 May 2018
(This article belongs to the Special Issue Microstructure and Mechanical Properties of Casting Alloys)

Abstract

:
In the paper, the effects, on basic usable properties (abrasive wear and corrosion resistance), of solidification (acc. to the stable and non-stable equilibrium system) and transformations occurring in the matrix during the cooling of castings of Ni-Mn-Cu cast iron were determined. Abrasive wear resistance was mainly determined by the types and arrangements of high-carbon phases (indicated by eutectic saturation degree), and the kinds of matrices (indicated by the nickel equivalent value, calculated from chemical composition). The highest abrasive wear resistance was found for white cast iron, with the highest degree of austenite to martensite transformation occurring in its matrix. Irrespective of solidification, a decrease of the equivalent value below a limit value resulted in increased austenite transformation, and thus, to a significant rise in hardness and abrasive wear resistance for the castings. At the same time, corrosion resistance of the alloy was slightly reduced. The examinations showed that corrosion resistance of Ni-Mn-Cu cast iron is, too a much lesser degree, decided by the means of solidification of the castings, rather than transformations occurring in the matrix, as controlled by nickel equivalent value (especially elements with high electrochemical potential).

1. Introduction

High demands concerning abrasive wear and corrosion resistance are imposed on cast iron castings designed for machine parts operating in hard conditions; therefore, the development of materials that guarantee longer trouble-free operation becomes the priority.
In abrasion conditions, abrasive wear resistance depends, to a large degree, on the hardness of the castings. Therefore, all structural components increasing material hardness most often increase its resistance to abrasive wear [1,2,3,4,5,6]. From this point of view, chilled martensitic cast iron seems to be the most favourable. However, in most cases, such structures do not necessarily reach the required minimum crack resistance [1,7].
In turn, high-alloy materials with one-phase matrices are characterised by increased corrosion resistance. Within the group of casting alloys, a typical representative of such a material is austenitic cast iron Ni-Resist, containing 14 to 36% of nickel [1,8].
High concentrations of relatively expensive nickel can be reduced by replacing it partially with manganese and copper. Like nickel, these elements stabilise austenite [9,10,11,12,13]. A limit of this replacement is determined by the minimum value of nickel equivalent EquNi, calculated on the grounds of the relationship (1), and by too great an inclination for hard-spotting [14,15,16].
EquNi = 0.32·C + 0.13·Si + Ni + 2.48·Mn + 0.53·Cu,
where:
  • EquNi—nickel equivalent (wt %),
  • C, Si, Ni, Mn, Cu—concentrations of elements (wt %).
The matrix structure of raw alloys with EquNi higher than 16.0% is composed solely of austenite. In these alloys, during the cooling of castings, austenite-martensite transition occurs partially; the extent is dependent on the equivalent value. On the other hand, the total content of alloying elements in Ni-Mn-Cu cast iron should favorably affect corrosion resistance [17].
The presented work is aimed at determining the causes of structural changes resulting from changing the nickel equivalent influence abrasive wear and corrosion resistance of the Ni-Mn-Cu cast iron. Research results on the effect of chemical composition on structure and corrosion resistance by gravimetric have been partially published [17]. However, the results obtained were not sufficient to formulate precise conclusions. Therefore, more detailed research on corrosion resistance was carried out, and tests on abrasive wear resistance were undertaken. The results were included in this work.

2. Materials and Methods

The cast iron to be examined was cast in a crucible medium-frequency induction furnace. After overheating to 1450–1510 °C, liquid alloy was cast in a shell mould to obtain shafts of dia. 30 mm.
Five castings of Ni-Mn-Cu cast iron (marked with subsequent numbers from 1 to 5) and, for comparison, cast iron GJL-300 (alloy No. 6) and Armco iron (alloy No. 7), were examined (Table 1). Different alloy compositions were selected to carry out the experimental work in order to determine impact differentiation of solidification, and transformations occurring during cooling, on working properties.
Chemical compositions of the alloys were determined spectrally with a glow discharge analyser GDS 750 QDP, and by energy dispersive X-ray spectroscopy, using a scanning electron microscope (Quanta FEI equipped with an EDX detector). Nickel equivalent (EquNi) and eutectic saturation ratio values (SC—determines deviation of chemical compositions the cast iron from its eutectic composition) were determined on the grounds of the results given in Table 1 [1,17].
The scope of the examinations included microscopic observations, hardness measurements, and tests of abrasive wear and corrosion resistance.
Microscopic observations were carried-out using an optical microscope Nikon MA200 (Nikon, Bankok, Tailand) and a scanning electron microscope Quanta FEI (Waltham, MA, USA), using imaging techniques SE and BSE. Hardness was measured using a Brinell hardness tester at 1838.75 N and a Vickers hardness tester Nexus at 0.01 N and 0.1 N.
Abrasive wear resistance tests were carried-out on a tester T-07, made by the Institute for Sustainable Technologies—National Research Institute in Radom [18]. The test station guaranteed indefinite contact type, wear with loose abrasive material (corundum F90 acc. to ISO 8486:1998), and sliding movement ensuring technical dry friction at a constant load (acc. to GOST 23.208-79). The specimen (30 × 30 × 3 mm) was pressed against the counter-specimen (metallic ring covered by rubber with hardness 78–85 Sh, rotating at 60 ± 2 rpm) with a force F of 44 N, produced by weights via a lever system. The test duration was 10 min.
Corrosion resistance tests were carried-out by gravimetric and potentiodynamic methods, in a 3% water solution of NaCl, at ambient temperature [19,20,21]. To enhance the aggressiveness of the solution, aeration was applied [21].
Results of gravimetric tests are presented as mass changes per time per surface area VC (mg/(dm2·day)), and after conversion as linear corrosion rate VP (mm/year) [19,20,21,22]:
VP = (0.0365·VC)/d,
where:
  • VP—linear corrosion rate (mm/year),
  • VC—mass loss in time (mg/(dm2·day)),
  • d—density of metallic material (g/cm3).
Potentiodynamic measurements were made in a traditional, fully automated three-electrode system. As the reference electrode, a saturated calomel electrode was used. The auxiliary electrode was made of platinum [20,21,23,24]. Polarization of the specimens was always started from the potential −1250 mVNEC in anodic direction, at 1 mV/s. Corrosion resistance was evaluated on the grounds of stationary potential E’, cathodic-anodic transition potential EK-A, corrosion current density icorr, and polarisation resistance Rp.

3. Results and Discussion

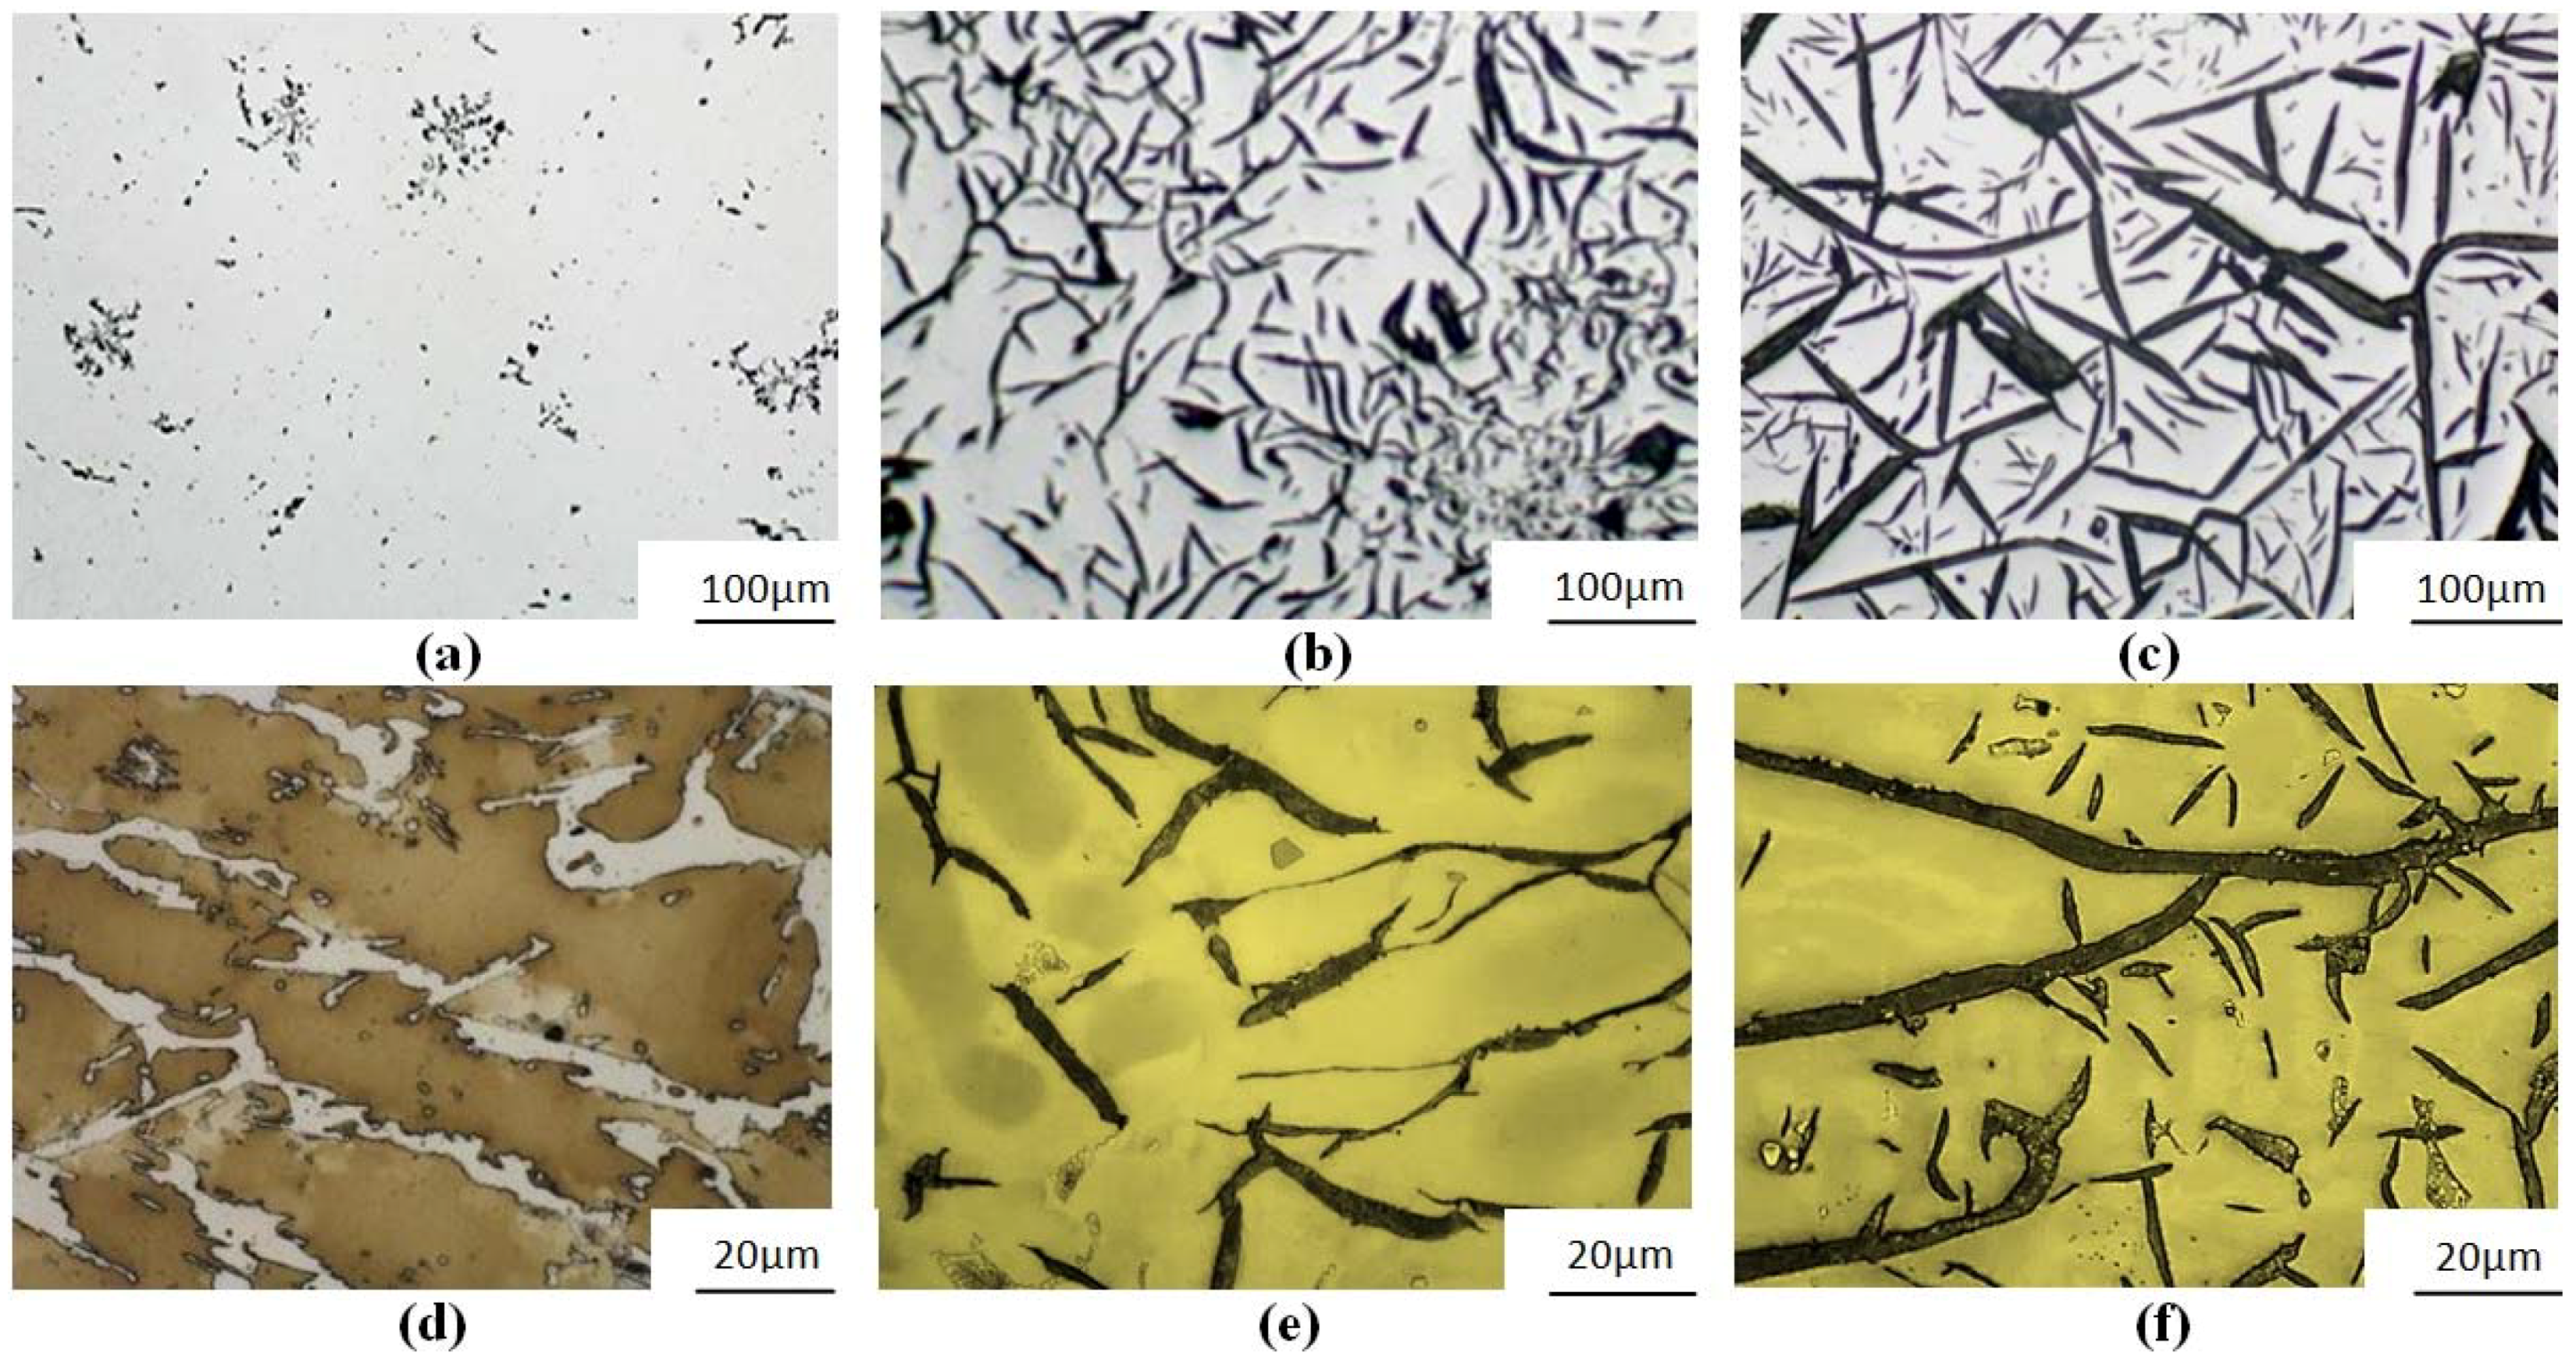
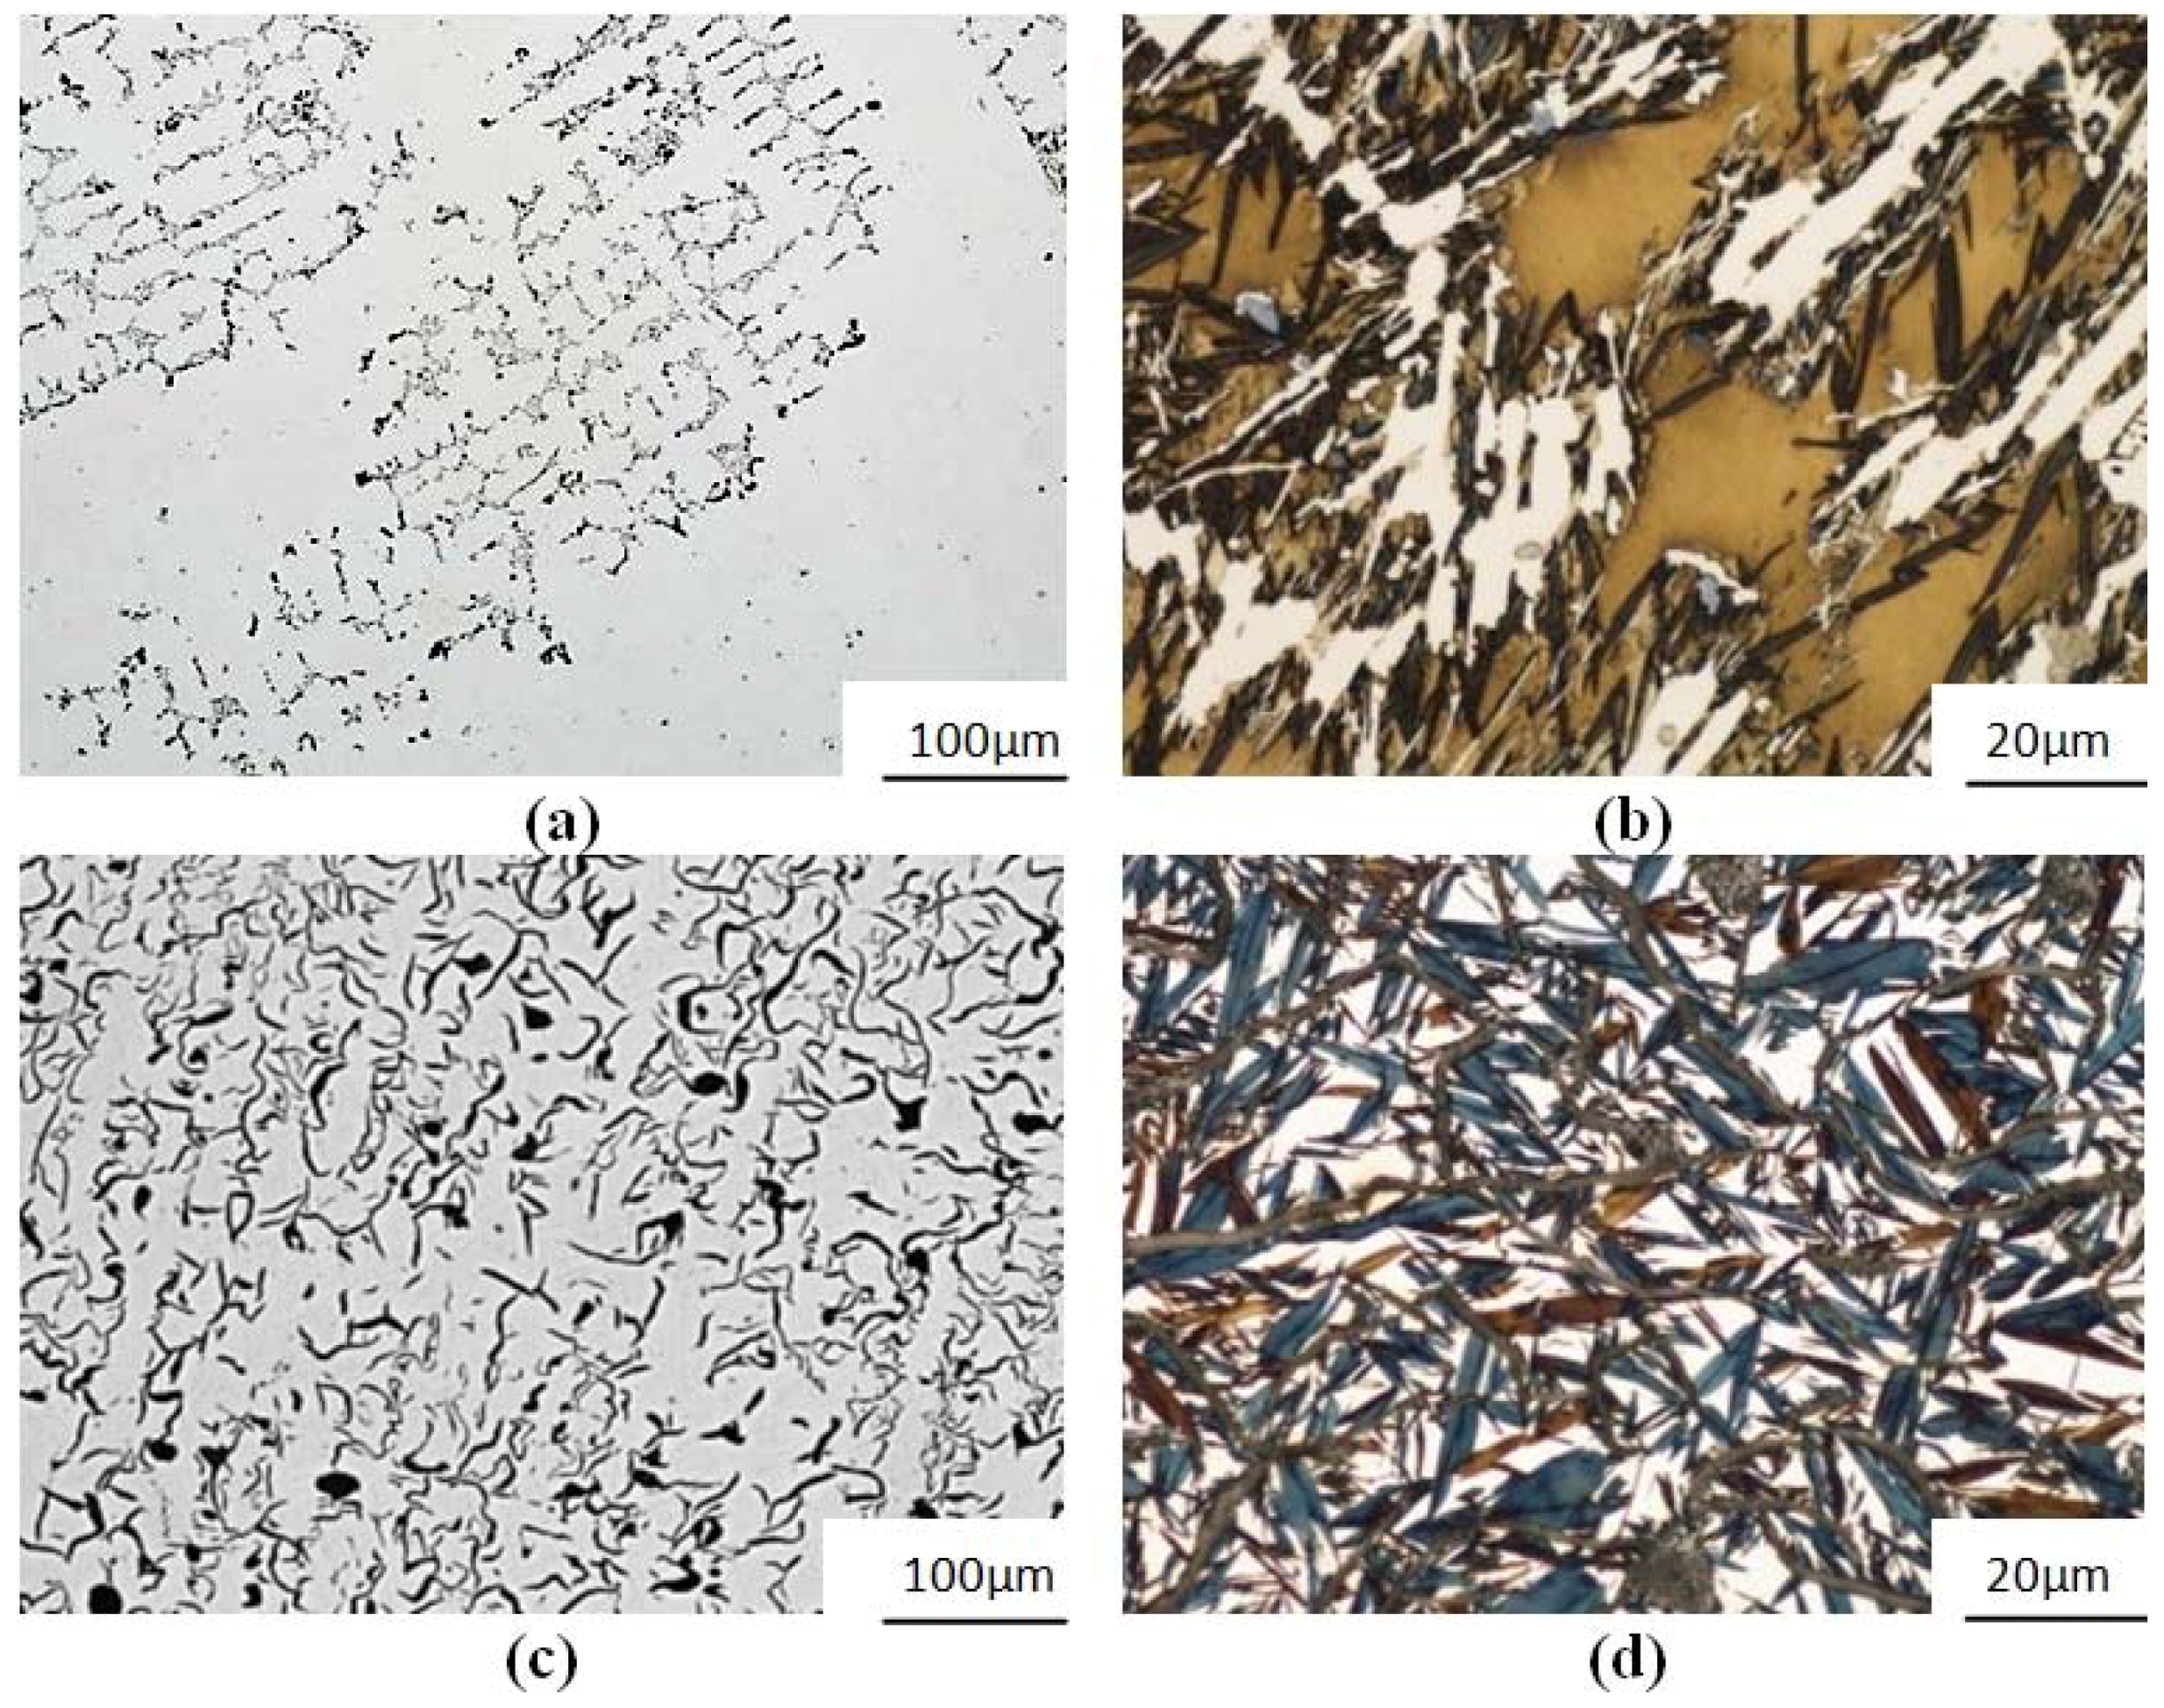
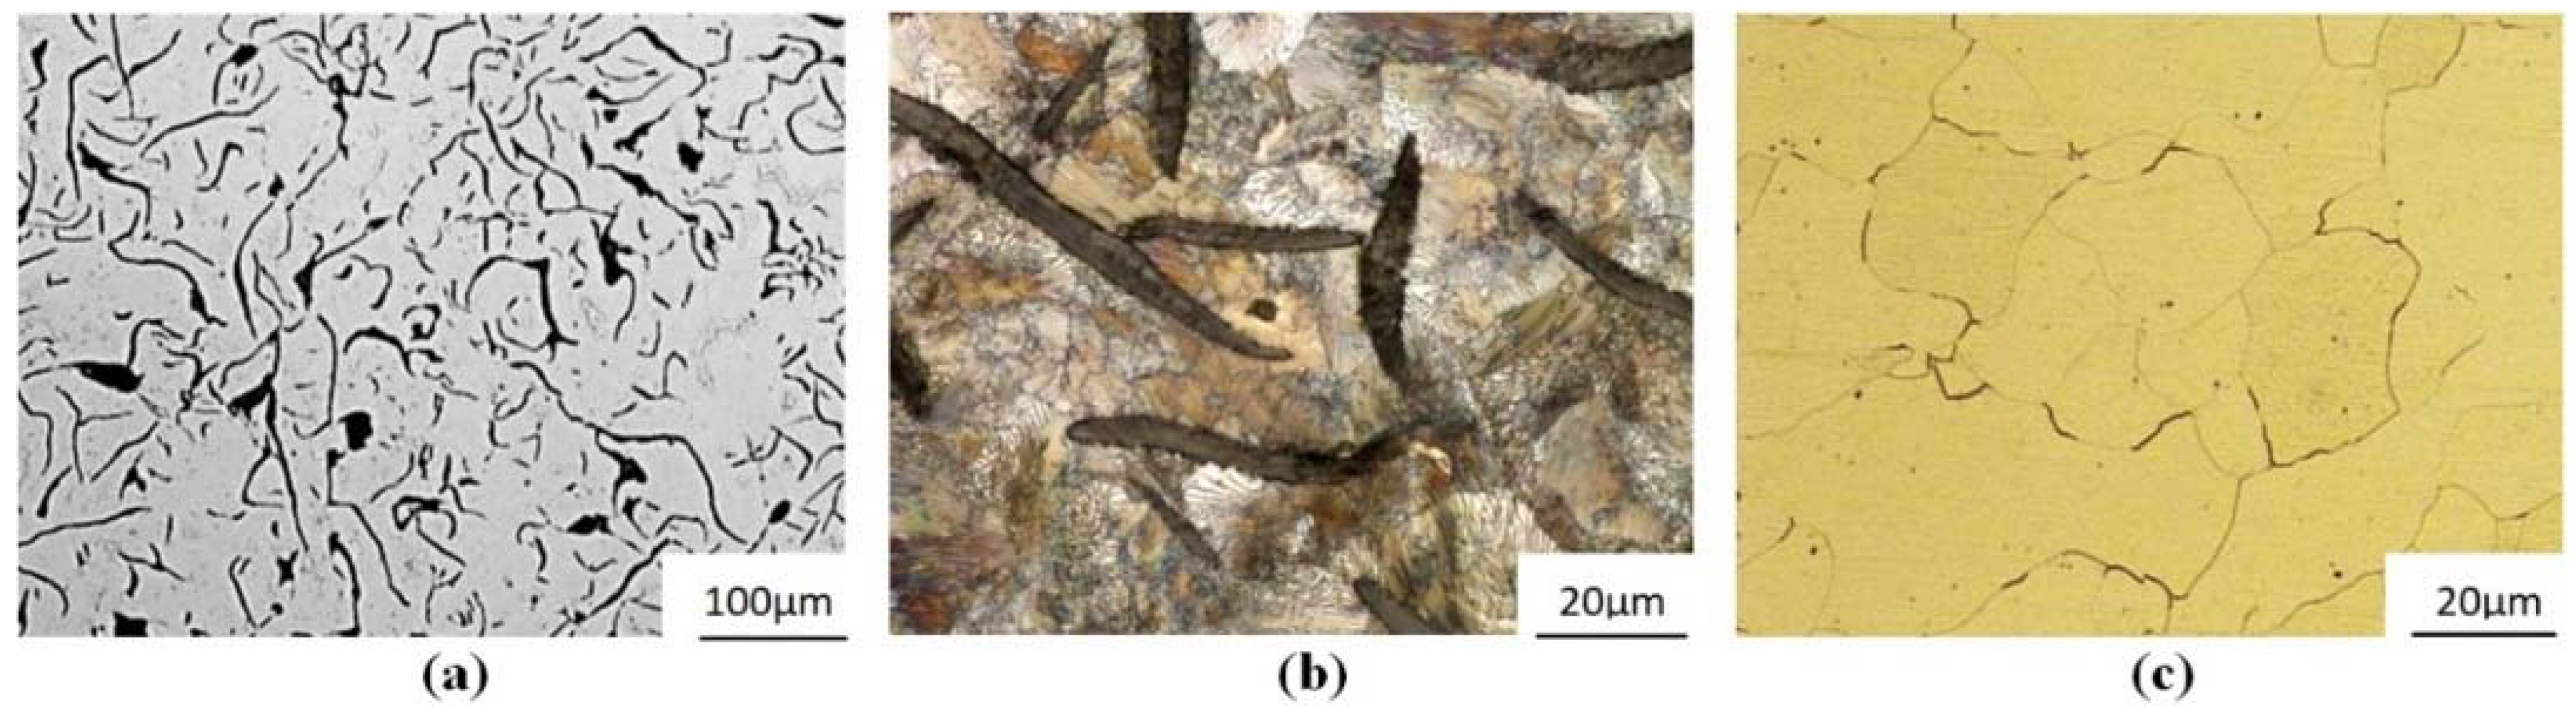
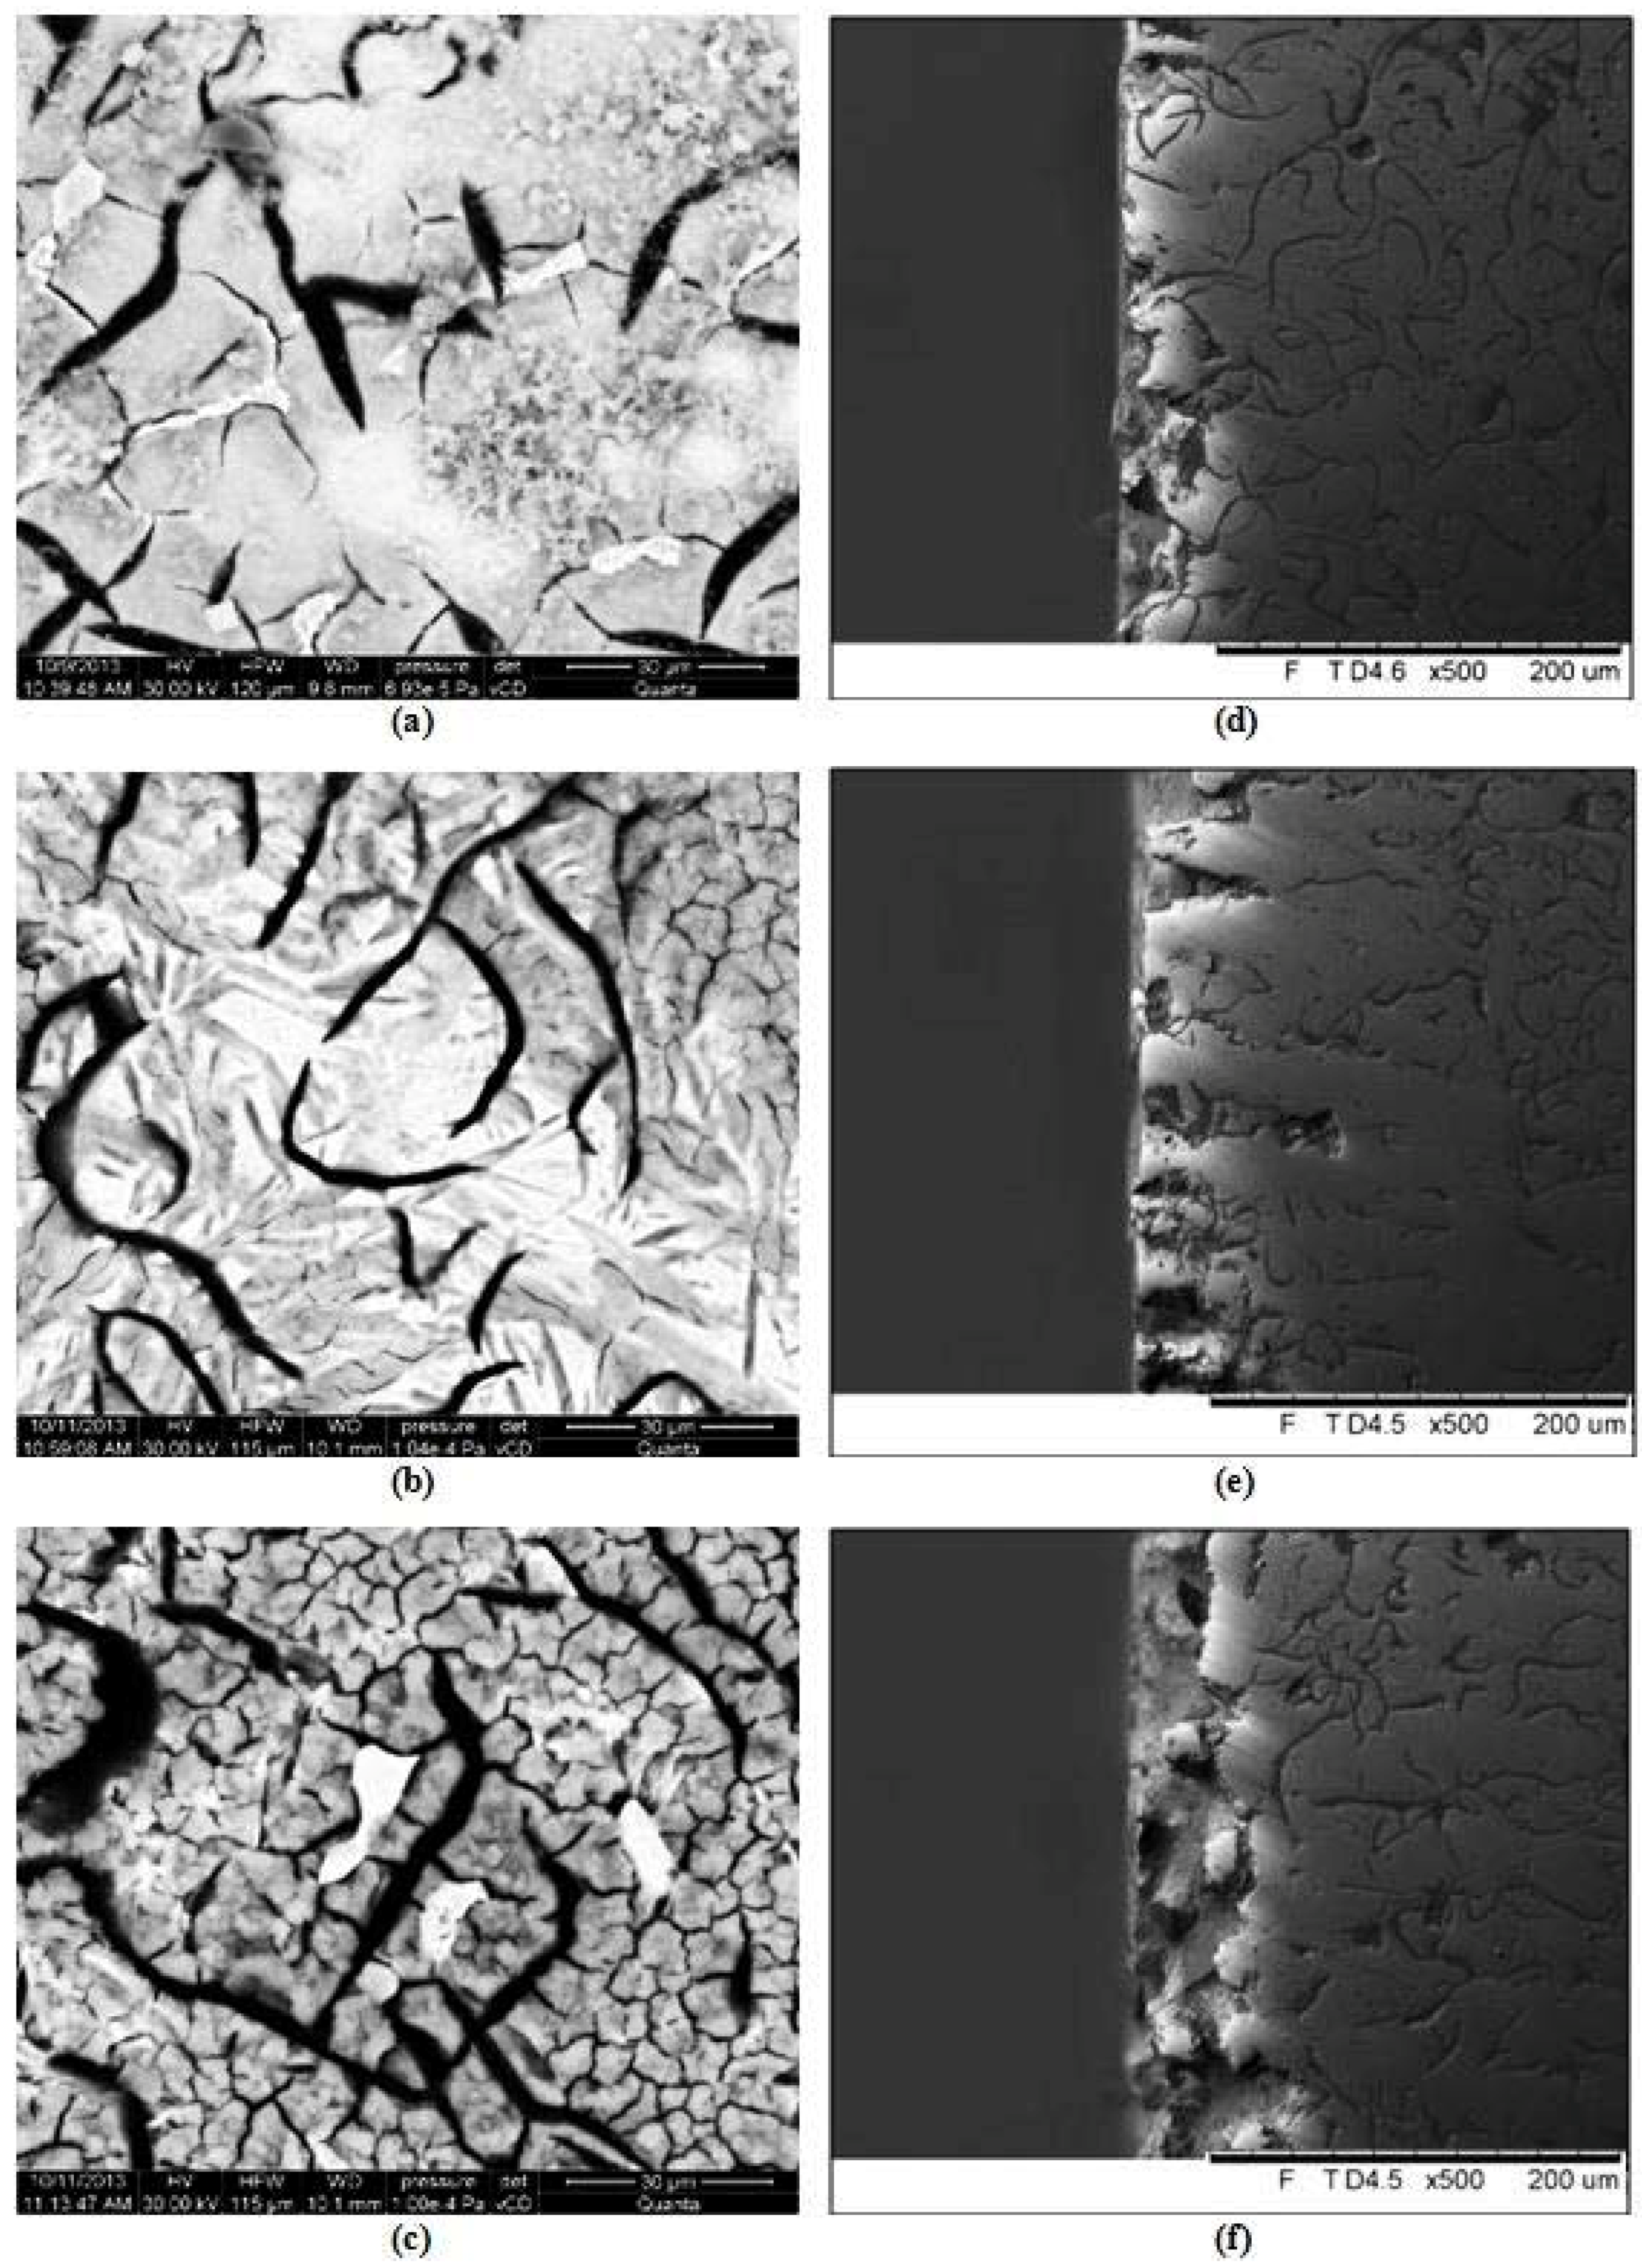
3.1. Microscopic Observations and Hardness Measurements

Microscopic observations showed considerable diversity among microstructures in the examined alloys [17]. In matrices of the alloys 1–3 (EquNi > 16%), austenite only was found; see Figure 1.
Alloy No. 1 is a strongly chilled, sub-eutectical alloy (SC = 0.55), with a hardness of 320 HBW. In the casting structure, small quantities of tiny nodular graphite were found (less than 2%), with interdendritic arrangement type D (ID8 acc. to EN-ISO 945). Alloy No. 2 is an alloy solidifying acc. to the stable equilibrium system, with a hardness of 120 HBW, and with—typical for an eutectic alloy—regularly arranged flake graphite (IA4 acc. to EN-ISO 945 with some features of type B arrangement)—SC = 1.06. Percentage of graphite in the structure was ca. 10%. Alloy No. 3 is a hypereutectical alloy (SC = 1.48), with large amounts of primary graphite areas IC3 (acc. to EN-ISO 945). Total percentage of graphite on the examined polished surfaces was, on average, 18%. Hardness of the casting was 106 HBW.
In alloys Nos. 4 and 5 (EquNi < 16%), partial transformation of austenite to martensite was found, see Figure 2. This was indicated by morphology and hardness of the acicular phase (410–460 HV0.1N). With regard to austenite transformation and partial chilling, sub-eutectic alloy No. 4 (SC = 0.66) was characterised by very high hardness of 450 HBW. Graphite ID7 (acc. to EN-ISO 945) composed ca. 3.5% of its structure. A higher value of SC = 0.98 in the alloy No. 5 indicated a near eutectic composition of the alloy. The created flake graphite IE5 (acc. to EN-ISO 945) composed ca. 11% of the structure. Hardness of the casting was 350 HBW and, due to absence of hard spots, was lower than that of the alloy No. 4.
Alloy No. 6 is a typical eutectic grey cast iron (SC = 0.98), with a pearlitic structure and a hardness of 210 HBW. Percentage of the observed straight flake graphite IA3/4 (acc. to EN-ISO 945) was ca. 12%, see Figure 3.
The alloy No. 7 was a ferritic Armco iron (Figure 3), with a hardness of 90 HBW.
Descriptions of the structures and their hardness values are given in Table 2 [17]. The data indicate that the hardness of the castings strongly depends on the austenite transformation degree in their structures.

3.2. Abrasive-Wear Resistance Tests

Abrasion tests showed a strong influence of the structure and hardness on the abrasive-wear resistance of the castings. This resistance is expressed by an abrasive wear rate coefficient (mg/m). Results are given in Table 2.
The lowest wear rate, indicating the highest abrasive-wear resistance, was shown by the chilled austenitic-martensitic cast iron (alloy No. 4 with the highest hardness). It should be emphasised here that the results obtained for this alloy, as well as for the non-chilled martensitic cast iron No. 5 and chilled austenitic cast iron No. 1, did not differ from each other significantly.
In turn, the highest wear rate, indicating the lowest abrasive-wear resistance, was mostly shown by the alloy No. 7 (with a simple single-phase matrix (Armco iron)), as well as by austenitic alloys Nos. 3 and 2, with low hardness, and containing flake graphite.
After the wear tests, the topography of specimen surfaces was subjected to microscopic observations. A smaller level of differentiation of the material surface topography indicating its uniform wear evidences higher resistance to abrasive wear. The indices determining surface topography were determined using a scanning electron microscope, on gauge lengths of ca. 32 µm. The following was determined: the average height of the highest peak of the profile (RpAVR), the average depth of the lowest recess of the profile (RvAVR), and the average distance between the highest peak and the lowest recess (RzAVR = RpAVR + RvAVR). The results are given in Table 3.
The least differentiated surface topography was found for non-chilled cast iron No. 5 (large portion of martensite in the matrix), chilled cast iron No. 4 (low degree of austenite transformation), and completely chilled austenitic cast iron No. 1. The most differentiated surface topography was found for Armco iron and for austenitic alloys Nos. 2 and 3, containing flake graphite.

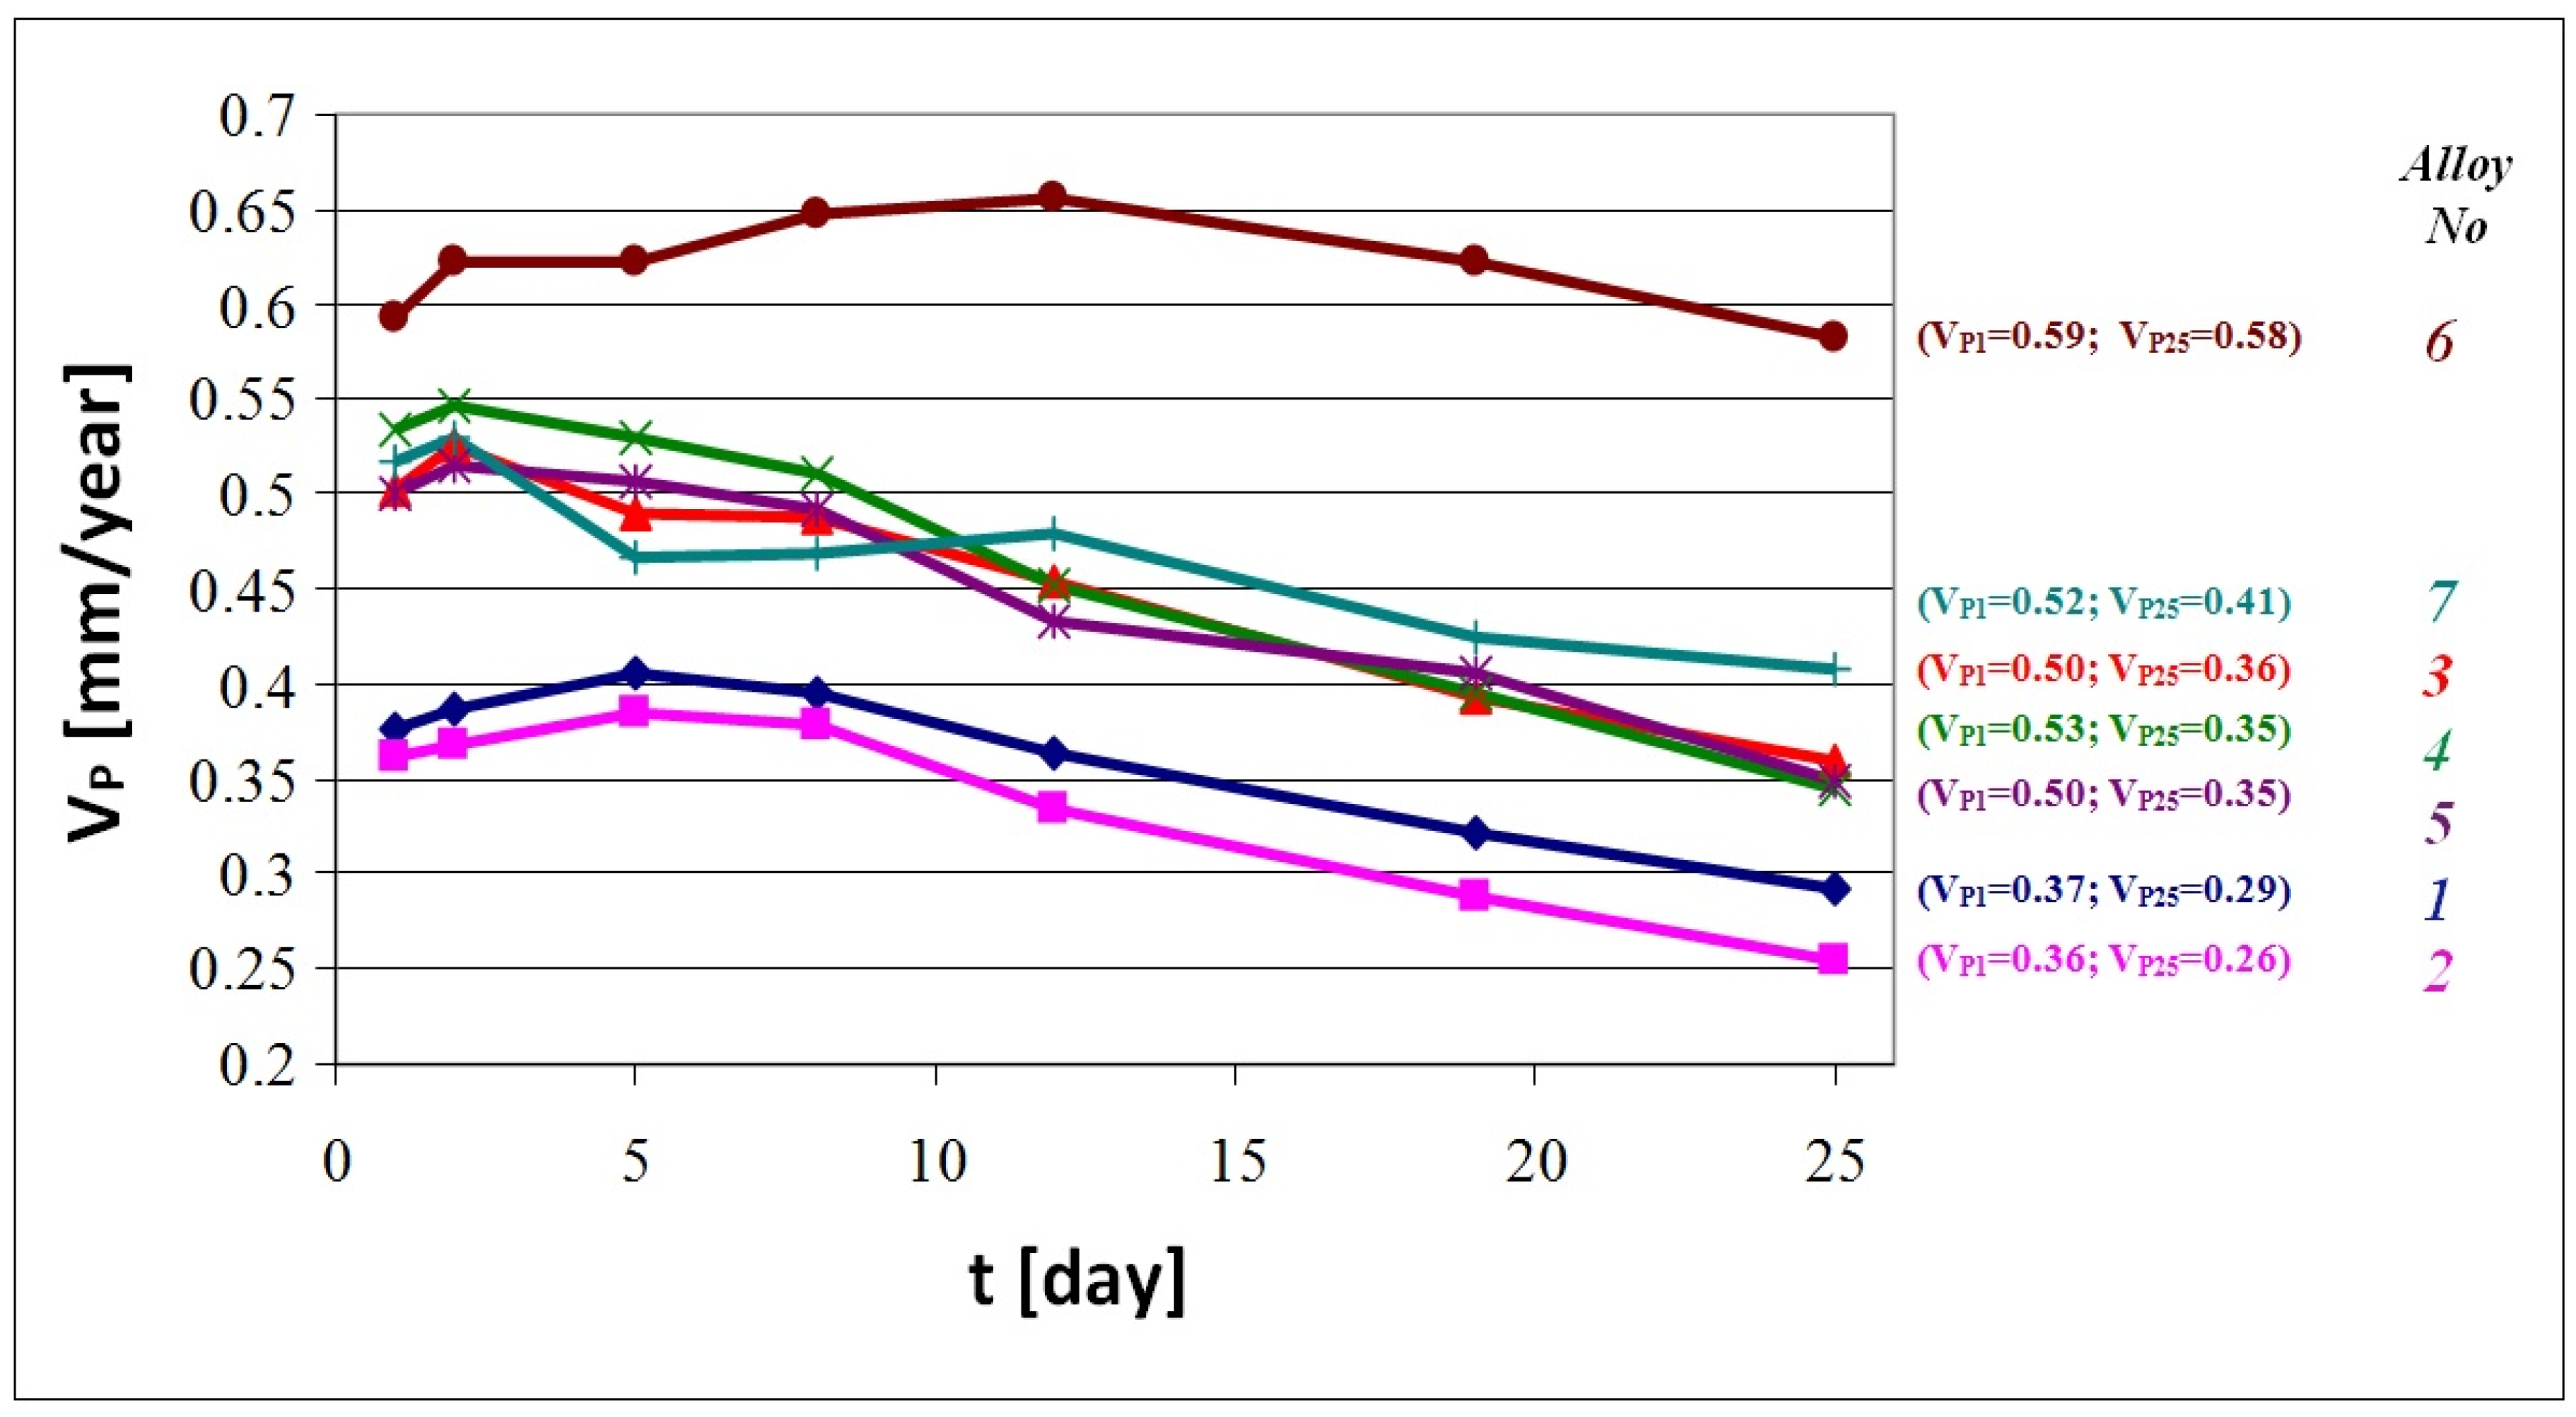
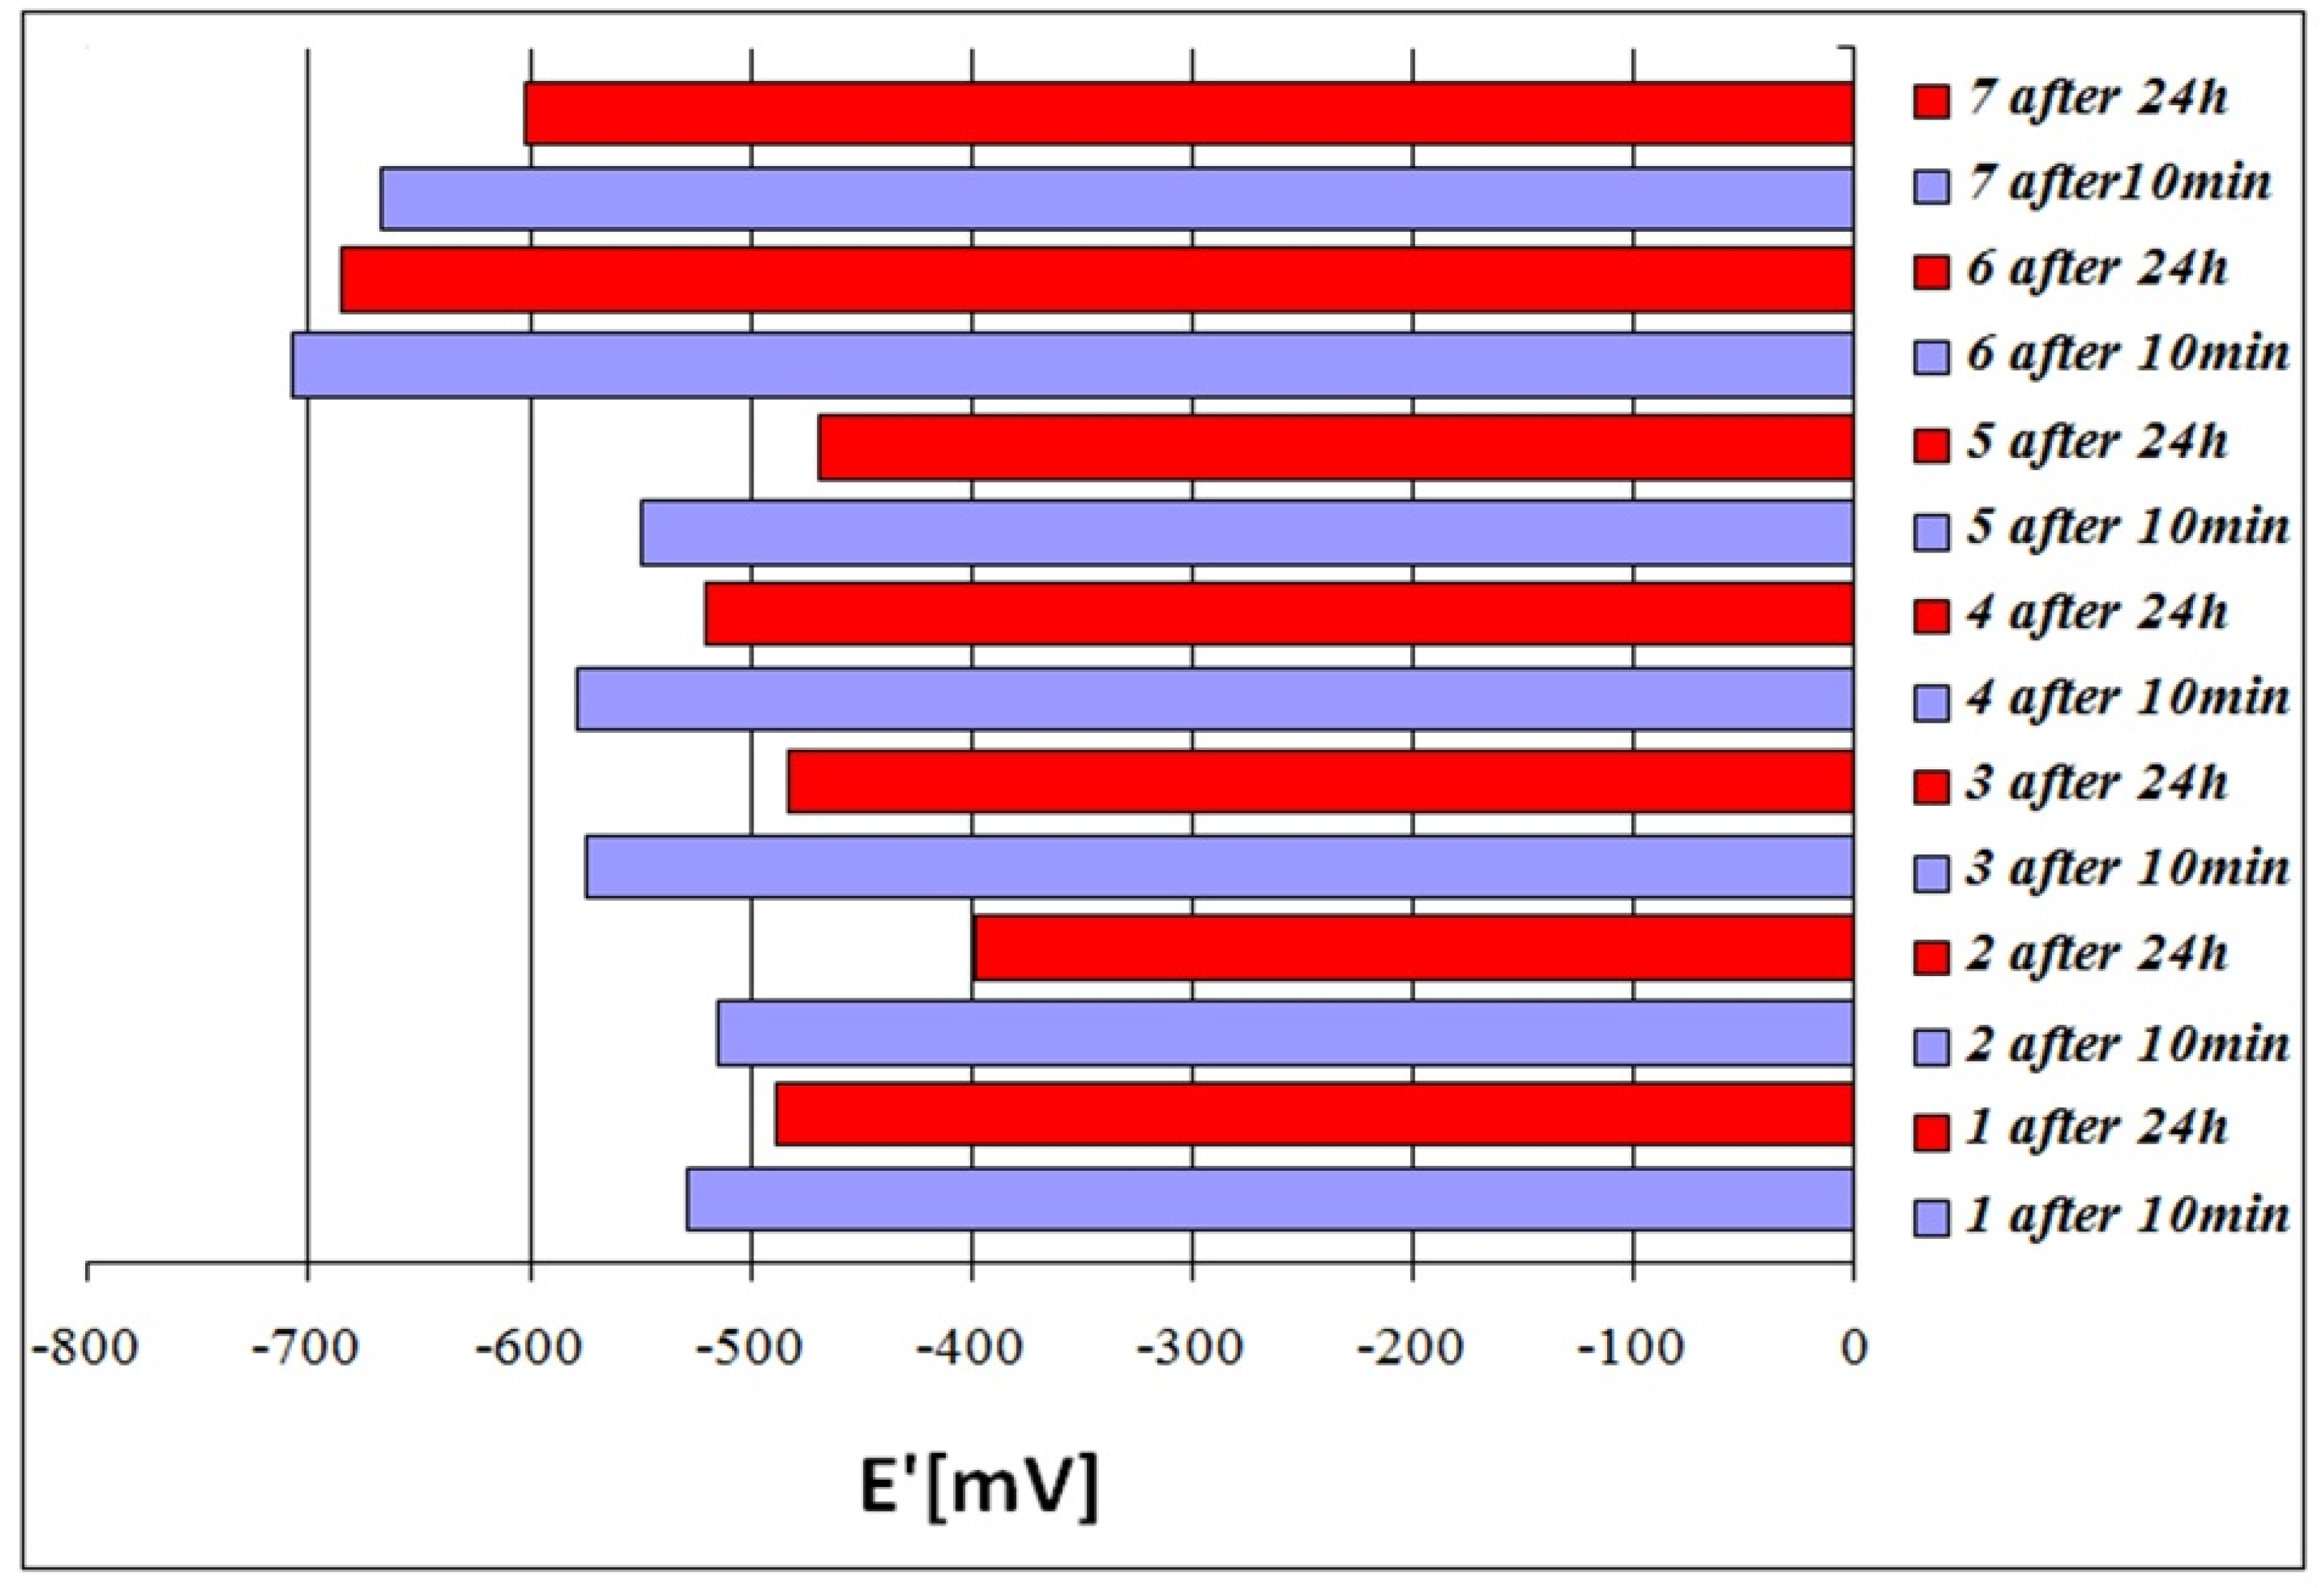
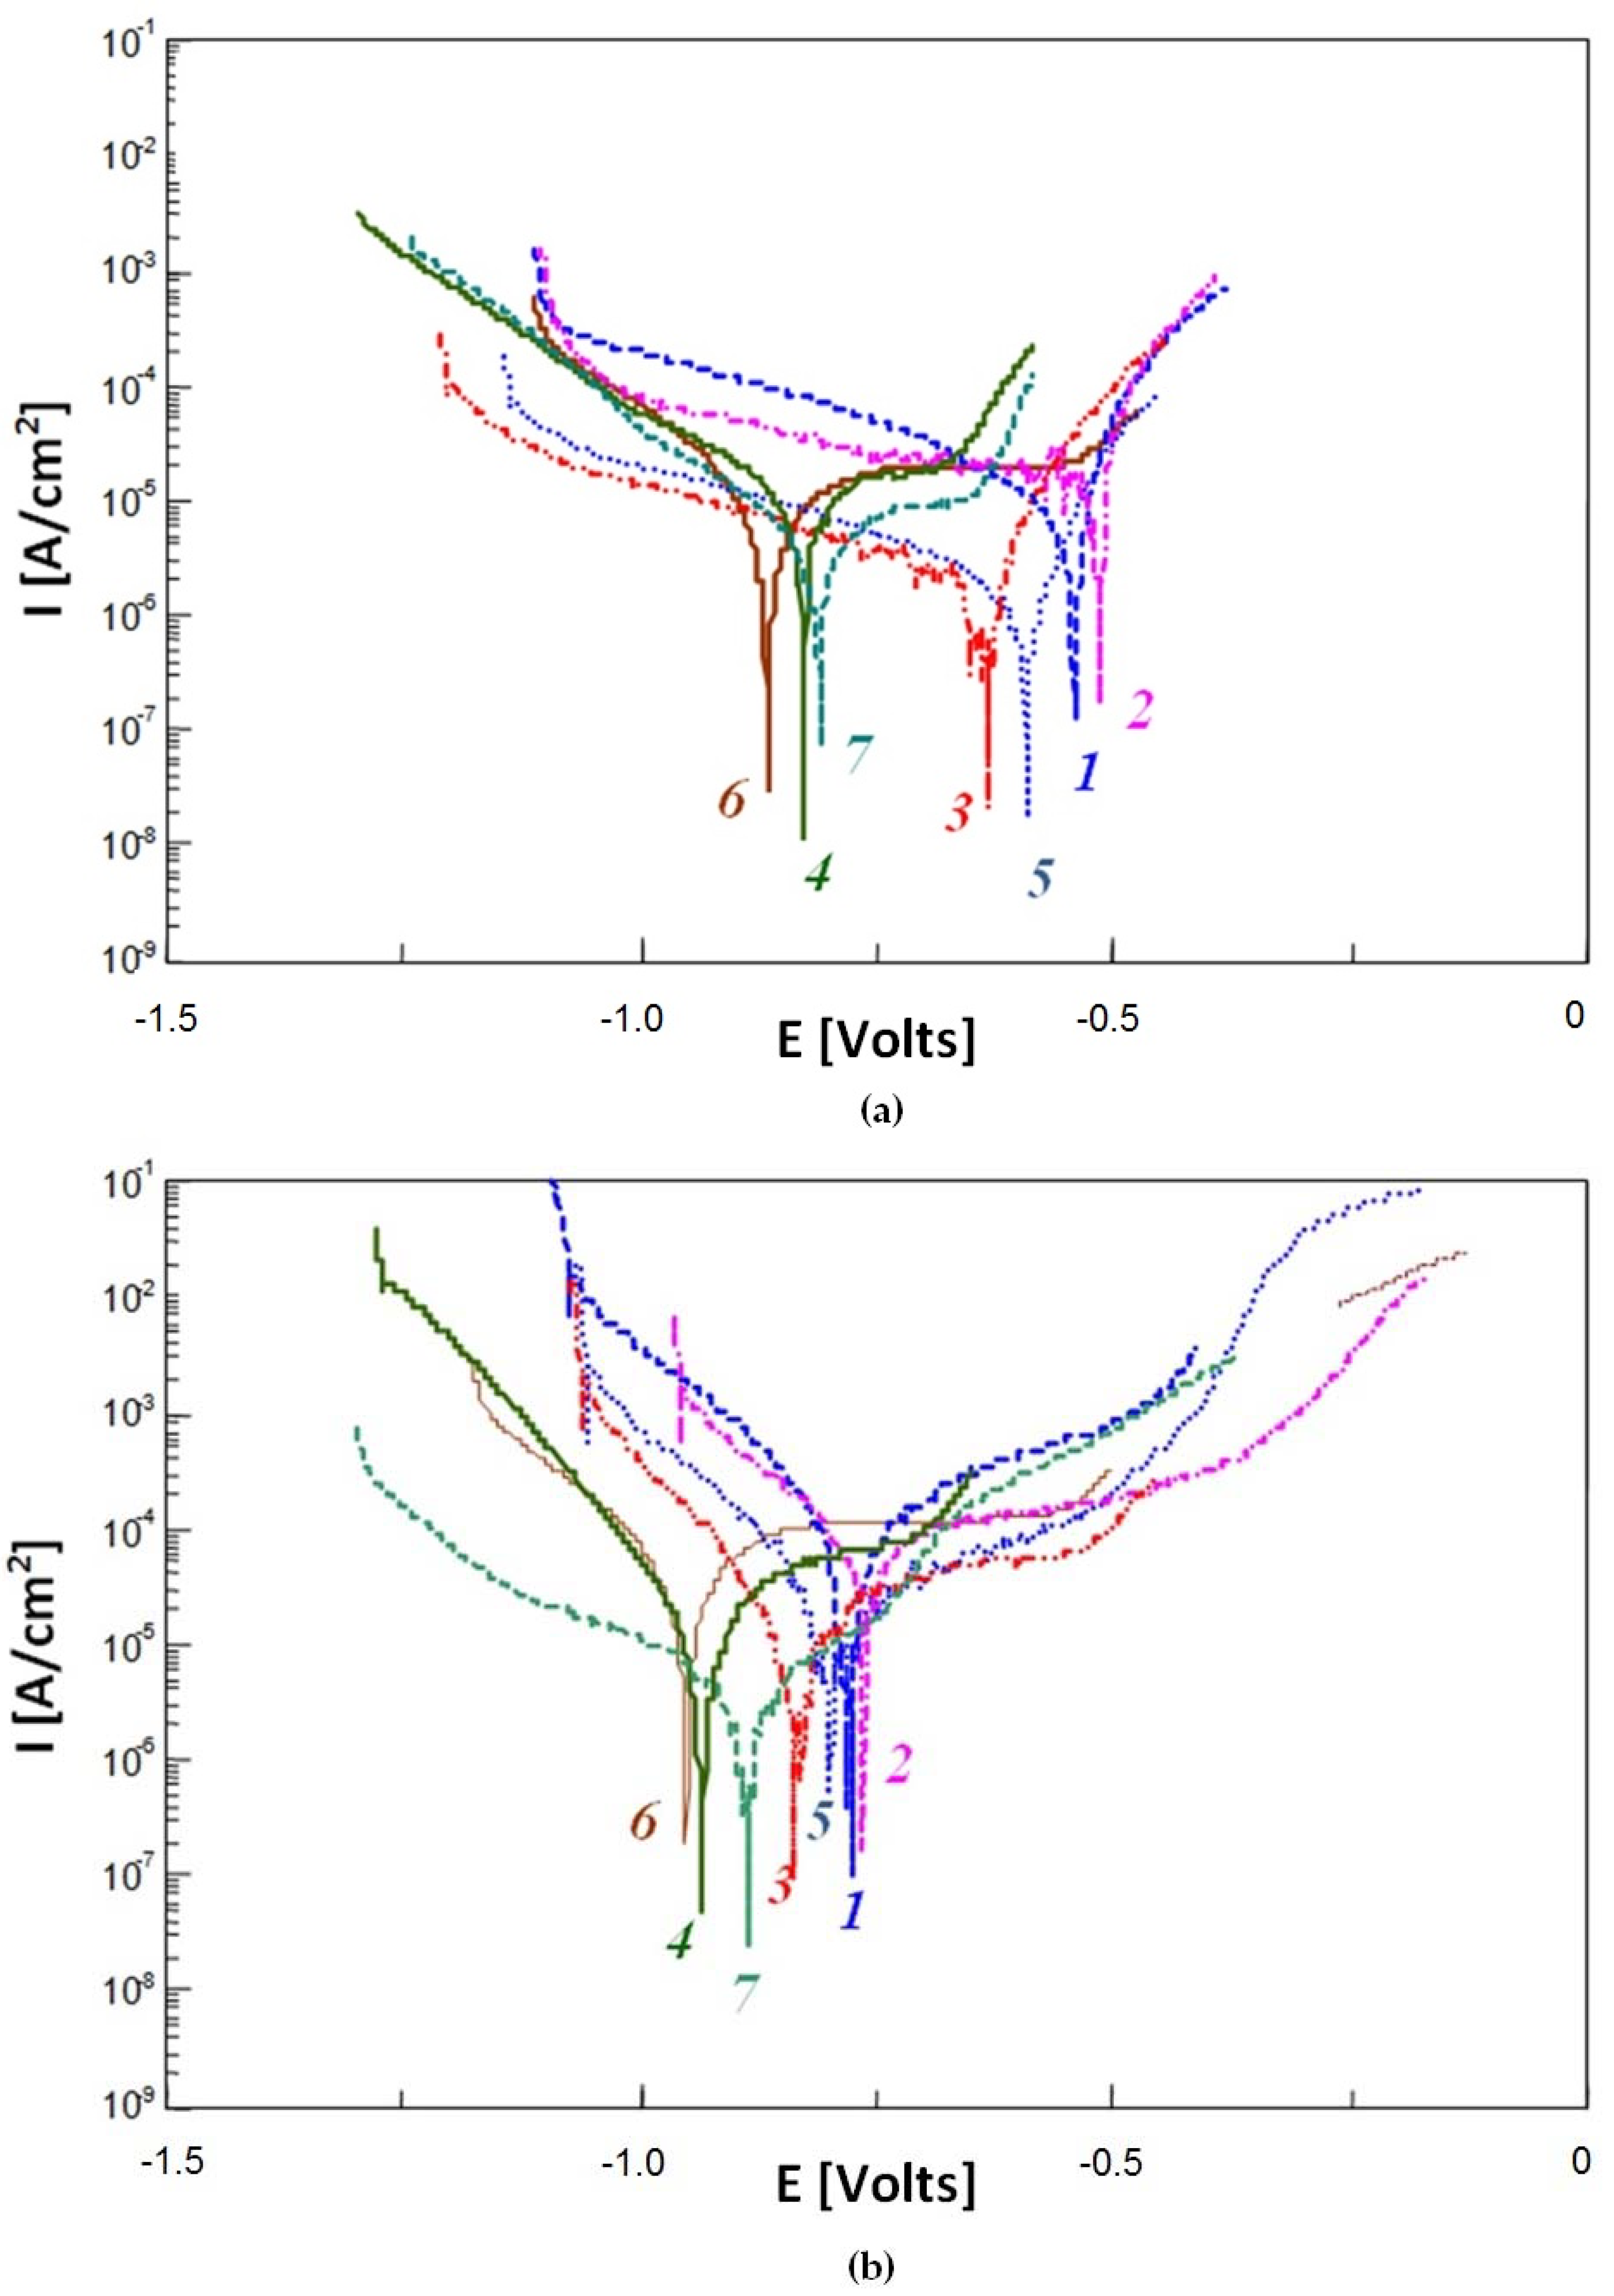
3.3. Corrosion Resistance Tests

In order to obtain reliable results concerning corrosion resistance, two research methods were applied: gravimetric and potentiodynamic.
Gravimetric measurements were carried-out for 25 days. Specimens were weighed (after cleaning) after exposure to a 3% water solution of NaCl for 1, 2, 5, 8, 12, 18 and 25 days. The corrosion rate was determined from the Formula (2). The results are given in Table 4 [17], and illustrated by the diagram in Figure 4.
Gravimetric tests revealed differences between corrosion resistance indices for individual castings. After 1 day of exposure in corrosive solution, corrosion rates ranged between 0.36 and 0.59 mm/year. The smallest value was measured for the alloy No. 2 (austenitic structure), while the largest was measured for alloy No. 6 (cast iron GJL-300). After exposure for 2 days, corrosion rates were higher for all the alloys. After exposure for longer than 2 or 5 days, corrosion rates of all the specimens systematically decreased, which is very favourable from the viewpoint of corrosion resistance. After 25 days of exposure, in most cases, the corrosion rate was ca. 30% lower than the initial value. An exception is the alloy GJL-300, for which the corrosion rate did not change significantly.
The results of potentiodynamic tests confirmed differences of corrosion resistance between individual castings. Polarisation of the specimens was carried-out after 10 min and 24 h of exposure to a 3% aqueous solution of NaCl. The results are given in Table 5.
The largest values of stationary potential E’, indicating increased corrosion resistance, were found for the alloy No. 2 after both 10 min (E’ = −515 mV), and 24 h (E’ = −398 mV); see Table 5, Figure 5. This alloy is the cast iron with a single-phase austenitic matrix, stabilised by the highest total content of Ni and Cr (EquNi = 18.7%). The lowest E’ value was observed for the alloy GJL-300 (E’ = −707 mV after 10 min exposure and E’ = −684 mV after 24 h exposure).
Longer exposure to the corrosive solution resulted in a slight decrease of E’ values of the examined alloys, which is a beneficial phenomenon.
Relatively large differences between values of cathodic-anodic transition potential EK-A (ca. 373 mV between alloys 2 and 4 after exposure for 10 min) indicate a differentiation of electrode processes occurring on the metallic surface, see Table 5 and Figure 6. This is related to the heterogeneous phase composition of the examined alloys.
Longer exposure times resulted in slightly decreased differences between EK-A values for individual alloys.
Values of corrosion current density icorr showed an inversely proportional relationship to the polarisation resistance values Rp, see Table 5. Lower icorr and higher Rp values often indicate increased corrosion resistance. However, differences between values of these two factors were not very large for individual alloys, which indicates their approximate corrosion resistance, see Table 5 and Figure 6. After 10 min, the icorr values ranged between 3.4 and 20.4 μA/cm2, and the Rp values ranged between 1.8 and 7.8 kΩ·cm2. However, after 24-h of exposure, the icorr values ranged between 5.2 and 41.8 μA/cm2, and the Rp values ranged between 1.9 and 2.1 kΩ·cm2. Longer exposure times resulted in slight increase in corrosion current and a decrease in polarisation resistance. An exception was the alloy No. 2, for which the icorr value decreased from 20.4 to 13.1 μA/cm2 and the Rp value increased from 1.3 to 2.0 kΩ·cm2, see Table 5 and Figure 6.
The results of the potentiodynamic examinations do not indicate any significant differences between corrosion resistance for individual alloys. Longer exposure times did not also result in clear changes in their levels of corrosion resistance.
Therefore, additional observations of surface topography of the specimens after potentiodynamic tests, previously exposed for 24 h in the corrosive solution, were performed. The results are given in Table 6. These data showed that a small number of relatively deep pits were found in the alloy with the largest EquNi value. At a lower equivalent value, a larger number of pits with slightly smaller depths was observed. This was probably caused by a less intensive segregation of alloying elements in the matrix. This is beneficial from the viewpoint of corrosion resistance. The largest number of the deepest pits was found in the pearlitic cast iron GJL-300, see Figure 7. In all the alloys, corrosion damages were located mainly next to boundaries of eutectic colonies, and to boundaries of individual phases, see Figure 7.

4. Conclusions

A wide range of chemical compositions of the examined alloys is reflected in distinct differentiation between modes of solidification and the transformations occurring during cooling, and thus, in the properties of the castings. In this respect, the obtained results should have been analysed in two ways. First, from the viewpoint of influence of the eutectic saturation degree SC (quantities and types of high-carbon phases), and second, with respect to the influence of nickel equivalent EquNi (types of matrices).
The highest resistance to abrasive wear was demonstrated by the cast iron with the highest hardness, resulting from a high degree of chilling and from a partial transformation of austenite to martensite. It should be emphasised that partial austenite transformation is more favourable than a high degree of chilling. This makes it possible to avoid significant risk of service cracking in castings.
The results indicate that the change of the modes solidification, from metastable to stable, did not cause significant changes in the corrosion resistance of castings.
The highest corrosion resistance was demonstrated by the non-chilled cast iron Ni-Mn-Cu with simple austenitic matrix, stabilised by high total content of Ni and Cu [17]. The alloys with lower values of nickel equivalent showed lower corrosion resistances. At the same time, the observed pits were found to be slightly less deep and more numerous, which is beneficial from the viewpoint of corrosion resistance; it may be supposed that this was caused by less intensive segregation of alloying elements in the matrix. Moreover, the test results showed that a higher degree of austenite transformation did not result in a significant decrease in corrosion resistance, when the total concentration of nickel and copper in the matrix was relatively high.
Among the examined alloys, the lowest corrosion resistance was demonstrated by pearlitic grey cast iron [17]. On its surface, the largest number of the deepest pits was found.
Therefore, the present research concludes that the mode of solidification (according to stable or metastable equilibrium diagram), and the structure of the cast iron matrixs very significantly influence the abrasive wear resistance of castings. However, corrosion resistance of cast iron is to a much higher extent determined by the total content of elements with high electrochemical potentials, i.e., nickel and copper.

Author Contributions

Daniel Medyński, Andrzej Janus, Bartłomiej Samociuk, Jacek Chęcmanowski performed the experiments; Daniel Medyński, Andrzej Janus, Bartłomiej Samociuk, Jacek Chęcmanowski analyzed the data; Daniel Medyński wrote the paper; Andrzej Janus supervised the work.

Funding

This research received no external funding.

Conflicts of Interest

The authors declare no conflict of interest.

References

  1. Podrzucki, C. Cast Iron: Structure, Properties and Application; T ½; ZG STOP: Kraków, Poland, 1999. [Google Scholar]
  2. Janus, A.; Granat, K. Abrasion Resistant Austenitic-Bainitic Cast Iron; Report of Institute of Machine Engineering and Automation of Wroclaw University of Technology; SPR 28; Institute of Machine Engineering and Automation of Wroclaw University of Technology: Wrocław, Poland, 2005. [Google Scholar]
  3. Stachowiak, G.B.; Stachowiak, G.W.; Celliers, O. Ball-cratering abrasion tests of high-Cr white cast irons. Tribol. Int. 2005, 5, 1076–1087. [Google Scholar] [CrossRef]
  4. Venkatesha, B.; Srikera, K.; Prabhakar, V.S.V. Wear characteristics of hardfacing alloys: State-of-the-art. Procedia Mater. Sci. 2015, 15, 527–532. [Google Scholar] [CrossRef]
  5. Medyński, D.; Janus, A. Effect of austenite transformation on abrasive wear and corrosion resistance of spheroidal Ni-Mn-Cu cast iron. Arch. Foundry Eng. 2016, 16, 63–66. [Google Scholar] [CrossRef]
  6. Gawlik, J.; Schmidt, J.; Nowak, T.; Wójcicki, Z. Nitrogen as an alloying element improving material properties of the high carbon cast steel for ball mill liner plates. Arch. Civ. Mech. Eng. 2017, 14, 926–934. [Google Scholar] [CrossRef]
  7. Medyński, D.; Janus, A.; Zaborski, S. Effect of heat-treatment parameters of cast iron GJS-X350NiMnCu7-3-2 on its structure and mechanical properties. Arch. Foundry Eng. 2017, 17, 121–126. [Google Scholar] [CrossRef]
  8. Mond Nickel Company. Ni-Resist Austenitic Cast Iron: Properties and Applications; Mond Nickel Company: London, UK, 1662. [Google Scholar]
  9. Szpunar, E. The influence of copper on the structure of the austenitic ductile iron Ni-Mn-Cu. Proc. Inst. Precis. Mech. 1967, 1, 12–25. [Google Scholar]
  10. Seyedi, S.; Rikhtegar, R. Reducing the nickel content by using manganese in austenitic ductile iron. J. Iran. Fundryment Soc. 1994, 14, 122–136. [Google Scholar]
  11. Lacaze, J. Discussion of The role of manganese and copper in the eutectoid transformation of spheroidal graphite cast iron. Metall. Mater. Trans. A 2001, 32, 2133–2135. [Google Scholar] [CrossRef]
  12. Ahmabadabi, M.N.; Shamloo, R. Control of austenitic transformations in ductile iron aided by calculation of Fe-C-Si-X phase boundaries. J. Phase Equilib. 2001, 22, 1994–1998. [Google Scholar]
  13. Pietrowski, S.; Bajerski, Z. Ni-Resist cast iron with reduced nickel content. Arch. Foundry 2005, 5, 445–458. [Google Scholar]
  14. Janus, A.; Kurzawa, A. Effect of nickel equivalent on austenite transition ratio in Ni-Mn-Cu cast iron. Arch. Foundry Eng. 2013, 13, 53–58. [Google Scholar] [CrossRef]
  15. Janus, A.; Stachowicz, M. Thermodynamic stability of austenitic Ni-Mn-Cu cast iron. Metalurgija 2014, 53, 353–356. [Google Scholar]
  16. Medyński, D.; Janus, A. Effect of nickel equivalent on structure and corrosion resistance of nodular cast iron Ni-Mn-Cu. Arch. Foundry Eng. 2015, 15, 69–74. [Google Scholar]
  17. Medyński, D.; Janus, A. Effect of Chemical composition on structure and corrosion resistance of Ni-Mn-Cu cast iron. Arch. Foundry Eng. 2016, 16, 59–62. [Google Scholar] [CrossRef]
  18. National Research Institute in Radom. Operation and Maintenance Documentation of Test Stand T-07; Department of Tribology: Radom, Poland, 1991. [Google Scholar]
  19. Bala, H. Corrosion of Materials—Theory and Practice; Editorial Office of Process Engineering. Materials and Applied Physics of Czestochowa University of Technology: Czestochowa, Poland, 2002. [Google Scholar]
  20. Hryniewicz, T. Electrochemistry for Surface Engineering; Editorial Office of Koszalin University of Technology: Koszalin, Poland, 2005. [Google Scholar]
  21. Hryniewicz, T.; Rokosz, K. Theoretical Basis and Practical Aspects of Corrosion; Editorial Office of Koszalin University of Technology: Koszalin, Poland, 2010. [Google Scholar]
  22. Rączka, J.S.; Tabor, A.; Kowalski, A. Resistance of austenitic-bainitic nodular cast iron to corrosive action of sulphuric, nitric and hydrochloric acids. Solidif. Metals Alloys 2000, 2, 527–535. [Google Scholar]
  23. Cheng-Hsun, H.; Ming-Li, C. Corrosion behavior of nickel alloyed and austempered ductile iron in 3.5% sodium chloride. Corros. Sci. 2010, 52, 2945–2949. [Google Scholar]
  24. Chung-Kwei, L.; Cheng-Hsun, H.; Yin-Hwa, C.; Keng-Liang, O.; Sheng-Long, L. A study on the corrosion and erosion behavior of electroless nickel and TiAlN/ZrN duplex coatings on ductile iron. Appl. Surf. Sci. 2015, 324, 13–19. [Google Scholar]
Figure 1. Austenitic cast iron Ni-Mn-Cu: (a) No. 1—trace amounts of nodular graphite ID8; (b) No. 2—flake straight graphite (IA4) with some features indicating type B arrangement; (c) No. 3—primary graphite IC3; (d) No. 1—subeutectic, chilled structure (EquNi = 19.4%, SC = 0.55); (e) No. 2—eutectic with flake graphite (EquNi = 18.7%, SC = 1.06); (f) No. 3—hypereutectic (EquNi = 17.1%, SC = 1.48); (ac) unetched; (ce) etched with Mi1Fe.
Metals 08 00341 g001
Figure 2. Cast iron Ni-Mn-Cu: (a) No. 4—subeutectic with a small number of interdendritically arranged colonies of ID7 graphite; (b) No. 4—chilled after partial austenite-martensite transition (EquNi = 13.6%, SC = 0.66); (c) No. 5—graphite colonies characteristic for eutectic alloy IA5 with graphite features indicating interdendritic arrangement type E; (d) No. 5—martensite after the transformation (EquNi = 11.6%, SC = 0.98). (a,c) unetched; (b,d) etched with Mi1Fe.
Metals 08 00341 g002
Figure 3. Alloys: (a) No. 6 cast iron GJL-300—eutectic colonies of IA3/4 graphite; (b) No. 6 cast iron GJL-300—pearlitic matrix, straight graphite IA3/4 (SC = 0.98) and (c) No 7—ferritic structure of Armco iron; (a) unetched; (b,c) etched with Mi1Fe.
Metals 08 00341 g003
Figure 4. Average corrosion rate (VP) (mm/year) of the alloys 1 to 7 in time: VP1—corrosion rate after 1 day, VP25—corrosion rate after 25 days.
Metals 08 00341 g004
Figure 5. Corrosive potential (E’) of alloys 1 to 7 after 10 min and 24 h of exposure to a 3% aqueous solution of NaCl.
Metals 08 00341 g005
Figure 6. Polarisation curve for the alloys from 1 to 7 after: (a) 10 min and (b) 24 h of exposure in 3% aqueous solution of NaCl.
Metals 08 00341 g006
Figure 7. Face surfaces (ac) and cross-sections (df) of specimens of the alloys No. 2 (a,d), 5 (b,e) and 6 (c,f) after potentiodynamic tests, exposed previously for 24 h in 3% solution of NaCl.
Metals 08 00341 g007
Table 1. Chemical compositions, nickel equivalent EquNi and eutectic saturation ratio SC [17].
Alloy No.Chemical Composition (wt %)EquNi (wt %)SC (/)
CSiNiMnCuPS
11.72.39.13.80.10.140.0319.40.55
23.01.79.82.05.20.150.0418.71.06
34.62.25.83.32.60.160.0417.11.48
42.12.34.82.81.60.150.0313.60.66
52.82.37.80.43.00.150.0311.60.98
63.52.0-0.4-0.160.042.40.98
7 *0.01-0.030.060.030.010.010.20.00
7 *—Armco iron.
Table 2. Effect of nickel equivalent EquNi and eutectic saturation degree SC on structure composition, Brinell hardness and abrasive wear rate of castings.
Alloy No.EquNi (wt %)Matrix Components Feα–Fem–Feγ–P * (%–%–%–%)SC (/)High-Carbon Phases %Cgraph–%Fe3C *HBW (/)Wear Rate (mg/m)
119.40–0–100–00.55nodular ID8 < 2%–Fe3C > 98%3200.66
218.70–0–100–01.06100% IA4 with features indicating arrangement type B1200.72
317.10–0–100–01.48100% IC31060.74
413.60–20–80–00.66ca. 3.5% ID7–ca. 96.5% Fe3C4500.63
511.60–60–40–00.98100% IA5 with features indicating arrangement type E3500.68
62.40–0–0–1000.98100% IA3/42100.70
7-0–0–100–0--900.78
* Feα—ferrite; Fem—martensite; Feγ—austenite; P—pearlite; Cgraph—graphite; Fe3C—cementite.
Table 3. Indices determining surface topography after abrasive-wear tests.
Alloy No.EquNi (wt %)Index of Surface Topography (μm)
RpAVR /±0.2/RvAVR /±0.2/RzAVR /±0.2/
119.45.0913.8618.95
218.77.0520.1527.20
317.17.2120.0327.24
413.65.0313.5418.57
511.65.1512.0818.30
62.45.0813.6218.70
7-7.4521.5529.00
Table 4. Corrosion rate VP after exposure of specimens in 3% solution of NaCl.
Alloy No.VP (mm/year) after Exposure for Specified Time (Days)
1258121825
10.370.390.410.400.370.330.29
20.360.370.380.370.340.290.26
30.520.530.490.490.450.390.36
40.530.550.530.510.450.390.35
50.500.520.500.490.430.390.35
60.590.630.630.650.660.630.58
70.520.530.460.470.480.430.41
Table 5. Electrochemical indices characterising corrosion processes.
Alloy No.E′ (mV)EK-A (mV)icorr (μA/cm2)Rp (kΩ·cm2)
10 min24 h10 min24 h10 min24 h10 min24 h
1−529−488−557−78814.741.81.80.6
2−515−398−525−77420.413.11.32.0
3−574−483−599−8414.19.46.32.8
4−578−520−842−93311.512.22.02.0
5−550−470−593−7993.413.37.82.0
6−707−684−865−9454.012.56.52.1
7−667−602−830−8844.15.26.35.1
Table 6. Indices describing surface topography of specimens after potentiodynamic tests (after 24-h exposure in 3% aqueous solution of NaCl).
Alloy No.EquNi (wt %)Surface Topography Index (μm)
RpAVR (±0.2)RvAVR (±0.2)RzAVR (±0.2)
119.412.2539.9452.19
218.712.4440.0152.45
317.112.0536.1048.15
413.611.9736.5448.51
511.612.1438.0950.23
62.412.8944.0356.92
7-11.0832.1743.25

