Article

Microstructure and Mechanical Characterization of a Dissimilar Friction-Stir-Welded CuCrZr/CuNiCrSi Butt Joint

1
State Key Laboratory of High Performance Complex Manufacturing, Central South University, Changsha 410083, China
2
Light Alloy Research Institute, Central South University, Changsha 410083, China
*
Author to whom correspondence should be addressed.
Metals 2018, 8(5), 325; https://doi.org/10.3390/met8050325
Submission received: 11 April 2018 / Revised: 4 May 2018 / Accepted: 5 May 2018 / Published: 8 May 2018
(This article belongs to the Special Issue Dissimilar Metal Welding)

Abstract

:
Dissimilar CuNiCrSi and CuCrZr butt joints were successfully frictionstirwelded at constant welding speed of 150 mm/min and rotational speed of 1400 rpm with the CuCrZr alloy or the CuNiCrSi alloy located on the advancing side (AS). The microstructure and mechanical properties of joints were investigated. When the CuCrZr alloy was located on the AS, the area of retreating material in the nugget zone was a little bigger. The Cr solute-rich particles were found in the nugget zone on CuCrZr side (CuCrZr-NZ) while a larger density of solute-rich particles identified as the concentration of Cr and Si element was found in the nugget zone on CuNiCrSi side (CuNiCrSi-NZ). The Cr precipitates and δ-Ni2Si precipitates were found in the base metal on CuNiCrSi side (CuNiCrSi-BM) but only Cr precipitates can be observed in the base metal on CuCrZr side (CuCrZr-BM). Precipitates were totally dissolved into Cu matrix in both CuCrZr-NZ and CuNiCrSi-NZ, which led to a sharp decrease in both micro-hardness and tensile strength from BM to NZ. When the CuNiCrSi was located on the AS, the tensile testing results showed the fracture occurred at the CuCrZr-NZ, while the fracture was found at the mixed zone of CuNiCrSi-NZ and CuCrZr-NZ for the other case.

1. Introduction

Copper alloys are widely used in industries for its high electrical conductivities. However, the strength of conventional copper alloys is usually limited in contrast with its high electrical conductivity [1]. CuCrZr and CuNiCrSi are excellent and unique copper alloys, which possess a desirable combination of high strength and good electrical conductivities after solution treatment and aging process. The ultimate tensile strength (UTS) and electrical conductivity of CuCrZr alloy can reach to more than 530 MPa and 80% IACS [1]. In comparison, the CuNiCrSi alloy shows a higher ultimate tensile strength of 600–800 MPa but a lower electrical conductivity of about 45% IACS due to different additions [2]. The dissimilar joints of CuCrZr and CuNiCrSi alloy with good balance of strength and electrical conductivity can be widely applied to many industries, such as large generator rotor and international thermo nuclear experiment reactor (ITER) components [3,4].
Owing to the impacts of oxygen and impurity, copper alloys are usually hard to be welded by conventional fusion welding techniques, such as the arc welding and the electrical beam welding. Zhang et al. [5] reported that the welding speed should be very slow in order to combat the high thermal diffusivity during the arc welding of copper joints, which contributed to the coarse microstructure in the heat affected zone (HAZ) and limited mechanical properties of joints. Kanigalpula et al. [6] reported that the mechanical properties of CuCrZr joints were limited by interdendritic micro-cracks and voids formed in the fusion zone during the electrical beam welding process. In contrast, friction stir welding (FSW), as a solid-state joining process, can overcome these metallurgical difficulties of conventional fusion welding [7]. Amarnath et al. [8] made a comparative study of gas tungsten art welding (GTAW) process and FSW process on electrolytic tough pitch (ETP) copper. They found that the mechanical property of FSW joints was superior to that of GTAW joints due to the generation of fine equiaxed grains. Jau-wen et al. [9] carried out a comparative study of tungsten inert gas welding (TIG) process and FSW process on pure copper. The result revealed that the mechanical property of FSW joints was better than that of TIG joints.
In recent years, substantial studies have been conducted on the microstructure and mechanical properties of friction-stir-welded copper joints. Mironov et al. [10] studied the relationship between microstructure evolutions and the rotational speeds ranging from 200 rpm to 1000 rpm in friction-stir-welded pure copper joints. The grain structure development was found to be predominantly controlled by continuous recrystallization in the welds produced at welding speeds of 200–500 mm/min, and fine-grained (1–2 µm) microstructure was obtained in the stir zone. Heidarzadeh et al. [11] found that the UTS of pure copper joints firstly increased up to maximum value (about 260 MPa) with the increasing of tool rotational speed, welding speed and tool axial force, and then decreased until the finish of the FSW process. Liu et al. [12] studied the effects of the tool rotational speeds (300, 400, 600, 800 and 1000 rpm) on microstructure and mechanical properties of friction-stir-welded copper joints. They observed that the grain size and the UTS were significantly affected by the tool rotational speeds. When the rotational speeds increased from 300 to 1000 rpm, the grain size increased while the UTS firstly increased to the maximum (277 MPa) and then decreased. Shen et al. [13] investigated the microstructure and mechanical properties of friction-stir-welded copper joints under different welding speeds (25, 50, 100, 150 and 200 mm/min). They found that defect-free joints were obtained at lower welding speeds and the maximum value of UTS of welded joints was 275 MPa. In order to improve the strength of copper joints, Xue et al. [14] used flowing water as additional rapid cooling method to lower peak temperature during the process of FSW. The joints using this method kept the microstructure with a high dislocation density so that the UTS of joints could reach to 340 Mpa, which was nearly equal to the strength of base metal.
Compared with substantial study on FSW of conventional copper joints, the reports on FSW of copper joints with high strength and good electrical conductivity were rather scarce. Sahlot et al. [15] studied the wear of the tool using in the FSW of CuCrZr, but he didn’t discuss the characteristics of the joints. Jha et al. [16] and Lai et al. [17] investigated the characteristics of the CuCrZr joints welded by FSW. They both found that the properties of joints were primarily depended on Nano-precipitates. To the best of authors’ knowledge, there have been no studies on microstructure and mechanical properties of the dissimilar CuCrZr and CuNiCrSi joints fabricated by FSW. Therefore, the present study mainly investigated the microstructure evolution and mechanical properties of dissimilar CuCrZr and CuNiCrSi joint. In particular, the relationship between microstructure and mechanical properties was studied as well.

2. Materials and Methods

In this study, the dimensions of CuCrZr and CuNiCrSi plates are 300 mm × 100 mm × 3 mm. The CuCrZr alloy was subjected to solution (920 °C for 0.5 h) and aged (440 °C for 2 h) treatments. The CuNiCrSi alloy was also treated through solution (800 °C for 2 h) and aged (450 °C for 5 h) process. The chemical compositions of these two alloys are listed in Table 1.

2.1. Friction Stir Welding Process

Dissimilar CuCrZr and CuNiCrSi joints were friction stir welded by a tool at constant welding speed of 150 mm/min and constant rotation speed of 1400 rpm. The position-related microstructure and mechanical properties were also taken into consideration. The FSW tool had a concave shoulder 10 mm in diameter and a conical pin 2.8 mm in length, the pin with 4.5 mm in the top diameter and 3.5 mm in the bottom diameter was machined from H13 steel. The tool rotated in the clock wise direction with a fixed tool tilt angle of 2.5°. The plunging depth and plunging speed of the pin were selected as 0.1 mm and 0.05 mm/s. The laboratory equipment, experimental setup, schematic presentation of friction stir welding process and dimensions of FSW tool are shown in Figure 1.
After the welding, these joints were cut into strips perpendicularly to the welding line. Specimens for metallographic observation and mechanical testing were made from these strips.

2.2. Microstructural Characterization

Specimens for microstructure analysis were etched in a solution of 40 mL H2O, 10 mL HCl and 2 g Fe3Cl after standard polishing process. The microstructure of different regions including the base metal on CuCrZr side (CuCrZr-BM), the nugget zone on CuCrZr side (CuCrZr-NZ), the base metal on CuNiCrSi side (CuNiCrSi-BM) and the nugget zone on CuNiCrSi side (CuNiCrSi-NZ) was observed on a confocal laser scanning microscope (CLSM) and a VHX-5000 3D microscope. To further study the microstructure of the nugget zone, a scanning electron microscope (SEM) was used. The SEM specimens were slightly etched to clarify CuCrZr-NZ and CuNiCrSi-NZ in the microscope. A transmission electron microscopy (TEM, Tecnai G2 F20) was also applied to analysis samples from CuCrZr-BM, CuCrZr-NZ, CuNiCrSi-BM and CuNiCrSi-NZ.

2.3. Mechanical Testing

Tensile tests were conducted on a universal electronic tensile testing machine (MTS Systems Corporation, Eden Prairie, MN, USA) with a testing speed of 2 mm/min. The tensile testing specimens have a gauge length of 150 mm and a width of 25 mm. Three tensile testing specimens were taken to repeat the experiments. The Vickers hardness was measured using a Vickers hardness machine (Huayin Testing Instrument Co., Ltd., Yantai, China) with a load of 100 g and a dwell time of 10 s. The measurement was carried out along the centerline and the distance between neighboring measured points was 0.5 mm.

3. Results

3.1. Microstructure of Dissimilar CuCrZr/CuNiCrSi Butt Joints

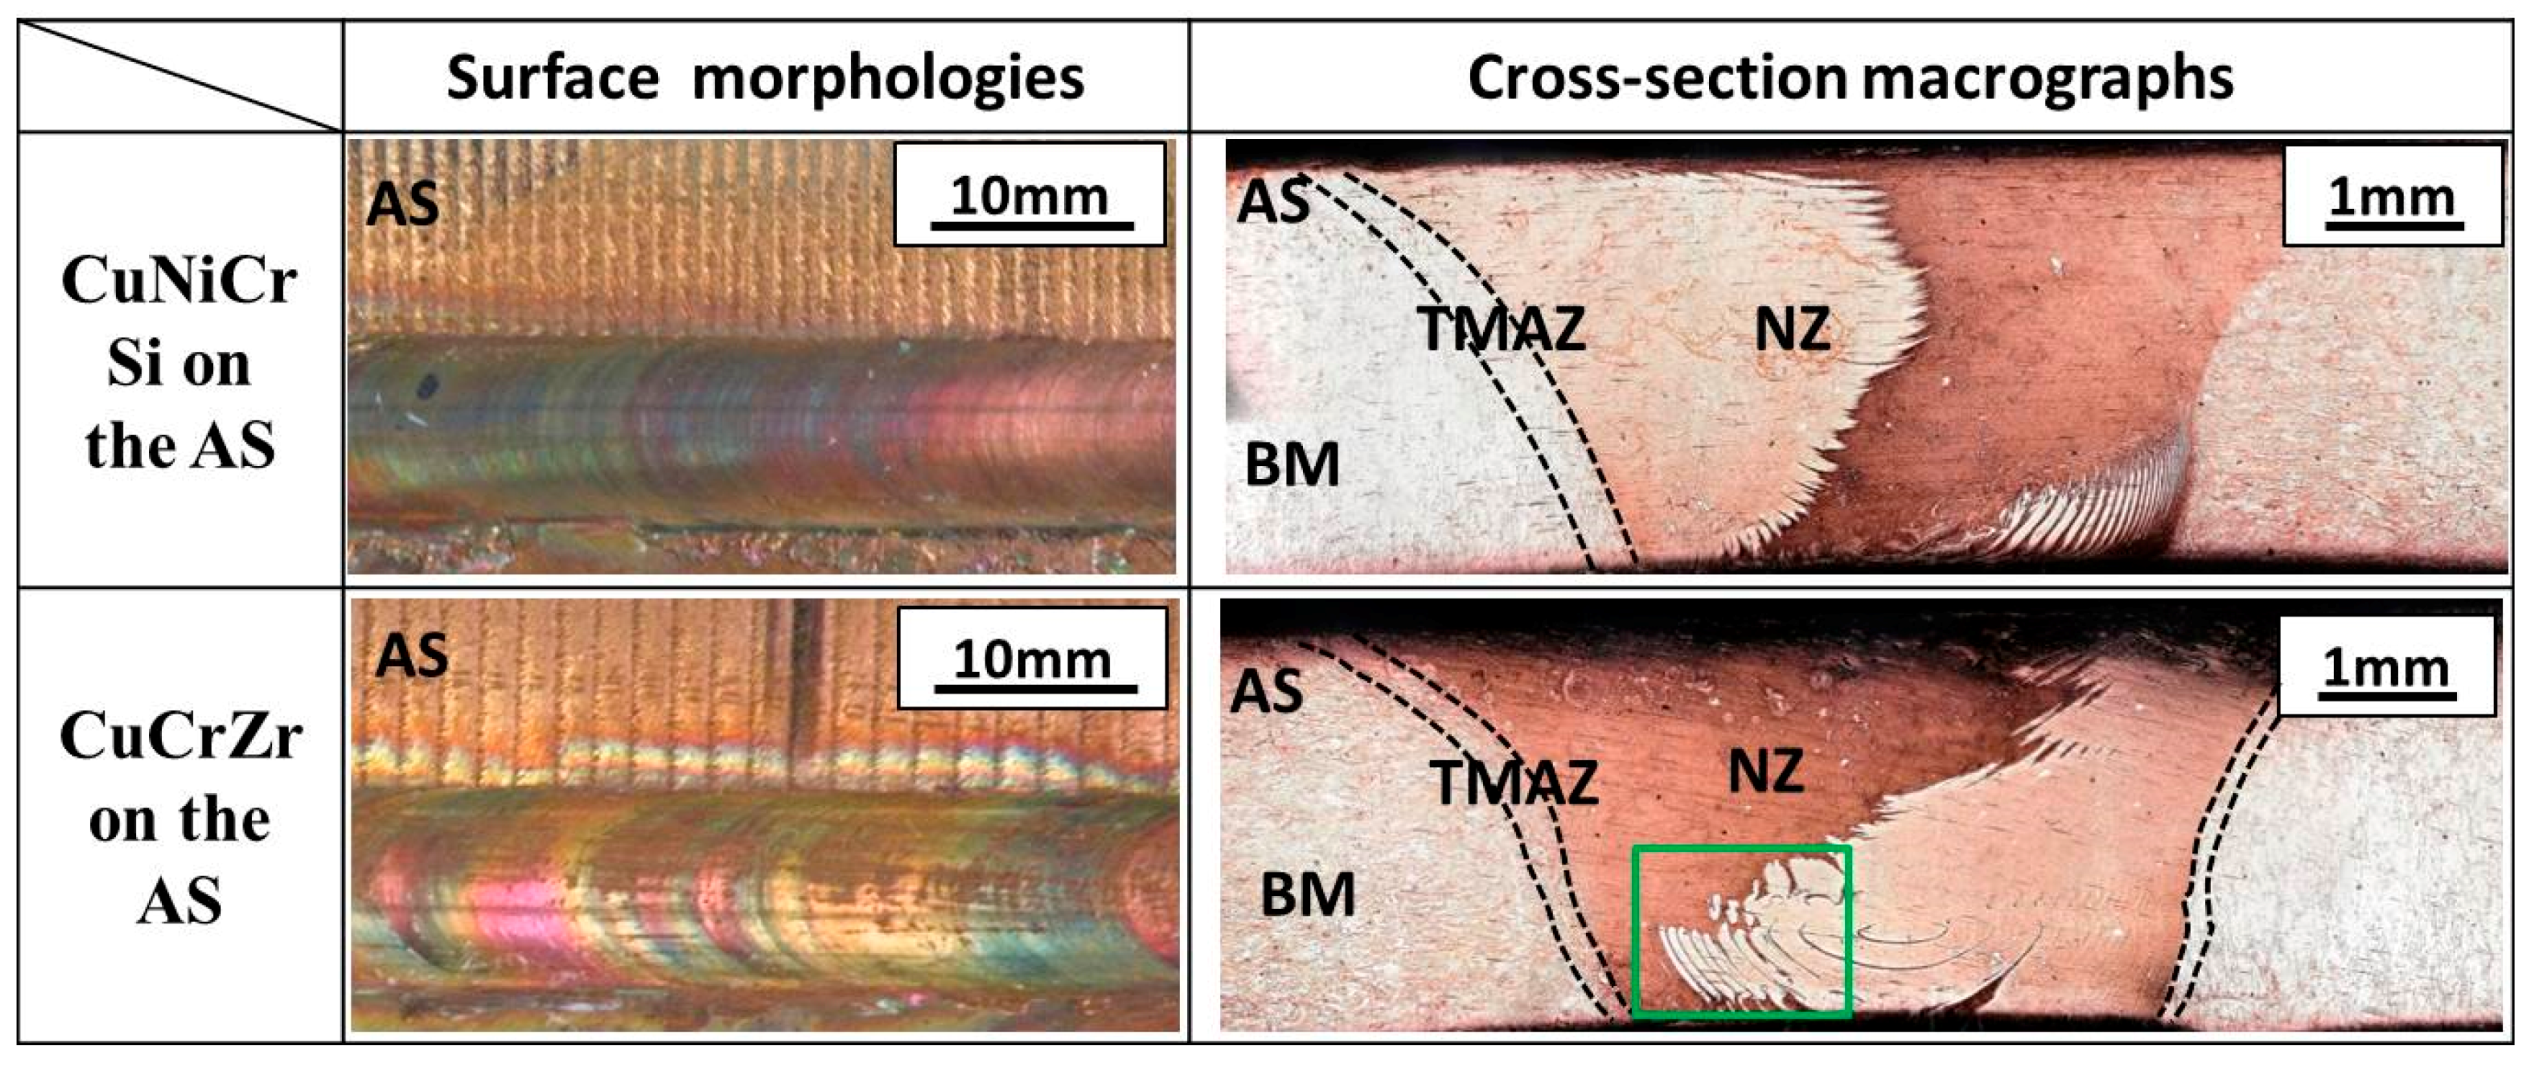
Figure 2 shows surface morphologies and cross-section macrographs of dissimilar CuCrZr/CuNiCrSi butt joints with the CuCrZr alloy located on the advancing side (AS) or the retreating side (RS), respectively. No defects were found on both the surface morphologies and the cross-section macrographs. From cross-section macrographs, it can be found that the area of retreating materials in the nugget zone (NZ) is a little bigger when the CuCrZr alloy is placed on the AS. Three distinct regions, the base metal (BM), the NZ, the thermo-mechanically affected zone (TMAZ), can be identified from macrographs.
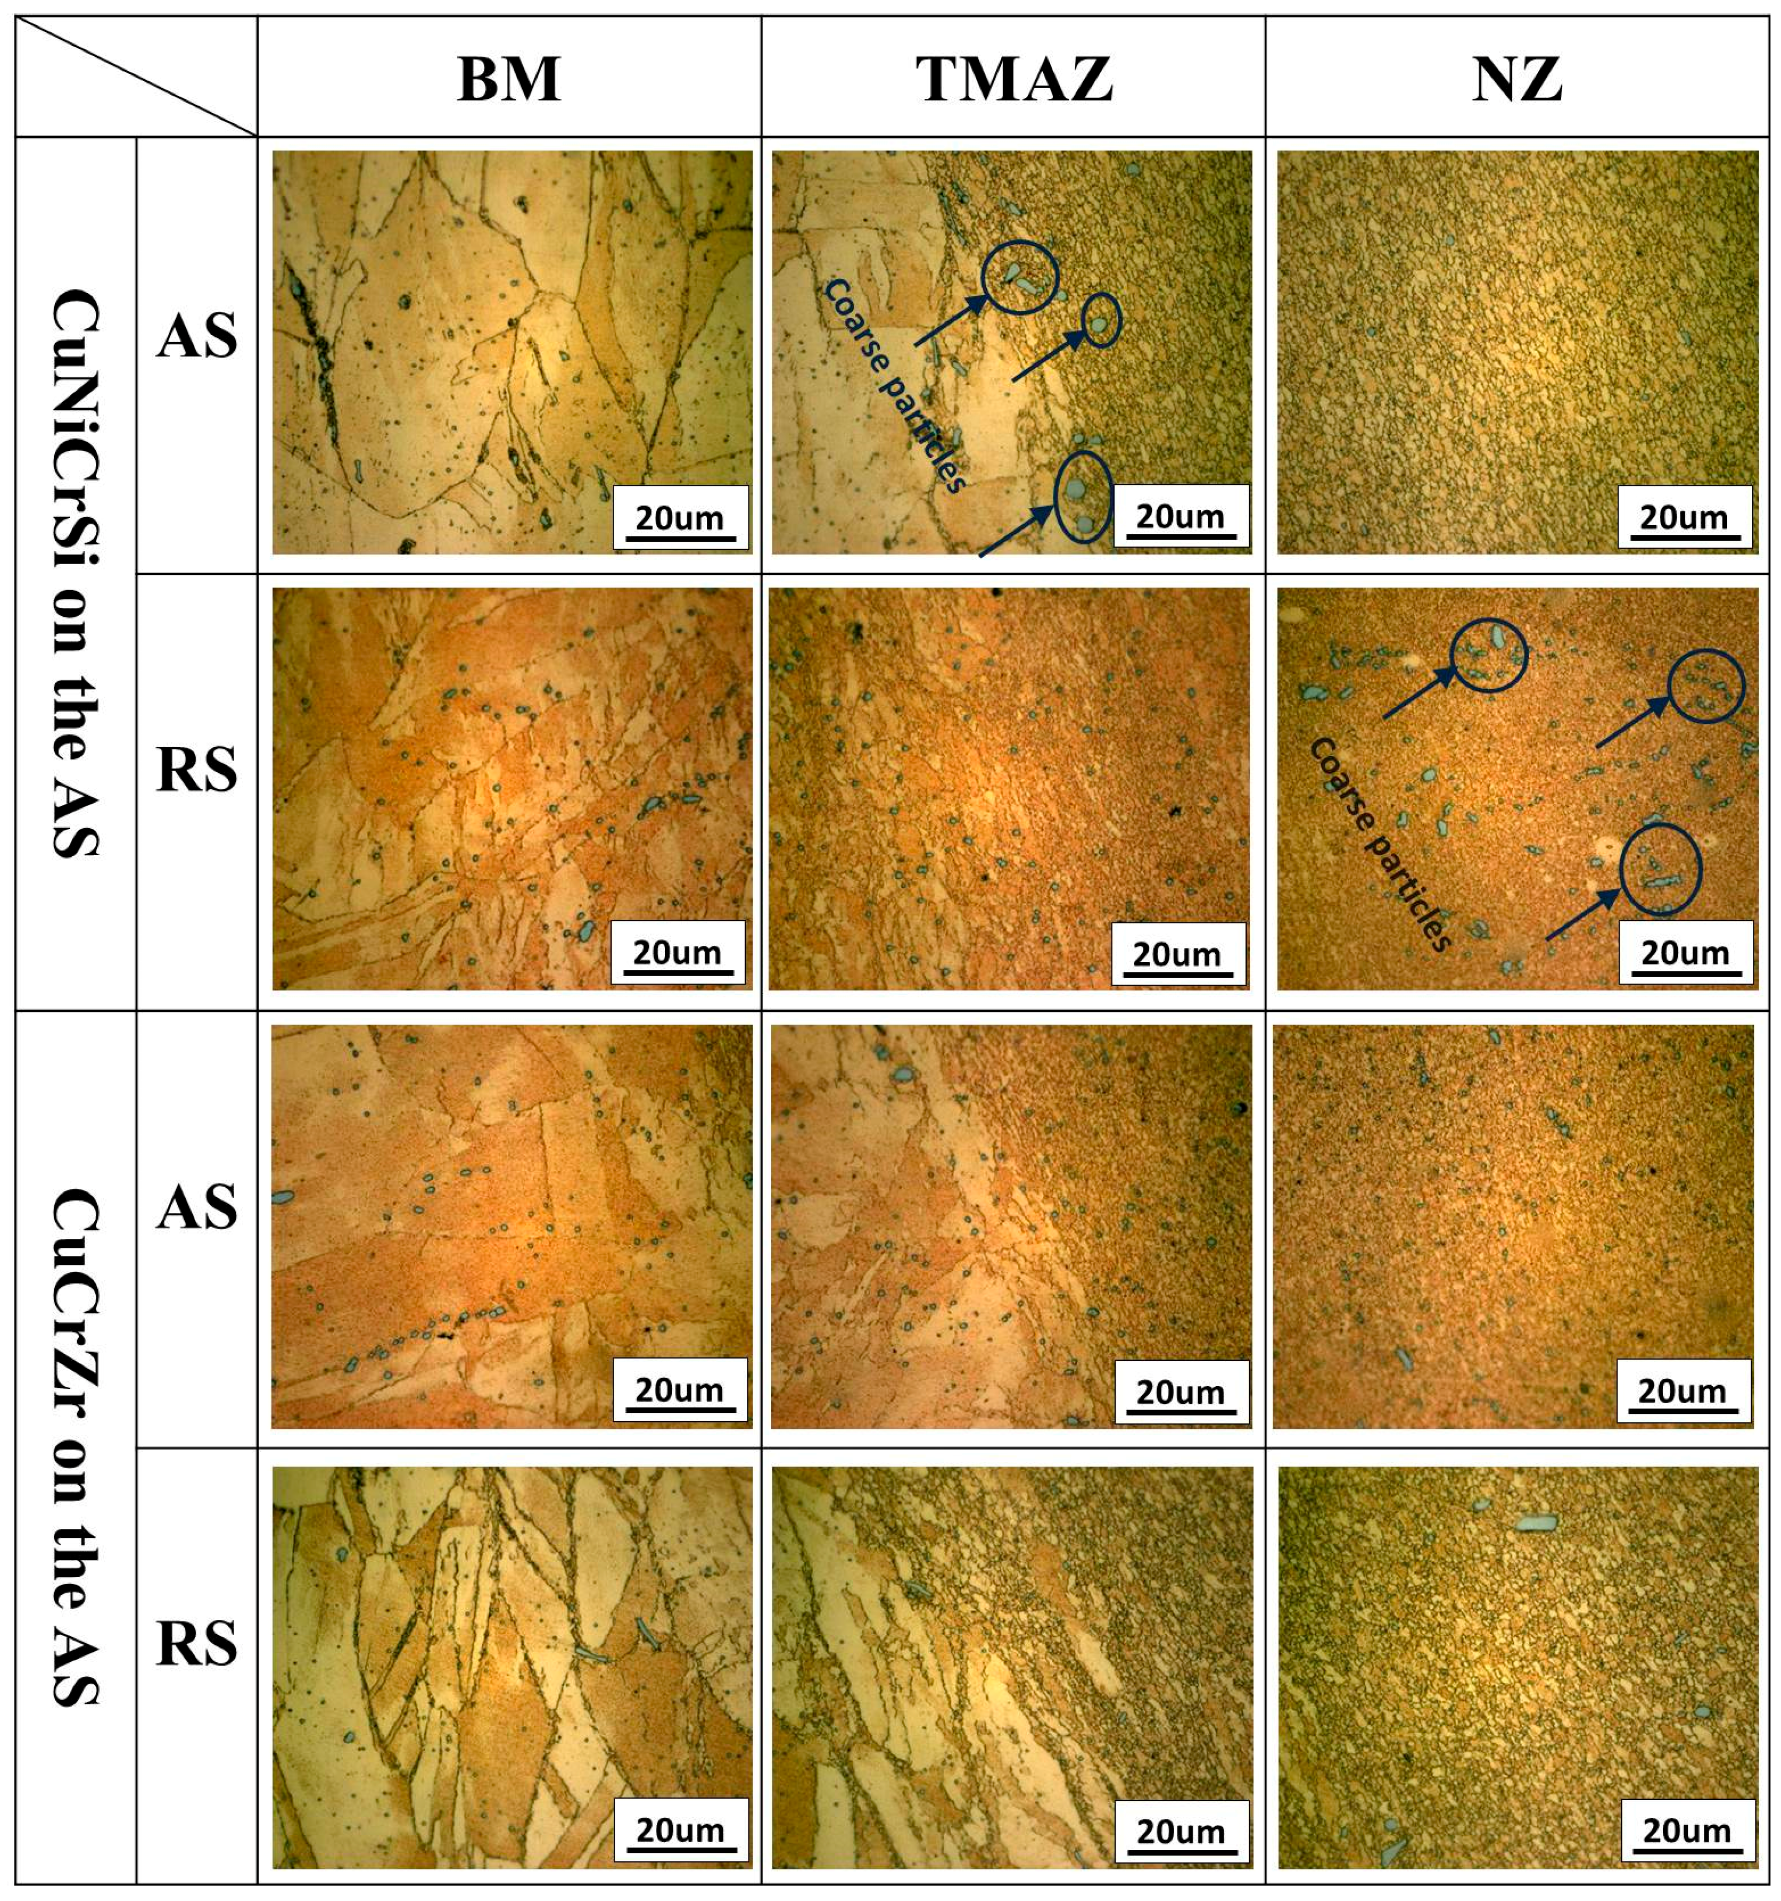
Figure 3 portrays magnified grain structures of the NZ, BM and TMAZ with the CuCrZr alloy or the CuNiCrSi alloy located on the AS. One thing to be noted is that the heat affected zone (HAZ) was not observed at the present study, which can be attributed to the high heat dissipation of copper alloy [18]. In Figure 3, it is seen that non-uniform distribution of coarse size grains exiting in the two base metals are completed transformed into even distribution, showing as equiaxed grains in the nugget zone after the FSW process. The average grain sizes of different zones measured by the mean linear intercept method are shown in Table 2. The grain size of CuNiCrSi-BM is a little bigger than that of CuCrZr-BM. Considerable numbers of coarse particles distribute randomly in both BM and NZ. Additionally, the density of coarse particles is larger in CuCrZr-NZ and CuCrZr-BM than that of CuNiCrSi-NZ and CuNiCrSi-BM. The chemical compositions of these coarse particles are analyzed by EDS which will be discussed in detail below.
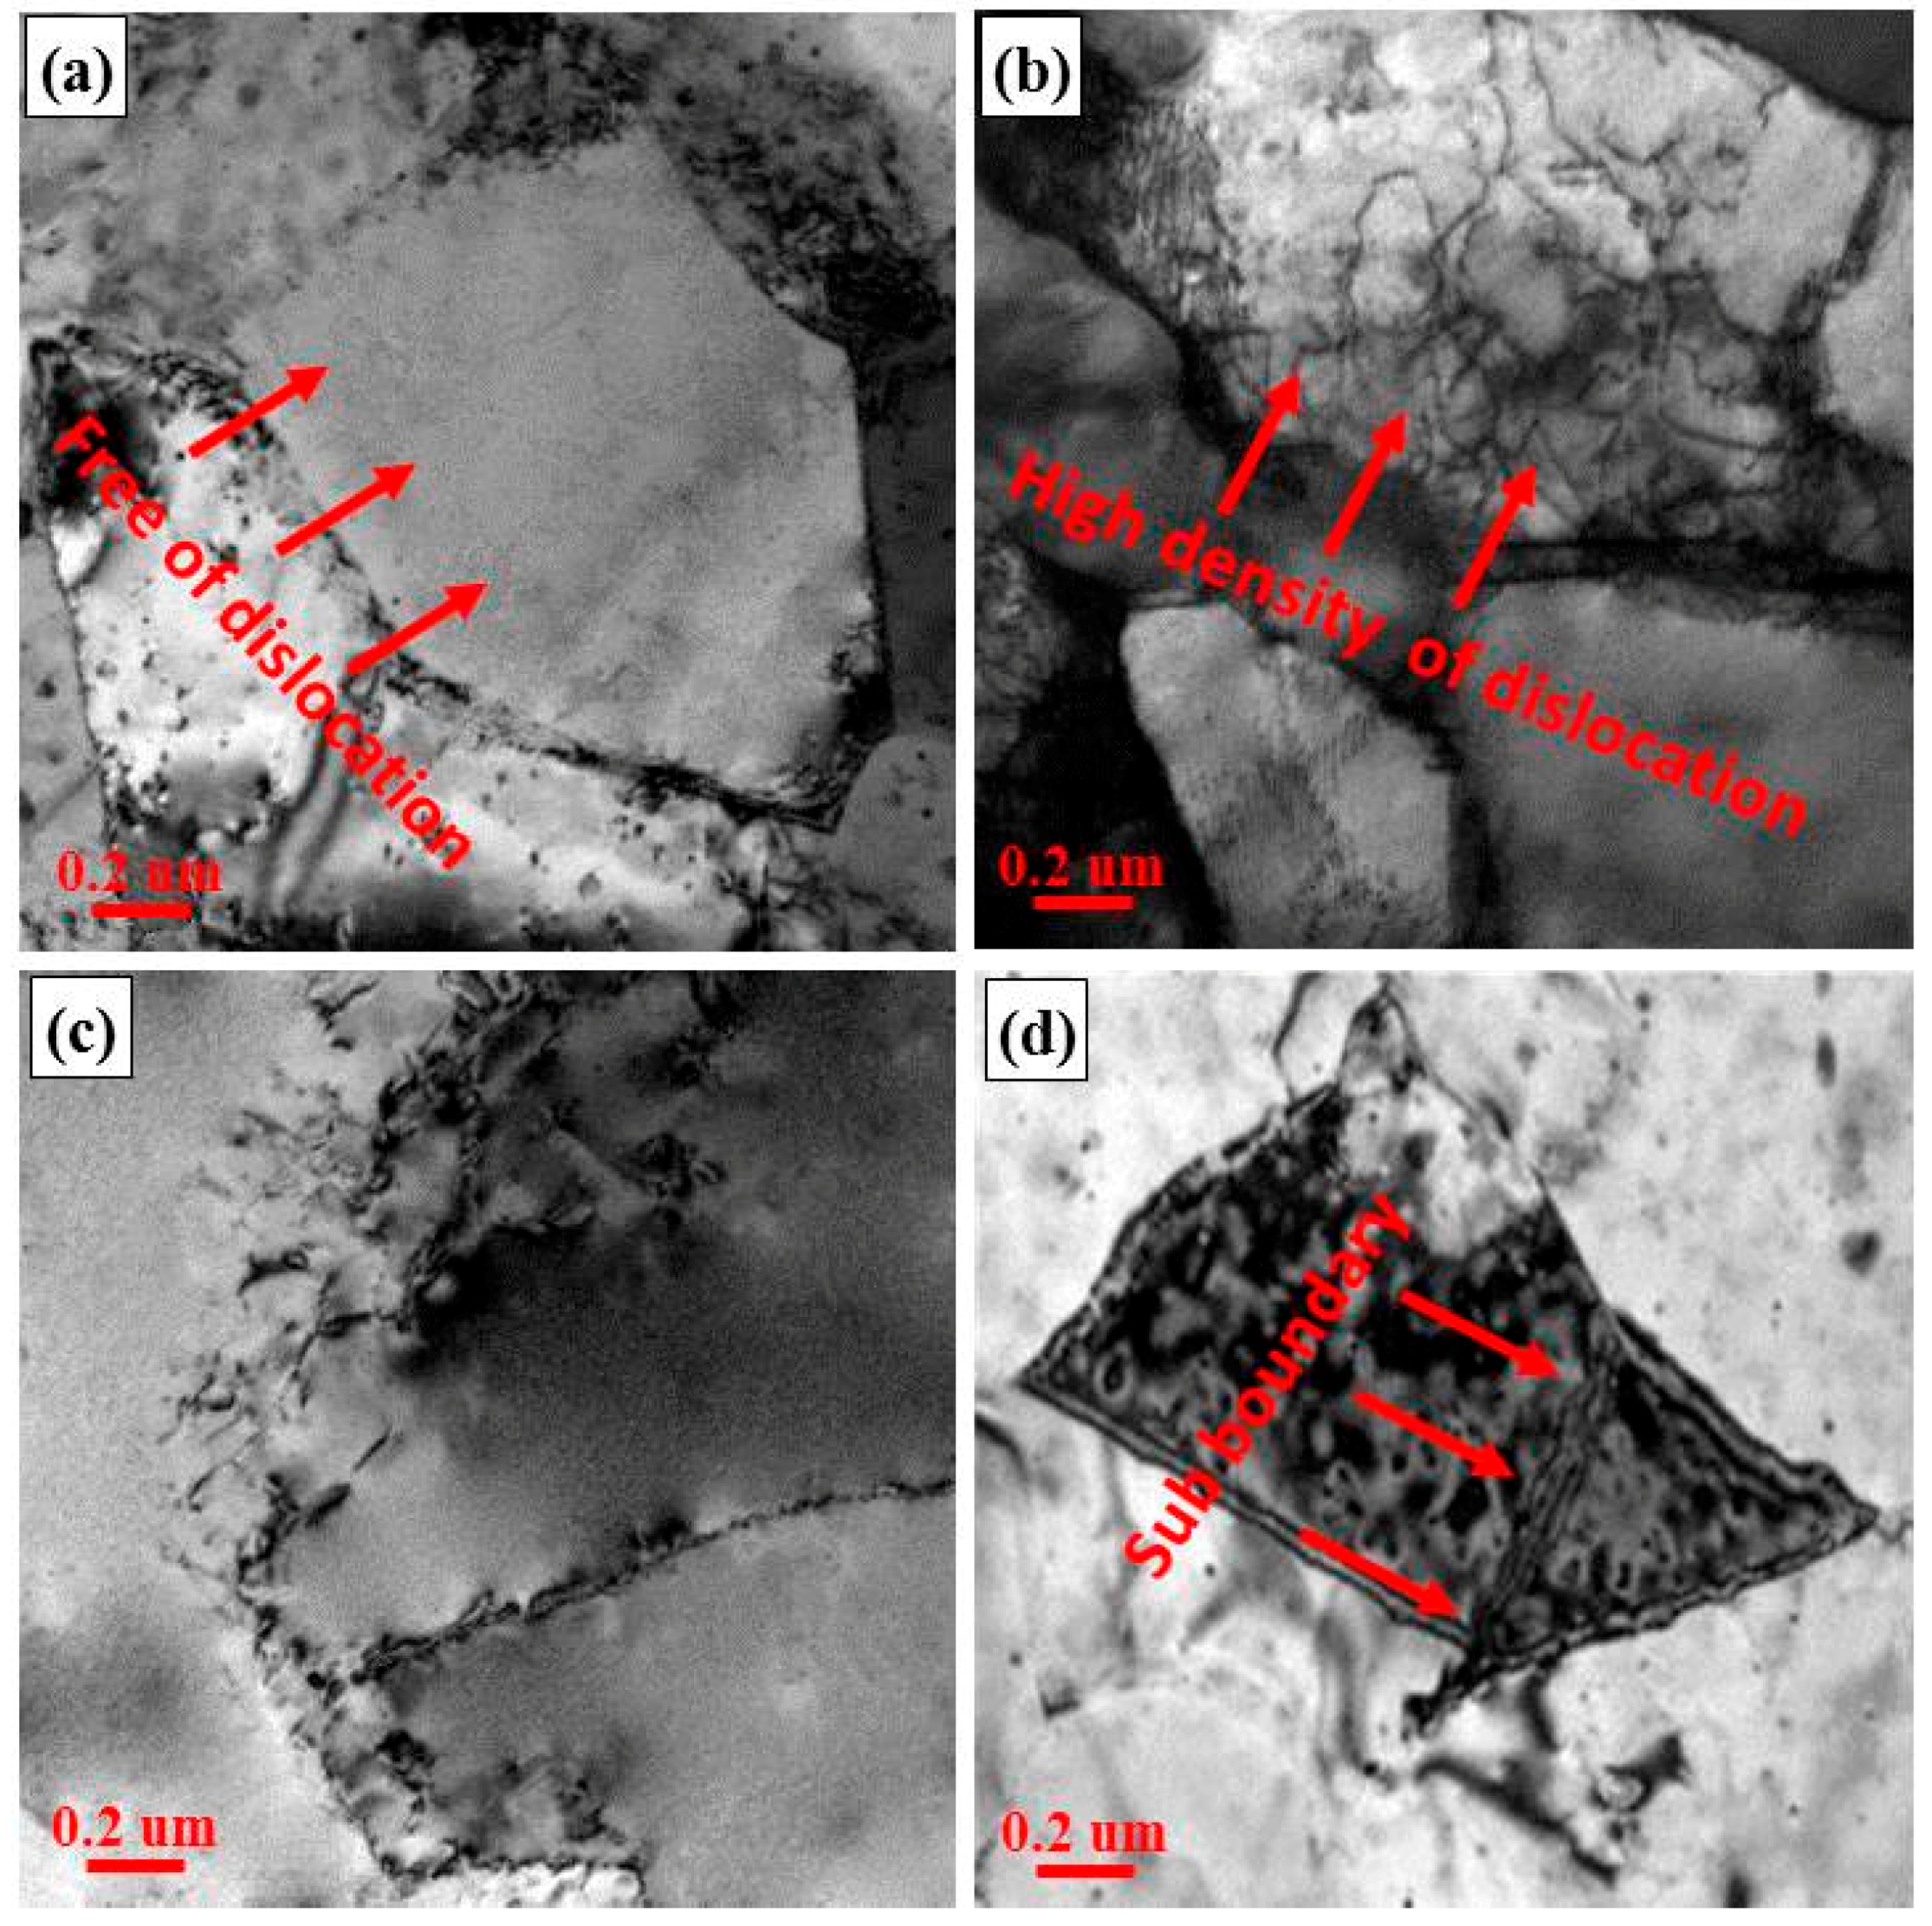
Figure 4 shows the dislocation structures and sub-boundaries of grains in CuNiCrSi-NZ with the CuCrZr alloy on the AS. Figure 4a shows some grains are dislocation-free, while Figure 4b shows that there is a network structure containing high density of dislocations in some grains. This phenomenon means that the final grains in the NZ experiencing dynamic recovery at different degrees. As shown in Figure 4c, sub-grain boundaries are formed by absorbing dislocations. From Figure 4d, it can be found that some grains are passed through by sub-boundaries.
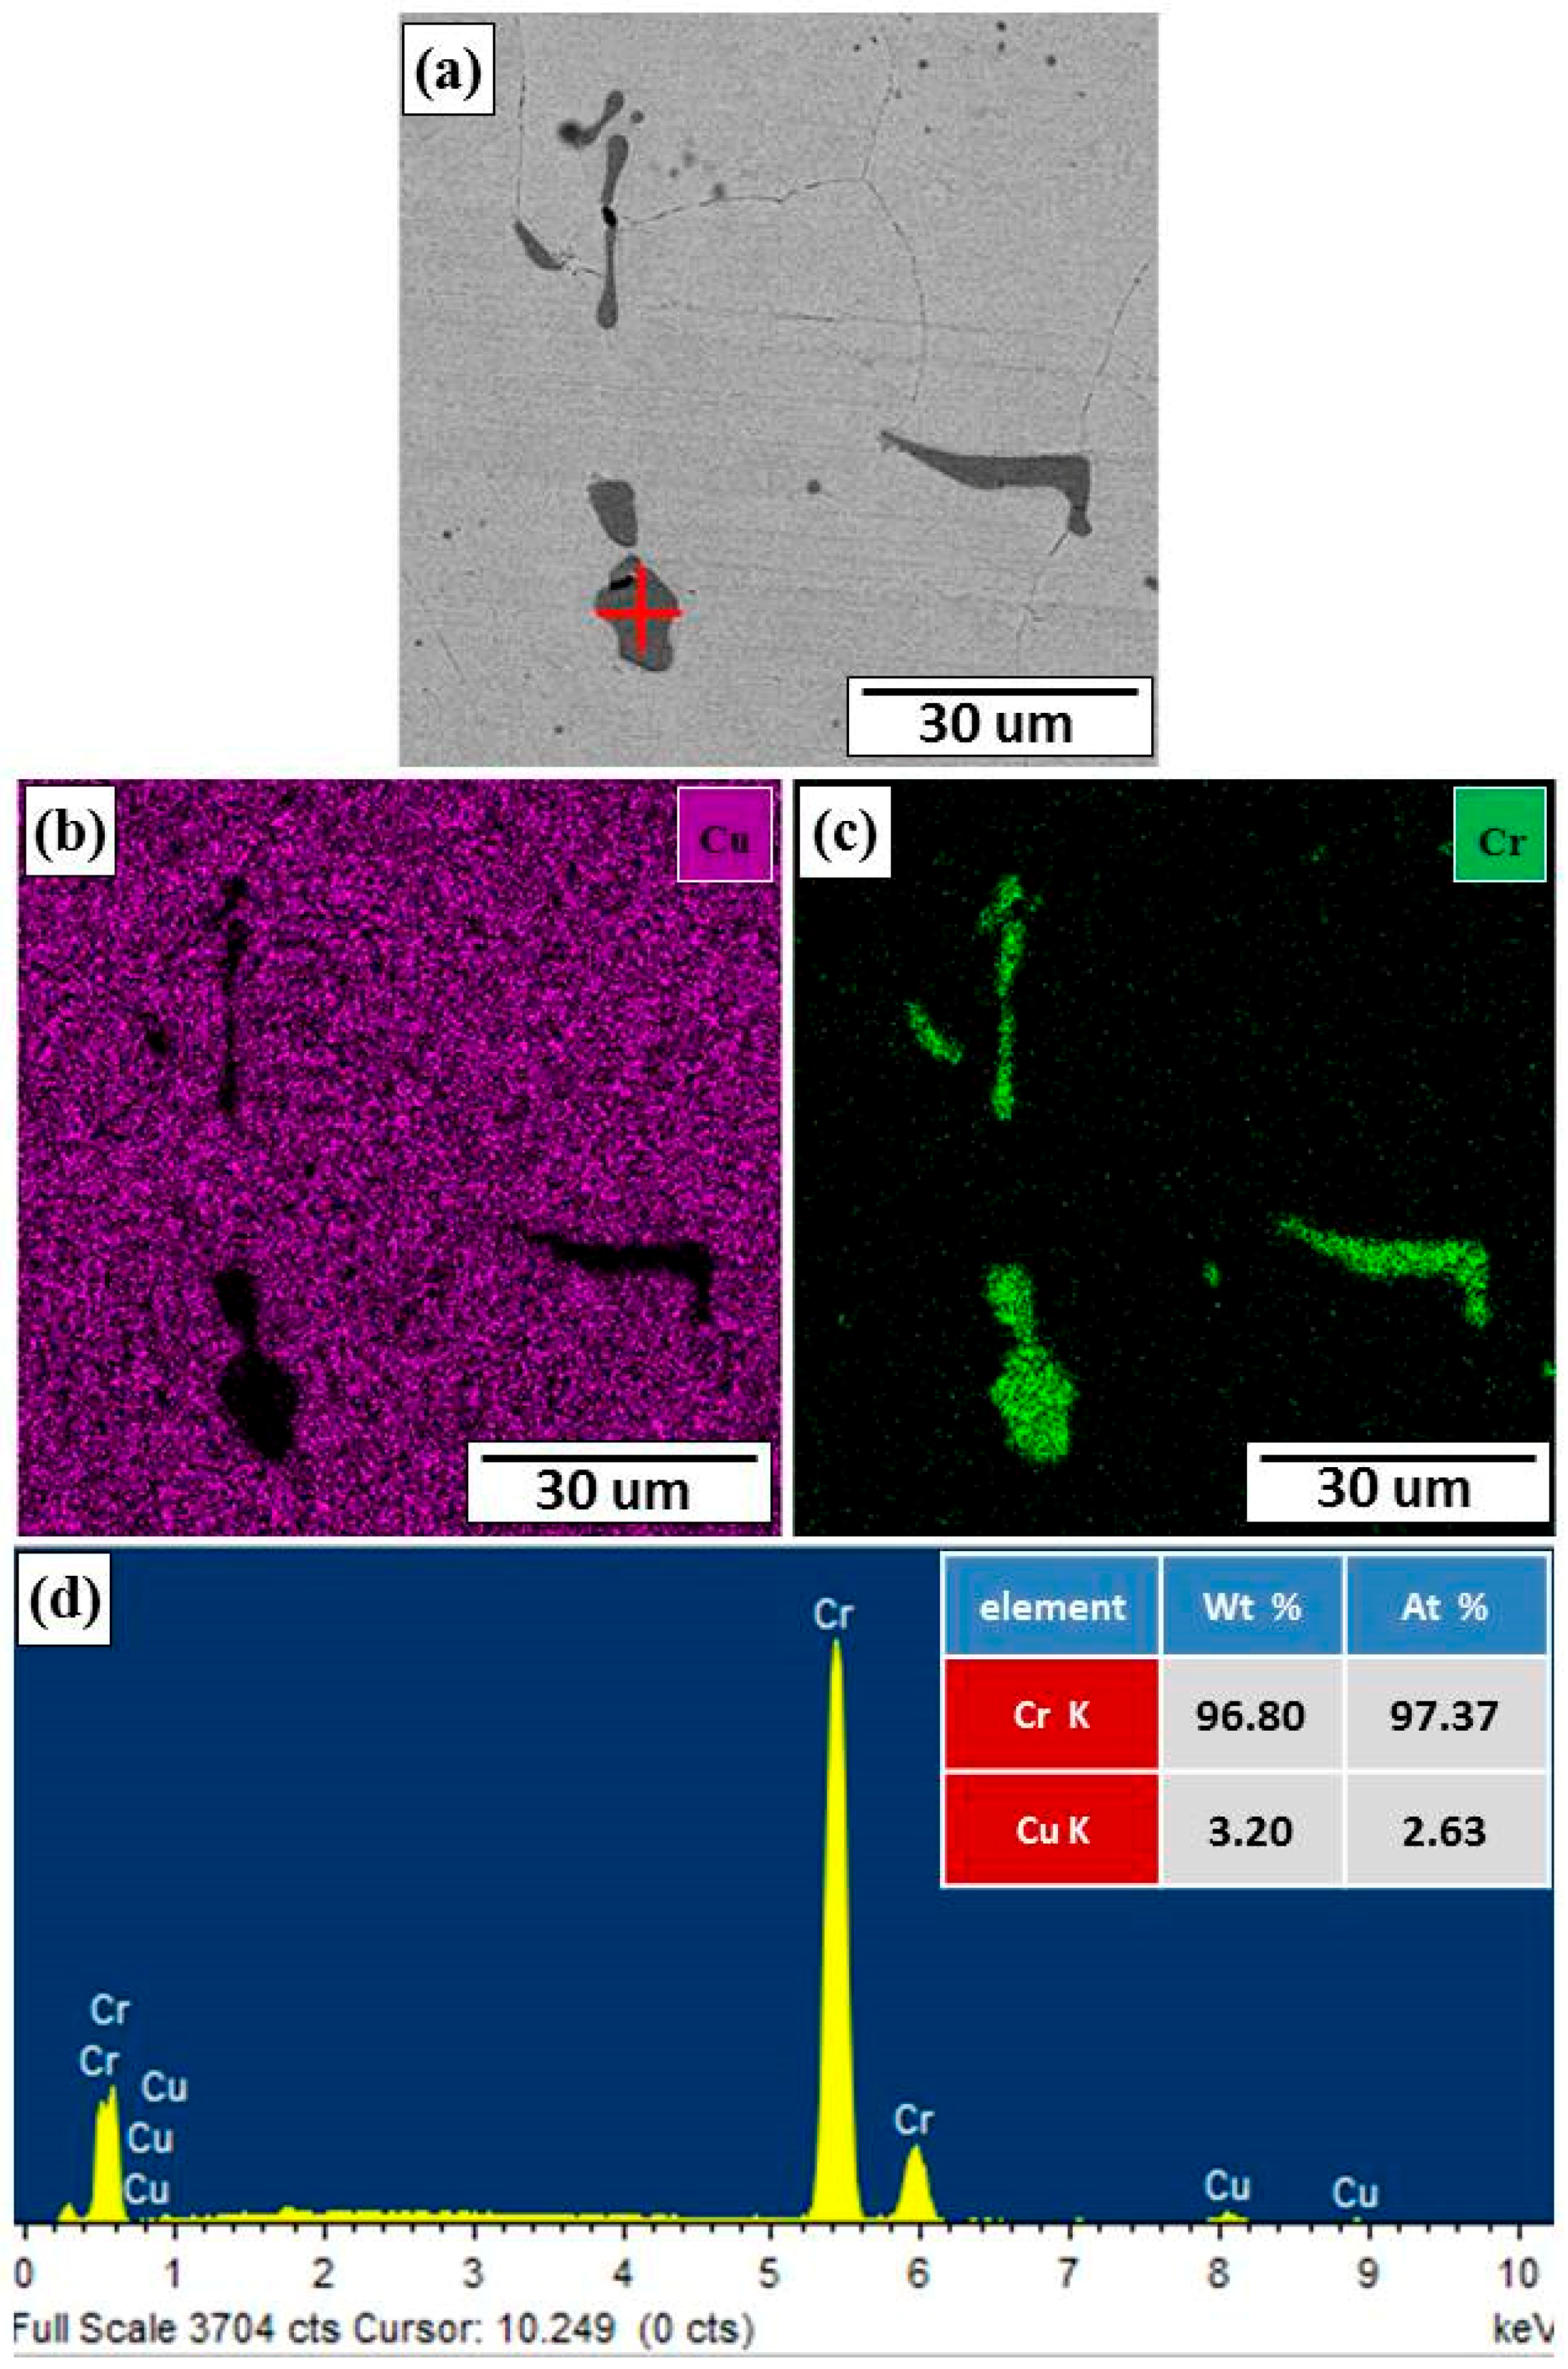
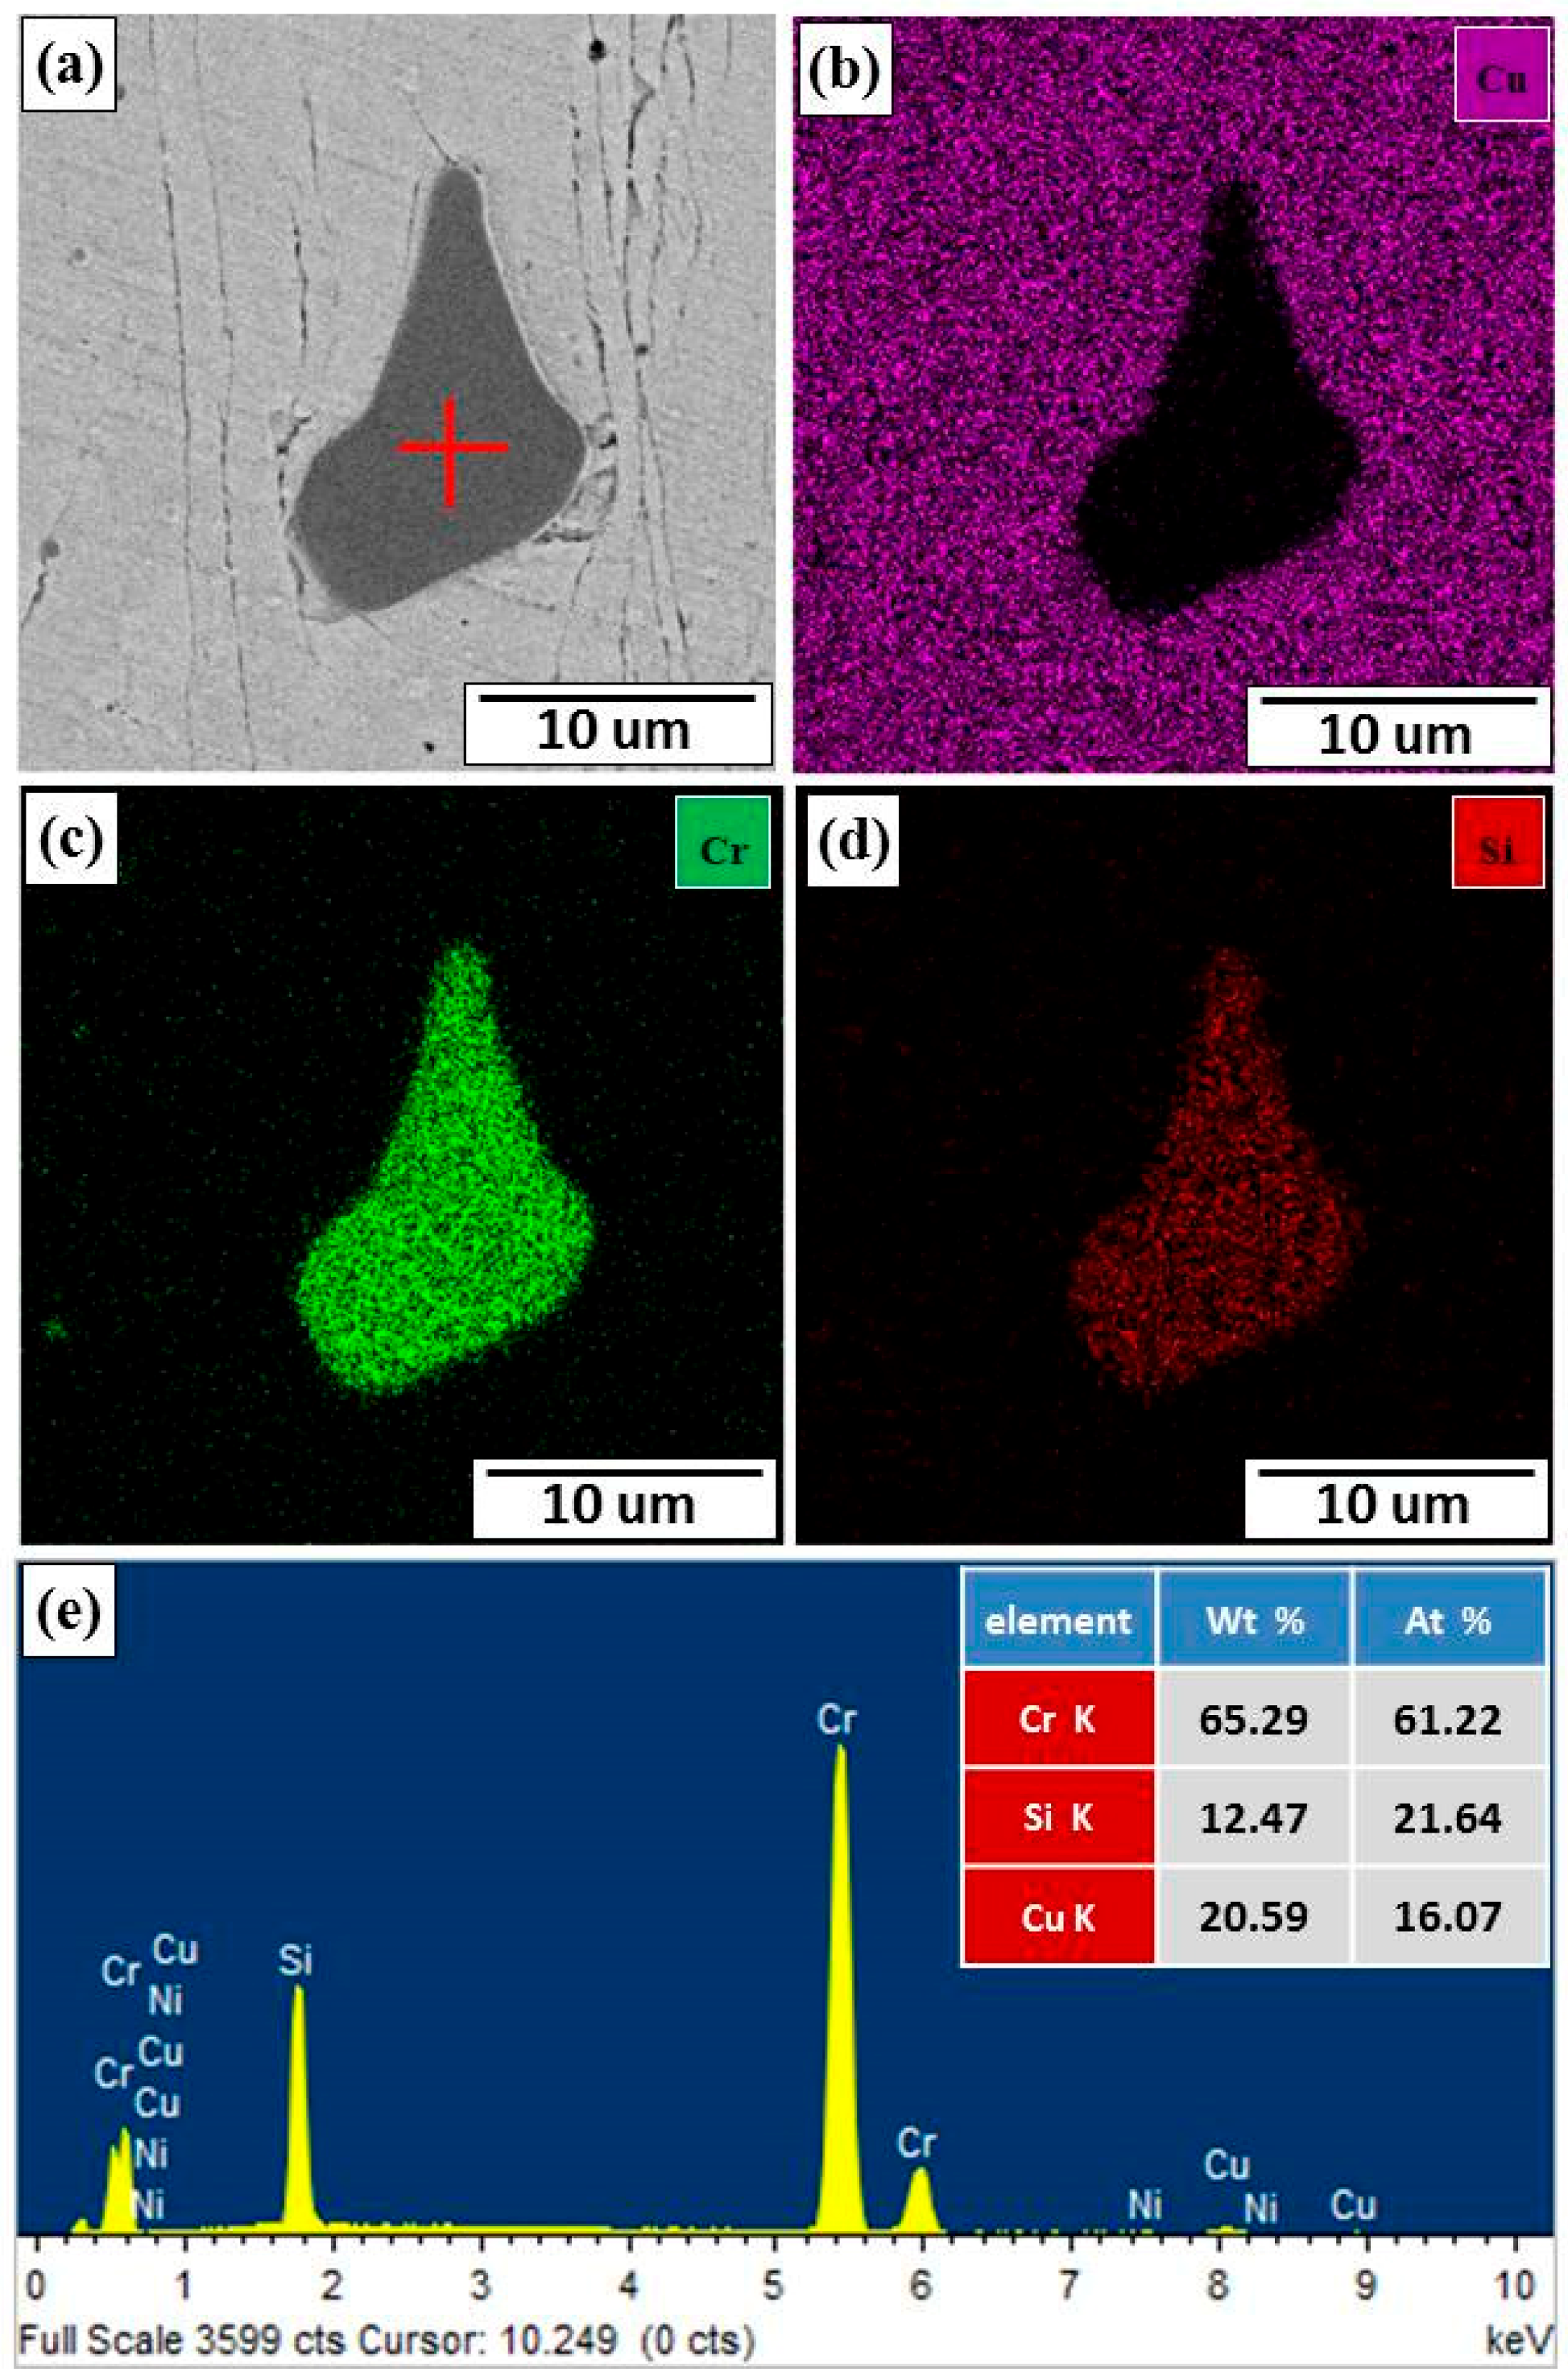
Figure 5 and Figure 6 are EDS images showing the analyses of elemental concentration in coarse particles distributing in CuCrZr-NZ and CuNiCrSi-NZ with the CuCrZr alloy on the AS. In Figure 5, it can be seen that the coarse particles in CuCrZr-NZ are composed of Cr element (green colour), the statistical result further reveals that these Cr element enriched particles contains 96.8 wt. % Cr and 3.2 wt. % Cu. In comparison, Cr element (green colour) and Si element (red colour) concentrate on coarse particles in CuNiCrSi-NZ. Besides, the EDS analysis (Figure 6) suggests that the atomic ratio of Cr and Si in these coarse particles is 3:1.
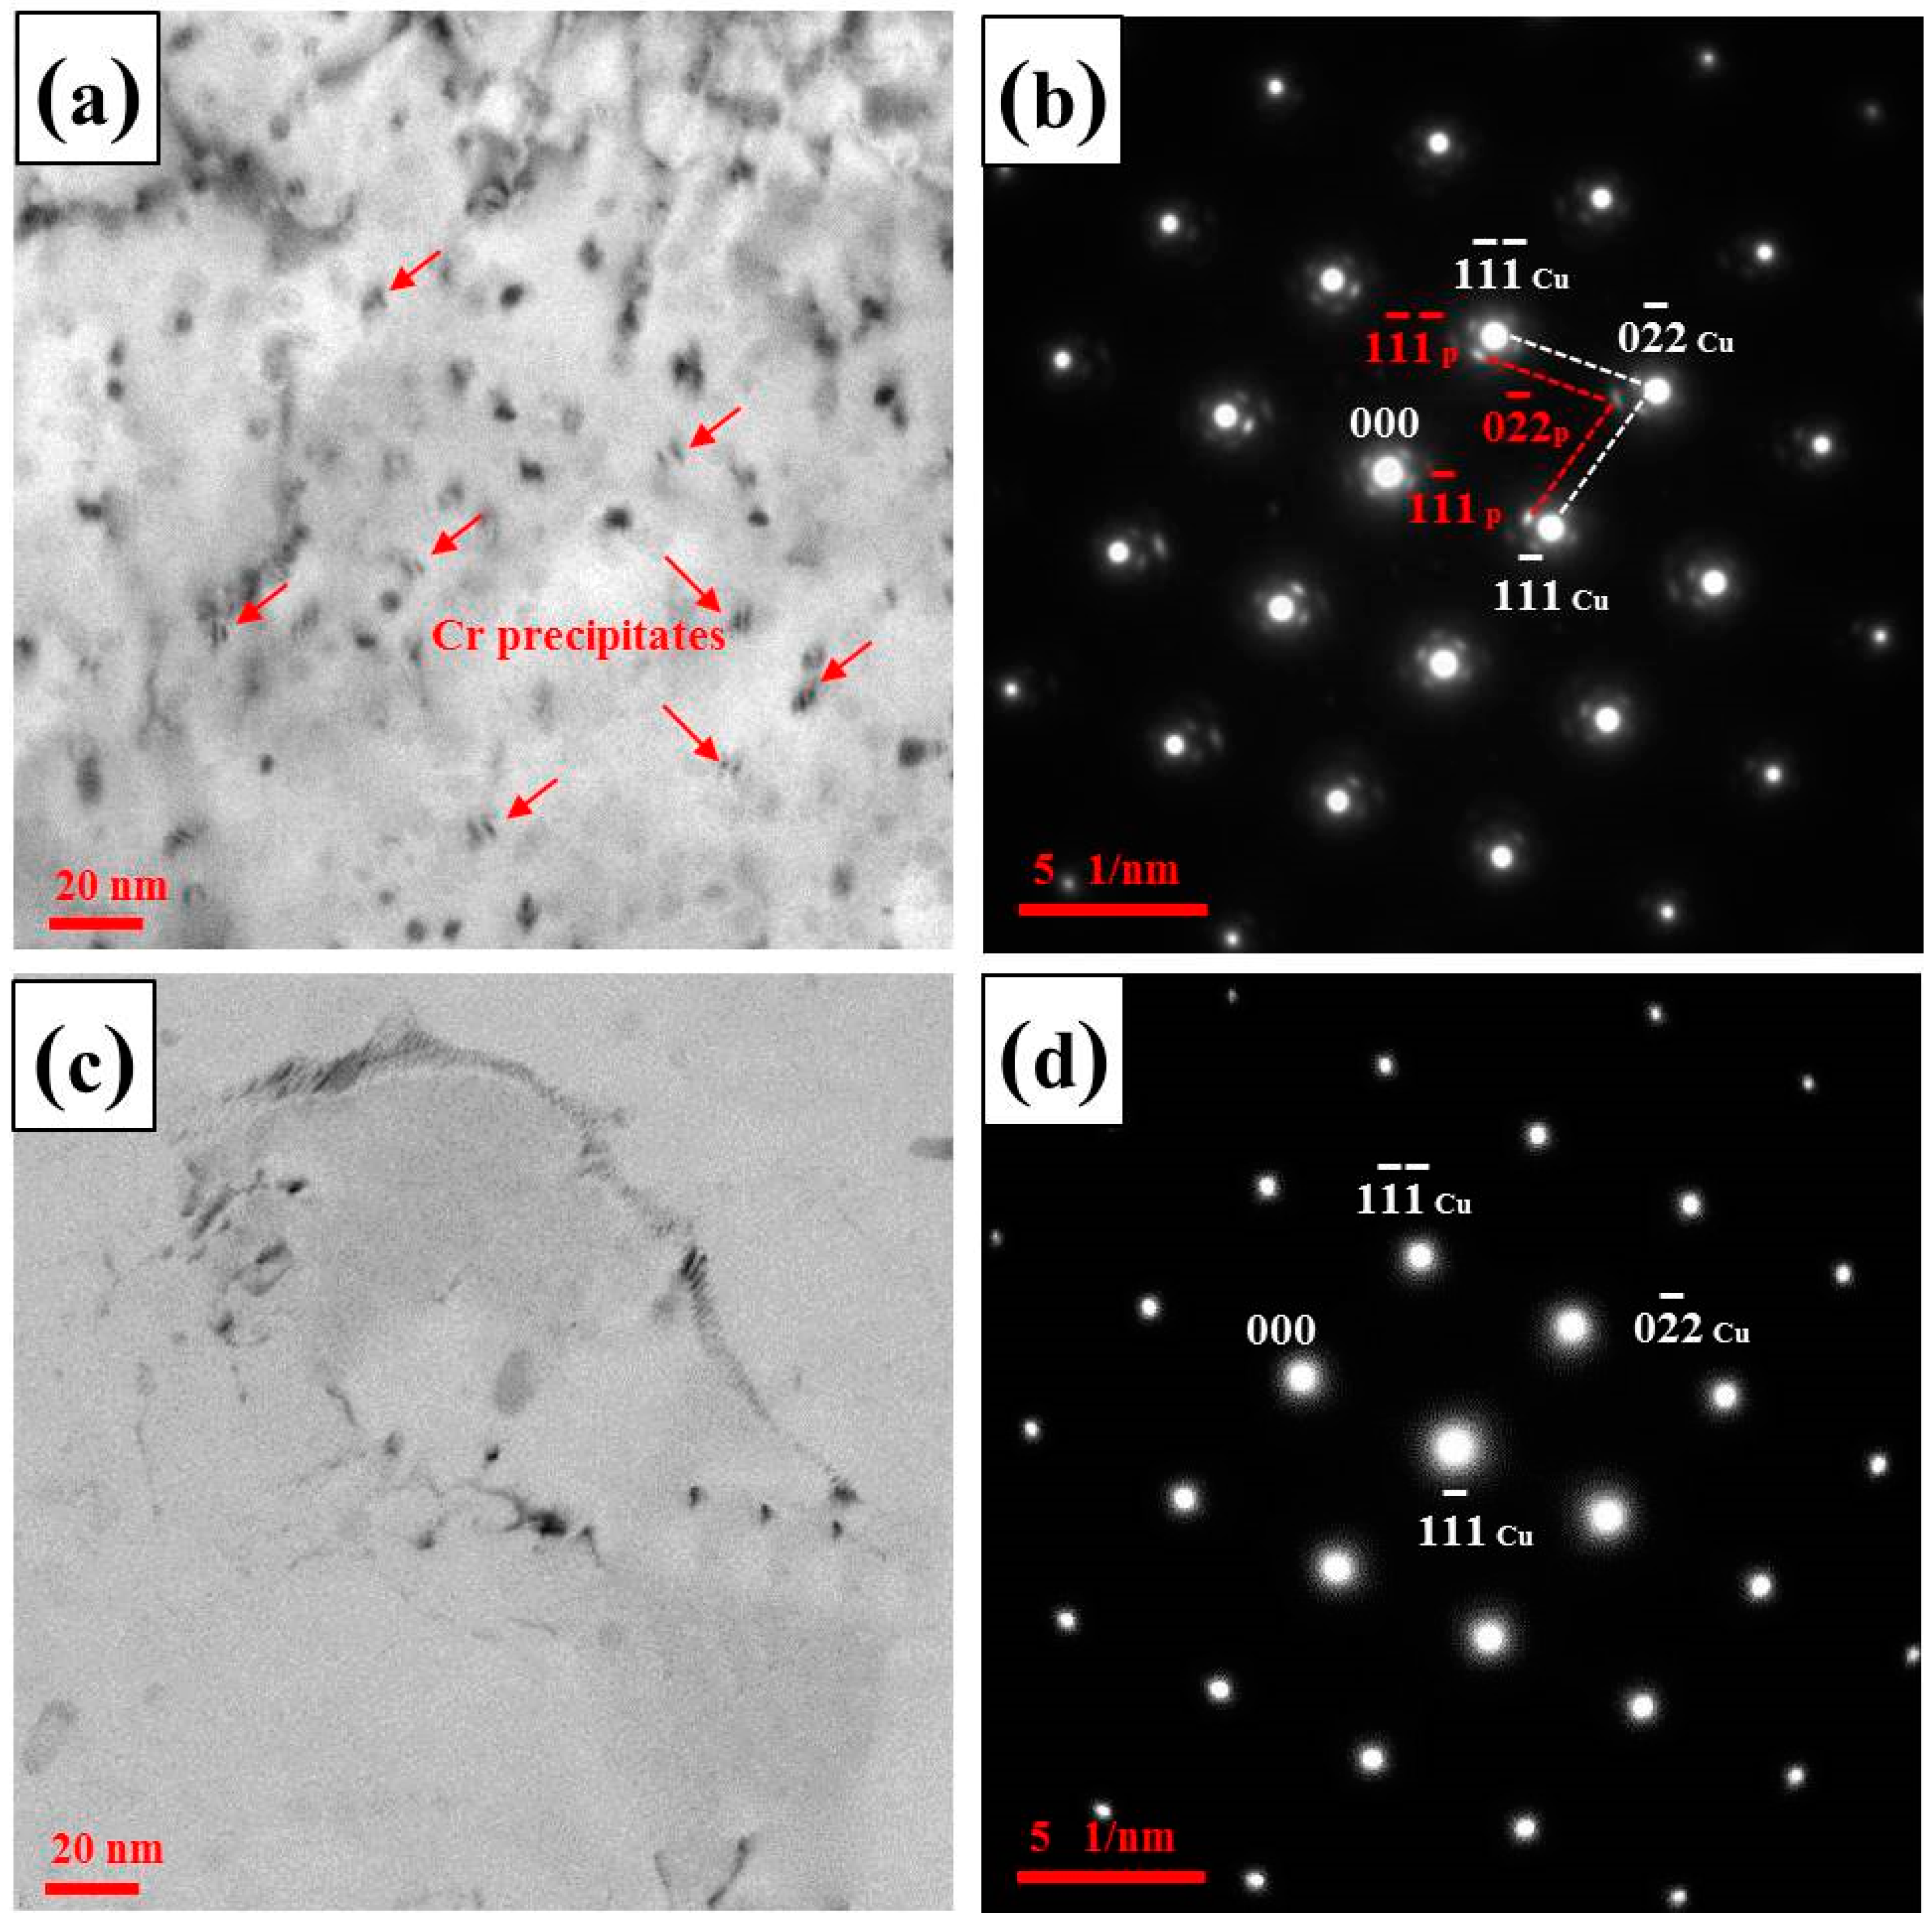
Figure 7 shows the bright field TEM micrographs as well as the relevant selected area electron diffraction (SAD) patterns of samples from CuCrZr-BM and CuCrZr-NZ with the CuCrZr alloy on the AS. The micrographs and SAD patterns are obtained with the incident beam parallel to the direction of [011]Cu. Figure 7a shows the lobe-lobe contrast precipitates homogeneously dispersing in Cu matrix are about 5–8 nm in length. The SAD pattern in Figure 7b reveals the reflections spots from Cu matrix and precipitates. The reflection spots of precipitates reveal that they are the FCC Cr precipitates. After the welding, no precipitates are detected in bright field TEM micrographs of samples from CuCrZr-NZ (Figure 7c), which is also confirmed by the corresponding SAD pattern (Figure 7d).
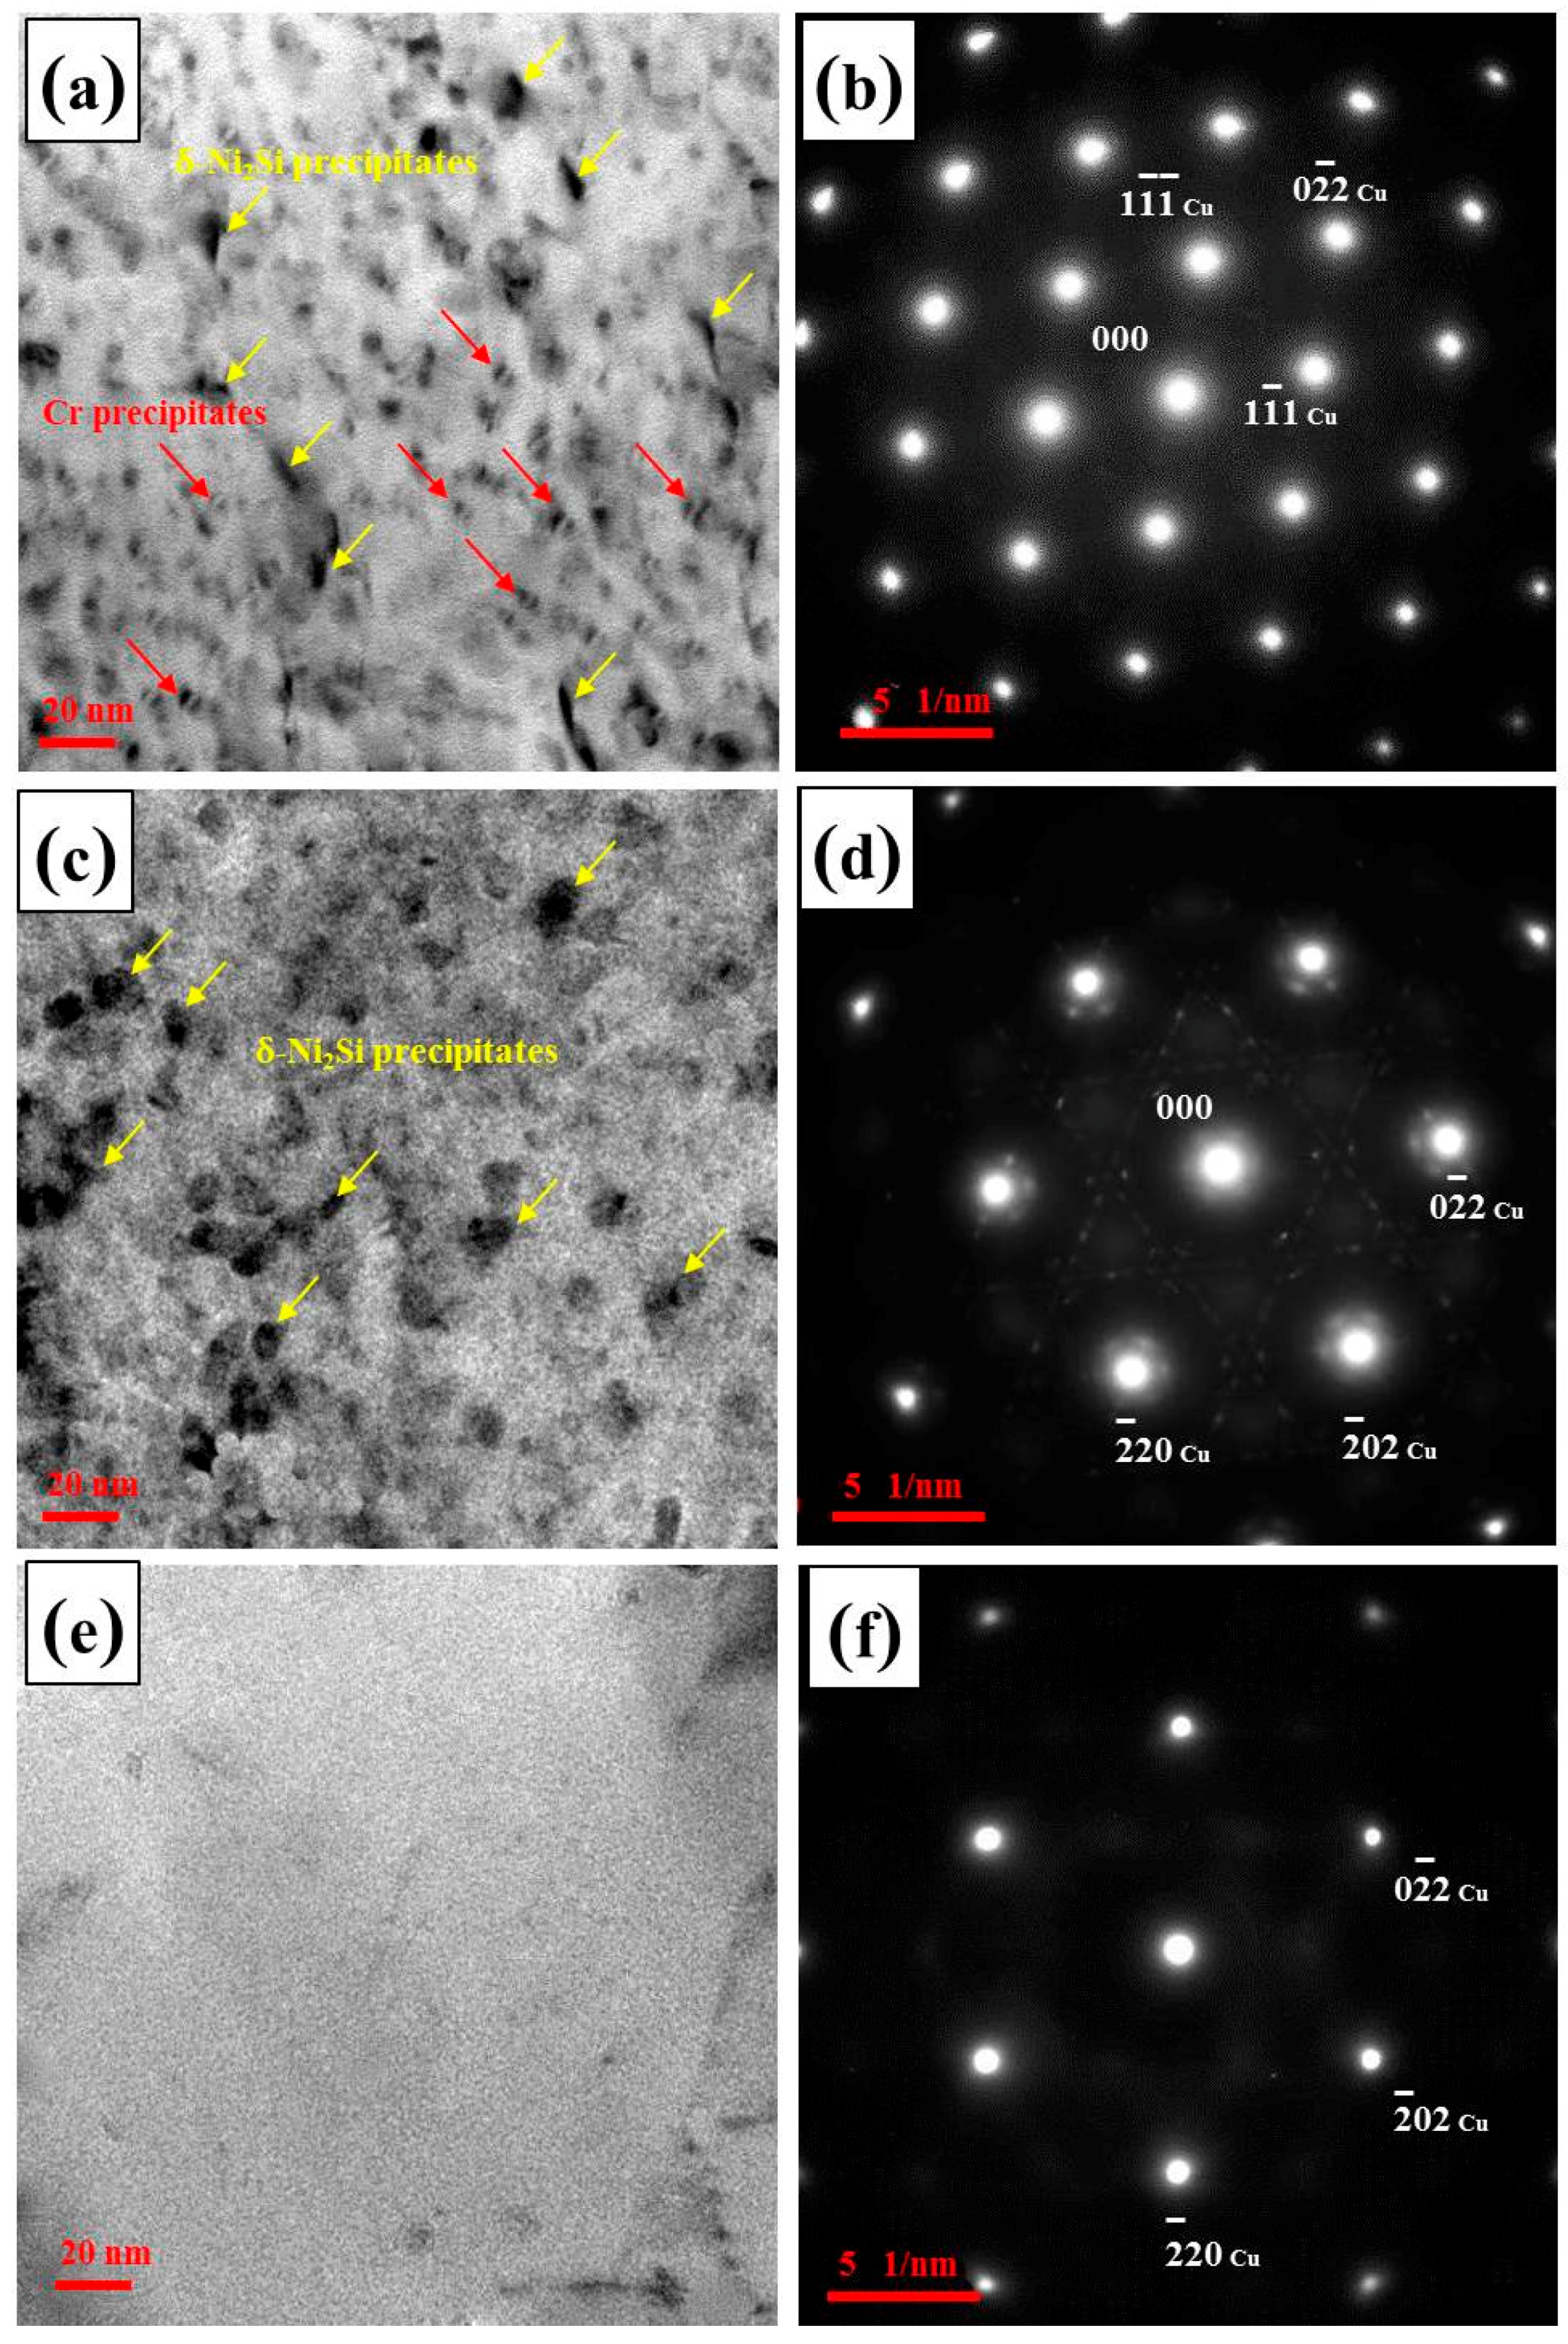
Figure 8 reveals the bright field TEM micrographs with relevant SAD patterns of samples from CuNiCrSi-BM and CuNiCrSi-NZ with the CuCrZr alloy on the AS. Figure 8a shows that the lobe-lobe contrast Cr precipitates can also be defected in CuNiCrSi-BM. However, the reflection spots of Cr precipitates cannot be found from the relevant SDA pattern (Figure 8b) parallel to [011]Cu. Another type of precipitates which are rod-shaped in [011]Cu direction (Figure 8a) and disc-shaped in [111]Cu direction (Figure 8c) can also be found in CuNiCrSi-BM. Moreover, the corresponding SAD patterns parallel to [011]Cu direction (Figure 8b) and [111]Cu direction (Figure 8d) reveal the precipitates have a δ-Ni2Si crystal structure [2]. However, it is similar to samples from CuCrZr-NZ, no precipitates are detected in samples from CuNiCrSi-NZ based on bright field TEM micrographs (Figure 8e) and relevant SAD pattern (Figure 8f).
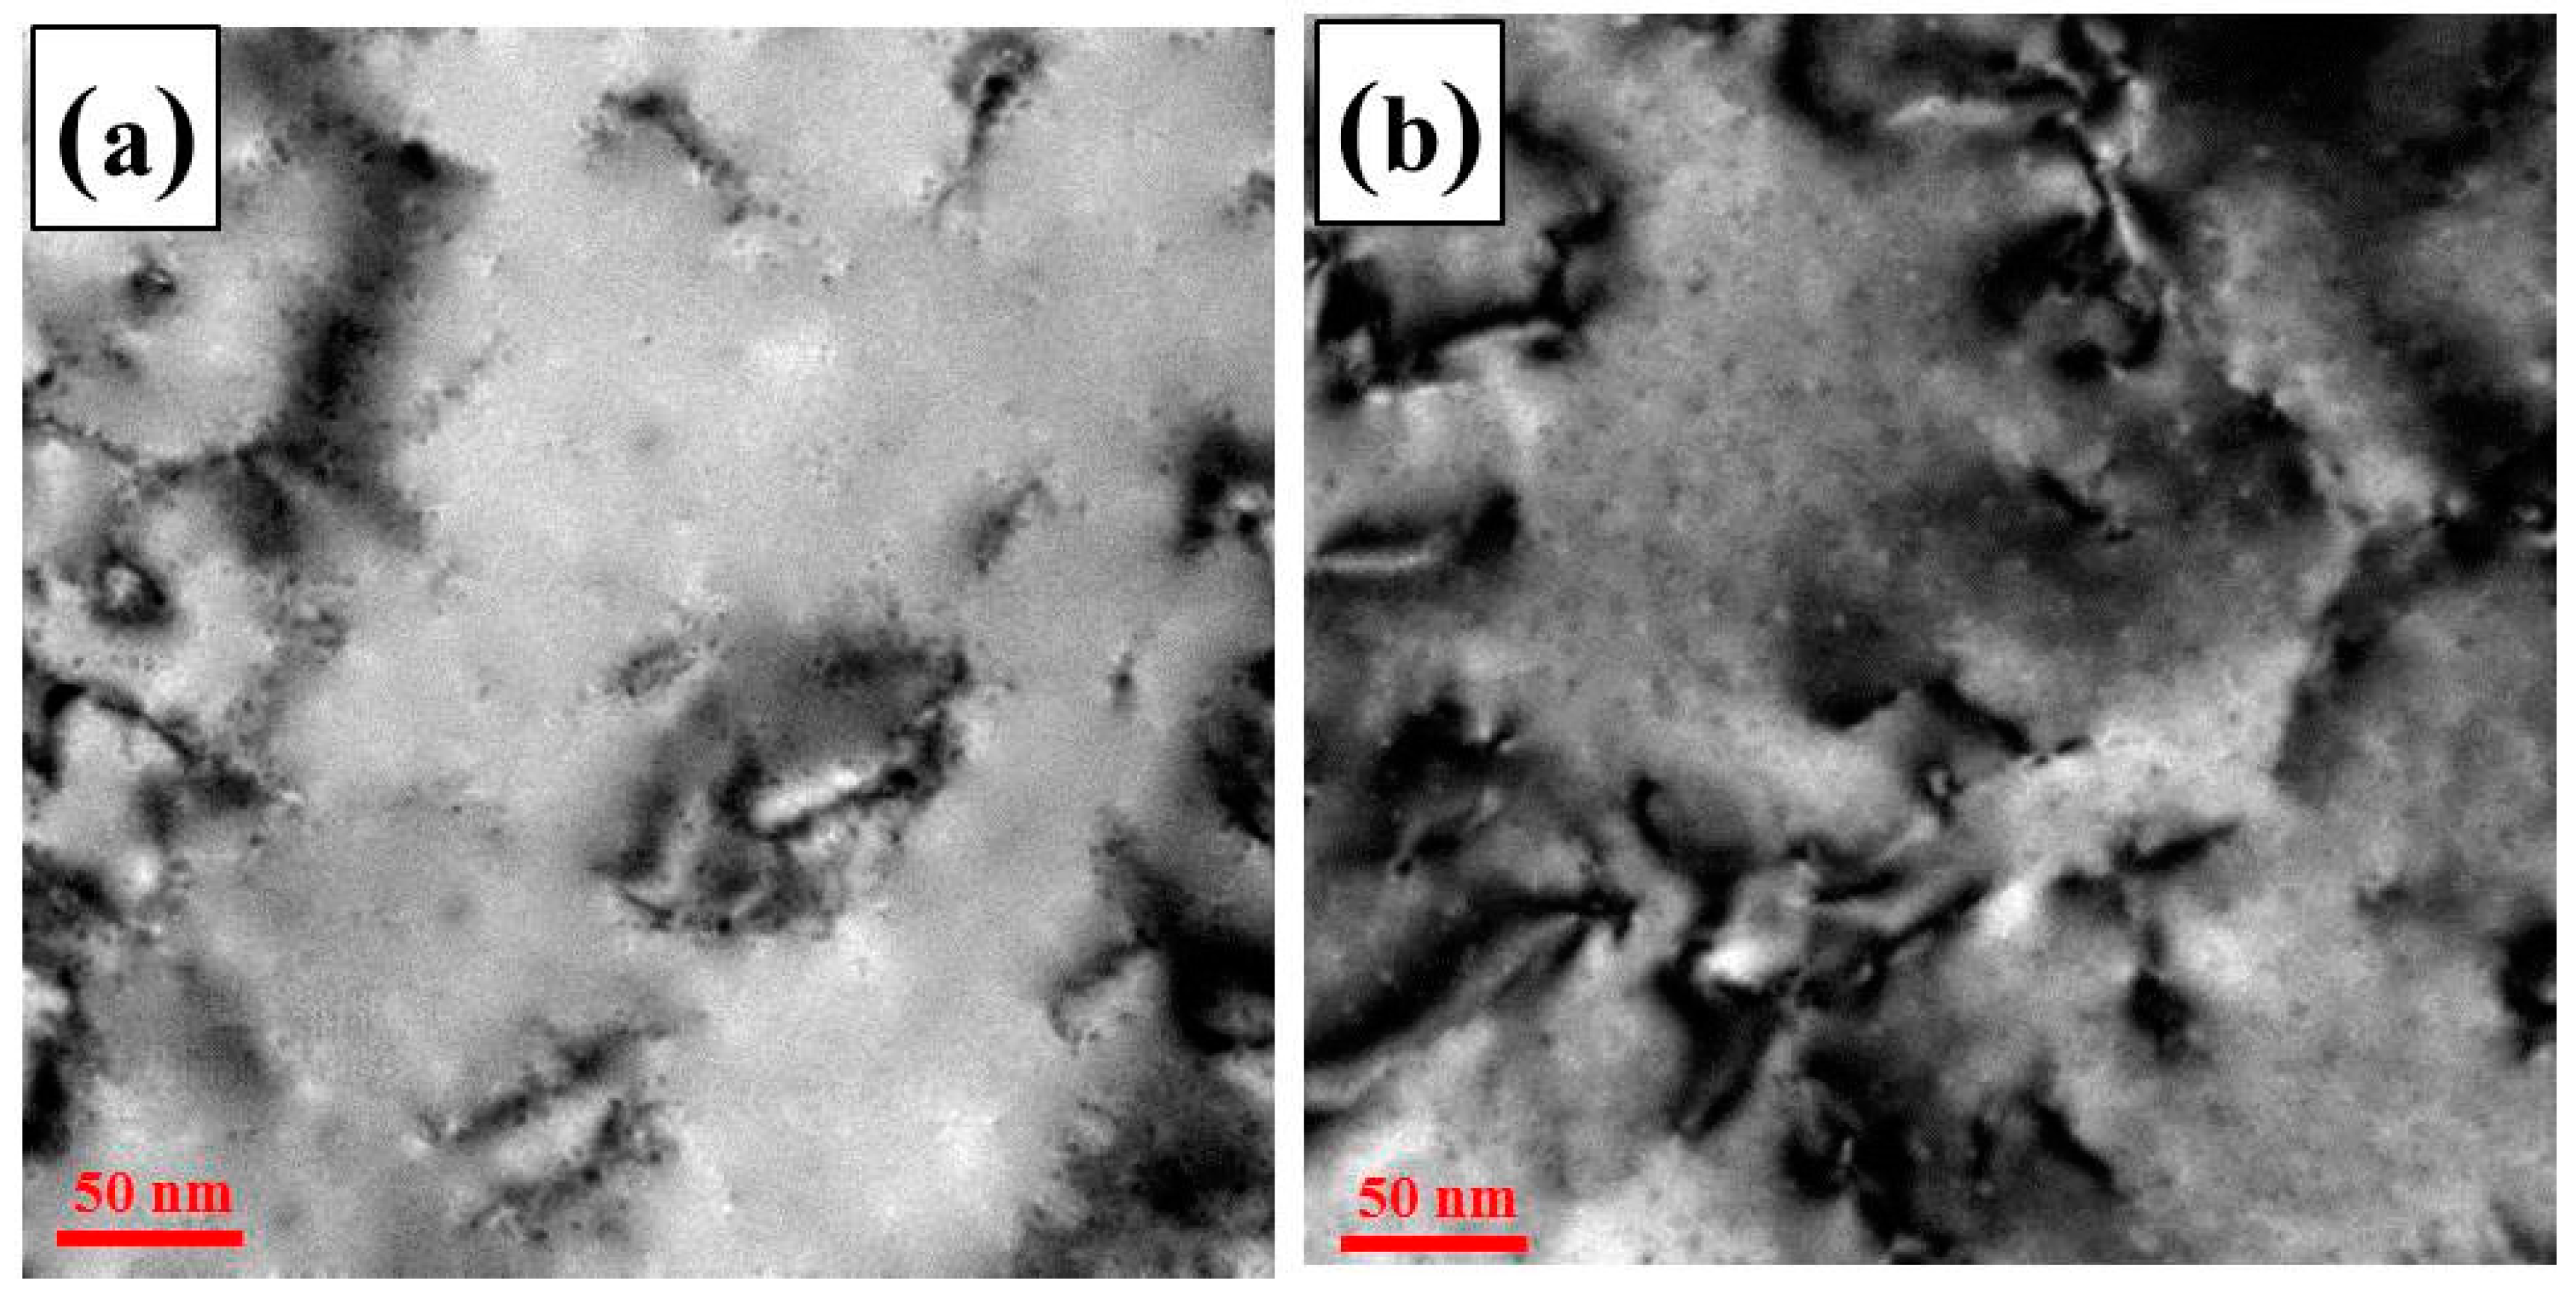
Figure 9 reveals that the dislocations are pinned by Nano-precipitates in both CuNiCrSi-BM (Figure 9a) and CuCrZr-BM (Figure 9b) with the CuCrZr alloy on the AS, via which way the strengths of both CuNiCrSi alloy and CuCrZr alloy are improved.

3.2. Mechanical Characterization of CuCrZr/CuNiCrSi Butt Joints

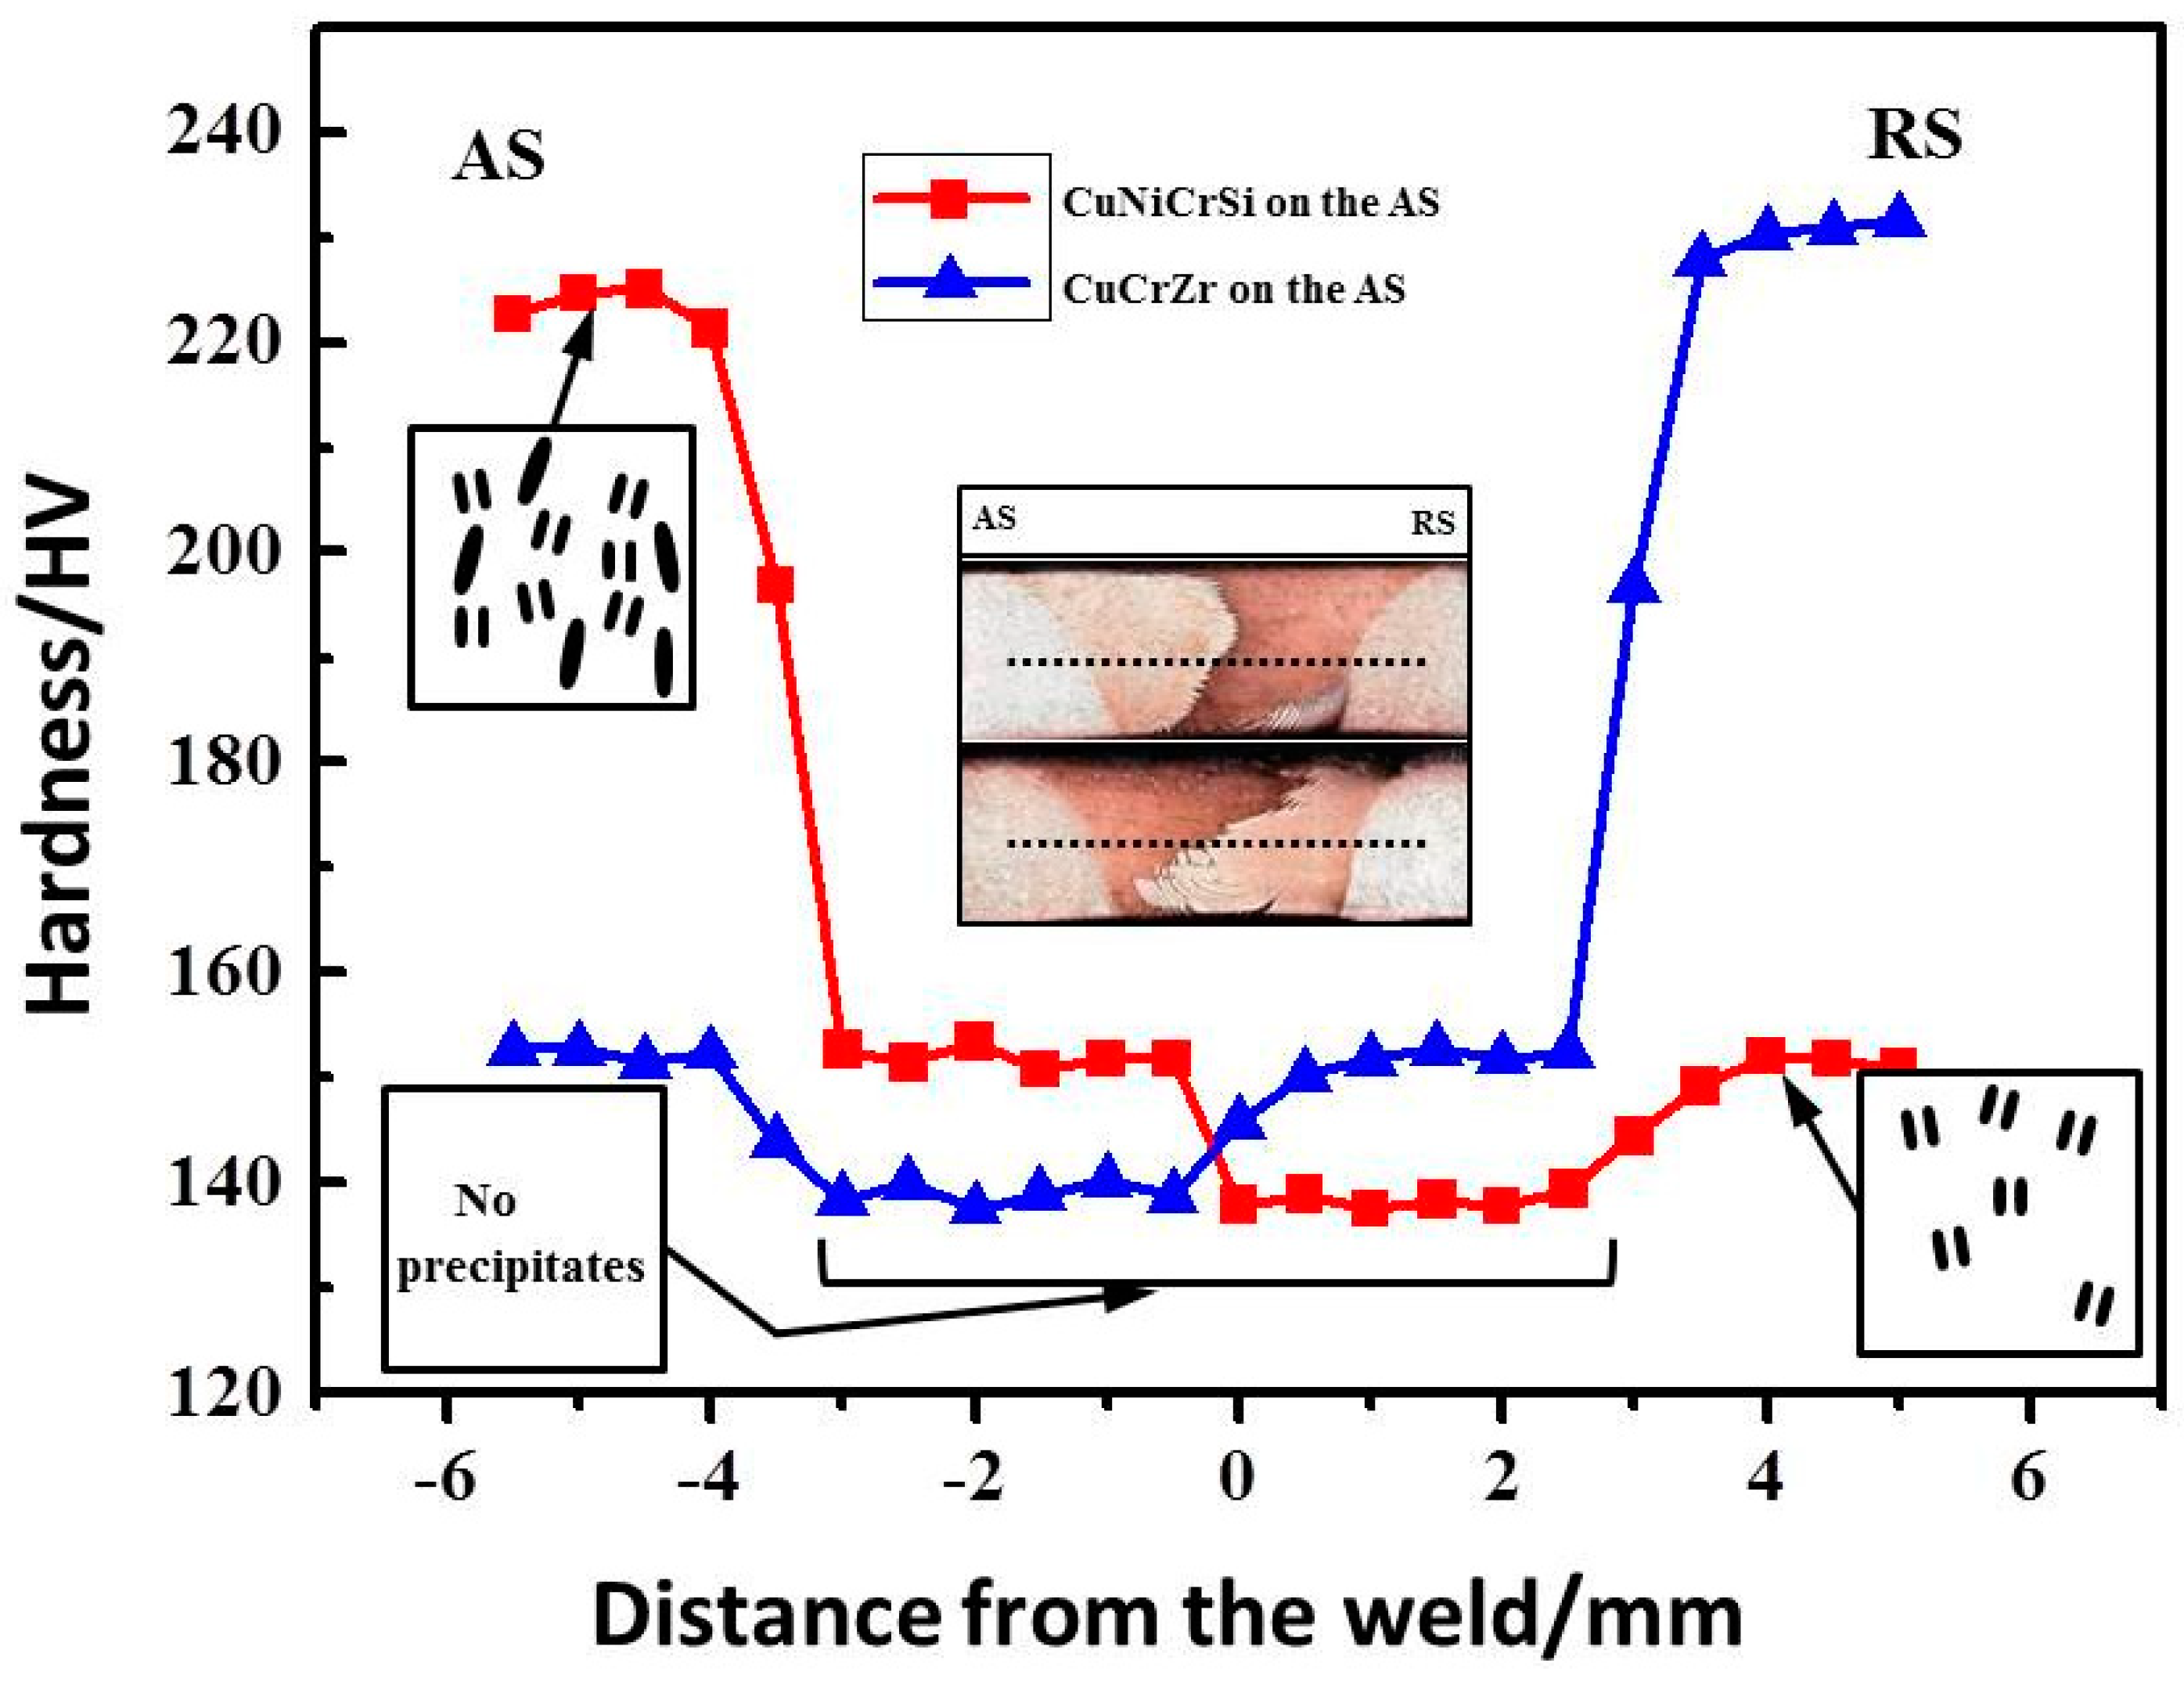
Figure 10 shows the micro-hardness distribution of dissimilar CuCrZr/CuNiCrSi joints. The micro-hardness of CuNiCrSi-BM and CuCrZr-BM is 225 HV and 155 HV, respectively. However, it is seen that the micro-hardness decreases sharply to 150 HV and 125 HV in CuNiCrSi-NZ and CuCrZr-NZ. Besides, the micro-hardness profile distributes asymmetrically along the measuring line, which is a consequence of the different mechanical properties of CuCrZr and CuNiCrSi alloy.
Figure 11 demonstrates the mechanical properties of dissimilar joints, whose detailed values are also listed in Table 3. It seems that the tensile strength of joints with CuCrZr located on the AS is a little bigger than that with the inverse material position. One thing to be noted is that the highest value of tensile strength is about 450 MPa in all welds, which indicates a decrease of mechanical properties compared with that of two aged base metals. However, the joints obtained at present study still exhibit a higher strength than most friction-stir-welded copper joints mentioned at previous study.
Figure 12 shows the failure locations of tensile testing specimens. Obviously, all the welds failed at the stir zone. It is noted that the tensile specimens failed at the CuCrZr-NZ with CuNiCrSi located on the AS but at the mix zone of CuCrZr-NZ and CuNiCrSi-NZ with the inverse material position.
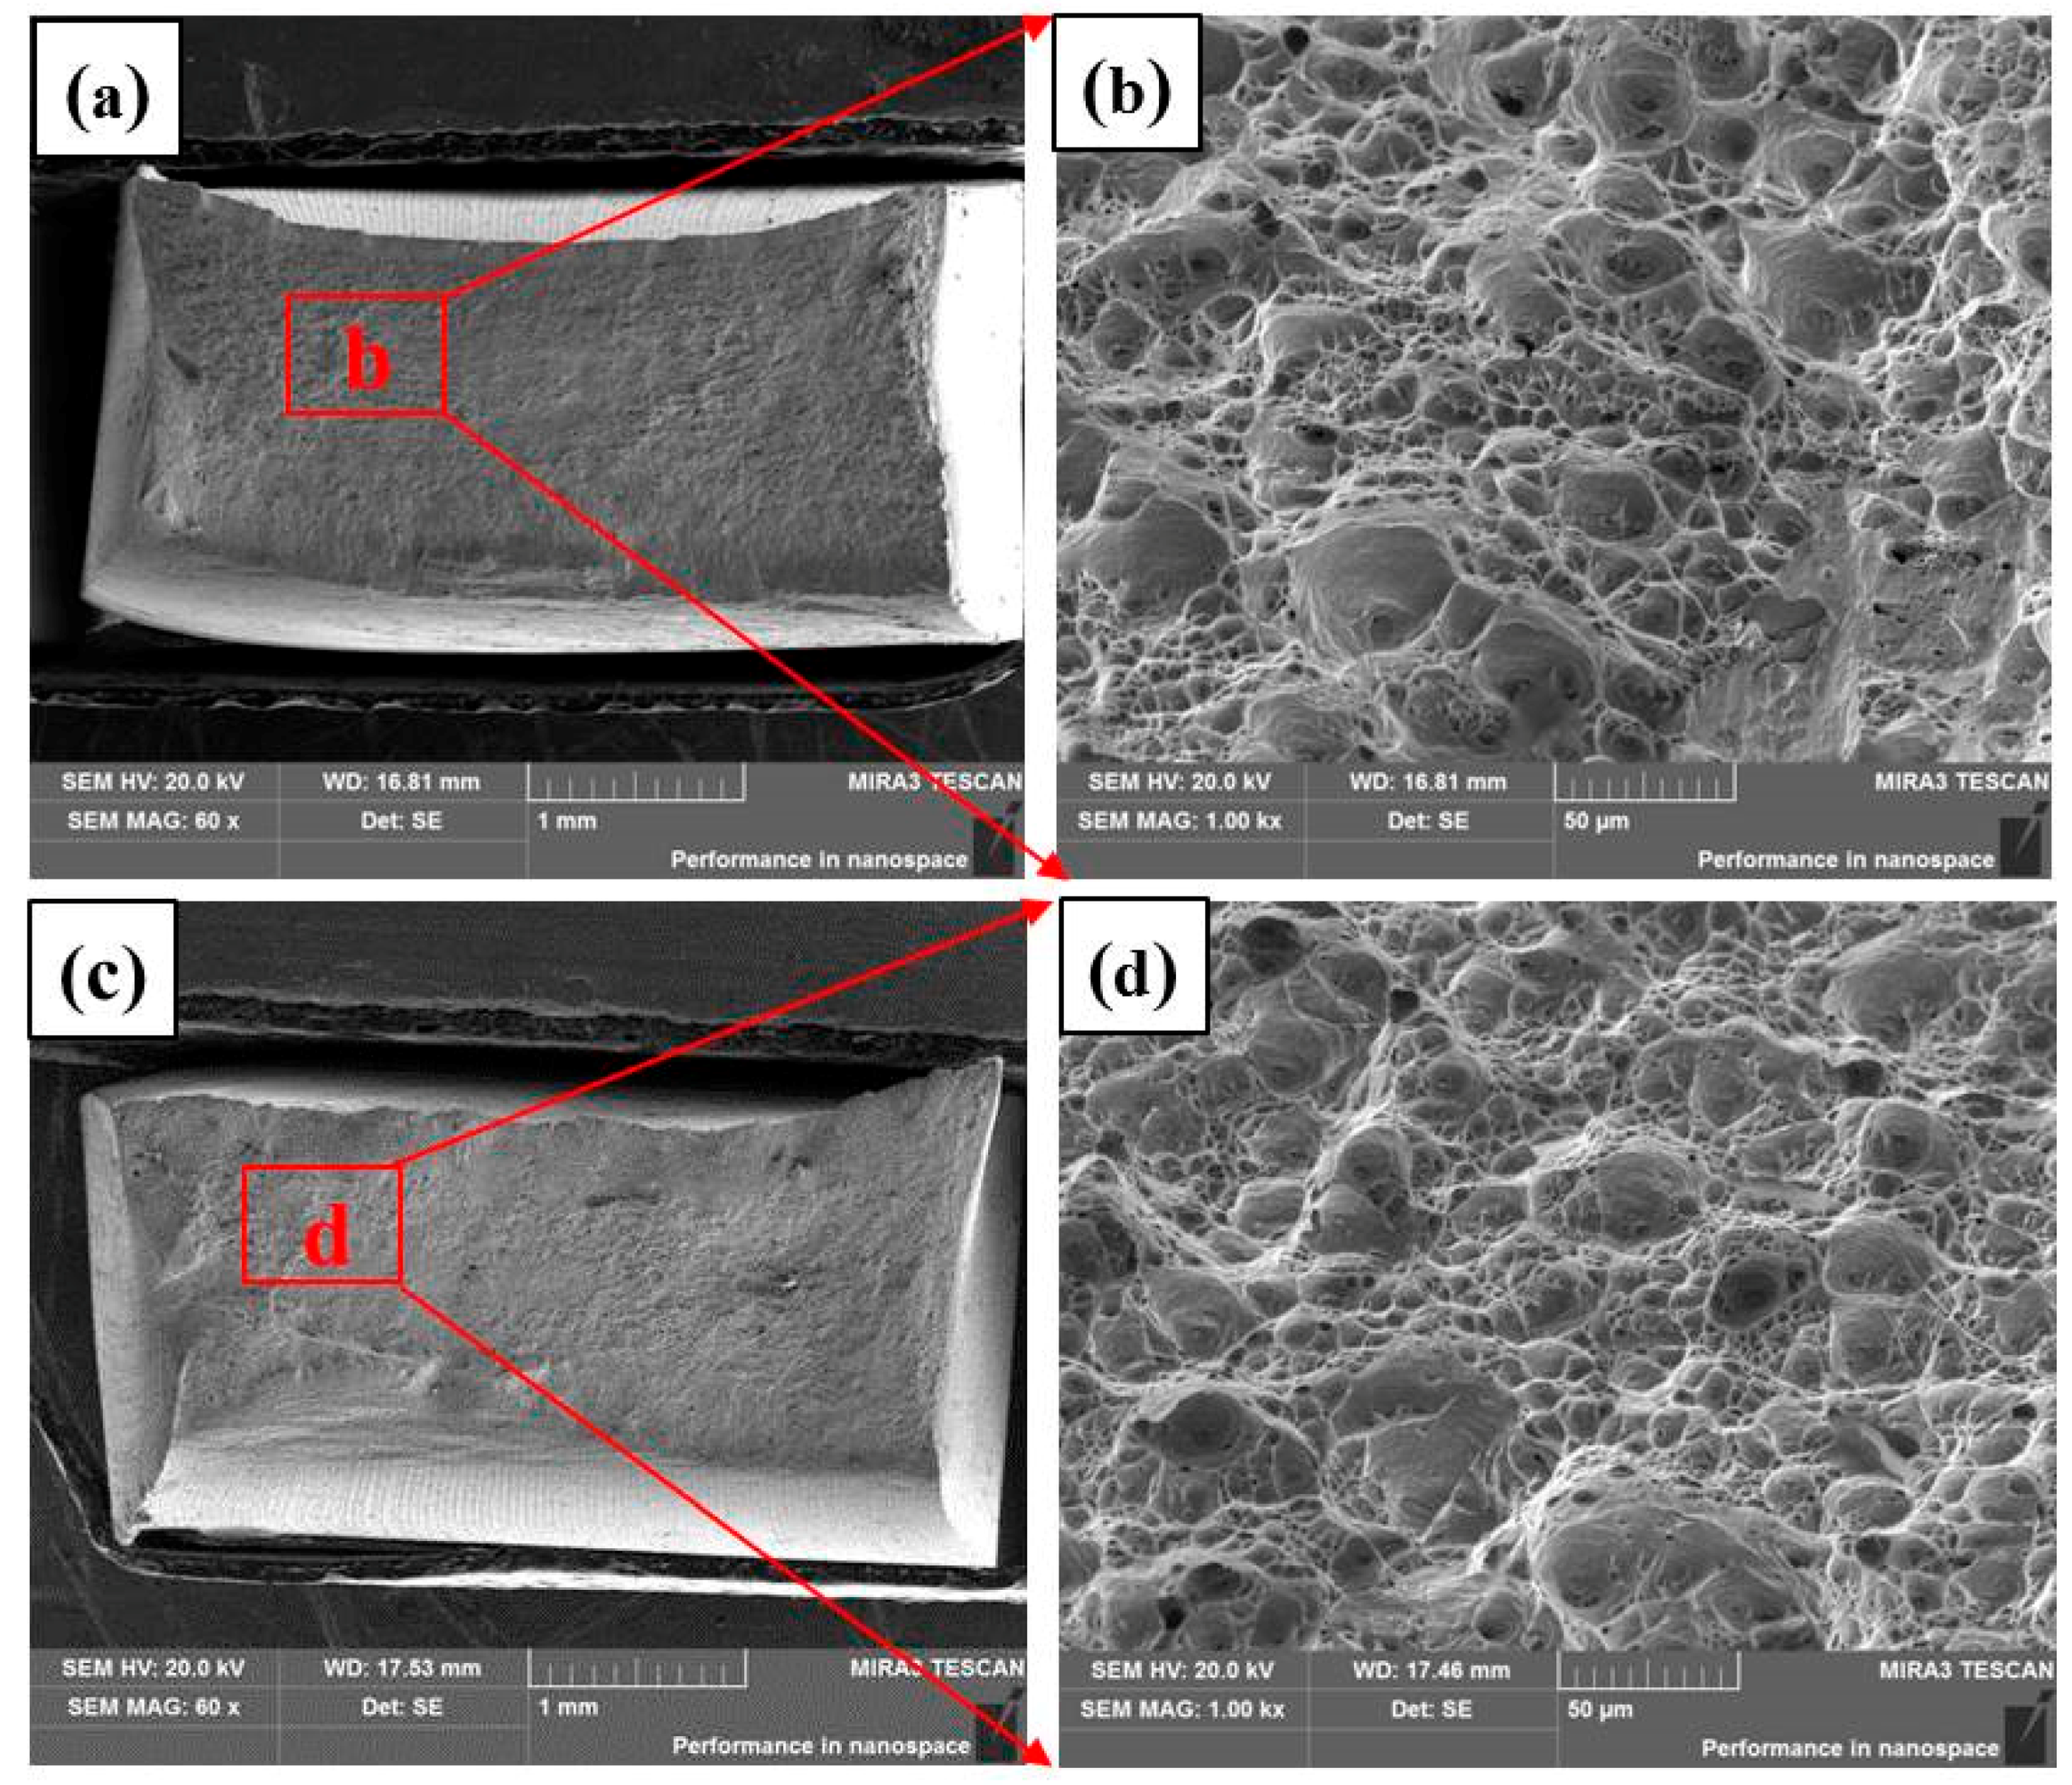
Figure 13 shows the SEM micrographs of fracture surface of the dissimilar joints with the the CuCrZr alloy or the CuNiCrSi alloy located on the AS. Figure 13a shows the fracture surface of welds with the CuCrZr alloy on the AS while Figure 13c shows that with the inverse material position. Figure 13b,d show the magnified views of selected zones in Figure 13a,c, respectively. It can be found that the fracture surfaces both consist of fine populated dimples, which confirms that the dissimilar joints fail in the ductile mode of failure. No significant difference in the fracture mechanism with different material positions. Both selected samples experience extensive plastic deformation during the process of failure in these two conditions.

4. Discussion

4.1. The Analysis of Microstructure of Dissimilar CuCrZr/CuNiCrSi Butt Joints

Figure 2 shows that the area of retreating materials in the NZ is seen to be a little bigger with the CuCrZr alloy placed on the AS. This is mainly because the higher flow stress of harder CuNiCrSi alloy. As the rotational pin starts to move through the base metals, the material in front of the pin is moved to rear side along the circular path. Zhu et al. [19] reported that both the material flow velocity and the friction force are reduced in this process. Moreover, the flow velocity and friction force of material on the rear advancing side come to the minimum. All these make it difficult for the material to move from the retreating side to the advancing side. When the CuNiCrSi alloy is located on the AS, the softer CuCrZr alloy needs to overcome bigger resistance as it is pushed to the advancing side by the rotational tool. Besides, both the velocity and friction force of CuCrZr alloy are reduced in this process. So it is difficult for CuCrZr alloy to penetrate into the advancing side. However, the results are reversed when the CuCrZr alloy is located on the AS. The area of retreating materials is larger in the NZ since it is easier for CuNiCrSi to move to the advancing side. Similar results can be found in other dissimilar friction-stir-welded joints, such as dissimilar joints of AA6061 and AA7075 [20]. They found that the material flow is more difficult when harder AA7075 was located on the AS.
Figure 3 shows the pancake-like grains in the BM are transformed into fine equiaxed grains in the NZ. It is because the dynamic recrystallization occurred in the NZ due to the thermal cycle and plastic deformation. Figure 4 shows the final grain structure of nugget zone is comprised of grains experiencing both dynamic recrystallization and partial dynamic recovery process. Su et al. [21] reported that repeated introduction of dislocations after dynamic recrystallization initiates partial recovery in the NZ, so the final grains are in state of dynamic recrystallization and partial dynamic recovery. What’s more, it is observed that sub-grains grow with dislocations absorbed into sub-boundaries in the NZ from Figure 3c,d, which means the dynamic recrystallization process is a continuous dynamic recrystallization process [22].
In Figure 5 and Figure 6, the coarse particles distributing in CuCrZr-NZ and CuNiCrSi-NZ with the CuCrZr alloy on the AS were analyzed. It is to be noted that the analyses are similar for welds with the inverse material location. From Figure 5 and Figure 6, it is seen that the coarse particles in CuCrZr-NZ are primarily consisted of Cr element while Cr and Si element mainly concentrate on coarse particles in CuNiCrSi-NZ. Actually, these coarse particles are solute-rich particles which are formed during the solidification of the alloy due to the limited solubility of Cr and Si elements in Cu matrix [23]. Obviously, these coarse particles even cannot be solved during the process of FSW. No previously related study with similar experimental results can be compared by one to one but Jha et al. [16], who studied the FSW of aged CuCrZr alloy plates, reported the relevant results, and also found coarse particles in the NZ were identified as Cr concentration, However, these coarse particles are not effective on increasing strength any more [24]. In contrast, these coarse particles may act as internal stress concentrators which make the alloy easier to fracture [25].
In Figure 7 and Figure 8, the Nano-precipitates distributing in welds with the CuCrZr alloy on the AS are studied, the results are the same in welds with the CuNiCrSi located on the AS. In Figure 7, Cr precipitates are observed in CuCrZr-BM. In fact, these Cr precipitates are found to generate from the aging process of CuCrZr alloy. These Cr precipitates can pin the movement of dislocations so that they are responsible for precipitation hardening of CuCrZr alloy [25]. From the previous studies, Jha et al. [16] also found Cr precipitates in the BM of 4-mm thick CuCrZr joints but he didn’t offer the relevant SAD pattern. Lai et al. [17] found Nano-precipitates in the BM of butt-welded CuCrZr joints and offered the relevant SAD pattern, but the SAD pattern didn’t reveal diffraction spots from fine precipitates. In contrast, Cr precipitates can also be defected in CuNiCrSi-BM but cannot be found in the relevant SAD pattern in Figure 8. It can be explained by the larger grain size of CuNiCrSi-BM as illustrated in Figure 3, which limit the choice of the diffraction conditions because only two or three grains could be examined in the visual field around the perforation [25]. Then the Cr precipitates coherent with Cu matrix are difficult to find in SAD pattern due to the limited specimen tilt. In addition to Cr precipitates, δ-Ni2Si precipitates can also be found in CuNiCrSi-BM. Similar results can also be found in previous works about CuNiCrSi alloy [26,27]. All these precipitates can improve the strength of the CuNiCrSi alloy by pinning the movement of dislocations. Figure 7 and Figure 8 shows the precipitates are dissolved in both CuNiCrSi-NZ and CuCrZr-NZ. It is because that high welding temperature and thermal cycling during FSW process can result in the dissolution of Nano-strengthening precipitates into the Cu matrix in the NZ. In general, there is always a higher demand on heat-input during the FSW process of Cu joints due to the high thermal conductivity of copper alloy. Jha et al. [16] found that the peak temperature was more than 800 °C in the friction stir welding of aged CuCrZr plates. The high heat-input in the NZ produces a supersaturated solution condition, which can result in the dissolution of strengthening precipitates into the Cu matrix in the NZ. Similar results can also be found in the friction stir welding of other precipitates hardening alloys, such as 6063 aluminum [28], 7075 aluminum [29], and thick CuCrZr plates [17].

4.2. The Relationship of Microstructure and Mechanical Characterization

From Figure 11 and Figure 12, it can be concluded that the relative material position affected both failure location and tensile strength. Tensile specimens all failed at CuCrZr-NZ when the CuNiCrSi alloy was located on the AS, as shown in Figure 12. This phenomenon can be explained from two aspects. On the one hand, the micro-hardness is lowest in CuCrZr-NZ, which means CuCrZr-NZ is the softest zone in the whole joint. On the other hand, there is a larger density of coarse particles in CuCrZr-NZ, which may make CuCrZr-NZ an originating place to fracture by acting as internal stress concentrators. However, when the CuCrZr alloy is located at the AS, the CuNiCrSi alloy on the RS are stirred to the AS easily as before mentioned, so the specimens failed at the mixed zone of CuCrZr-NZ and CuNiCrSi-NZ with inverse material position. Since the strength of CuNiCrSi alloy is higher than CuCrZr alloy, the UTS of joints with the CuCrZr alloy located at AS is a little higher than that of joints with the opposite material position.
In Figure 10 and Figure 11, both the micro-hardness and the tensile strength of joints are lower than those of two base metals. It is well-known that both the hardness distribution and tensile strength is directly dependent on the distribution of precipitates. The precipitates in CuNiCrSi-NZ and CuCrZr-NZ, which can pin the movement of dislocation and thus improve the strength of alloy, were both dissolved into Cu matrix. In this case, the dissolution of precipitates can lead to the decrease of both the micro-hardness and the tensile strength.

5. Conclusions

In the present study, the microstructure and mechanical properties of dissimilar CuNiCrSi and CuCrZr joints are investigated. The relationship between the microstructure and mechanical properties is studied as well. The following conclusions can be drawn:
(I)
Defect-free joints are obtained under the constant welding speed of 150 mm/min and constant rotational speeds of 1400 rpm. The area of retreating materials in the NZ is bigger when the CuCrZr alloy was placed on the AS.
(II)
Considerable numbers of coarse particles are found to distribute randomly in both BM and NZ. In CuCrZr-NZ, Cr solute-rich particles are detected, while concentration of Cr and Si element with larger density is found in CuNiCrSi-NZ.
(III)
The Cr and δ-Ni2Si precipitates are observed in CuNiCrSi-BM while only Cr precipitates are found in CuCrZr-BM. All these precipitates are dissolved in both CuCrZr-NZ and CuNiCrSi-NZ due to the high temperature, leading to the lower micro-hardness and tensile strength of joints when compared to base metals.
(IV)
When the CuNiCrSi alloy was located on the AS, the fracture occurred in the CuCrZr-NZ due to the existence of larger density of coarse particles. However, failure was found at the mixed zone of CuNiCrSi-NZ and CuCrZr-NZ when the CuCrZr alloy was located on AS.

Author Contributions

Diqiu He was the principle investigator of the research. Youqing Sun, Fei Xue and Ruilin Lai carried out the welding tests and characterized the microstructure of the welded samples. Youqing Sun performed mechanical tastings, hardness, fractography, and wrote the paper. Guoai He provides tremendous help on analyzing and discussing the results as well as revising the manuscript.

Funding

This research was funded by National Basic Research Program of China (2014CB046605).

Acknowledgments

This work was supported by Science and Technology Innovation Projects of graduate students of central south university (2017zzts653) and the National Basic Research Program of China (“973 Program”, 2014CB046605). Guoai He thank the supports from Scientific Research Foundation of Central South University (202045001).

Conflicts of Interest

The authors declare no conflict of interest.

References

  1. Mishnev, R.; Shakhova, I.; Belyakov, A.; Kaibyshev, R. Deformation microstructures, strengthening mechanisms, and electrical conductivity in a Cu-Cr-Zr alloy. Mater. Sci. Eng. A 2015, 629, 29–40. [Google Scholar] [CrossRef]
  2. Gholami, M.; Vesely, J.; Altenberger, I.; Kuhn, H.A.; Janecek, M.; Wollmann, M.; Wagner, L. Effects of microstructure on mechanical properties of CuNiSi alloys. J. Alloy. Compd. 2017, 696, 201–212. [Google Scholar] [CrossRef]
  3. Shueh, C.; Chan, C.K.; Chang, C.C.; Sheng, I.C. Investigation of vacuum properties of CuCrZr alloy for high-heat-load absorber. Nuclear Instrum. Methods Phys. Res. 2017, 841, 1–4. [Google Scholar] [CrossRef]
  4. Lipa, M.; Durocher, A.; Tivey, R.; Huber, T.; Schedler, B.; Weigert, J. The use of copper alloy CuCrZr as a structural material for actively cooled plasma facing and in vessel components. Fusion Eng. Des. 2005, 75, 469–473. [Google Scholar] [CrossRef]
  5. Zhang, L.J.; Bai, Q.L.; Ning, J.; Wang, A.; Yang, J.N.; Yin, X.Q.; Zhang, J.X. A comparative study on the microstructure and properties of copper joint between MIG welding and laser-MIG hybrid welding. Mater. Des. 2016, 110, 35–50. [Google Scholar] [CrossRef]
  6. Kanigalpula, P.K.C.; Pratihar, D.K.; Jha, M.N.; Derose, J.; Bapat, A.V.; Pal, A.R. Experimental investigations, input-output modeling and optimization for electron beam welding of Cu-Cr-Zr alloy plates. International J. Adv. Manuf. Technol. 2015, 85, 711–726. [Google Scholar] [CrossRef]
  7. Thomas, W.M.; Nicholas, E.; Needham, J.; Murch, M.; Temple-Smith, P.; Dawes, C. Improvements Relating to Friction Welding. Patent EP 0,653,265, 17 May 1995. [Google Scholar]
  8. Amarnath, V.; Karuppuswamy, P.; Balasubramanian, V. Comparative study of joining processes of high conductivity electrolytic tough pitch copper used in automotive industries. Int. J. Veh. Struct. Syst. 2017, 9, 1. [Google Scholar] [CrossRef]
  9. Lin, J.W.; Chang, H.C.; Wu, M.H. Comparison of mechanical properties of pure copper welded using friction stir welding and tungsten inert gas welding. J. Manuf. Process. 2014, 16, 296–304. [Google Scholar] [CrossRef]
  10. Mironov, S.; Inagaki, K.; Sato, Y.S.; Kokawa, H. Microstructural evolution of pure copper during friction-stir welding. Philos. Mag. 2015, 95, 367–381. [Google Scholar] [CrossRef]
  11. Heidarzadeh, A.; Saeid, T. Prediction of mechanical properties in friction stir welds of pure copper. Mater. Des. 2013, 52, 1077–1087. [Google Scholar] [CrossRef]
  12. Liu, H.J.; Shen, J.J.; Huang, Y.X.; Kuang, L.Y.; Liu, C.; Li, C. Effect of tool rotation rate on microstructure and mechanical properties of friction stir welded copper. Sci. Technol. Weld. Join. 2009, 14, 577–583. [Google Scholar] [CrossRef]
  13. Shen, J.J.; Liu, H.J.; Cui, F. Effect of welding speed on microstructure and mechanical properties of friction stir welded copper. Mater. Des. 2010, 31, 3937–3942. [Google Scholar] [CrossRef]
  14. Xue, P.; Xiao, B.L.; Zhang, Q.; Ma, Z.Y. Achieving friction stir welded pure copper joints with nearly equal strength to the parent metal via additional rapid cooling. Scr. Mater. 2011, 64, 1051–1054. [Google Scholar] [CrossRef]
  15. Sahlot, P.; Jha, K.; Dey, G.K.; Arora, A. Quantitative wear analysis of H13 steel tool during friction stir welding of Cu-0.8%Cr-0.1%Zr alloy. Wear 2017, 378–379, 82–89. [Google Scholar] [CrossRef]
  16. Jha, K.; Kumar, S.; Nachiket, K.; Bhanumurthy, K.; Dey, G.K. Friction Stir Welding (FSW) of Aged CuCrZr Alloy Plates. Metall. Mater. Trans. A 2018, 49, 223–234. [Google Scholar] [CrossRef]
  17. Lai, R.; He, D.; He, G.; Lin, J.; Sun, Y. Study of the Microstructure Evolution and Properties Response of a Friction-Stir-Welded Copper-Chromium-Zirconium Alloy. Metals 2017, 7, 381. [Google Scholar] [CrossRef]
  18. Akramifard, H.R.; Shamanian, M.; Sabbaghian, M.; Esmailzadeh, M. Microstructure and mechanical properties of Cu/SiC metal matrix composite fabricated via friction stir processing. Mater. Des. 2014, 54, 838–844. [Google Scholar] [CrossRef]
  19. Zhu, Y.; Chen, G.; Chen, Q.; Zhang, G.; Shi, Q. Simulation of material plastic flow driven by non-uniform friction force during friction stir welding and related defect prediction. Mater. Des. 2016, 108, 400–410. [Google Scholar] [CrossRef]
  20. Guo, J.F.; Chen, H.C.; Sun, C.N.; Bi, G.; Sun, Z.; Wei, J. Friction stir welding of dissimilar materials between AA6061 and AA7075 Al alloys effects of process parameters. Mater. Des. 2014, 56, 185–192. [Google Scholar] [CrossRef]
  21. Su, J.Q.; Nelson, T.W.; Mishra, R.; Mahoney, M. Microstructural investigation of friction stir welded 7050-T651 aluminium. Acta Mater. 2003, 51, 713–729. [Google Scholar] [CrossRef]
  22. Su, J.Q.; Nelson, T.W.; Sterling, C.J. Microstructure evolution during FSW/FSP of high strength aluminum alloys. Mater. Sci. Eng. A 2005, 405, 277–286. [Google Scholar] [CrossRef]
  23. Pang, Y.; Xia, C.; Wang, M.; Li, Z.; Xiao, Z.; Wei, H.; Sheng, X.; Jia, Y.; Chen, C. Effects of Zr and (Ni, Si) additions on properties and microstructure of Cu-Cr alloy. J. Alloy. Compd. 2014, 582, 786–792. [Google Scholar] [CrossRef]
  24. Holzwarth, U.; Pisoni, M.; Scholz, R.; Stamm, H.; Volcan, A. On the recovery of the physical and mechanical properties of a CuCrZr alloy subjected to heat treatments simulating the thermal cycle of hot isostatic pressing. J. Nuclear Mater. 2000, 279, 19–30. [Google Scholar] [CrossRef]
  25. Holzwarth, U.; Stamm, H. The precipitation behaviour of ITER-grade Cu-Cr-Zr alloy after simulating the thermal cycle of hot isostatic pressing. J. Nuclear Mater. 2000, 279, 31–45. [Google Scholar] [CrossRef]
  26. Lei, Q.; Xiao, Z.; Hu, W.; Derby, B.; Li, Z. Phase transformation behaviors and properties of a high strength Cu-Ni-Si alloy. Mater. Sci. Eng. A 2017, 697, 37–47. [Google Scholar] [CrossRef]
  27. Lockyer, S.A.; Noble, F.W. Precipitate structure in a Cu-Ni-Si alloy. J. Mater. Sci. 1994, 29, 218–226. [Google Scholar] [CrossRef]
  28. Sato, Y.S.; Kokawa, H.; Enomoto, M.; Jogan, S. Microstructural evolution of 6063 aluminum during friction-stir welding. Metall. Mater. Trans. A 1999, 30, 2429–2437. [Google Scholar] [CrossRef]
  29. Rhodes, C.G.; Mahoney, M.W.; Bingel, W.H.; Spurling, R.A.; Bampton, C.C. Effects of friction stir welding on microstructure of 7075 aluminum. Scr. Mater. 1997, 36, 69–75. [Google Scholar] [CrossRef]
Figure 1. The laboratory equipment, experimental setup, schematic presentation of friction stir welding process and dimensions of FSW tool. (a) The laboratory equipment; (b) experimental setup; (c) schematic presentation of friction stir welding process and dimensions of FSW tool.
Metals 08 00325 g001
Figure 2. The surface morphologies and the cross-section macrographs of dissimilar CuCrZr/CuNiCrSi butt joints with the CuCrZr alloy or the CuNiCrSi alloy located on the advancing side (AS).
Metals 08 00325 g002
Figure 3. The magnified grain structures of the nugget zones (NZ), base metals (BM) and the thermo-mechanically affected zone (TMAZ) with the CuCrZr alloy or the CuNiCrSi alloy located on the AS.
Metals 08 00325 g003
Figure 4. Dislocation structures and sub boundaries of grains in CuNiCrSi-NZ with the CuCrZr alloy on the AS. (a) Grains are free of dislocation; (b) Grains have high density of dislocation; (c) Dislocations are absorbed into sub-boundaries; (d) Grains are traversed by sub-boundaries.
Metals 08 00325 g004
Figure 5. EDS images showing the analyses of elemental concentration in coarse particles distributing in CuCrZr-NZ with the CuCrZr alloy on the AS. (a) Micrograph of the surface revealing the presence of coarse particles; (b) copper; (c) chromium; (d) EDS analysis revealing the elements of coarse particles.
Metals 08 00325 g005
Figure 6. EDS images showing the analyses of elemental concentration in coarse particles distributing in CuNiCrSi-NZ with the CuCrZr alloy on the AS. (a) Micrograph of the surface revealing the presence of coarse particles; (b) copper; (c) chromium; (d) silicon; (e) EDS analysis revealing the elements of coarse particles.
Metals 08 00325 g006
Figure 7. The bright field TEM micrographs as well as the relevant selected area electron diffraction (SAD) patterns of samples from CuCrZr-BM and CuCrZr-NZ with the CuCrZr alloy on the AS. (a) TEM micrographs showing the Cr precipitates in CuCrZr-BM; (b) SAD pattern of (a) in [011]Cu direction; (c) TEM micrographs showing the dissolution of precipitates in CuCrZr-NZ; (d) SAD pattern of (c) in [011]Cu direction.
Metals 08 00325 g007
Figure 8. The bright field TEM micrographs with relevant SAD patterns of samples from CuNiCrSi-BM and CuNiCrSi-NZ with the CuCrZr alloy on the AS. (a) TEM micrographs showing the Cr and -Ni2Si precipitates in CuNiCrSi-BM; (b) SAD pattern of (a) in [011]Cu direction; (c) TEM micrographs showing the -Ni2Si precipitates in CuNiCrSi-BM; (d) SAD pattern of (c) in [111]Cu direction; (e) TEM micrographs showing the dissolution of precipitates in CuNiCrSi-NZ; (f) SAD pattern of (e) in [111]Cu direction.
Metals 08 00325 g008
Figure 9. The dislocations are pinned by nano-precipitates in both CuNiCrSi-BM and CuCrZr-BM. (a) CuCrZr-BM; (b) CuNiCrSi-BM with the CuCrZr alloy on the AS.
Metals 08 00325 g009
Figure 10. The micro-hardness of dissimilar CuCrZr/CuNiCrSi joints.
Metals 08 00325 g010
Figure 11. The mechanical properties of dissimilar joints.
Metals 08 00325 g011
Figure 12. The failure locations and cross-section macrographs of tensile testing specimens with the the CuCrZr alloy or the CuNiCrSi alloy located on the AS.
Metals 08 00325 g012
Figure 13. The SEM micrographs of fracture surface of the dissimilar joints with the the CuCrZr alloy or the CuNiCrSi alloy located on the AS. (a) the fracture surfaces of welds with CuCrZr alloy on the AS; (b) the magnified view of selected zone in (a); (c) the fracture surfaces of welds with CuNiCrSi alloy on the AS; (d) the magnified view of selected zone in (c).
Metals 08 00325 g013
Table 1. The chemical compositions of CuCrZr alloy and CuNiCrSi alloy.
AlloyCuAlMgCrNiZrFeSi
CuCrZrBal0.250.10.8-0.30.090.04
CuNiCrSiBal--0.52.0-≤0.150.5
Table 2. The average grain size of different zones.
ConditionsGrain Size/µm
CuNiCrSi-BMCuNiCrSi-NZCuCrZr-BMCuCrZr-NZ
CuNiCrSi on the AS48 ± 2.51.5 ± 0.231 ± 4.10.8 ± 0.2
CuCrZr on the AS47 ± 4.21.4 ± 0.530 ± 3.60.9 ± 0.3
Table 3. The mechanical properties of base metals and dissimilar joints.
ConditionsUTS (MPa)ε (%)Failture Location
CuNiCrSi-BM725 ± 89.5 ± 1.1-
CuCrZr-BM550 ± 1011.5 ± 0.6-
CuNiCrSi on the AS405 ± 725.0 ± 0.8CuCrZr-NZ
CuCrZr on the AS450 ± 824.3 ± 0.4Mixed zone