Article

Modelling on Inclusion Motion and Entrapment during the Full Solidification in Curved Billet Caster

1
State Key Laboratory of Advanced Metallurgy, University of Science and Technology Beijing, Beijing 100083, China
2
School of Iron and Steel, Soochow University, Suzhou 215137, China
3
Liuzhou Iron & Steel Company, Ltd., Liuzhou 545002, China
*
Author to whom correspondence should be addressed.
Metals 2018, 8(5), 320; https://doi.org/10.3390/met8050320
Submission received: 12 April 2018 / Revised: 2 May 2018 / Accepted: 2 May 2018 / Published: 6 May 2018
(This article belongs to the Special Issue Continuous Casting)

Abstract

:
Inclusions entrapped by the solidifying front during continuous casting would deteriorate the properties of the final steel products. In order to investigate the inclusion motion and the entrapment during the full solidification in curved billet caster, the present work has developed a three-dimensional numerical model coupling the flow, solidification, and inclusion motion. The predicted result indicates that the inclusion distribution inside the liquid pool of the mold is not perfectly symmetrical. Furthermore, the motion and the entrapment of micro inclusions in the mold are mainly affected by the molten steel flow pattern, however, those of macro inclusions depend both on the molten steel flow pattern and the buoyancy force of the inclusions. In the curved part of the strand, macro inclusions shift to the solidifying front of the inner radius as time goes on, while the solidifying front of the outer radius cannot entrap inclusions. The distributions of inclusions smaller than 5 μm in the solidified strand are even. However, for inclusions that are larger than 5 μm, their distributions become uneven. To validate the model, measurement of the strand surface temperature and the detection of inclusions in samples obtained from a plant have been performed. Good agreement is found between the predicted and experimental results.

1. Introduction

Inclusions inside a steel matrix have a detrimental impact on the performance of steels, such as their strength, toughness, fatigability, surface appearance, etc. [1,2,3,4]. Hence, the removal of inclusions from the molten steel is a critical issue throughout the steelmaking process. In particular, continuous casting is the last opportunity for the removal of inclusions from the molten steel. Inclusions that were carried by the molten steel are injected into the continuous casting mold. It is believed that a portion of these inclusions would rise in the mold and finally be absorbed by the mold flux. However, the remainder would inevitably be entrapped by the solidifying front while they move inside the liquid pool of the strand. Therefore, an in-depth investigation on the inclusion motion, removal, and entrapment during the full solidification in a continuous casting strand is essential, and it can provide theoretical guidance for the improvement of the steel cleanliness and properties. It is very difficult to research the inclusion motion and entrapment during the continuous casting by plant measurements or physical experiments. Fortunately, numerical simulation is an appropriate method to study the inclusion motion and entrapment during the continuous casting.
In recent years, extensive research has been conducted on the particle (inclusion, bubble) behaviors during the continuous casting by method of numerical simulation [5,6,7,8,9,10,11,12,13,14,15,16,17,18,19,20,21,22,23,24,25,26,27,28,29,30,31,32,33,34,35,36,37,38,39,40,41]. Many previous studies have investigated particle behaviors in continuous casting strands using continuum [5,6] or Eulerian–Eulerian multiphase flow models [7,8,9]. Lei H. et al. [5] studied the inclusion collision-growth in a slab continuous caster using a continuum model. The spatial distributions of the inclusion volume concentration and number density were revealed. Through coupling the electromagnetic force into the continuum model, Lei H. et al. [6] investigated the effect of in-mold electromagnetic stirring (M-EMS) on the inclusion collision-coalescence and the spatial distributions in a bloom caster. Due to the M-EMS, Archimedes force and Archimedes collision were considered for inclusions in the study. Liu Z. et al. [7,8,9] used the inhomogeneous Multiple Size Group (MUSIG) model or the average bubble number density (ABND) model under the Eulerian-Eulerian framework to describe the bubbly flow in slab continuous casting.
Many researchers [10,11,12,13,14,15,16,17,18,19,20,21,22,23,24,25,26,27,28,29,30,31,32,33,34,35,36,37,38,39,40,41] have studied the particle transport (motion, removal, and entrapment) in the continuous casting strand through Lagrangian descriptions for the inclusions or argon bubbles. Liu Z. et al. [14] studied the influence of electromagnetic brake (EMBr) on the transient fluid flow and inclusion transport (motion, removal) in a slab continuous casting mold through a three-dimensional (3D) mathematic model. In the study, the transport of inclusions inside the mold was calculated employing the Lagrangian approach. The results indicated that the inclusion transport inside the mold was asymmetric. When compared with no EMBr, the removal of inclusions for the EMBr arrangement was enhanced, nevertheless, that for the flow-control mold (FCM) arrangement was reduced.
Several previous works [24,25,26,27,28,29,30,31,32,33,34,35,36,37,38,39,40,41] have researched the entrapment of particles (inclusions, argon bubbles) by the solidifying front in continuous casting strand. Liu Z. et al. [37] developed a 3D numerical model coupling the fluid flow, solidification, and inclusion motion. In order to investigate the transport of inclusion clusters, an inclusion cluster model was developed based on the fractal theory and the conservation of mass. The flow and solidification of molten steel, the motion, and the entrapment of inclusion clusters in a vertical-bending continuous casting caster were studied through the coupling model. Thomas B. et al. [38] constructed a computational model coupling turbulent fluid flow and particle transports. In addition, a particle-capture model that was based on local force balances was also coupled into the computational model. Through the coupling model, the work simulated the entrapment of slag inclusions and bubbles during the thin-slab continuous casting. This paper adopted both Reynolds Average Navier-Stokes (RANS) and Large Eddy Simulation (LES) approaches to calculate the turbulence flow field. The results indicated that, particle capture depended on factors, such as particle size and density, molten steel transverse fluid, Primary Dendrite Arm Spacing (PDAS), solidification front orientation angle, and sulfur concentration gradient. Wang S. et al. [40] investigated the influence of electromagnetic parameters on the motion and the entrapment of inclusions in FCM continuous casting strands through a coupling mathematical model. The results suggested that the region about 5 mm beneath the slab surface became cleaner, and the aggregation of inclusions were eliminated while the upper and lower magnetic fields of the FCM increased. The above works researched the particle motion and the entrapment in the mold region or a part of the continuous casting strand.
Zhang L. et al. [41] conducted a study on the inclusion entrapment in the full length of a billet caster by means of numerical simulation. In the work, the geometry model was straight throughout the computational domain. However, most of the commercial continuous casters involve a curved part. The inclusion motion and entrapment in a curved continuous casting strand may have distinctive characteristics. At present, studies about the inclusion motion and entrapment during the full solidification in a curved continuous casting strand have not been reported.
The scope of the current work was to develop a three-dimensional numerical model to investigate the inclusion motion and entrapment during the full solidification in a curved billet caster. To validate the model, measurement of the strand surface temperature and the detection of inclusions in samples that were obtained from a plant have been performed.

2. Numerical Methodology

2.1. Assumptions

In the present work, the following assumptions are made in the cause of simplifying the numerical model:
  • treating the molten steel as an incompressible Newtonian fluid;
  • the influence of the mold taper and oscillation are not considered;
  • the mold flux and the level fluctuation of the molten steel are not neglected;
  • the free surface of the mold is assumed to be adiabatic;
  • the latent heat of the solid phase transformation is negligible, only the latent heat of solidification is considered;
  • the inclusion is treated as spherical alumina inclusion, and its density is constantly 3500 kg·m−3;
  • the aggregation and breakup of inclusions are not taken into account; and,
  • the influence of inclusion motion on the flow and the heat transfer of the molten steel is ignored.

2.2. The Model Details
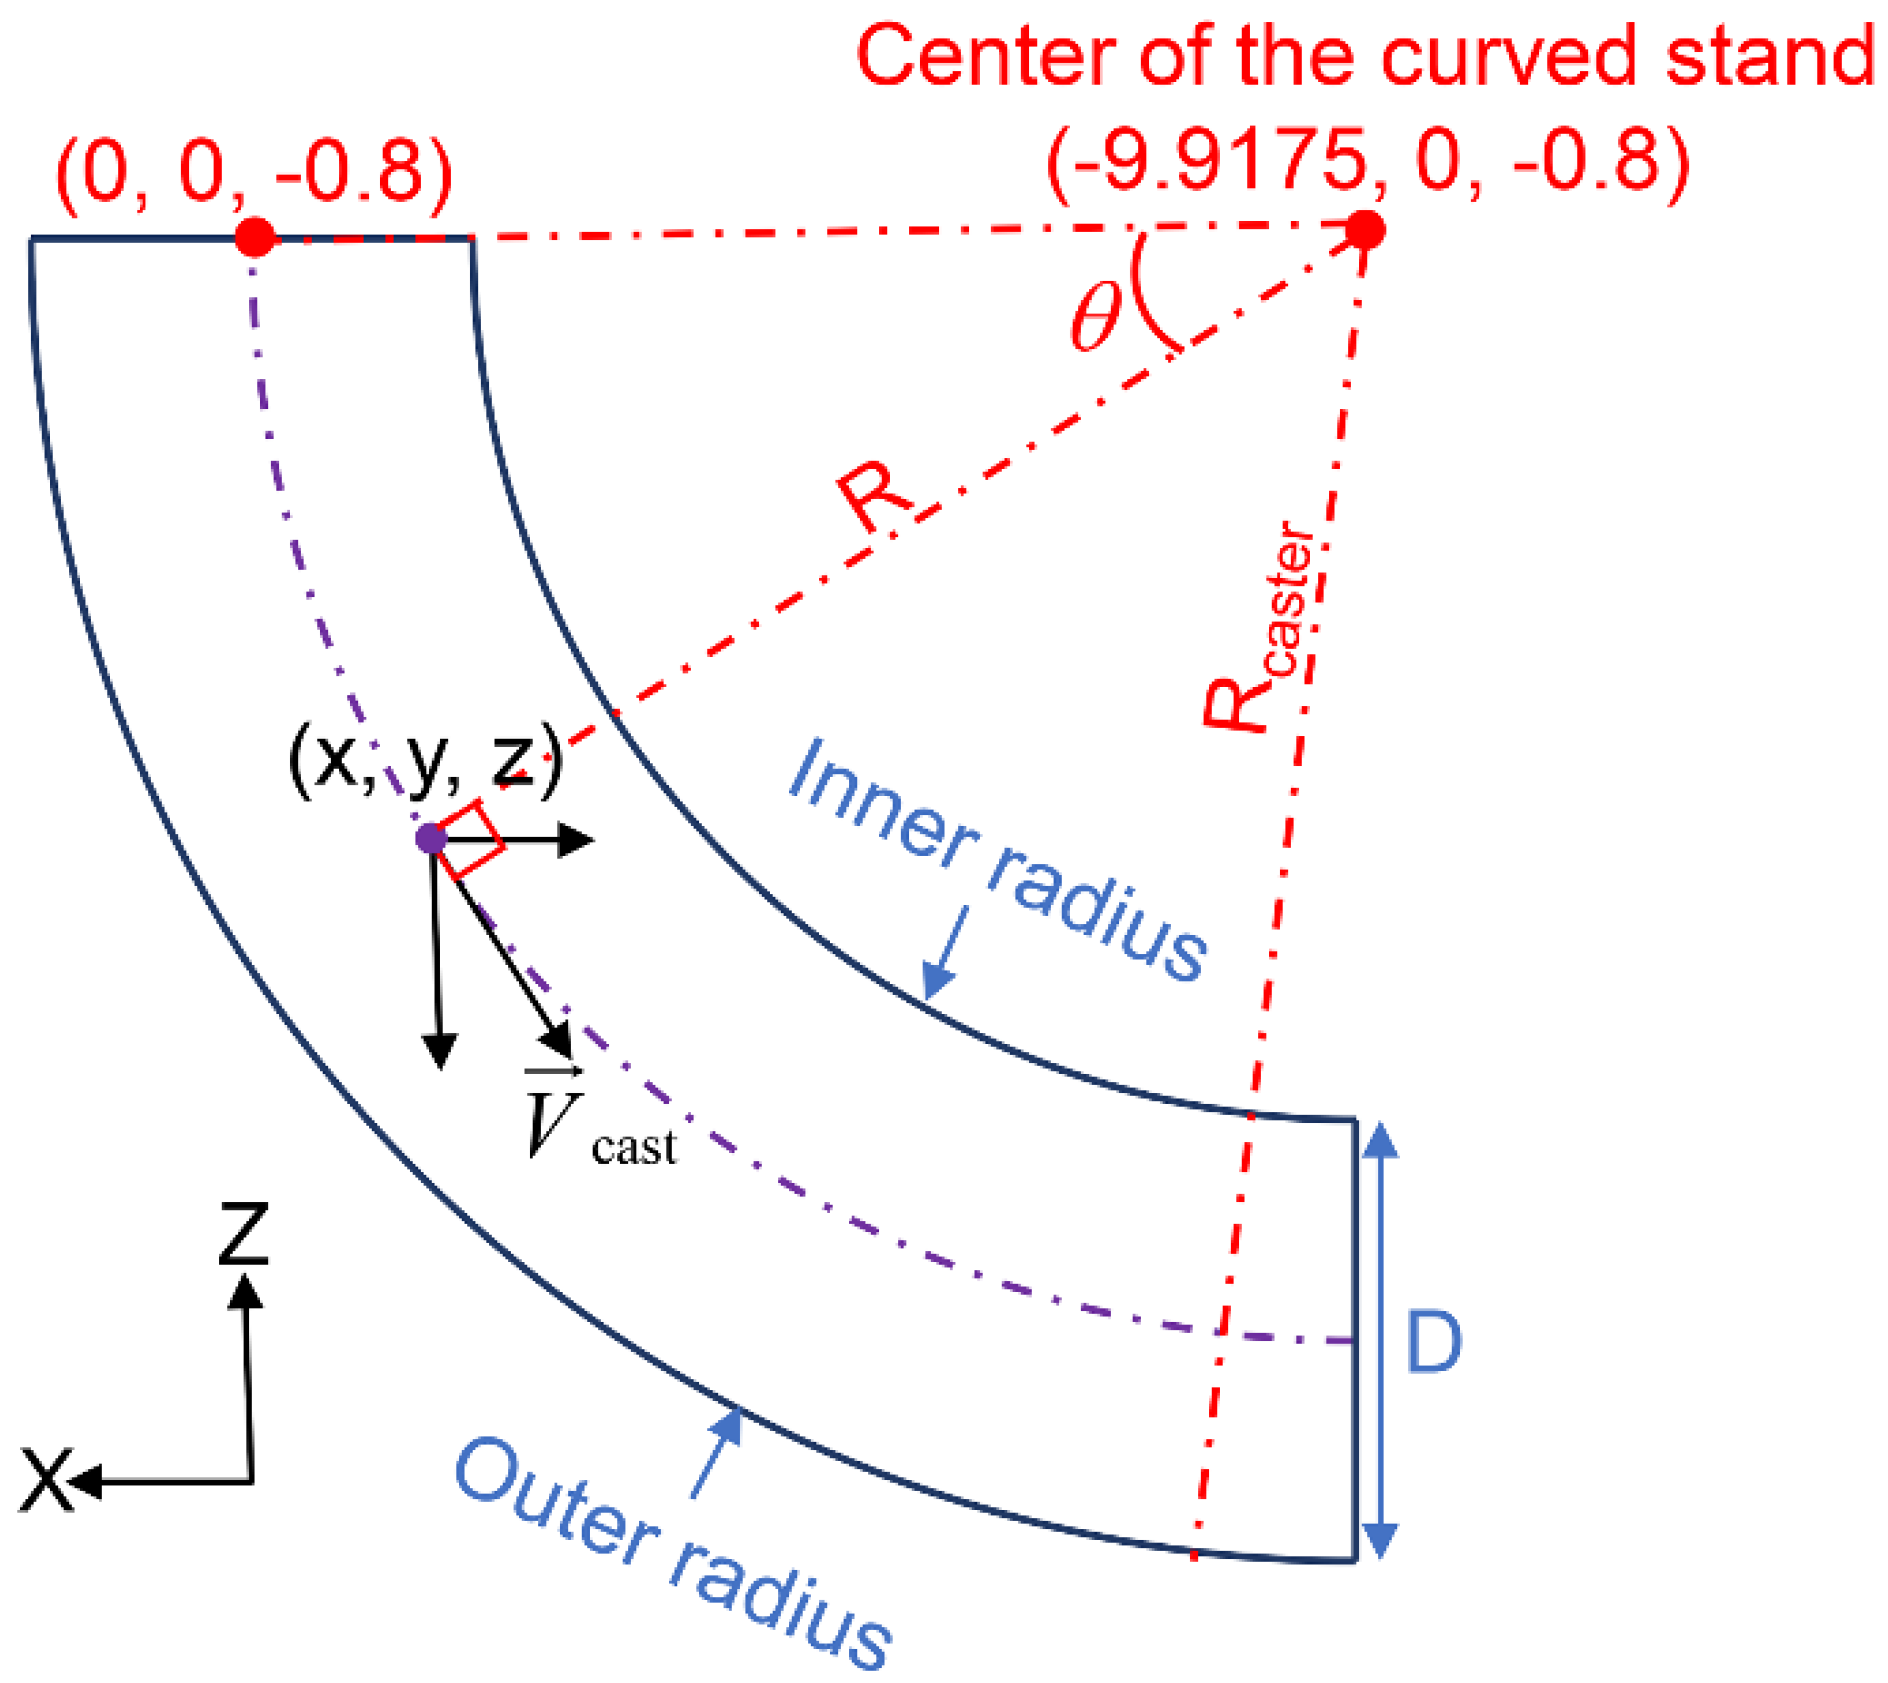
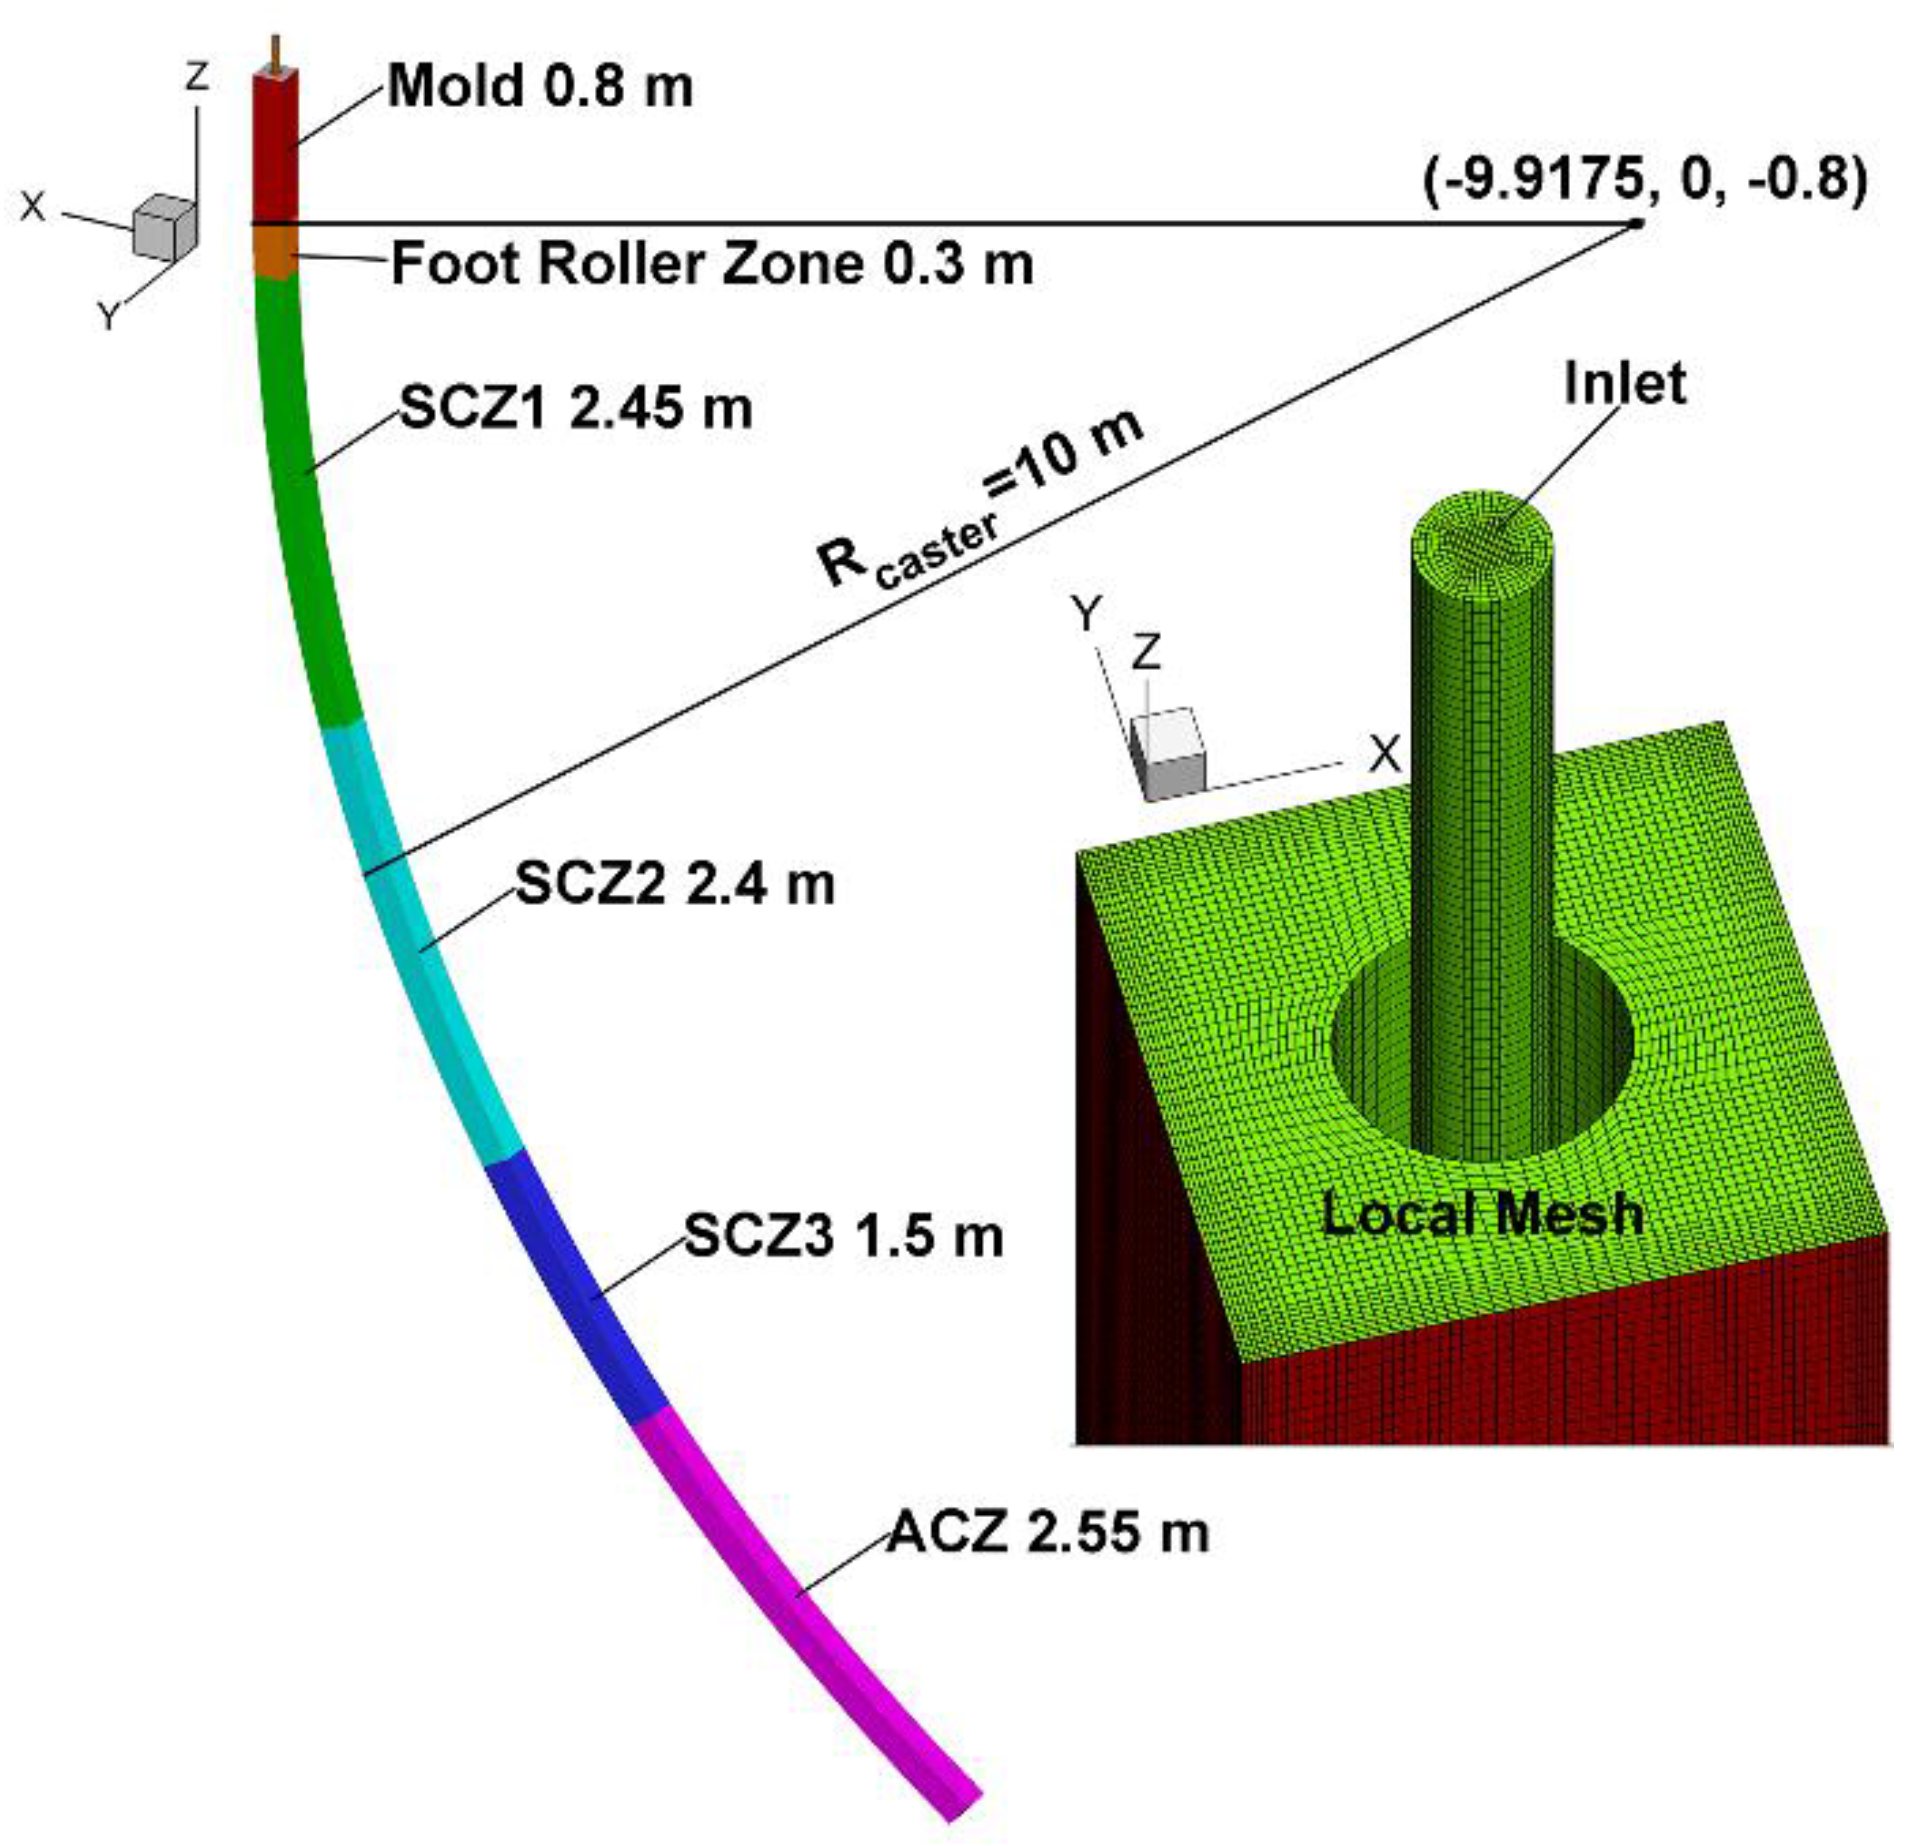
The numerical model mainly involves two parts: the flow-solidification model and the inclusion motion model. The flow-solidification model can be found in the previous work [42], moreover, the inclusion motion model can be found in the previous work [31].
In the previous work [42], to calculate the molten steel heat transfer and solidification, the enthalpy-porosity technique was employed. In the enthalpy-porosity technique, the influence of solidification on the molten steel flow velocities is considered, through introducing a source term into the momentum conservation equation of the molten steel. The source term takes the following form:
S U = ( 1 f ) f 3 + e A mush ( V V cast ) ,
where f is liquid fraction of steel, e is a small number (0.001) to prevent division by zero, and Amush is permeability coefficient. The calculation detail of Amush can be found in our previous work [42].
The casting velocity, V cast , is a constant vector in the previous work. However, owing to the curved geometry model in the present work, the casting velocity should be treated as a variable varying with position.
As shown in Figure 1, in the curved part of the strand, the direction of the casting velocity at one point is parallel to the tangent of a circle at this point. Moreover, the center of the circle coincides with the center of the curved strand. Hence, the casting speed, V cast , can be expressed in Cartesian coordinate form, as follows:
( V cast sin θ , 0 , V cast cos θ ) ,
The magnitude of casting velocity at one point can be can be calculated by Equation (3):
V cast = V center R R caster D / 2 ,
where R is the distance between the point and the caster center, Rcaster is the radius of the caster, and D is the strand thickness. Vcenter is the magnitude of the casting velocity at the strand center, which is equal to the magnitude of the strand velocity at the caster exit. In the current work, Vcenter is set as 1.65 m·min−1.

2.3. Geometry Model

As Figure 2 shows, in order to calculate the full solidification process of the billet caster, a full geometry model of the strand has been developed. The length of the computational domain is 10 m and the size of the strand cross section is 0.165 m × 0.165 m. The mold with a length of 0.8 m is vertical. The curved part of the caster initiates at the mold exit. The length of the foot roller zone (FRZ) is 0.3 m. Furthermore, the secondary cooling zone of the caster consists of three segments, which are SCZ1 (2.45 m), SCZ2 (2.4 m), and SCZ3 (1.5 m), respectively. Additionally, a part of the air cooling zone (ACZ) is involved in the computing domain, which is 2.55 m in length. The submerged entry nozzle (SEN) is a type of straight single port. The submerged depth of the SEN is 0.1 m. The inner and outer diameters of the SEN are 0.035 m and 0.075 m, respectively. To simulate the behavior of the solidified shell more accurately, the local grid refinement technology has been adopted.

2.4. Boundary Conditions

Boundary conditions for the flow-solidification simulation are set according to Dong’s work [43]. To give full consideration to a statistically representative result of the inclusion entrapment and the computer capacity, 1000 inclusions per second with a consistent size are injected randomly into the SEN from the inlet. With regard to the inclusion motion, an escape boundary condition is defined for the top surface of the mold and the computational domain outlet. Moreover, a reflecting boundary is set for the walls inside and outside the SEN. In the current work, inclusions are assumed to be entrapped by the solidified shell if the local liquid fraction is below 0.6 [39,41], and the velocities of the captured inclusions are equal to the local casting velocity. Subsequently, the inclusions entrapped by the solidified shell would move together with the solidified shell.
The Material properties used in the present work are listed in Table 1.

2.5. Numerical Procedure Details

The numerical model in the present work is solved using the CFD package OpenFOAM (Version 2.1.1). The solving process consists of two steps: first, the numerical simulation of the molten steel flow-solidification is executed for 600 s under transient mode, providing an initial condition for the second step; second, the calculation of inclusion motion coupling the molten steel flow and solidification is performed in the transient mode. With reference to the second step, the total calculation time was about 500 s, which could ensure that inclusions enter and exit the computational domain.

3. Results and Discussion

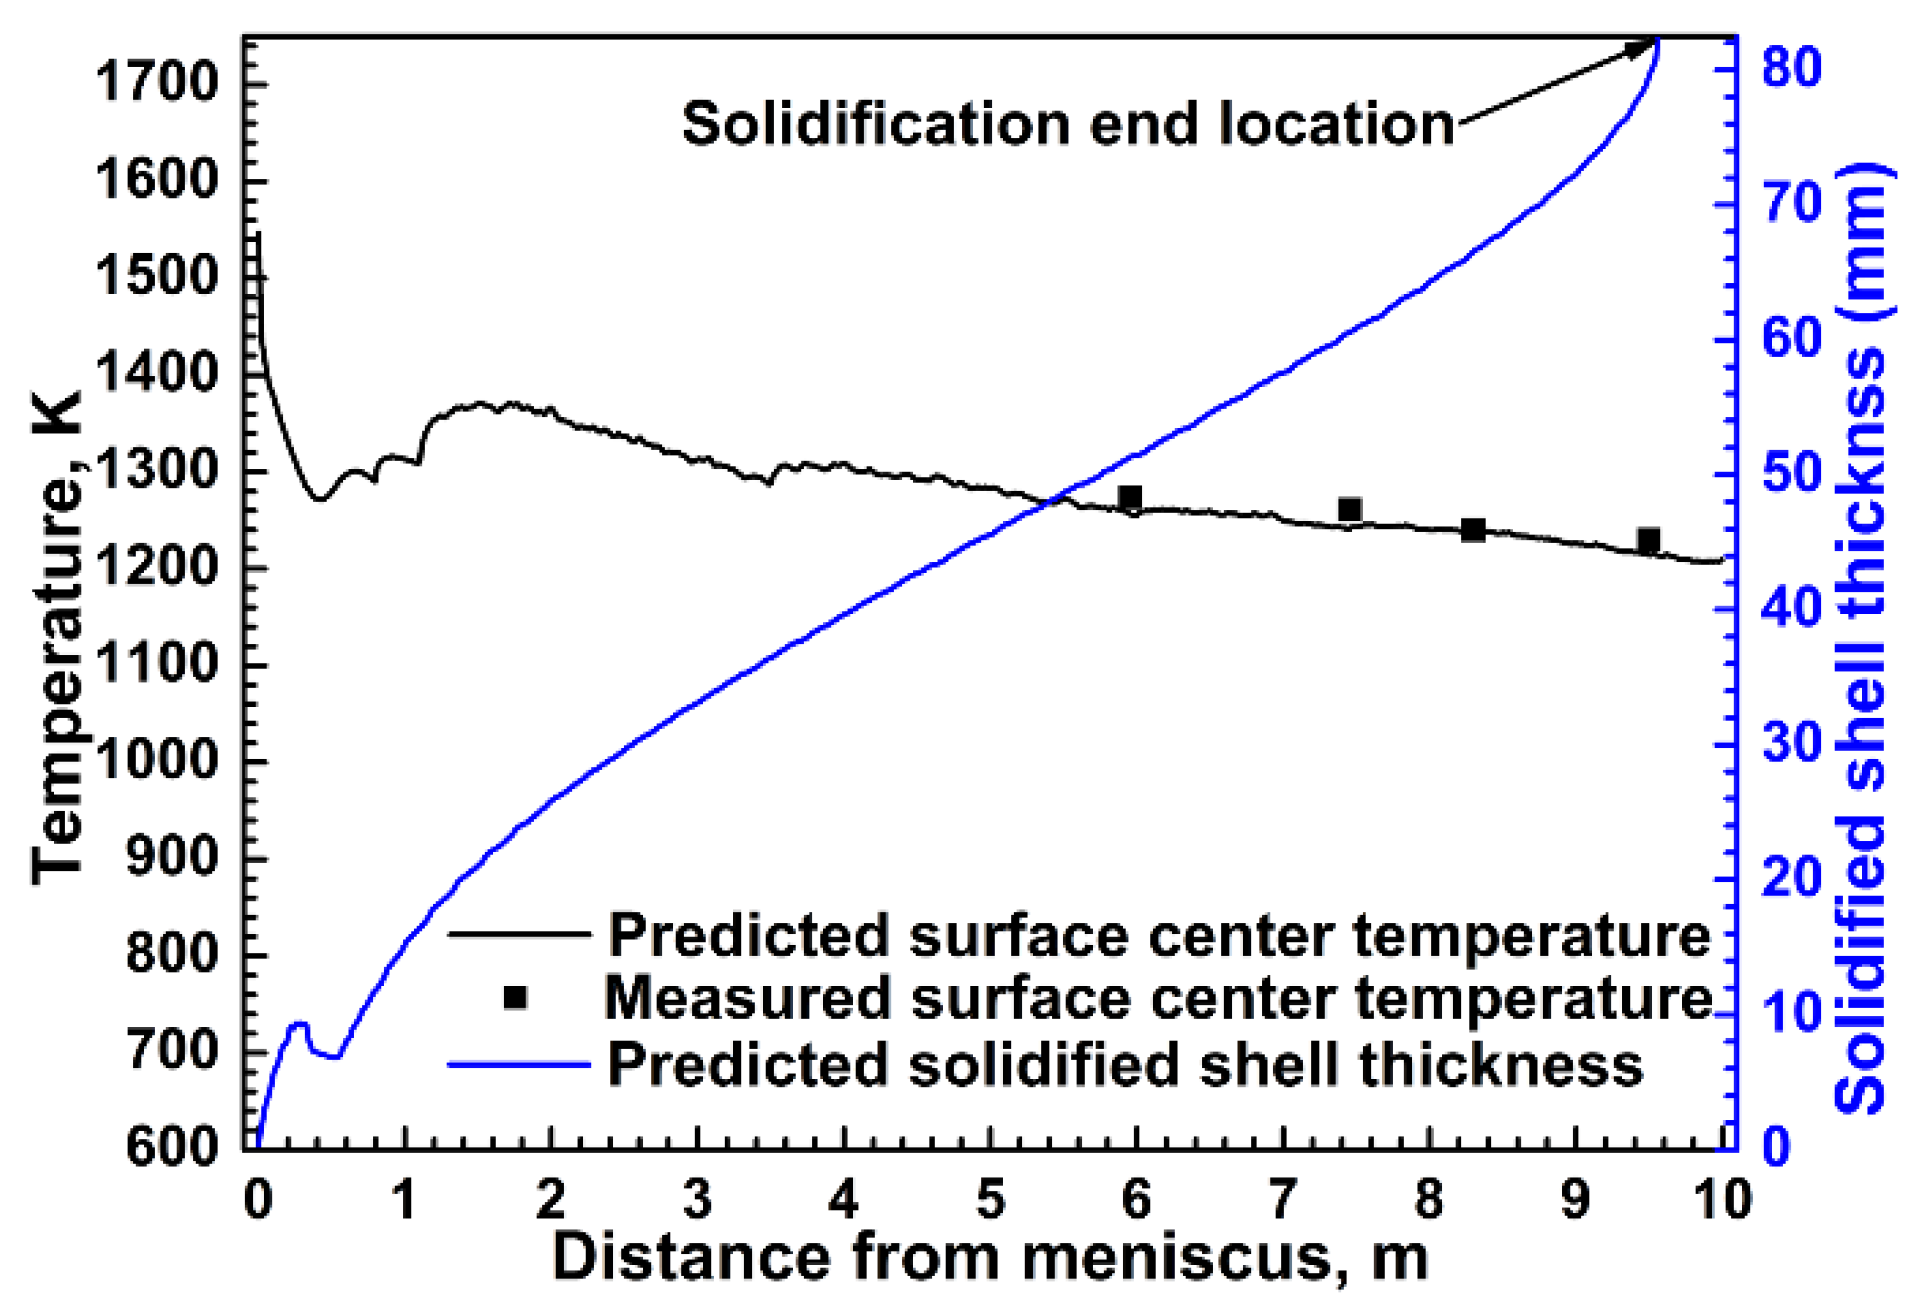
3.1. Solidification Model Validation

For the prediction of inclusion entrapment, an accurate solidification profile is of great importance. In order to validate the solidification model, four surface center temperatures of the strand were measured with infrared thermometers that were placed at the SCZ2, SCZ3, and at two positions in the ACZ. Figure 3 shows the variation of the predicted surface center temperature, which is in good agreement with the measured temperatures along the casting direction, and it therefore validates the solidification model. The solidified shell (liquid fraction: 0.6) thickness profile of the strand is also shown in Figure 3, where the predicted solidification end is located at 9.6 m below the meniscus. A re-melting zone of the solidified shell in the mold, resulting from the recirculation flow of the molten steel, will be discussed in the next section. After exiting from the mold, the thickness of the solidified shell increases with distance below the meniscus.

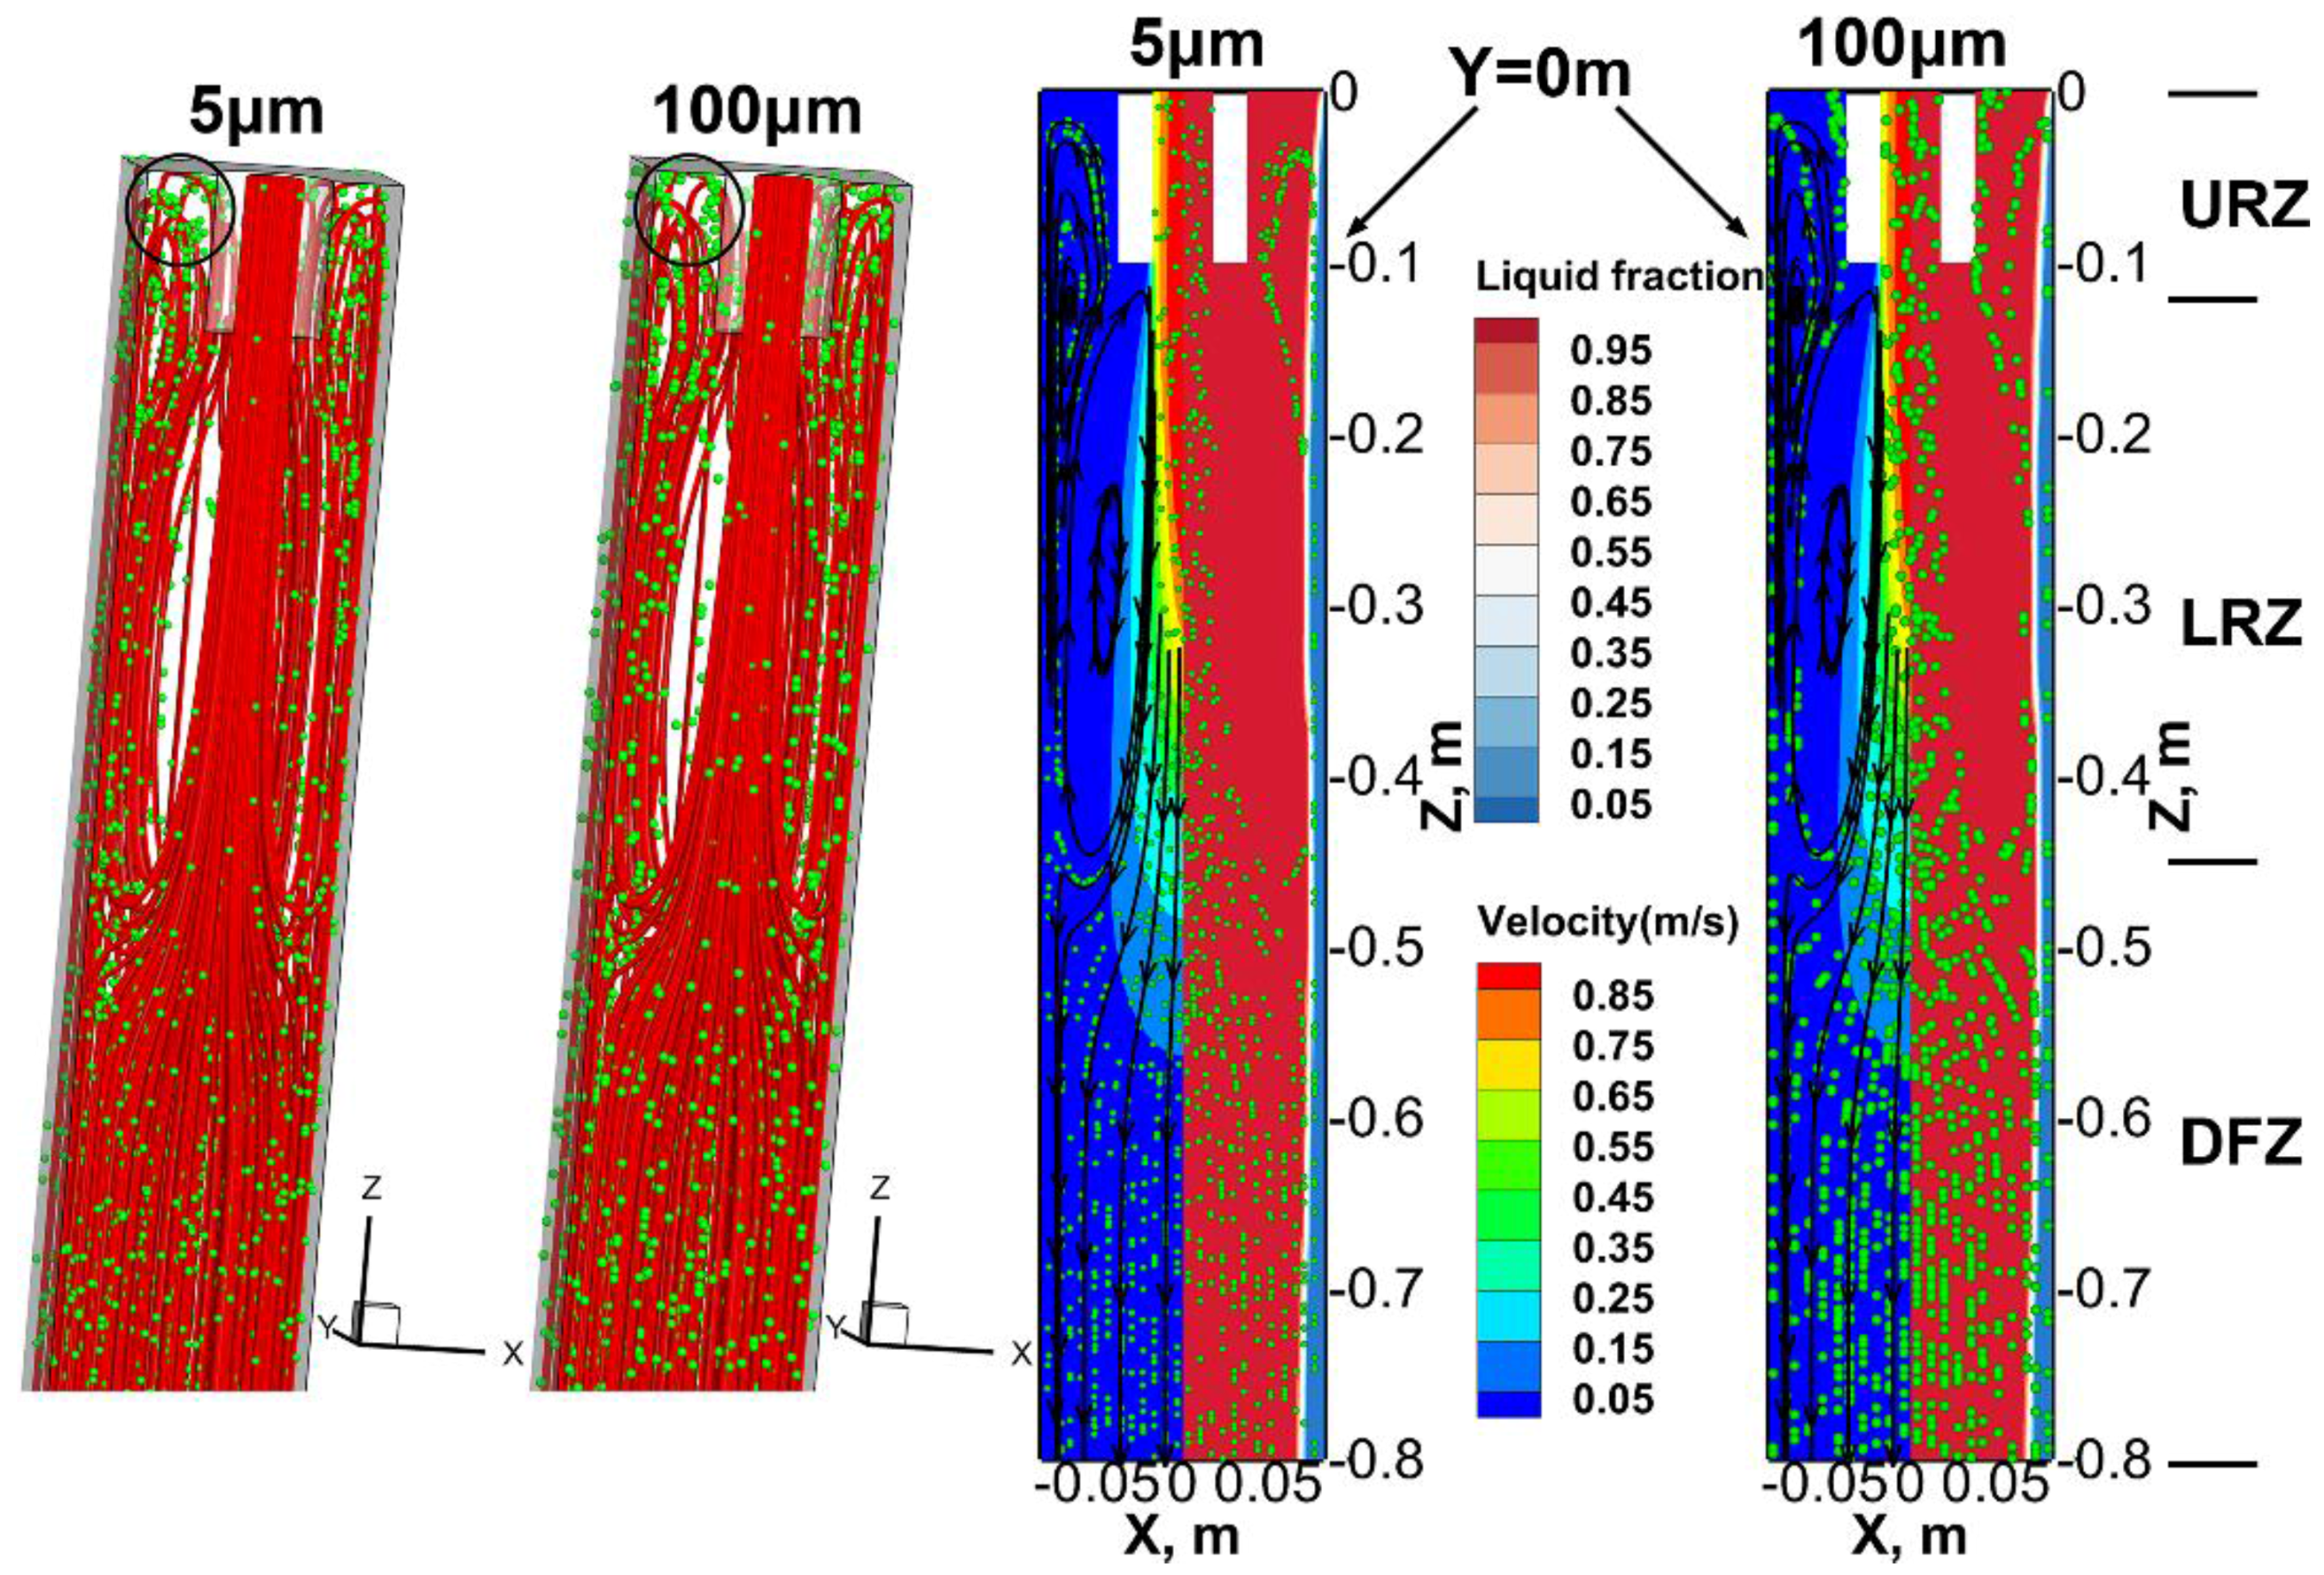
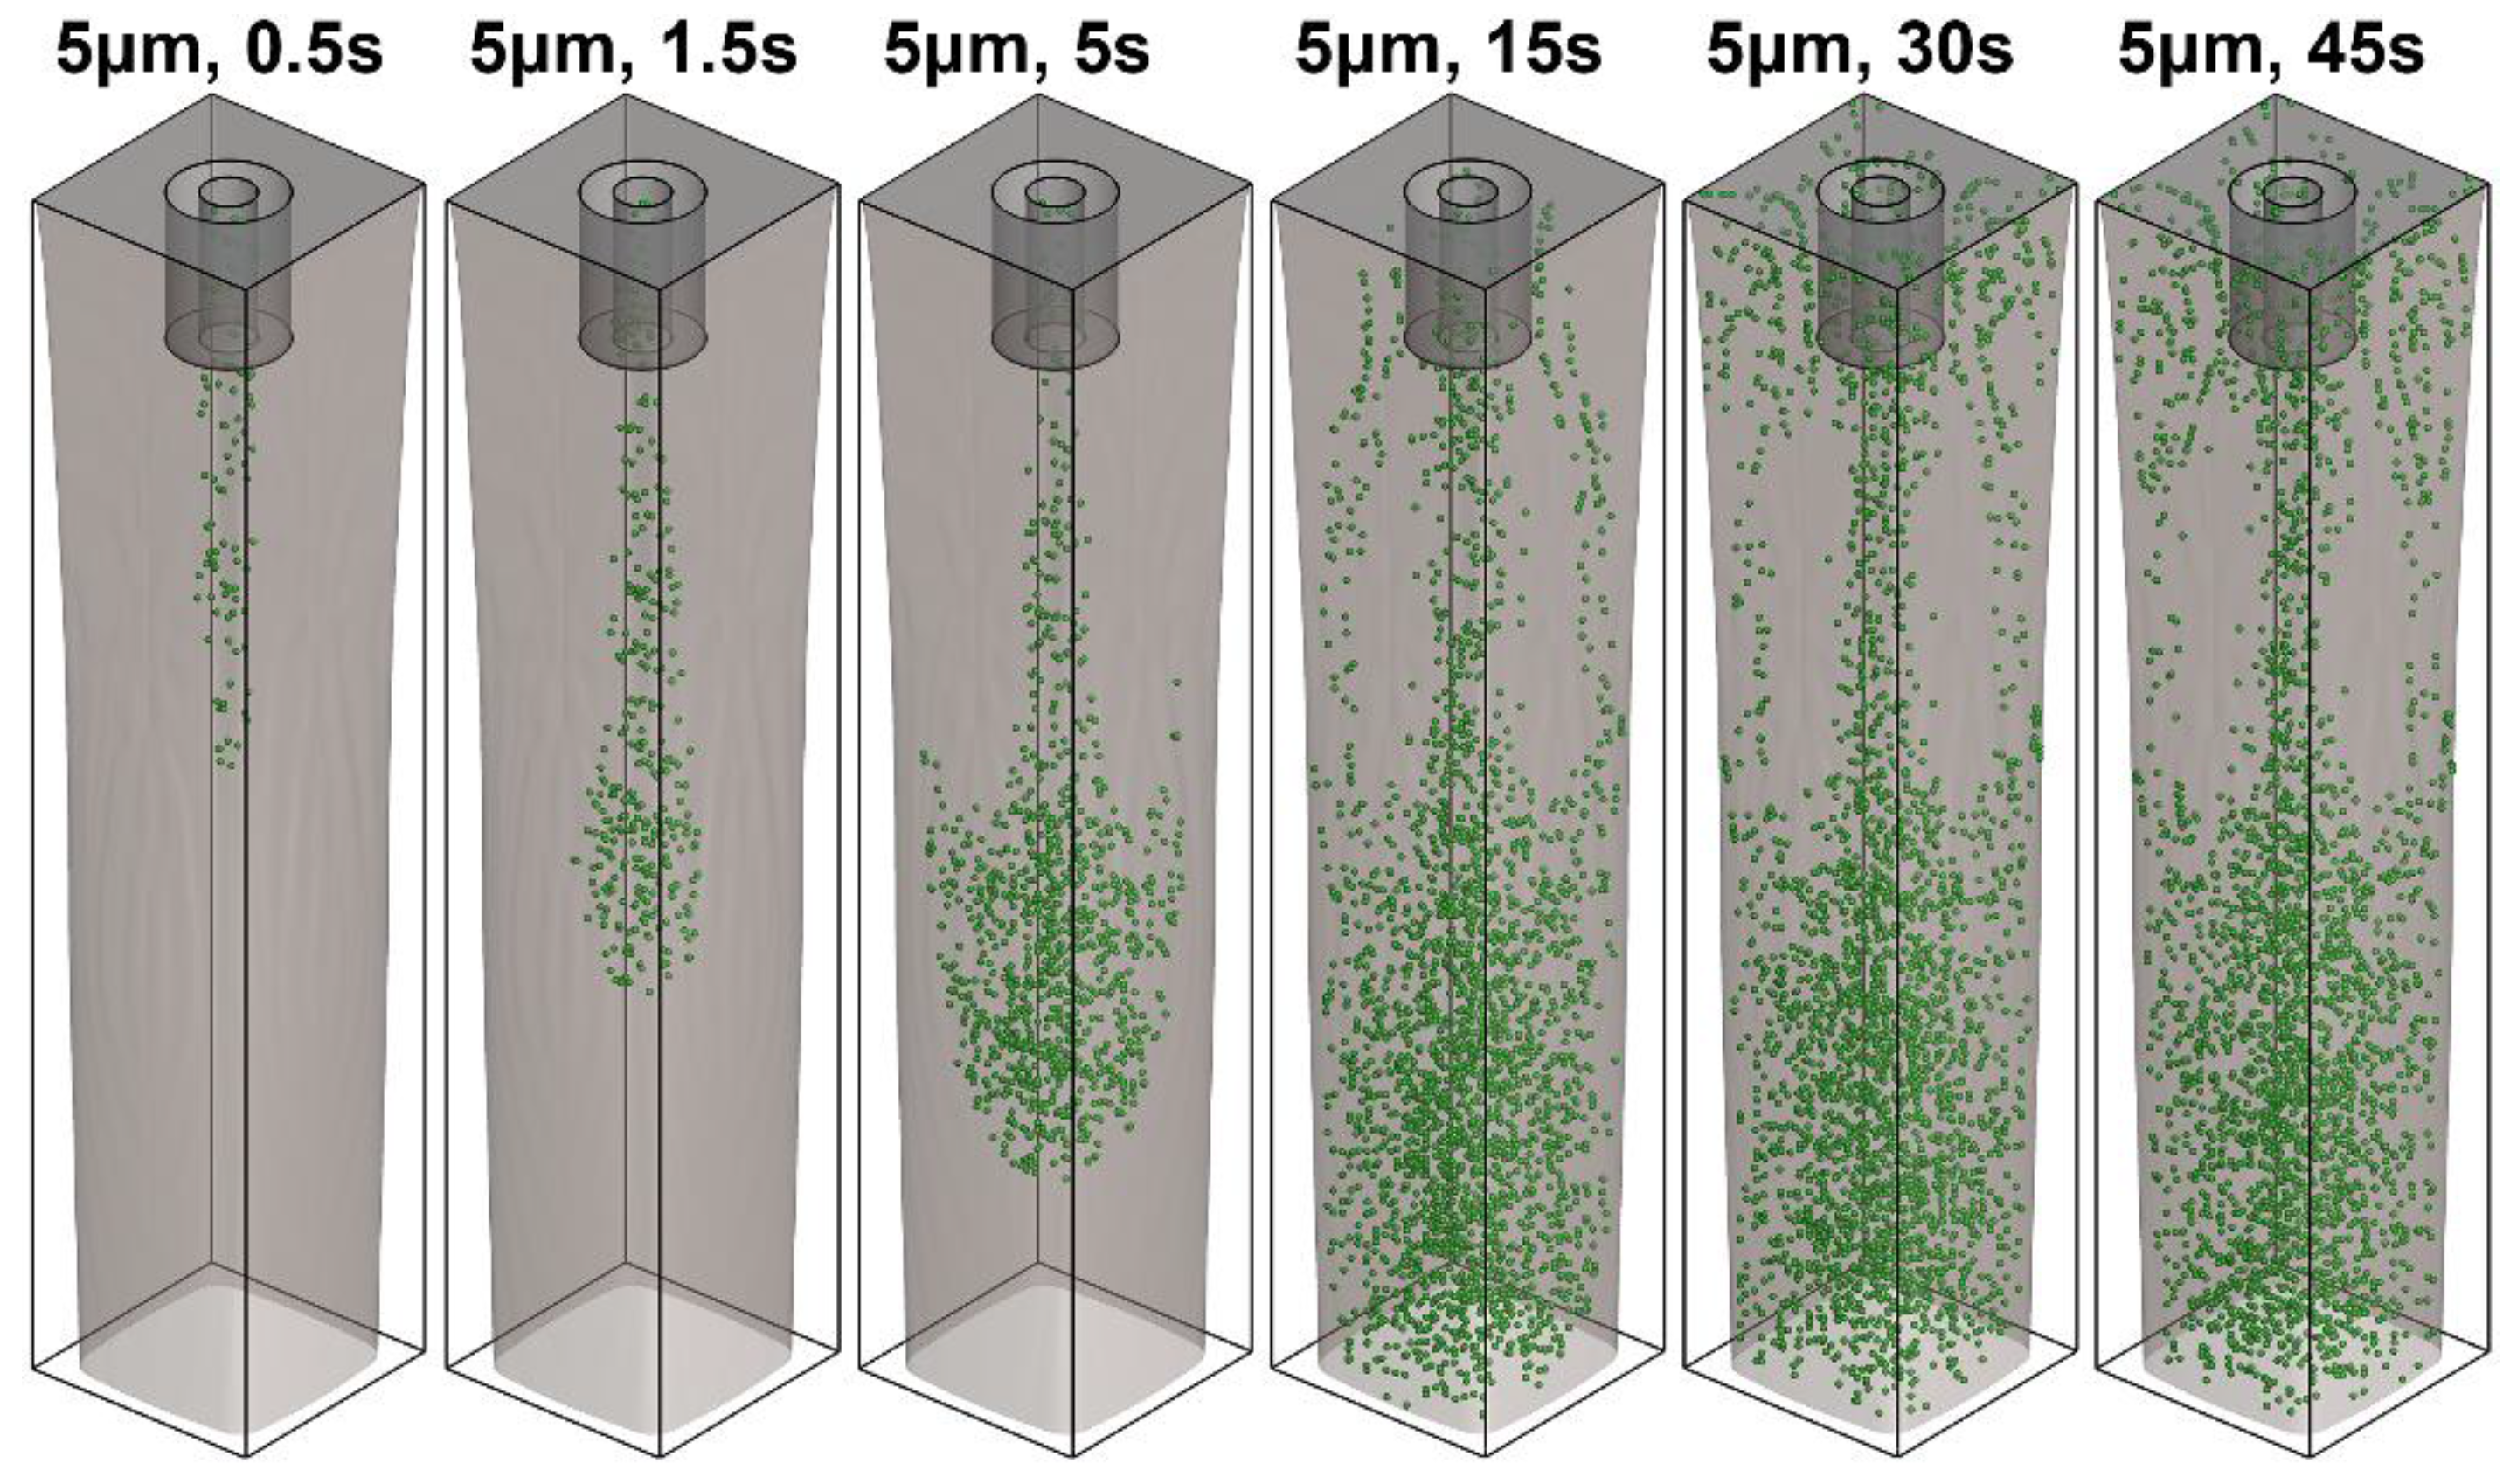
3.2. Inclusion Motion and Entrapment in Mold

Figure 4 demonstrates the distribution of 5 μm inclusions inside the liquid pool of the mold at different moments. The solidifying front is represented by the gray iso-surface of the 0.6 liquid fraction of steel. The green spheres represent inclusions. It can be observed that inclusions that are injected into the mold are carried by the strong downward molten steel jet from the SEN port, at 0.5 s and 1.5 s after injection. At 5 s after injection, the inclusion motion that is carried by the molten steel jet flow continues, while some inclusions rise. Many inclusions concentrate in the lower part of the mold as a result of the weakening jet flow. At 15 s after injection, inclusions continue concentrating in the mold lower part, and some inclusions flow out of the mold, while the number of the rising inclusions increases. The rising inclusions move close to the solidifying front, which may be entrapped by the solidified shell, and then the inclusions move toward the mold top surface along the outer wall of the SEN. At 30 s after injection, some of the inclusions rise to the mold top surface and are removed, while many inclusions are transported into the liquid pool once again, following the molten steel. At 45 s after injection, the distribution of 5 μm inclusions in the liquid pool reaches a dynamic balance. It should be mentioned that the inclusion distribution inside the liquid pool of the mold is not perfectly symmetrical, which may be attributed to the random injection of inclusions from the inlet and the effect of the molten steel turbulence.
Figure 5 presents the inclusion distribution and the molten steel 3D streamline in the mold at 50 s after injection. As revealed by the predicted 3D streamline distribution, it can be seen that the molten steel is poured into the mold from the SEN port, leading to an impinging jet flow. A part of the poured molten steel flows straight downward and it exits the mold. However, the remainder flows upward along the solidified shell and creates an obvious recirculation flow zone (lower recirculation zone, LRZ) around the impinging jet in the upper zone of the mold. Subsequently, the molten steel flows toward the outer wall of the SEN, resulting in a relatively small recirculation zone (upper recirculation zone, URZ) around the SEN. It is the flow characteristic of the molten steel in the mold that leads to the transient motion and distribution of inclusions, as seen in Figure 4.
Figure 5 also shows the predicted two-dimensional (2D) molten steel streamline and contour plots of liquid fraction and velocity on the Y = 0 m plane in the mold at 50 s after injection. In addition, the inclusion distribution on the Y = 0 m plane, which is obtained by means of projecting the positions of inclusions between the Y = −0.005 m and the Y = 0.005 m planes onto the Y = 0 m plane, can be seen in Figure 5. The velocity magnitude of the molten steel in the impinging jet zone is obviously larger than that in other zones. Moreover, the velocity magnitude in the impinging jet zone decreases as the distance from the SEN port. The velocity magnitude of the molten steel becomes uniform at the mold lower region (downward flow zone, DFZ). Through the combination of the streamlines, liquid fraction contour plot, and the inclusion distribution on the Y = 0 m plane, it can be seen that inclusions that were carried by the downward molten steel would be entrapped by the solidifying front at the DFZ. Additionally, the lower recirculation flow of the molten steel leads to the solidified shell re-melting and inclusion entrapment. Similarly, at the URZ, the molten steel recirculation flow can also carry the inclusions to the solidifying front and make the inclusions be entrapped by the solidified shell.
At 50 s after injection, the 3D distribution of 5 μm inclusions has reached a dynamic balance. The 3D distribution of 100 μm inclusions in the mold has also achieved a dynamic balance. The inclusion distributions of the two size classes are similar, except at the black circle zone, where more inclusions in 100 μm rise to the top surface of the mold and are removed. The phenomenon is clearer on the Y = 0 m plane. Furthermore, the entrapping position of 100 μm inclusions is higher than that of 5 μm inclusions in the URZ. The entrapping positions of 100 μm inclusions at the DFZ and the LRZ are also relatively higher than those of the 5 μm inclusions. It is assumed that this is due to the buoyancy force of the inclusions.
The predicted initial entrapment positions of inclusions with different sizes in the mold reveal that the larger inclusions are closer to the billet surface (Figure 6). This is because the entrapping positions of larger inclusions are higher than those of the smaller inclusions in the URZ with the effect of the buoyancy force. A higher entrapping position of inclusions in the URZ indicates that these inclusions are entrapped by a thinner solidified shell. Figure 6 also shows the variation of the predicted removal ratio of the inclusions with different sizes from the mold top surface with time. It can be seen from the predicted result that the removal ratios of the micro inclusions (<= 25 μm) are apparently small, compared with those of the macro inclusions (>= 50 μm). It is concluded that the motion and the entrapment of micro inclusions in the mold are mainly affected by the molten steel flow pattern, since the buoyancy force of micro inclusions is negligible. However, the motion and the entrapment of macro inclusions in the mold depend both on the molten steel flow pattern and the buoyancy force.

3.3. Inclusion Motion and Entrapment in the Curved Part of the Strand

Figure 7 shows the distributions of 100 μm inclusions inside the liquid pool of the curved part of the strand at different times. The solidifying front is represented by the gray iso-surface of the 0.6 liquid fraction of steel. The green spheres represent inclusions. At 25 s after injection, the inclusions move into the FRZ, which is carried by the molten steel. At 50 s after injection, the inclusions move into the SCZ1. It is interesting to note that 100 μm inclusions shift to the solidifying front of the inner radius in the curved part of the strand as time goes on, while the solidifying front of the outer radius cannot entrap the inclusions. At 150 s after injection, the entrapment 100 μm inclusions terminates at the solidifying front of the inner radius.
In order to analyze the statistical entrapment positions of macro inclusions along the casting direction at 400 s after injection, the computational domains between the meniscus and the solidification end (9.6 m below the meniscus) are divided into 12 equal zones, respectively. Figure 8 shows the predicted entrapment ratios of the macro inclusions along the casting direction, and additionally, the terminal entrapment positions of 50 μm, 100 μm, and 200 μm inclusions at 400 s after injection. The entrapment ratio of the 100 μm inclusion decreases first, increases later, and then decreases to zero in the curved part of the strand. In addition, the entrapment ratio of the 100 μm inclusions reaches its peak value at the region of 2.4–3.2 m below the mold top surface. Moreover, the entrapment of the 100 μm inclusions terminates at the inner radius solidifying front at about 3.3 m below the meniscus. It is assumed that the flow pattern in the mold and the buoyancy force of inclusions lead to this phenomenon. A strong impinging jet flow of the molten steel is created by the straight port SEN, resulting in many inclusions being transported into the curved part of the strand and then being entrapped by the local solidifying front. The buoyancy force leads to a deviation of the inclusion motion to the inner radius in the curved part of the strand. This phenomenon is more notable for 200 µm inclusions, as the buoyancy force of these inclusions is larger (Figure 8). This also explains why the entrapment of 50 µm inclusions terminates at a lower position under the meniscus.

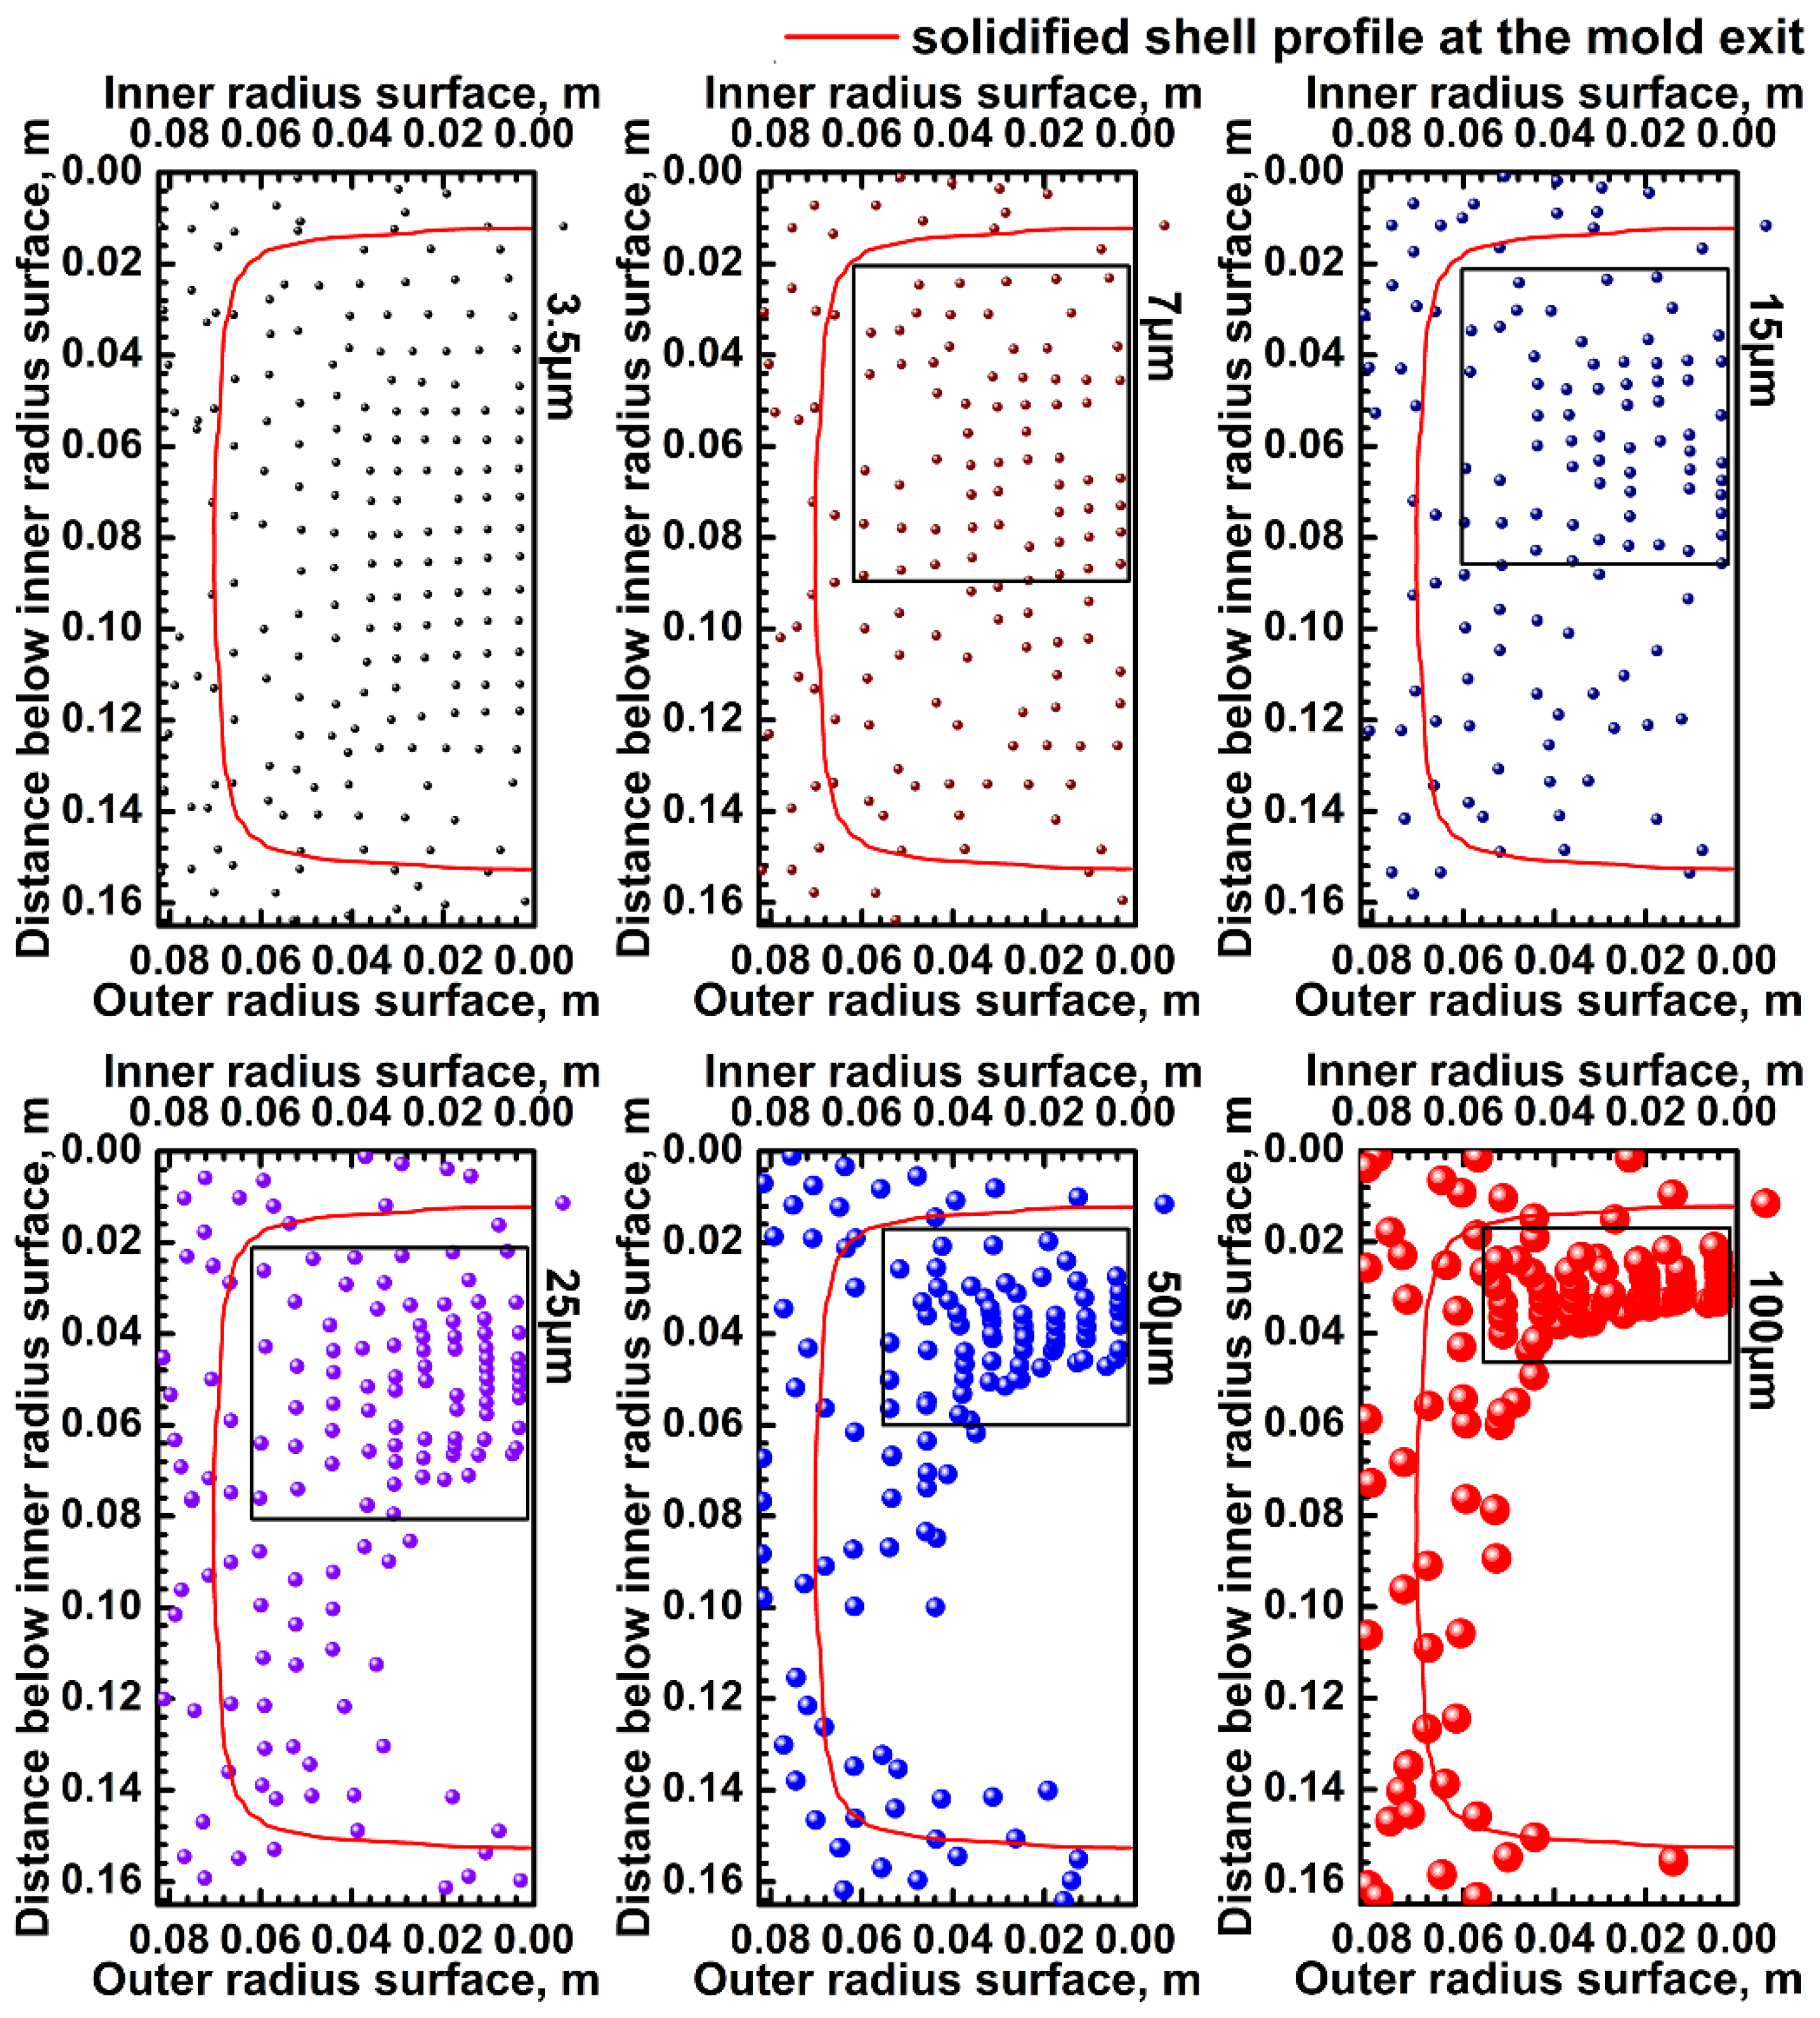
3.4. Inclusion Distribution in the Solidified Stand

Due to the shift of the macro inclusions to the solidifying front of the inner radius while they move inside the liquid pool of the curved strand, an uneven distribution of the macro inclusions may exist in the solidified strand. Figure 9 presents the distribution of inclusions on the cross section of the solidified strand, through projecting the positions of inclusions of each size class in the region of 9.6–10 m below the meniscus at 500 s onto a plane. Rectangles were used in order to indicate the approximate concentrating zone of inclusions. Inclusions that are inside the solidified shell profile at the mold exit indicate that they are entrapped in the curved part of the strand. It can be observed that the distribution of 3.5 μm inclusions in the solidified strand is uniform. However, the distribution of 7 μm inclusions in the solidified strand becomes inhomogeneous. The aggregation of 7 μm inclusions is found between the billet center and the inner radius. Furthermore, with the increase of the inclusion diameter, the aggregation is intensified, and the inclusions are closer to the inner radius.
In order to analyze the uneven distributions of inclusions in the solidified strand, a 15 mm thick zone in the center of the solidified strand has been selected (Figure 10). The positions of inclusions in each size class in the analysis zone have been gathered, and the median of the distances of these inclusions that are below the inner radius have been calculated. Moreover, a statistical parameter, coefficient of skewness, has been adopted to evaluate the distribution inhomogeneity of inclusions. To a certain extent, the distribution inhomogeneity of inclusions in the solidified strand can be reflected by the median and coefficient of skewness. The distributions of 3.5 μm and 5 μm inclusions in the solidified strand are even. However, for inclusions that are larger than 5 μm, the distributions become uneven. Furthermore, through the coefficient of skewness, it can be found that the inhomogeneity is enhanced with the increase of the inclusion diameter.

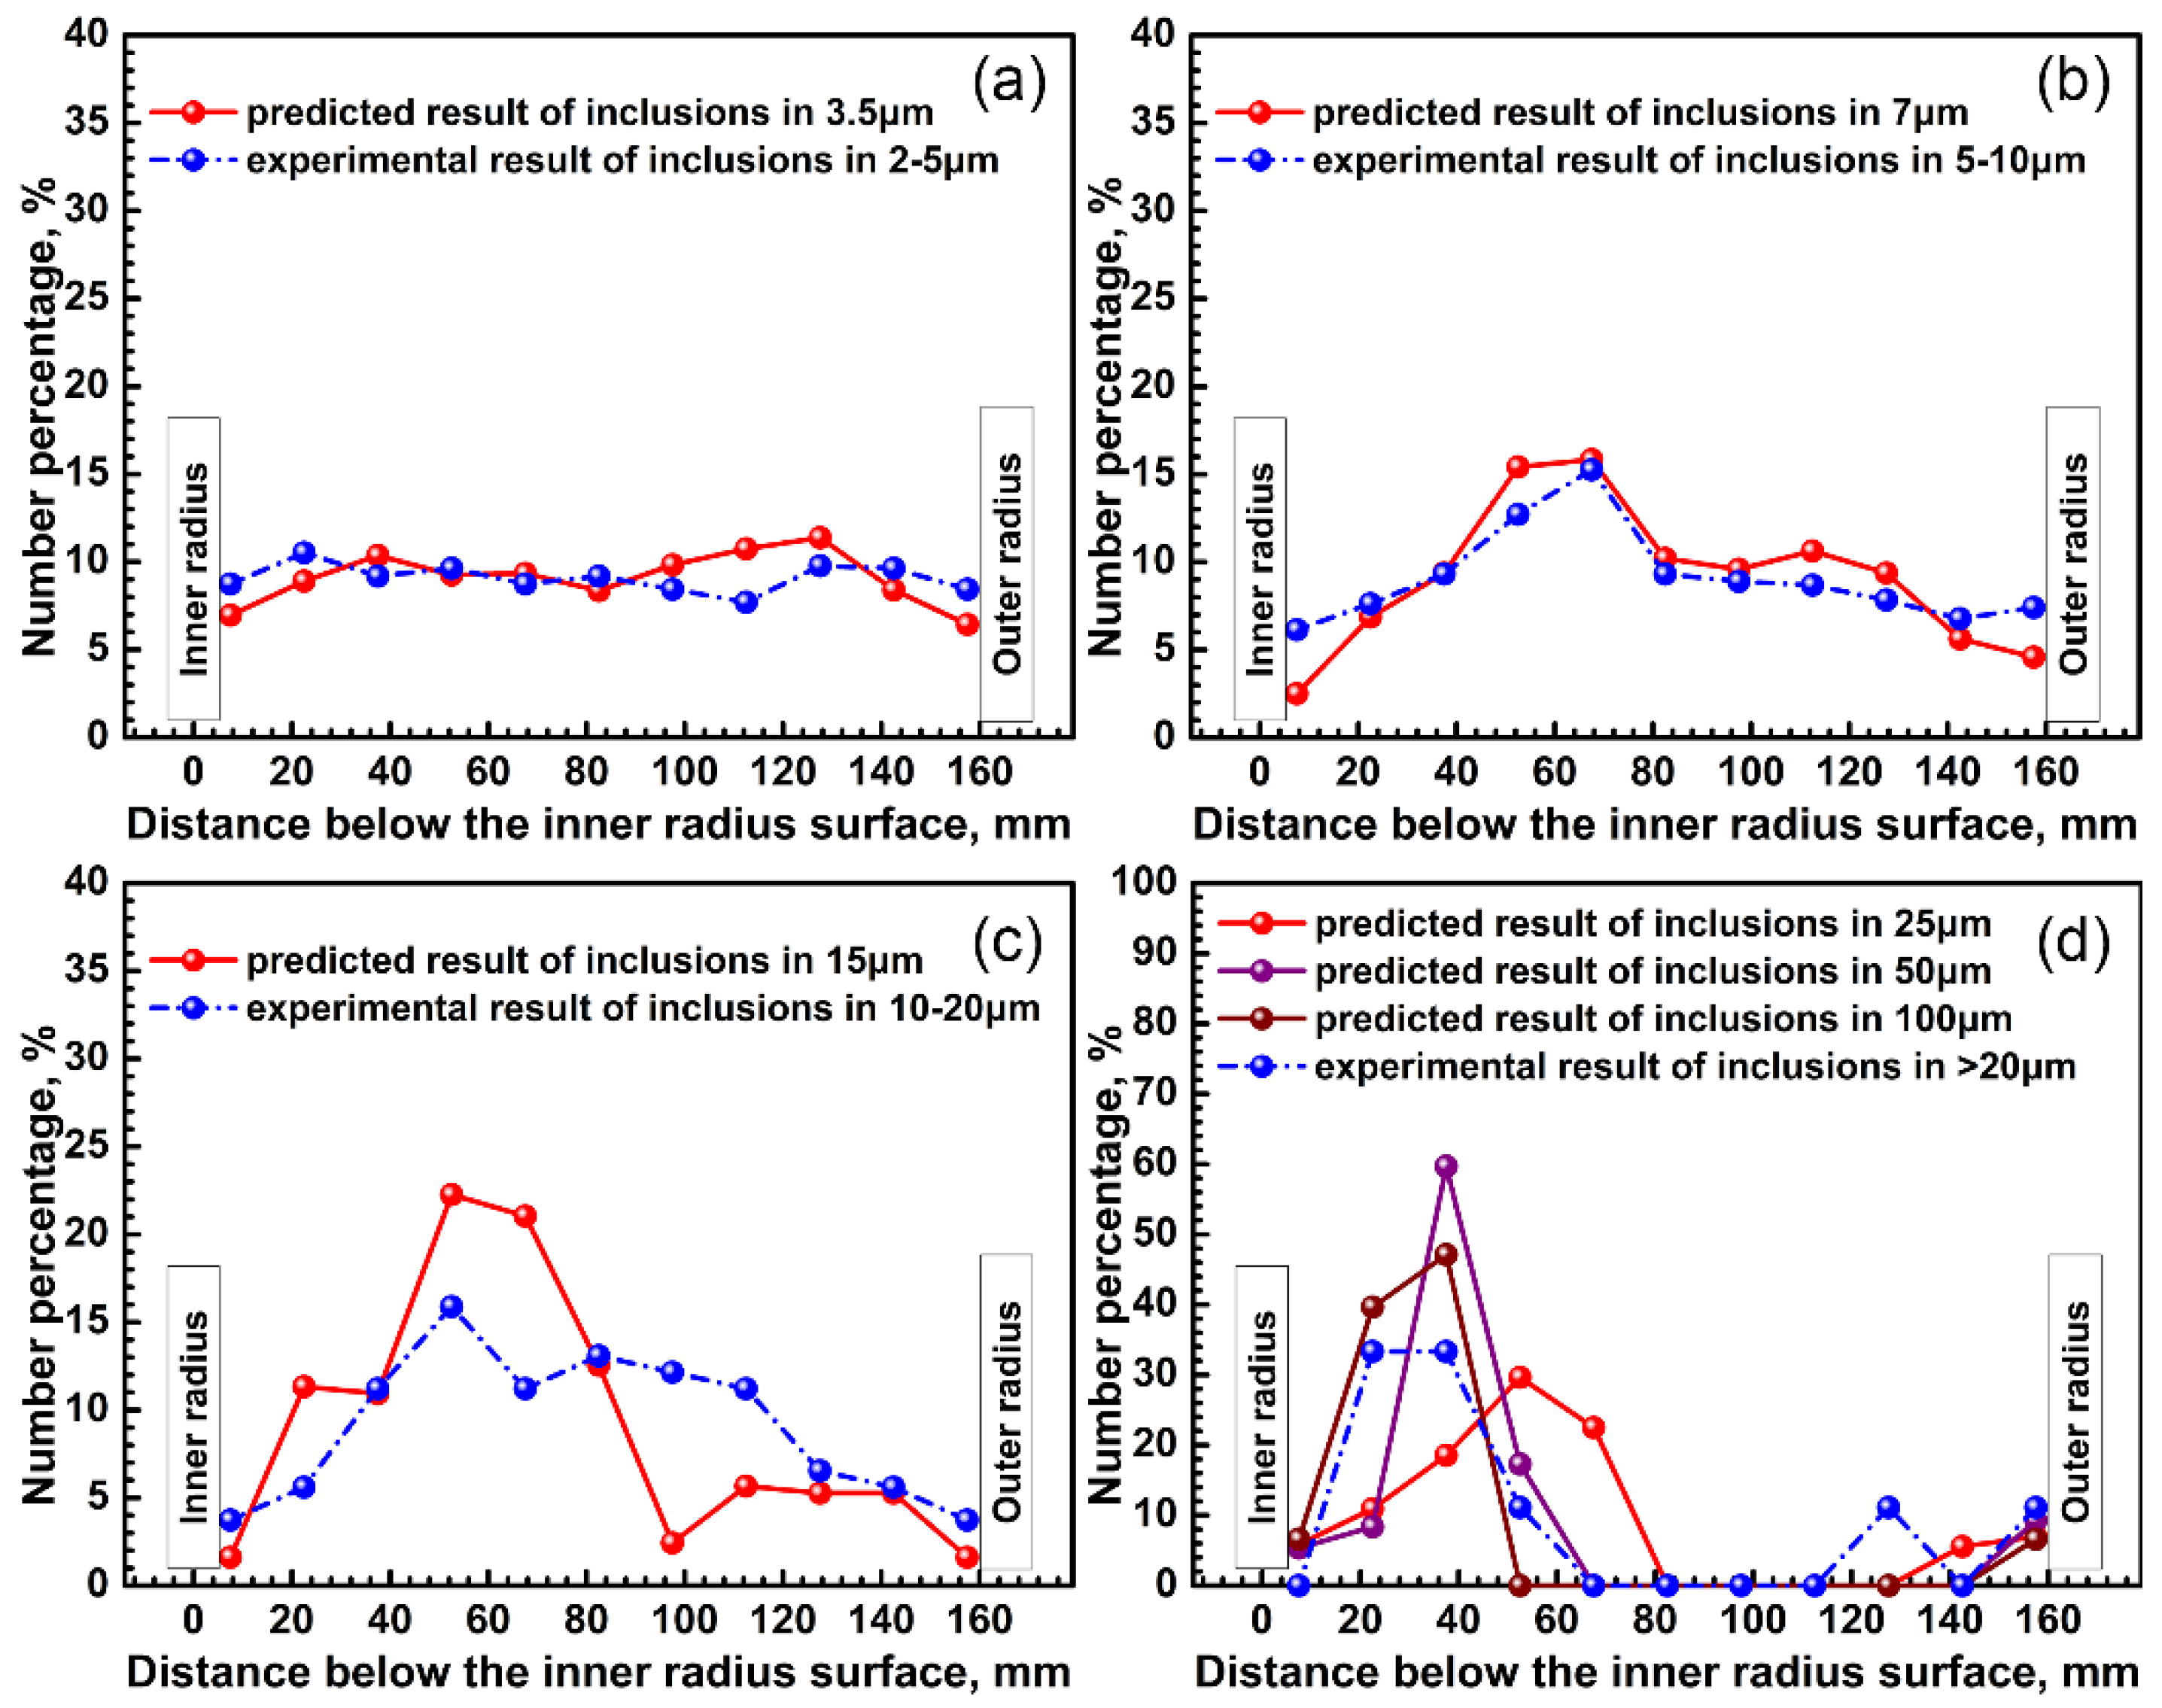
3.5. Comparison Between the Predicted and the Experimental Results

Samples with the same process parameters and material properties adopted in the current work were obtained from a steel plant. The sampling schematic diagram can be seen in Figure 11. The steel samples were machined into 15 mm × 15 mm × 15 mm metallographic samples, and then these samples were polished and examined using EVO18, ZEISS scanning electron microscope (SEM). The numbers of inclusions in steel samples were automatically counted using the SEM control software INCAFeature (Oxford Instruments, Oxfordshire, England). The analyzed area of each steel sample was 11 × 11 mm2. The inclusion size was determined by the equivalent circle diameter (ECD). Only inclusions that were above 2 μm ECD were counted. Manganese sulfide (MnS) inclusions that were precipitated during the solidification process were not counted. In total, 1263 inclusions were detected in the 11 steel samples (Figure 11). The number of inclusions in the samples decreases as the inclusion diameter increases. The largest of those detected inclusions is 38.78 μm. The measured inclusion number density reaches a maximum at the fourth steel sample from the inner radius, which is located between the inner radius and the center of the solidified strand.
In order to compare the predicted result with the experimental result further, the detected inclusions in these steel samples are divided into four groups (2–5 μm, 5–10 μm, 10–20 μm, >20 μm), according to size. For the four groups, their size weighted averages are 3.30 μm, 6.90 μm, 12.67 μm, and 30.00 μm, respectively. The predicted results are collected in the analysis zone shown in Figure 11.
Figure 12 presents the comparison between the predicted and the experimental results. Good agreement is found between the predicted result of inclusions in 3.5 μm and the experimental result of inclusions in 2–5 μm. Likewise, the predicted distribution of inclusions in 7 μm is in good agreement with the distribution of inclusions in 5–10 μm, according to the experiment. For the predicted result of inclusions in 15 μm and the experimental result of inclusions in 10–20 μm, their variation trends are similar (Figure 12c). The relatively large deviation between the inclusion size in the predicted result and the weighted average size in the experimental result may result in the deviation between the experimental and predicted results. Inclusions that were larger than 20 μm were rarely detected in the steel samples. As Figure 12d shows, the variation trend in the experimental result of inclusions larger than 20 μm is similar to that in the predicted results of 25 μm, 50 μm, and 100 μm inclusions. Through the experimental result, it can also be found that the distribution of inclusions smaller than 5 μm in the solidified strand is even. However, for inclusions that were larger than 5 μm, their distributions become uneven. This is consistent with the predicted result discussed above. The comparison between the predicted and the experimental results indicates that the inclusion motion model is valid.

4. Conclusions

The present work has developed a three-dimensional numerical model coupling the flow field, solidification, and inclusion motion for a curved strand. Through the coupling model, we have investigated the inclusion motion and entrapment during the full solidification in a curved billet caster. The characteristics of the inclusion motion and entrapment in the mold and the curved part of the strand have been revealed. Moreover, the inclusion distributions in the solidified strand have also been presented. The conclusions are as follows:
  • the inclusion distribution inside the liquid pool of the mold is not perfectly symmetrical, resulting from the random injection of inclusions from the inlet and the effect of the molten steel turbulence;
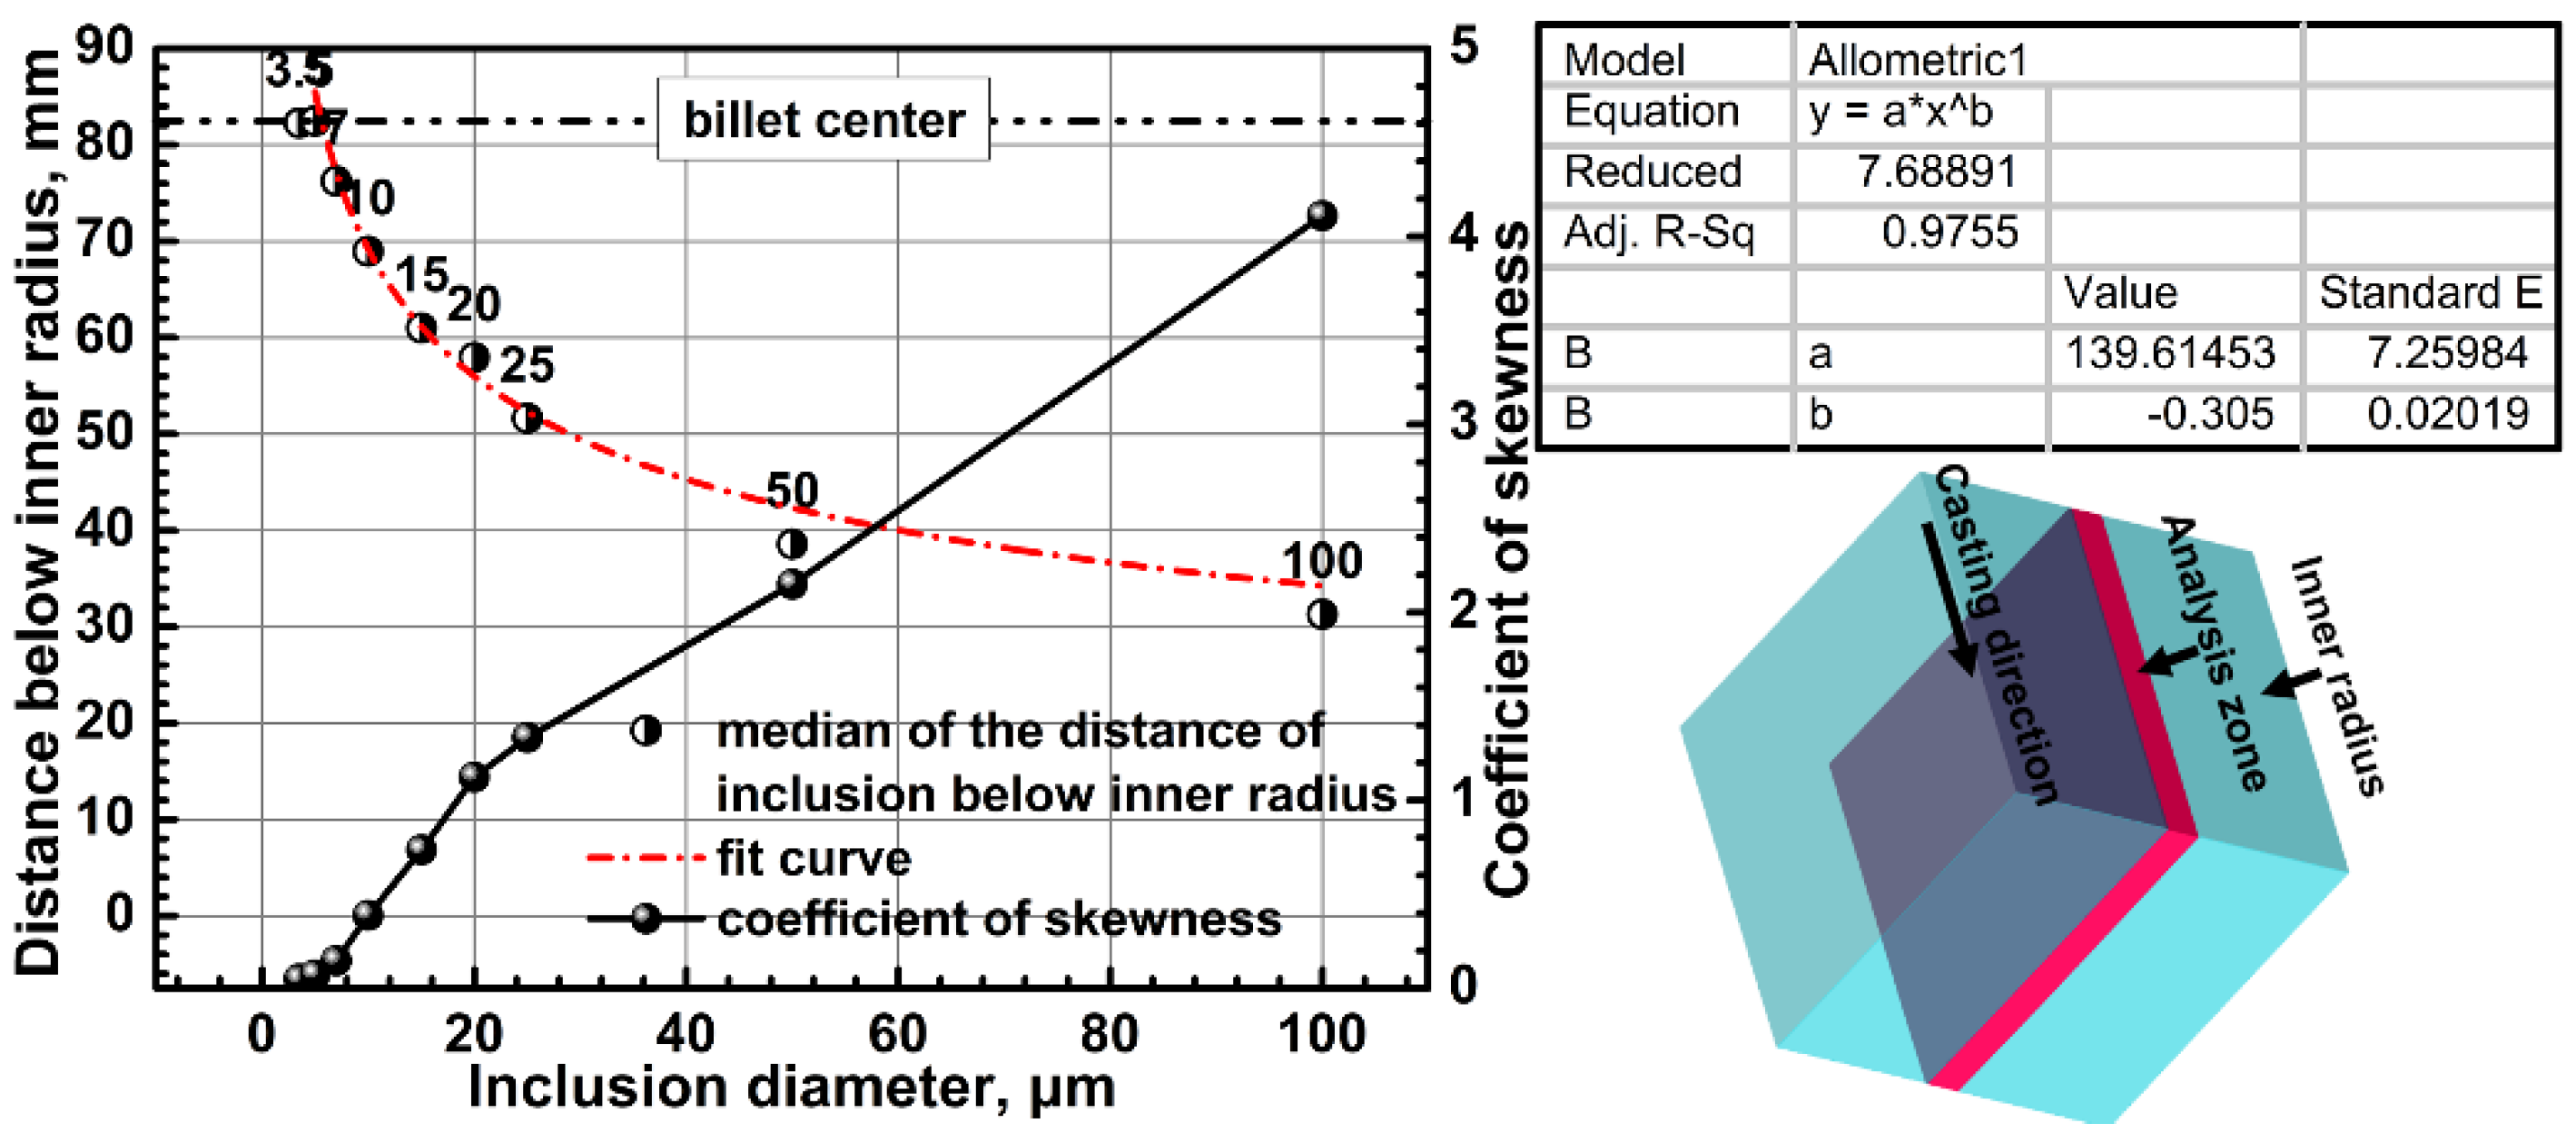
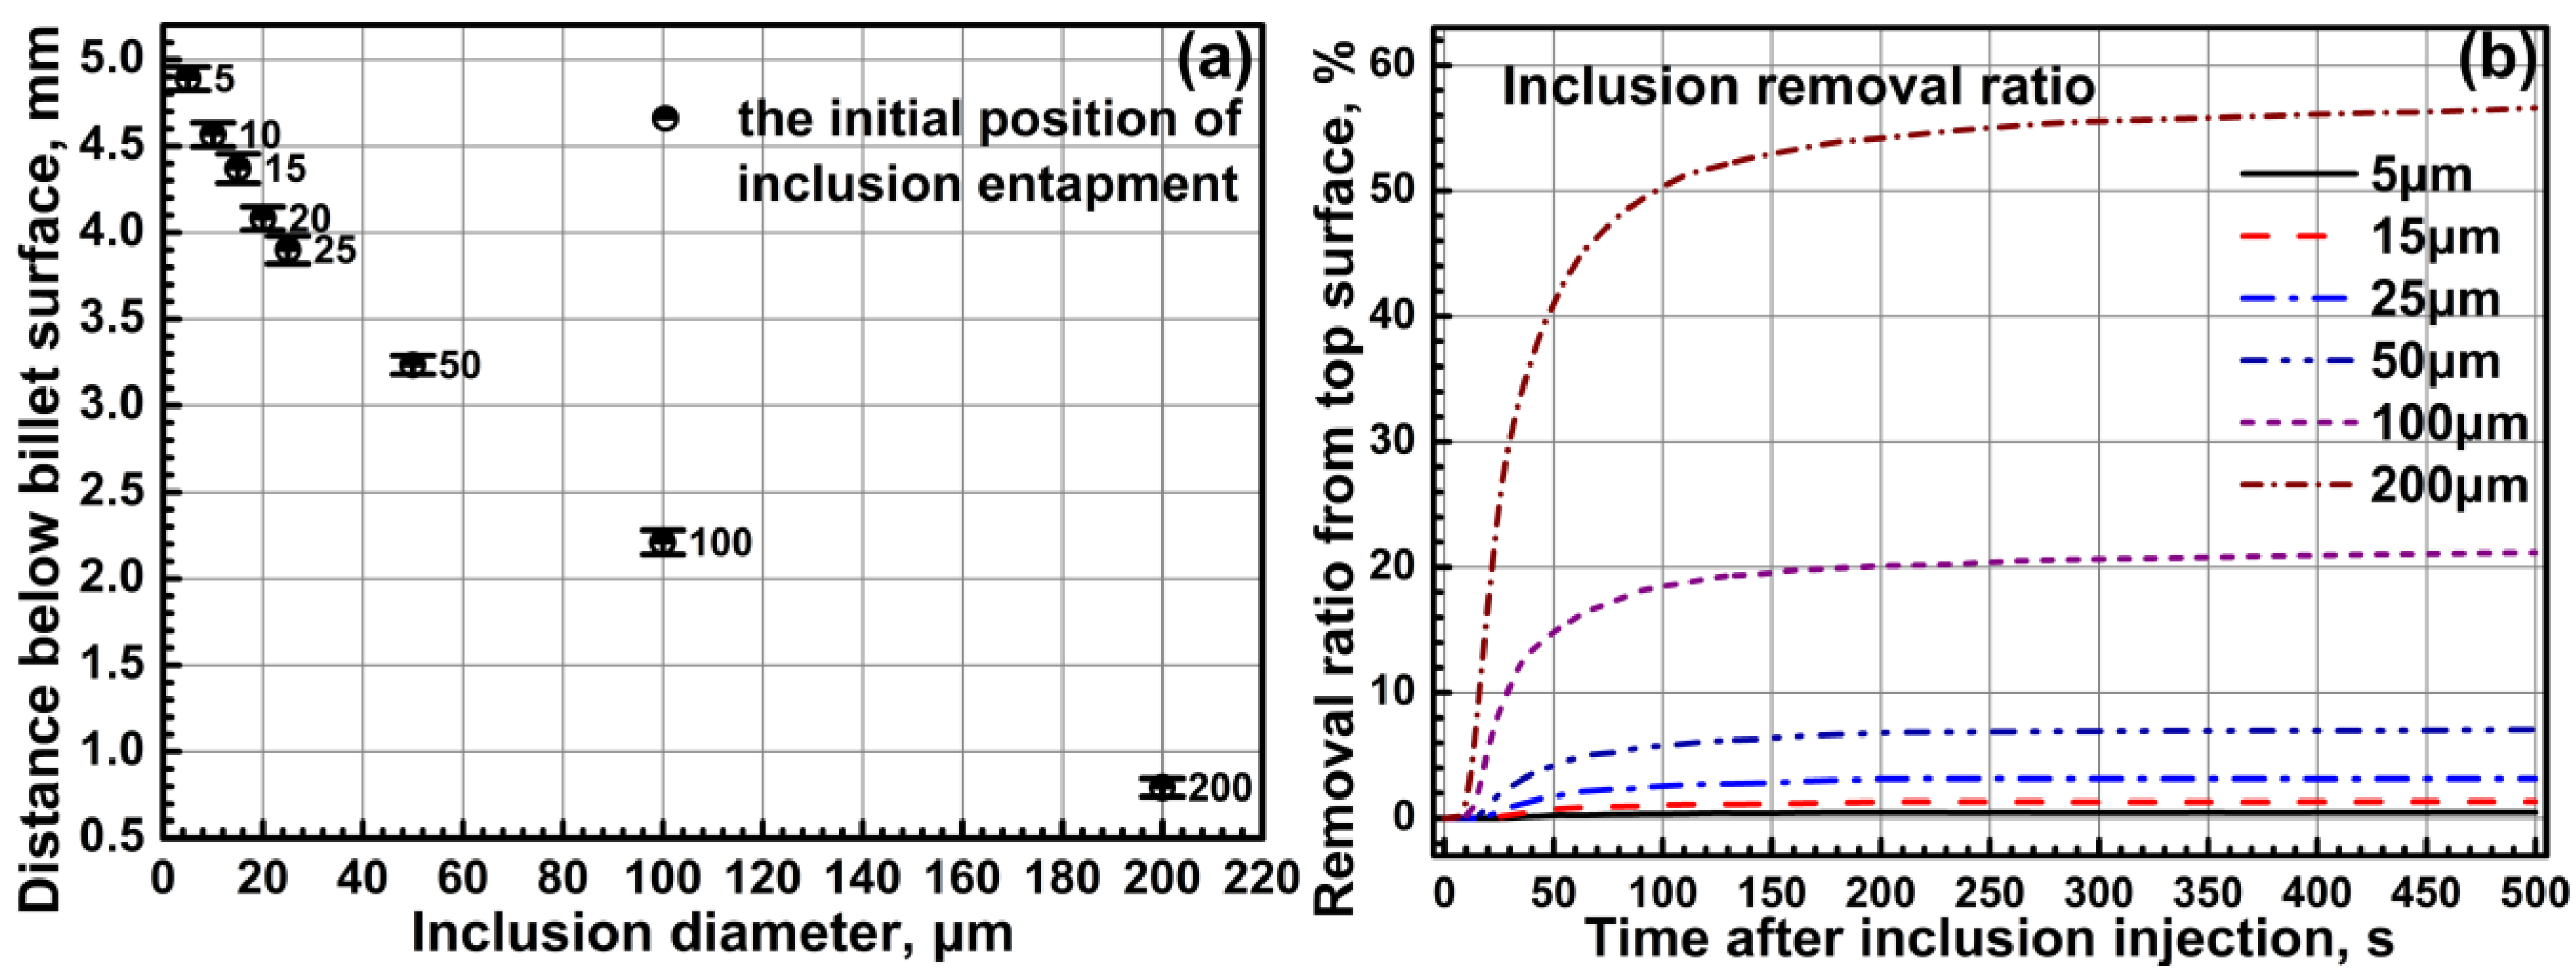
  • the entrapping positions of larger inclusions are higher than those of smaller inclusions in the URZ with the effect of the buoyancy force. As a result, the initial entrapping positions of larger inclusions are more close to the billet surface;
  • the motion and entrapment of micro inclusions in the mold are mainly affected by the molten steel flow pattern, since the buoyancy force of micro inclusions is negligible. However, the motion and entrapment of macro inclusions in the mold depend both on the molten steel flow pattern and the buoyancy force;
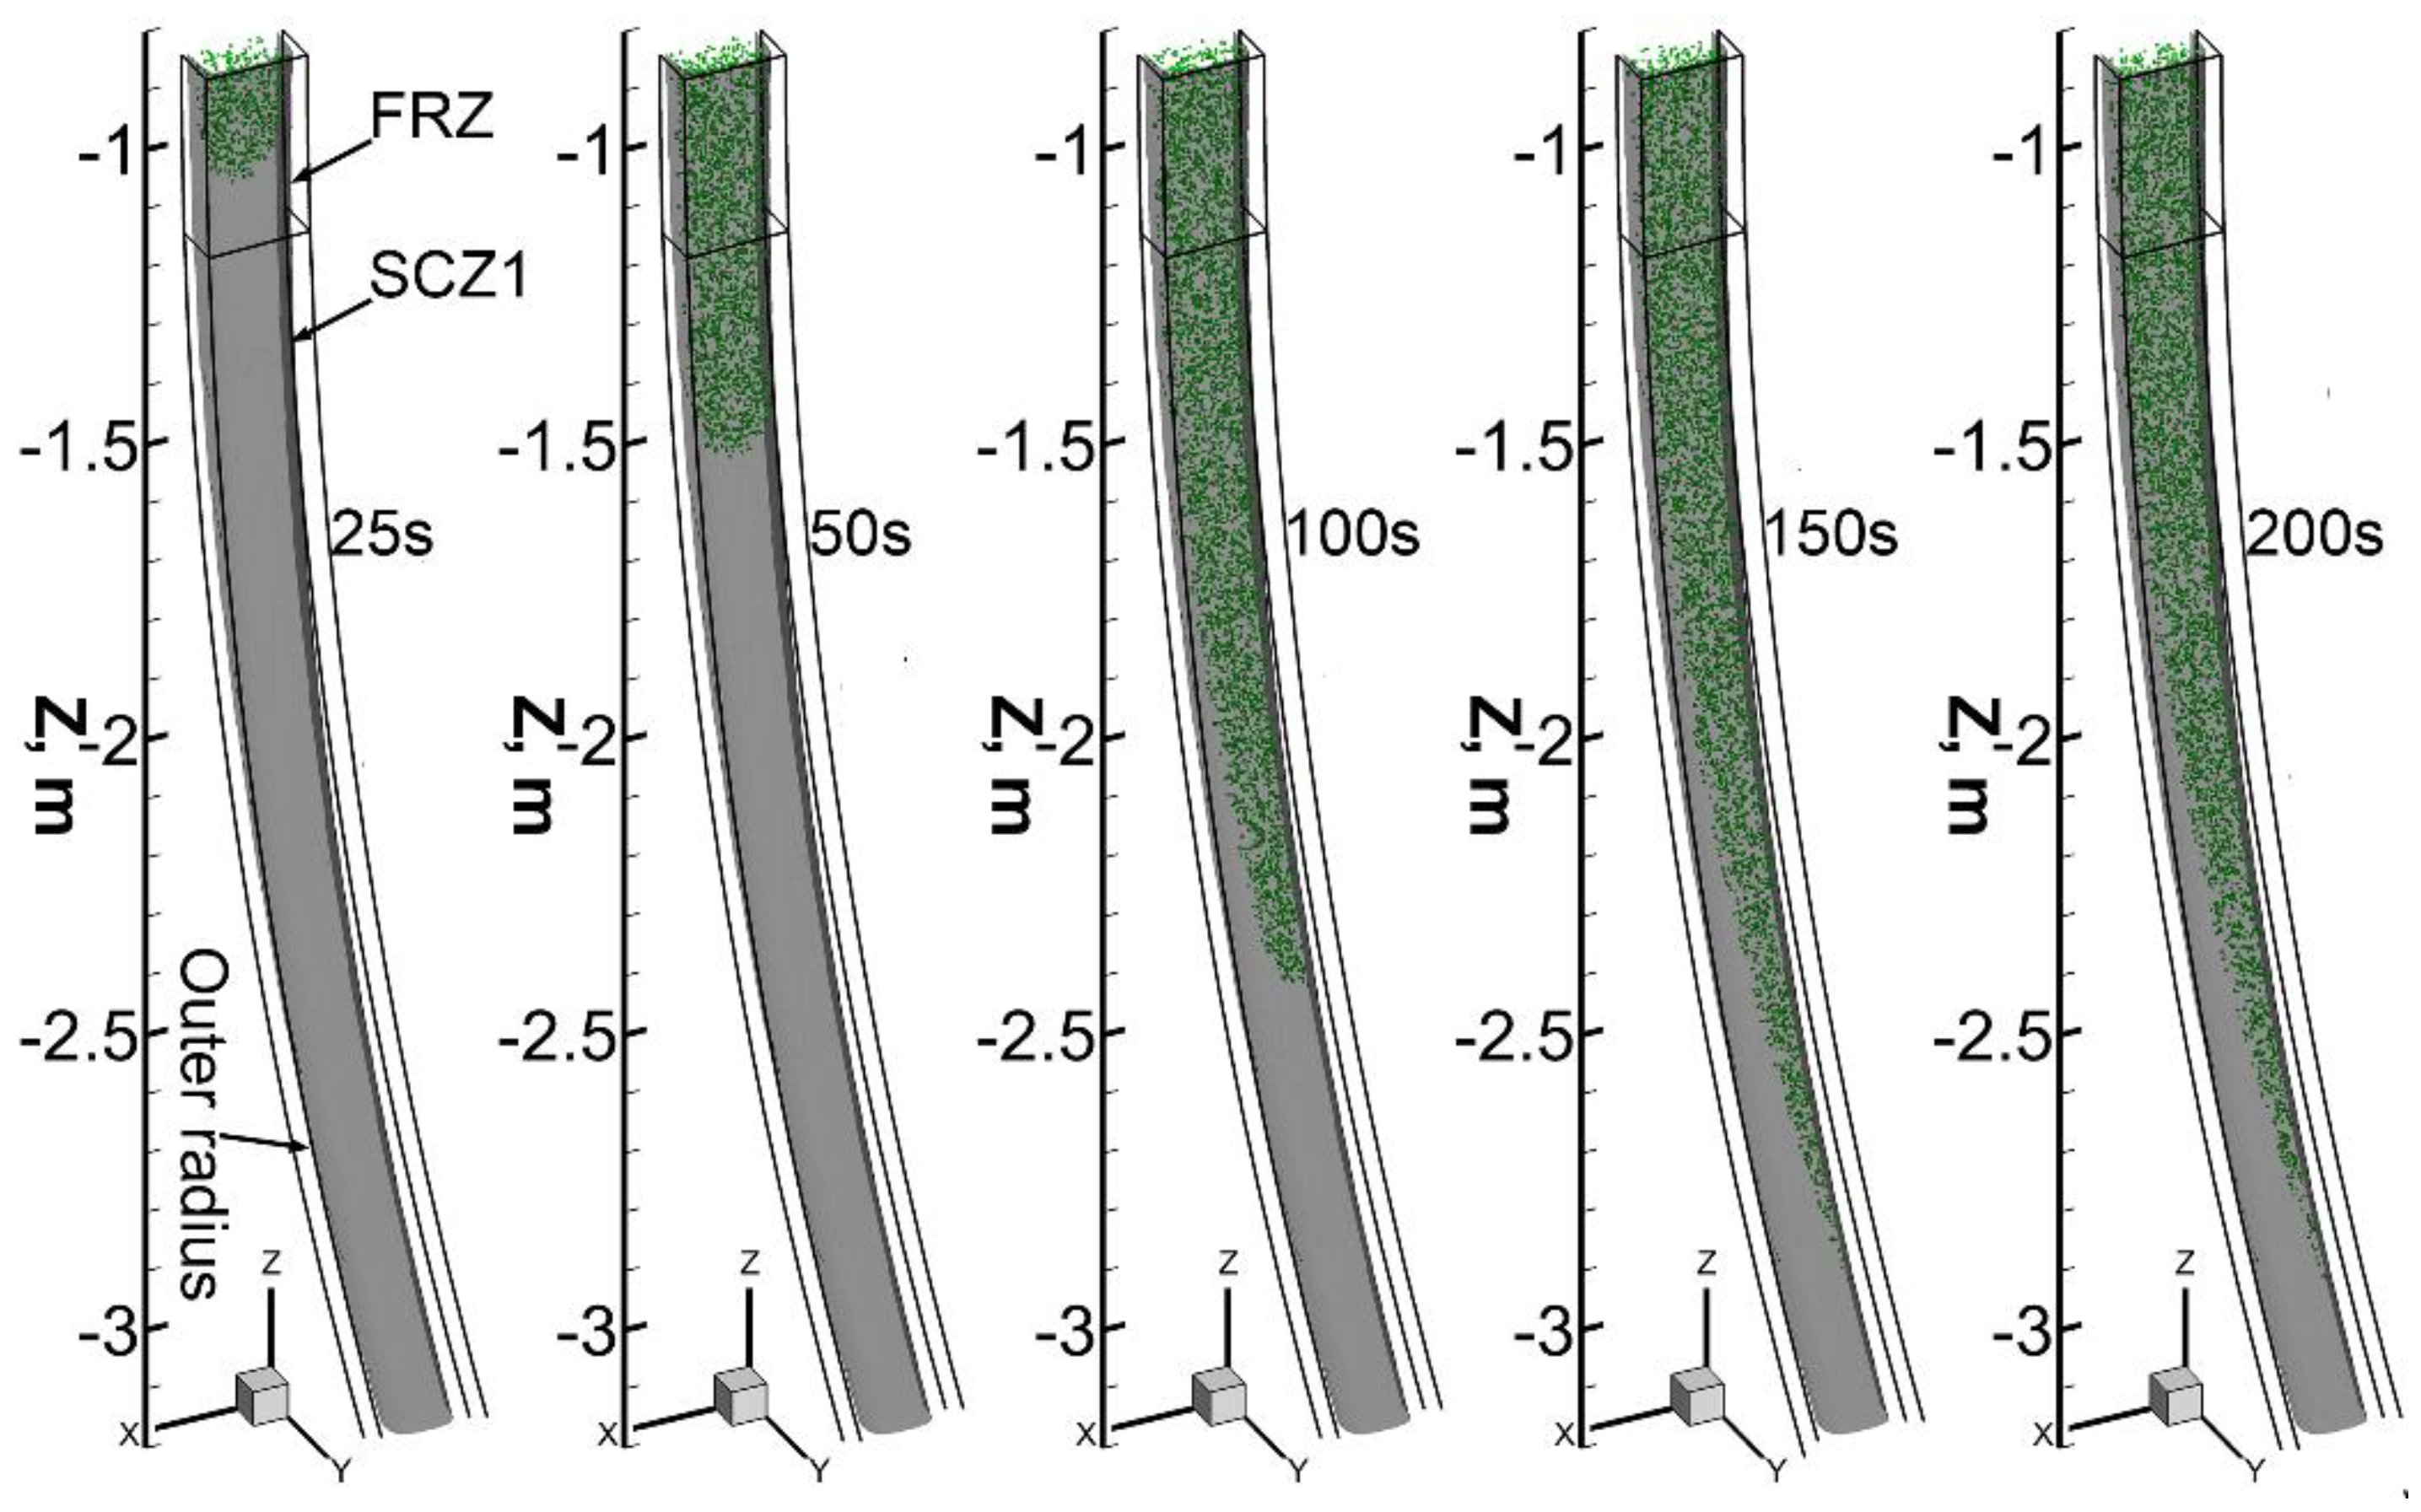
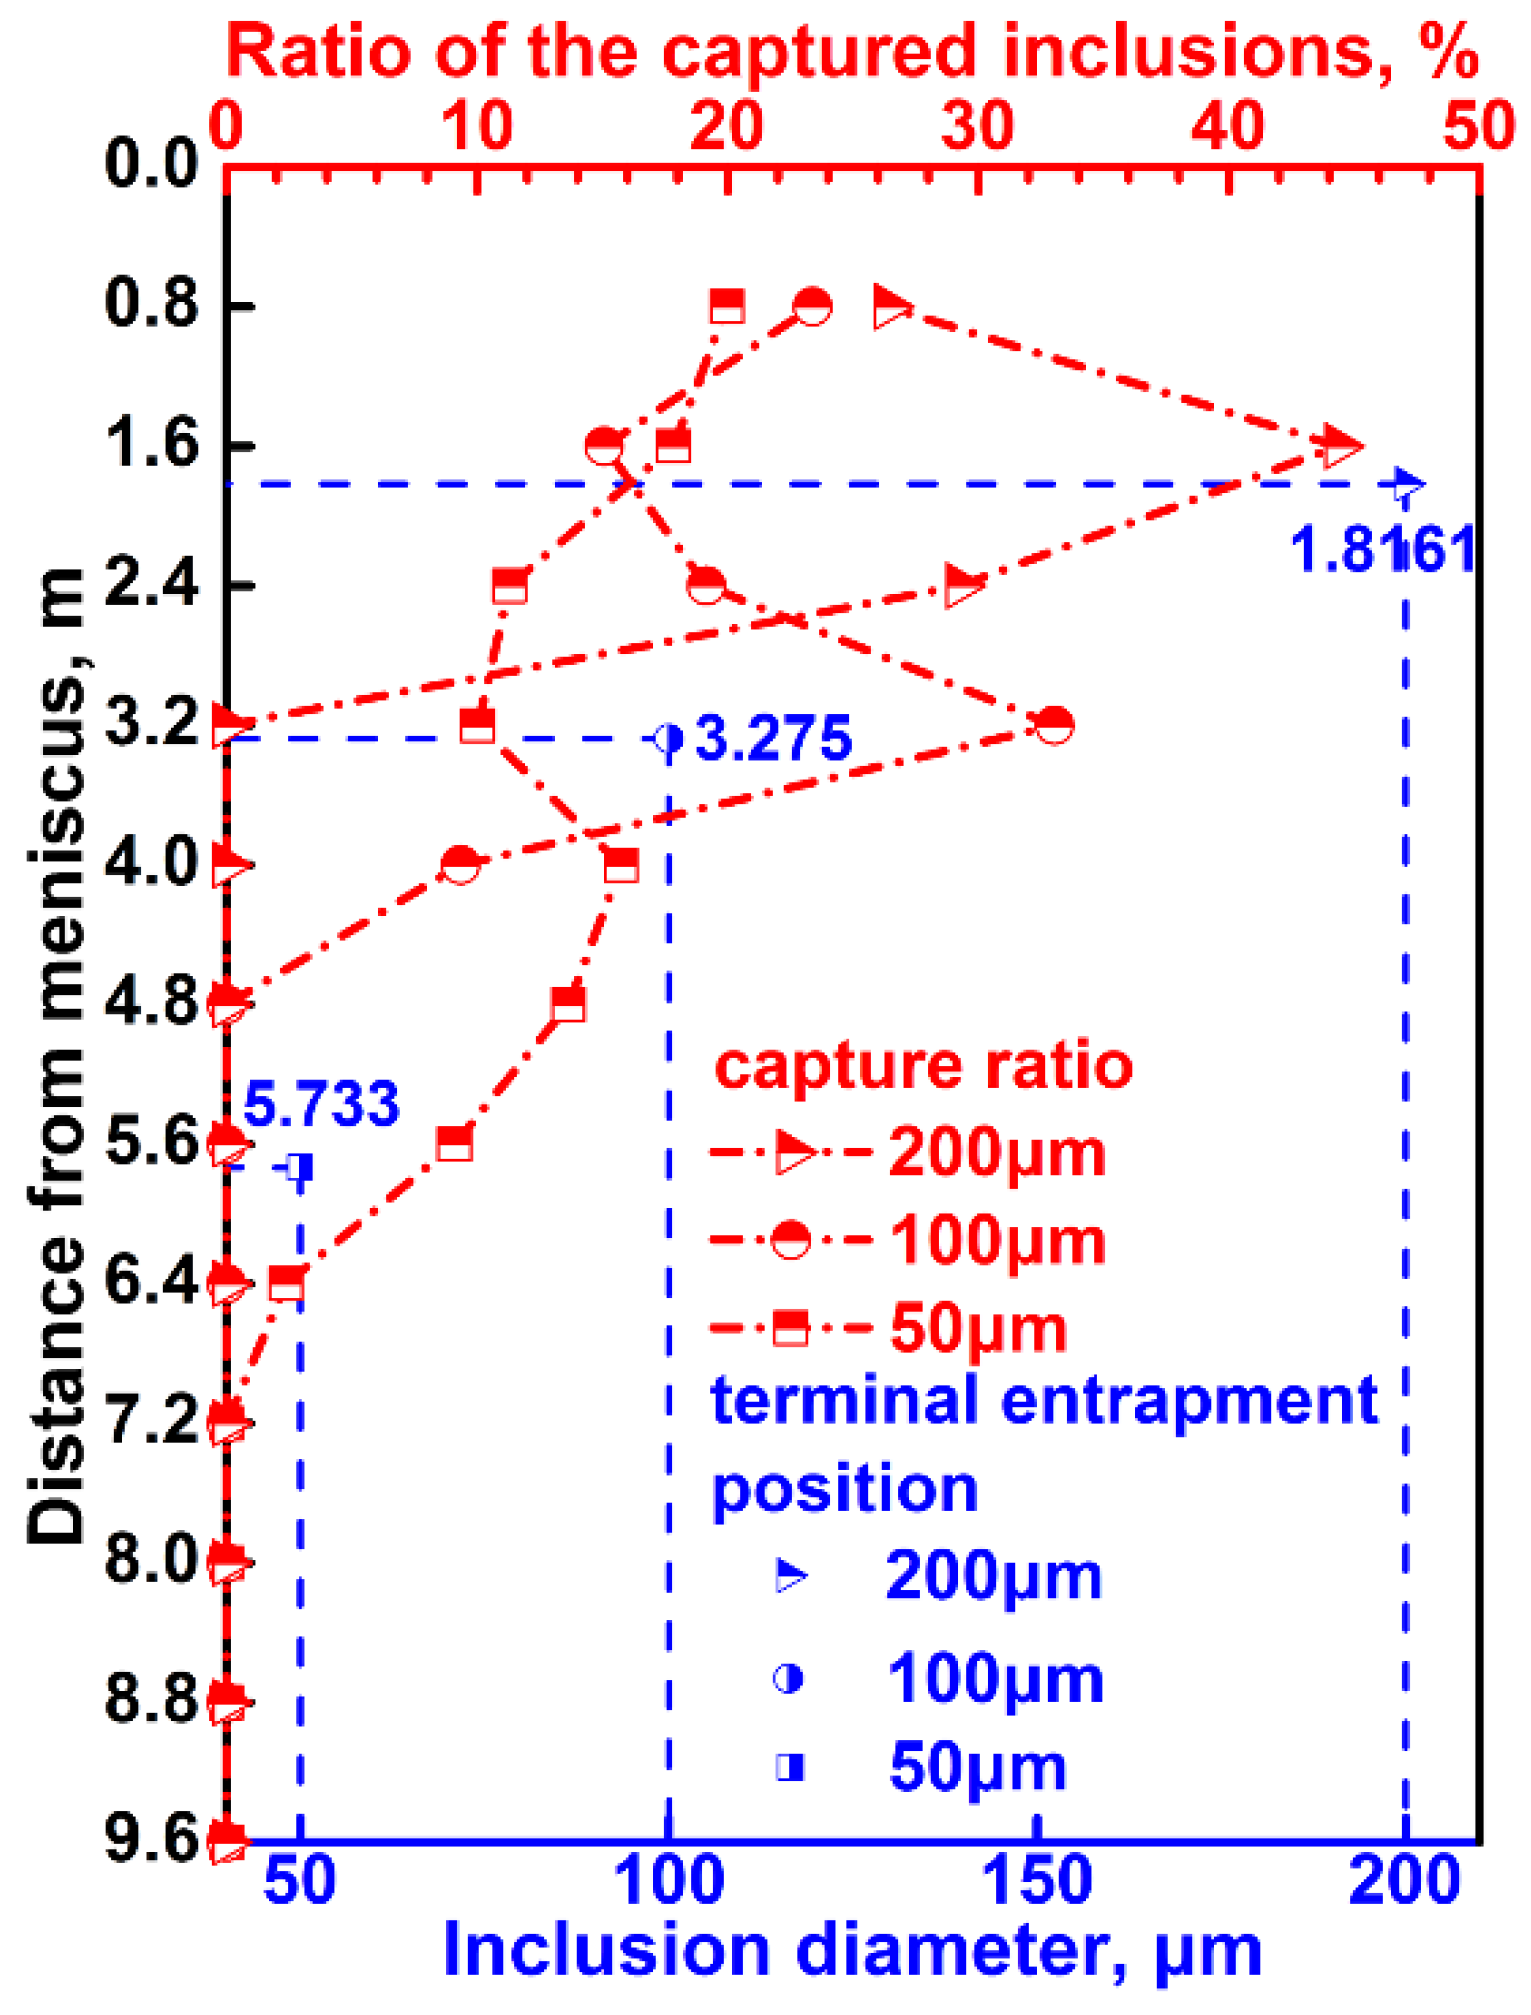
  • owing to the effect of the buoyancy force, macro inclusions shift to the solidifying front of the inner radius in the curved part of the strand as time goes on, while the solidifying front of the outer radius cannot entrap the inclusions;
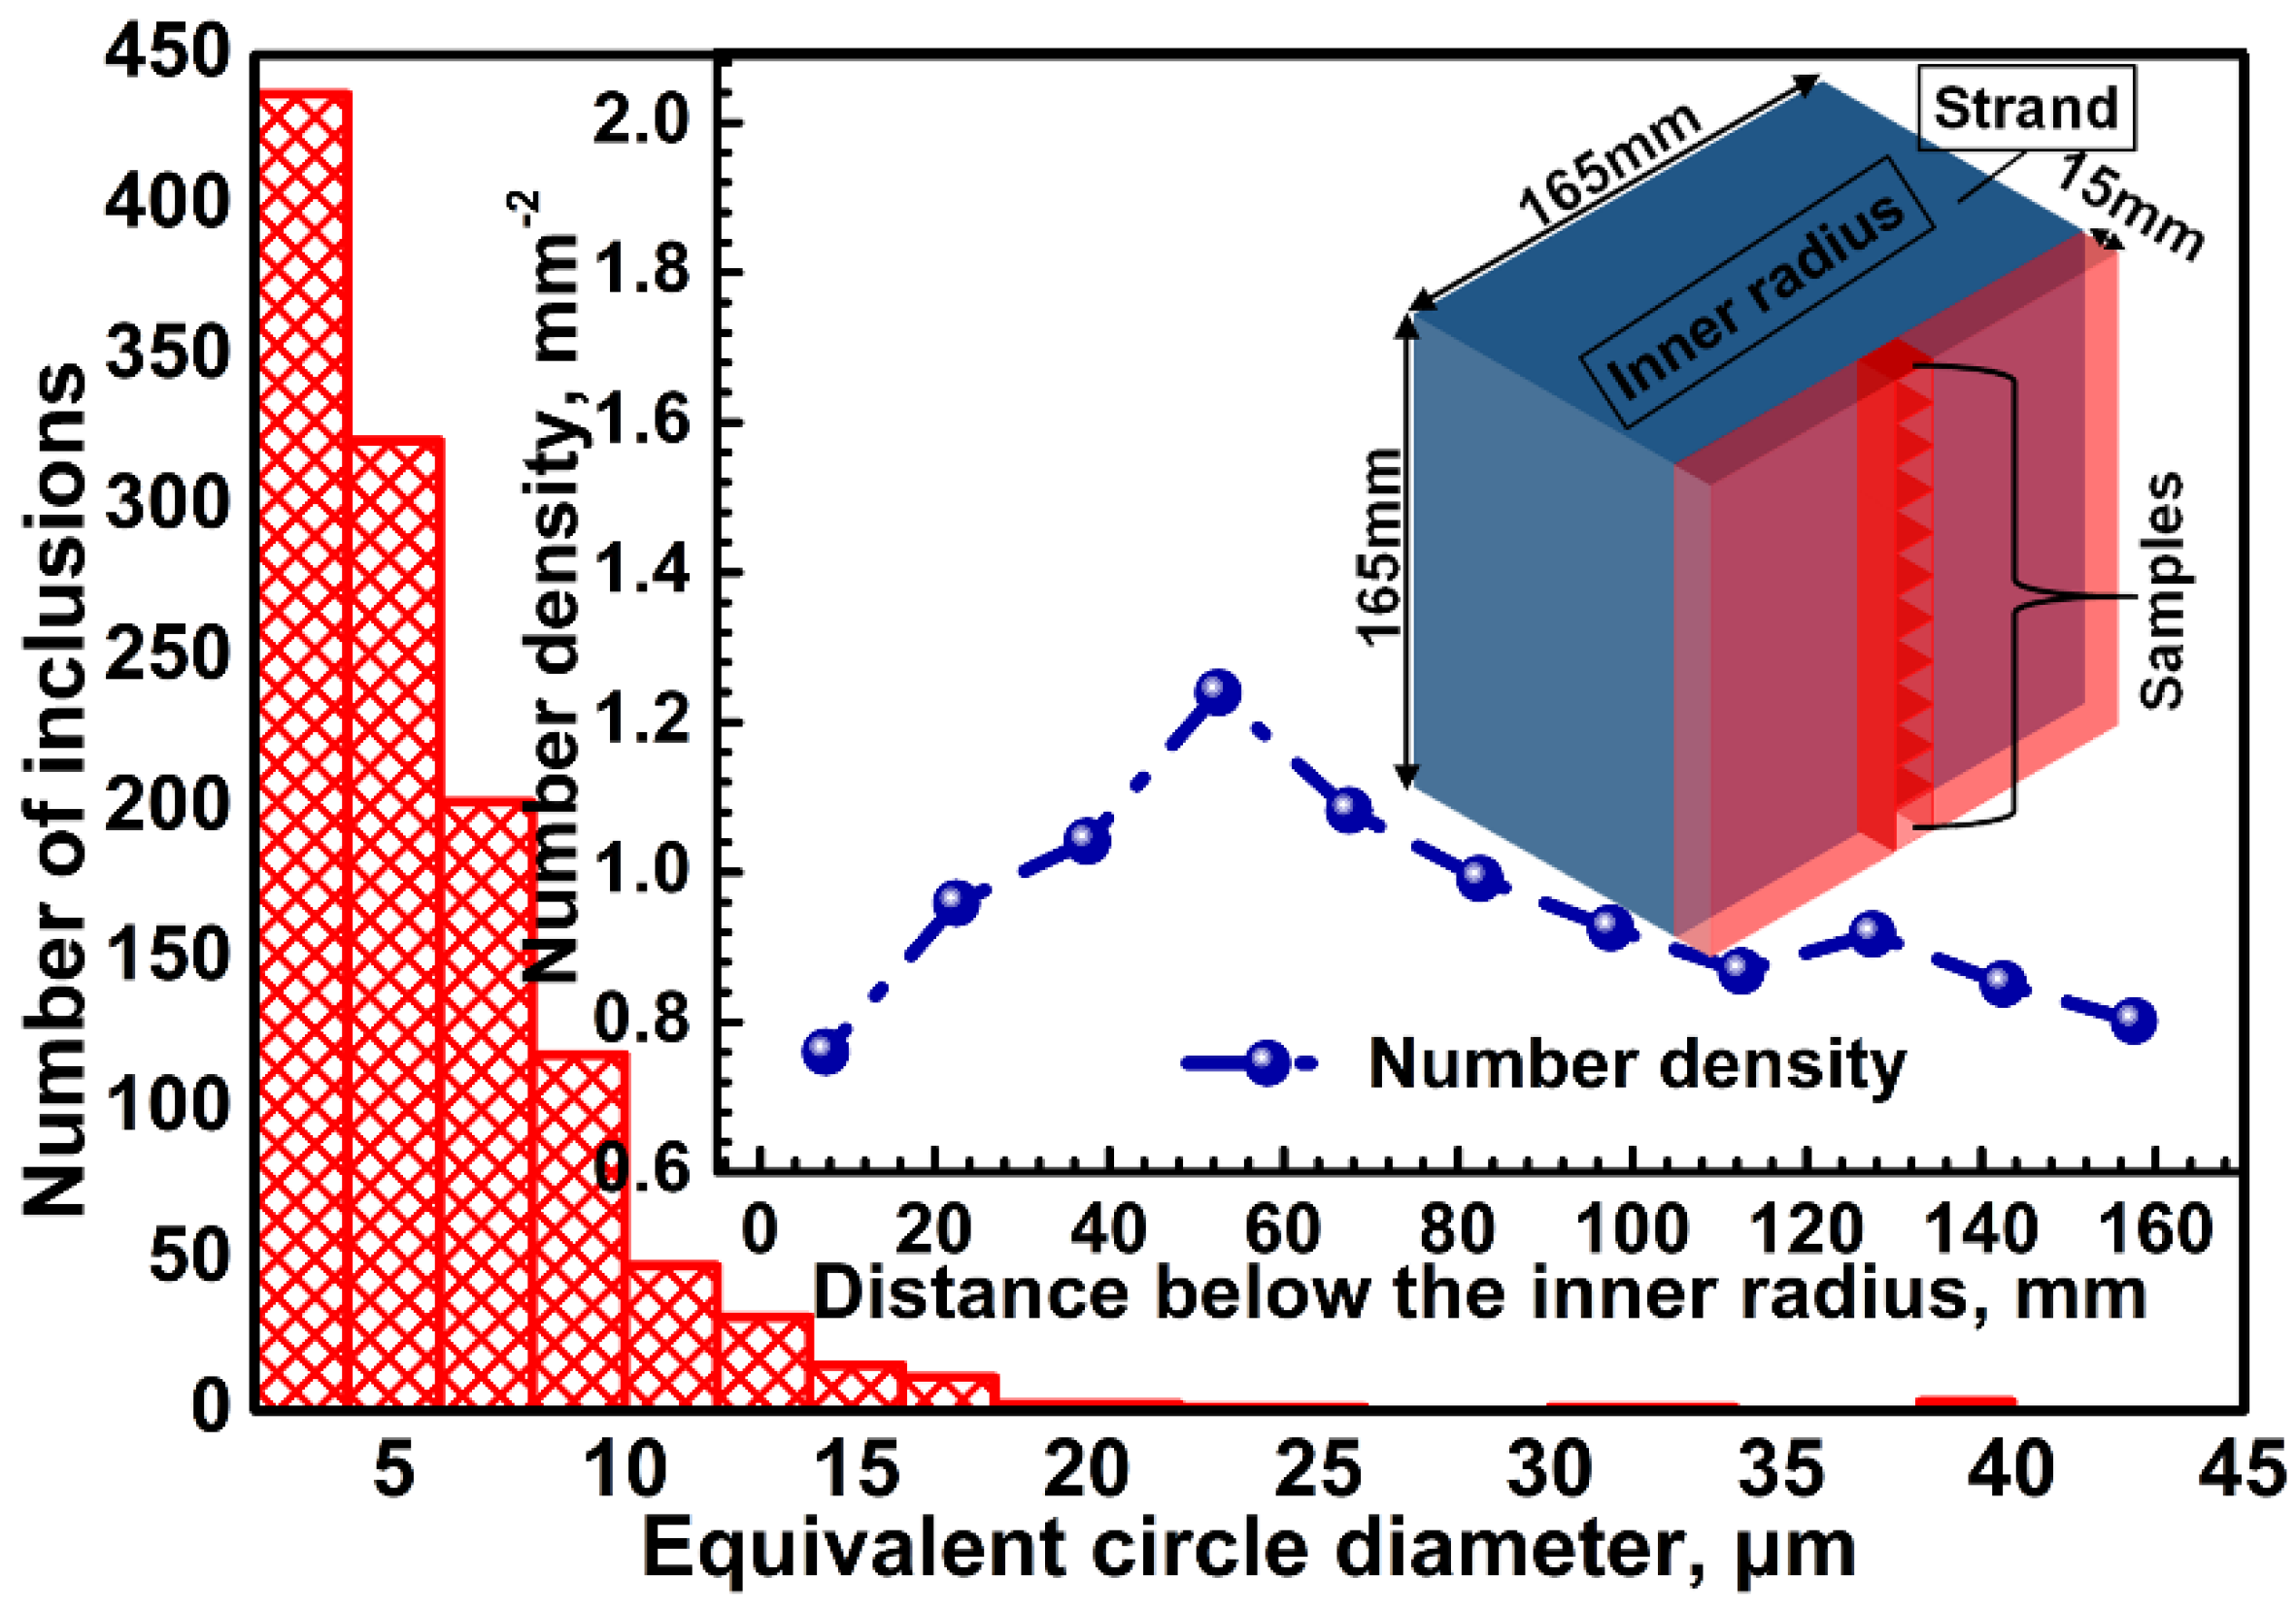
  • the distributions of inclusions smaller than 5 μm in the solidified strand are even. However, for inclusions that are larger than 5 μm, their distributions become uneven. Furthermore, the inhomogeneity is enhanced with the increase of the inclusion diameter; and,
  • good agreement is found between the predicted and experimental results. The comparison between the predicted and the experimental results indicates that the inclusion motion model is valid.

Author Contributions

J.Z. and Y.Y. conceived and designed the study; Y.Y. and Q.D. performed the numerical calculation; Y.Y. and Y.L. conducted the experiment. Y.L. and Q.D. analyzed the experimental data; Y.Y. and J.Z. wrote the paper.

Acknowledgments

The authors gratefully express their appreciation to the National Natural Science Foundation of China (51474023) for sponsoring this work.

Conflicts of Interest

The authors declare no conflict of interest.

References

  1. Zhang, L. Nucleation, growth, transport, and entrapment of inclusions during steel casting. JOM 2013, 65, 1138–1144. [Google Scholar] [CrossRef]
  2. Hu, Y.; Chen, W.; Wan, C.; Wang, F.; Han, H. Effect of deoxidation process on inclusion and fatigue performance of spring steel for automobile suspension. Metall. Mater. Trans. B 2018, 49, 569–580. [Google Scholar] [CrossRef]
  3. Deng, X.; Ji, C.; Cui, Y.; Tian, Z.; Yin, X.; Shao, X.; Yang, Y.; McLean, A. Formation and evolution of macro inclusions in IF steels during continuous casting. Ironmak. Steelmak. 2017, 44, 739–749. [Google Scholar] [CrossRef]
  4. Wang, X.; Li, X.; Li, Q.; Huang, F.; Li, H.; Yang, J. Control of stringer shaped non-metallic inclusions of Cao-Al2O3 system in API X80 linepipe steel plates. Steel Res. Int. 2014, 85, 155–163. [Google Scholar] [CrossRef]
  5. Lei, H.; Geng, D.; He, J. A continuum model of solidification and inclusion collision-growth in the slab continuous casting caster. ISIJ Int. 2009, 49, 1575–1582. [Google Scholar] [CrossRef]
  6. Lei, H.; Jiang, J.; Yang, B.; Zhao, Y.; Zhang, H.; Wang, W.; Dong, G. Mathematical model for collision-coalescence among inclusions in the bloom continuous caster with M-EMS. Metall. Mater. Trans. B 2018, 49, 666–676. [Google Scholar] [CrossRef]
  7. Liu, Z.; Li, B. Large-eddy simulation of transient horizontal gas–liquid flow in continuous casting using dynamic subgrid-scale model. Metall. Mater. Trans. B 2017, 48, 1833–1849. [Google Scholar] [CrossRef]
  8. Liu, Z.; Qi, F.; Li, B.; Jiang, M. Multiple size group modeling of polydispersed bubbly flow in the mold: An analysis of turbulence and interfacial force models. Metall. Mater. Trans. B 2015, 46, 933–952. [Google Scholar] [CrossRef]
  9. Liu, Z.; Li, B.; Qi, F.; Cheung, S.C.P. Population balance modeling of polydispersed bubbly flow in continuous casting using average bubble number density approach. Powder Technol. 2017, 319, 139–147. [Google Scholar] [CrossRef]
  10. Yu, H.; Zhu, M. Three-dimensional magnetohydrodynamic calculation for coupling multiphase flow in round billet continuous casting mold with electromagnetic stirring. IEEE Trans. Magn. 2010, 46, 82–86. [Google Scholar] [CrossRef]
  11. Ho, Y.; Hwang, W. Numerical simulation of inclusion removal in a billet continuous casting mold based on the partial-cell technique. ISIJ Int. 2003, 43, 1715–1723. [Google Scholar] [CrossRef]
  12. Li, B.; Tsukihashi, F. Numerical estimation of the effect of the magnetic field application on the motion of inclusion in continuous casting of steel. ISIJ Int. 2003, 43, 923–931. [Google Scholar] [CrossRef]
  13. Liu, Z.; Li, B.; Jiang, M.; Fumitaka, T. Euler-Euler-Lagrangian modeling for two-phase flow and particle transport in continuous casting mold. ISIJ Int. 2014, 54, 1314–1323. [Google Scholar] [CrossRef]
  14. Liu, Z.; Li, L.; Li, B. Large eddy simulation of transient flow and inclusions transport in continuous casting mold under different electromagnetic brakes. JOM 2016, 68, 2180–2190. [Google Scholar] [CrossRef]
  15. Liu, Z.; Sun, Z.; Li, B. Modeling of quasi-four-phase flow in continuous casting mold using hybrid Eulerian and Lagrangian approach. Metall. Mater. Trans. B 2017, 48, 1248–1267. [Google Scholar] [CrossRef]
  16. Trindade, L.; Nadalon, J.; Vilela, A.; Vilhena, M.; Soares, R. Numerical modeling of inclusion removal in electromagnetic stirred steel billets. Steel Res. Int. 2007, 78, 708–713. [Google Scholar] [CrossRef]
  17. Wang, S.; De Toledo, G.; Välimaa, K.; Louhenkilpi, S. Magnetohydrodynamic phenomena, fluid control and computational modeling in the continuous casting of billet and bloom. ISIJ Int. 2014, 54, 2273–2282. [Google Scholar] [CrossRef]
  18. Wang, Y.; Zhang, L. Fluid flow-related transport phenomena in steel slab continuous casting strands under electromagnetic brake. Metall. Mater. Trans. B 2011, 42, 1319–1351. [Google Scholar] [CrossRef]
  19. Yang, Y.; Jönsson, P.; Ersson, M.; Nakajima, K. Inclusion behavior under a swirl flow in a submerged entry nozzle and mold. Steel Res. Int. 2015, 86, 341–360. [Google Scholar] [CrossRef]
  20. Yang, Y.; Jönsson, P.; Ersson, M.; Su, Z.; He, J.; Nakajima, K. The influence of swirl flow on the flow field, temperature field and inclusion behavior when using a half type electromagnetic swirl flow generator in a submerged entry and mold. Steel Res. Int. 2015, 86, 1312–1327. [Google Scholar] [CrossRef]
  21. Yu, H.; Zhu, M. Influence of electromagnetic stirring on transport phenomena in round billet continuous casting mould and macrostructure of high carbon steel billet. Ironmak. Steelmak. 2012, 39, 574–584. [Google Scholar] [CrossRef]
  22. Zhang, L.; Aoki, J.; Thomas, B. Inclusion removal by bubble flotation in a continuous casting mold. Metall. Mater. Trans. B 2006, 37, 361–379. [Google Scholar] [CrossRef]
  23. Zhang, L.; Wang, Y.; Zuo, X. Flow transport and inclusion motion in steel continuous-casting mold under submerged entry nozzle clogging condition. Metall. Mater. Trans. B 2008, 39, 534–550. [Google Scholar] [CrossRef]
  24. Wang, Q.; Zhang, L. Determination for the entrapment criterion of non-metallic inclusions by the solidification front during steel centrifugal continuous casting. Metall. Mater. Trans. B 2016, 47, 1933–1949. [Google Scholar] [CrossRef]
  25. Liu, Z.; Li, B. Effect of vertical length on asymmetric flow and inclusion transport in vertical-bending continuous caster. Powder Technol. 2018, 323, 403–415. [Google Scholar] [CrossRef]
  26. Pfeiler, C.; Wu, M.; Ludwig, A. Influence of argon gas bubbles and non-metallic inclusions on the flow behavior in steel continuous casting. Mater. Sci. Eng. A 2005, 413–414, 115–120. [Google Scholar] [CrossRef]
  27. Liu, Z.; Li, L.; Li, B.; Jiang, M. Large eddy simulation of transient flow, solidification, and particle transport processes in continuous-casting mold. JOM 2014, 66, 1184–1196. [Google Scholar] [CrossRef]
  28. Jin, K.; Vanka, S.; Thomas, B. Large eddy simulations of electromagnetic braking effects on argon bubble transport and capture in a steel continuous casting mold. Metall. Mater. Trans. B 2018. [Google Scholar] [CrossRef]
  29. Jin, K.; Thomas, B.; Ruan, X. Modeling and measurements of multiphase flow and bubble entrapment in steel continuous casting. Metall. Mater. Trans. B 2016, 47, 548–565. [Google Scholar] [CrossRef]
  30. Lei, S.; Zhang, J.; Zhao, X.; He, K. Numerical simulation of molten steel flow and inclusions motion behavior in the solidification processes for continuous casting slab. ISIJ Int. 2014, 54, 94–102. [Google Scholar] [CrossRef]
  31. Yin, Y.; Zhang, J.; Lei, S.; Dong, Q. Numerical study on the capture of large inclusion in slab continuous casting with the effect of in-mold electromagnetic stirring. ISIJ Int. 2017, 57, 2165–2174. [Google Scholar] [CrossRef]
  32. Jin, K.; Thomas, B.; Liu, R.; Vanka, S.; Ruan, X. Simulation and validation of two-phase turbulent flow and particle transport in continuous casting of steel slabs. IOP Conf. Ser. Mater. Sci. Eng. 2015, 84, 012095. [Google Scholar] [CrossRef]
  33. Pfeiler, C.; Thomas, B.; Wu, M.; Ludwig, A.; Kharicha, A. Solidification and particle entrapment during continuous casting of steel. Steel Res. Int. 2008, 79, 599–607. [Google Scholar] [CrossRef]
  34. Lei, S.; Zhang, J.; Zhao, X.; Dong, Q. Study of molten steel flow and inclusions motion behavior in the solidification processes for high speed continuous casting slab by numerical simulation. Trans. Indian Inst. Met. 2016, 69, 1193–1207. [Google Scholar] [CrossRef]
  35. Yuan, Q.; Thomas, B.; Vanka, S. Study of transient flow and particle transport in continuous steel caster molds: Part I. Fluid flow. Metall. Mater. Trans. B 2004, 35, 685–702. [Google Scholar] [CrossRef]
  36. Yuan, Q.; Thomas, B.; Vanka, S. Study of transient flow and particle transport in continuous steel caster molds: Part II. Particle transport. Metall. Mater. Trans. B 2004, 35, 703–714. [Google Scholar] [CrossRef]
  37. Liu, Z.; Li, B. Transient motion of inclusion cluster in vertical-bending continuous casting caster considering heat transfer and solidification. Powder Technol. 2016, 287, 315–329. [Google Scholar] [CrossRef]
  38. Thomas, B.; Yuan, Q.; Mahmood, S.; Liu, R.; Chaudhary, R. Transport and entrapment of particles in steel continuous casting. Metall. Mater. Trans. B 2014, 45, 22–35. [Google Scholar] [CrossRef]
  39. Liu, Z.; Li, B.; Zhang, L.; Xu, G. Analysis of transient transport and entrapment of particle in continuous casting mold. ISIJ Int. 2014, 54, 2324–2333. [Google Scholar] [CrossRef]
  40. Wang, S.; Zhang, L.; Wang, Q.; Yang, W.; Wang, Y.; Ren, L.; Cheng, L. Effect of electromagnetic parameters on the motion and entrapment of inclusions in FC-mold continuous casting strands. Metall. Res. Technol. 2016, 113, 205. [Google Scholar] [CrossRef]
  41. Zhang, L.; Wang, Y. Modeling the entrapment of nonmetallic inclusions in steel continuous-casting billets. JOM 2012, 64, 1063–1074. [Google Scholar] [CrossRef]
  42. Dong, Q.; Zhang, J.; Liu, Q.; Yin, Y. Magnetohydrodynamic calculation for electromagnetic stirring coupling fluid flow and solidification in continuously cast billets. Steel Res. Int. 2017, 88, 1700067. [Google Scholar] [CrossRef]
  43. Dong, Q.; Zhang, J.; Yin, Y.; Wang, B. Three-dimensional numerical modeling of macrosegregation in continuously cast billets. Metals 2017, 7, 209. [Google Scholar] [CrossRef]
Figure 1. Schematic diagram of setting the casting velocity.
Metals 08 00320 g001
Figure 2. Geometry model and mesh in a billet caster.
Metals 08 00320 g002
Figure 3. Solidification and temperature profiles along the casting direction.
Metals 08 00320 g003
Figure 4. Transient distributions of 5 μm inclusions inside the liquid pool of the mold.
Metals 08 00320 g004
Figure 5. The inclusion (shown as green spheres) distribution, the molten steel streamline and contour plots of liquid fraction and velocity in the mold at 50 s after injection.
Metals 08 00320 g005
Figure 6. Predicted initial entrapment position (a) and removal ratio of inclusions with different sizes (b) in the mold.
Metals 08 00320 g006
Figure 7. Transient distributions of 100 μm inclusions inside the liquid pool of the curved part of the strand.
Metals 08 00320 g007
Figure 8. The predicted terminal entrapment positions and entrapment ratios of the macro inclusions along the casting direction.
Metals 08 00320 g008
Figure 9. The predicted distributions of inclusions with different sizes on the cross section of the solidified strand.
Metals 08 00320 g009
Figure 10. Variation of the distribution deviation of inclusions in the solidified strand.
Metals 08 00320 g010
Figure 11. Sampling schematic diagram and the experimental result.
Metals 08 00320 g011
Figure 12. Comparison between the predicted and the experimental results: (a) 2–5 μm; (b) 5–10 μm; (c) 10–20 μm; (d) >20 μm.
Metals 08 00320 g012
Table 1. The Material properties and model parameters.
ParametersValuesDimensions
cp, Specific heat650J·kg−1·K−1
k', Thermal conductivity33.5W·m−1·K−1
ρ, Steel density7340kg·m−3
L, Steel latent heat231,637J·kg−1
Tl, Liquid temperature1827K
Ts, Solid temperature1636K
µ, Molten steel molecular viscosity0.00461kg·s−1·m−1
Ttun, Tundish temperature1758K
dp, Inclusion size3.5, 5, 7, 10, 15, 20, 25, 50, 100, 200μm

