Abstract
5083 aluminum alloy is increasingly used because of its excellent corrosion resistance, high work-hardening rate, and strength. In order to improve its weldability and feasibility, material behavior, material flow, and defects induced while friction stir welding 5083 should be studied. In this study, they were investigated by thermo-structural analysis. The flow stress of 5083-O has a high rate of sensitivity among high temperatures and wide strain rate ranges. Therefore, the details of the mechanical properties of 5083-O at high temperatures and wide strain rate ranges were investigated to obtain reasonable analysis results using a precise flow stress model. The tool/workpiece interface temperature during FSW is critical for accurate analysis results. This study used special equipment to measure tool temperature in order to investigate the interface temperatures precisely, and then the obtained data were used for optimization and verification of the thermal boundary conditions for analysis modeling. Using the developed model, the material behavior and material flow during FSW of 5083-O were analyzed. The tool and workpiece interface temperatures, flow stresses, strain rates, and velocities were investigated with the cylinder and threaded probes in detail. One of the analysis results indicated that the material flow rate on the rear side of a probe directly affected defect generation while joining.
1. Introduction
Friction stir welding (FSW) is a solid-state joining process with many advantages, such as sound mechanical and metallurgical properties and a narrow heat-affected zone compared with conventional fusion welding [1,2,3]. This technology enables dissimilar materials joining, and is widely applied to aerospace products, railway vehicles, and shipbuilding [4]. During FSW, a non-consumable rotating tool traverses the joint portion to weld materials under solid conditions. The heat generated by the friction at the contact surface between the rotating tool and workpiece and the plastic deformation of the workpiece causes thermal softening of the workpiece, thus significantly affecting the material flow. For this reason, process parameters and tool geometries of FSW have a direct influence on mechanical properties of the joints. Forcellese et al. studied the relationship between the process parameters, the vertical force during the weld and the tensile properties of the joint [5]. Casalino et al. used different tools for FSW to investigate the influence of the tool geometry and coating on the grain size and micro-hardness of the joint [6]. Detailed investigations of the process parameters and tool geometries are critical to obtain the optimum mechanical properties of the joints.
Conventionally, FSW has been used for welding metals of low solidus temperatures, such as aluminum alloys and magnesium alloys. These days, FSW is applied for welding steels and dissimilar materials. Since it is difficult to soften steel sufficiently only by the heat due to the friction and the plastic deformation, FSW of steel has been improved by utilizing additional heat sources for the welds. Sugimoto et al. applied gas-tungsten-arc-weld as an additional heat source for FSW to promote thermal softening of steel [7], and Campanelli et al. combined the fiber laser equipment with FSW for pre-heat of the weld [8]. Understanding the material and heat flow during FSW is necessary to develop new methods for FSW.
Now, aluminum is used for civil engineering structures [9]. Especially, 5083 aluminum alloy is increasingly used because of its excellent corrosion resistance, high work-hardening rate, and strength [10]. As for the friction stir weldability of 5083, its optimum process parameter range is narrow compared with other aluminum alloys, like the 6000 series. In order to improve its weldability and feasibility, material behavior, material flow, and defects induced while friction stir welding 5083 should be studied.
Many studies attempted to investigate the mechanical properties and microstructures for FSW of 5083 alloy [11,12,13,14]. However, few studies investigate the material behavior while joining 5083 alloy. Among them, Amini et al. qualitatively analyzed the influence of the amount of material stirred with a tool on the mechanical properties of the joint of 5083-O [15]. Chen et al. studied the material flow while friction stir welding 5083-O experimentally through microscopic observation [16,17]. Aside from experimental approaches, there are a few simulation studies regarding 5083. Grujicic et al. conducted process modeling using the Johnson-Cook constitutive model to analyze FSW of 5083-H131, and investigated strain and residual stress distribution on workpieces [18]. However, material flow was not investigated in detail. Kim et al. investigated FSW of 5083-H18 with a computational fluid dynamics (CFD) technique, and studied distributions of temperatures and strain rate histories [19]. However, the flow stress constitutive model used was not strain rate dependent and tool/workpiece heat exchange was ignored in modeling. To obtain more reasonable analysis results for material behavior of 5083 during FSW, a constitutive model that represents the accurate strain rate and temperature dependence is needed.
The defect generation during FSW is closely related to the material flow of the workpiece, so that investigation of material flow is critical. Shi et al. developed a transient model to analyze the plunge, dwell, and welding stages of FSW with the commercial software FLUENT, investigating material flows of the workpiece [20]. However, the thread on the tool side surface and the generation of defects were not taken into account. Considering the heat flow and thermal contact conductance between the workpiece and the backing plate is effective for precise modeling of FSW [21]. Tongne et al. analyzed the material flow with a coupled Eulerian-Lagrangian (CEL) method for FSW [22]. The mechanism of the banded structure formation, which may be related to the formation of onion rings of FSW join, was investigated from the material flow fields in detail. Although their modeling was two-dimensional, the analyzed material flows would contribute to the understanding of FSW from a metallographic viewpoint.
In this study, material behavior, material flow, and defect generation during friction stir butt-welding of 5083-O sheets were investigated by thermo-structural analysis. During FSW, some parts of the workpiece, especially around the tool/workpiece interface, came under severe conditions, such as near melting point temperatures and high strain rates. The flow stress of 5083-O has a high rate of sensitivity among high temperatures and wide strain rate ranges. Therefore, the details of the mechanical properties of 5083-O at high temperatures and wide strain rate ranges were investigated to obtain reasonable analysis results using a precise flow stress model. The tool/workpiece interface temperature during FSW is critical for accurate analysis results, because it is the highest in a FSW system and its slight changes cause drastic changes on workpiece mechanical properties. For this reason, this study used special equipment to measure tool temperature in order to investigate the interface temperatures precisely, and then the obtained data were used for optimization and verification of the thermal boundary conditions for analysis modeling. Using this developed model, not only temperatures, stresses, and strain rates of the deforming work material, but also a defect induced in the workpiece were analyzed by the finite element method (FEM). Finally, the material flow during FSW specific to 5083-O was discussed from the analysis results.
2. Experiment Procedures
Workpieces are friction stir welded under high temperatures close to the solidus temperature and high strain rates. Therefore, a flow stress model that is able to represent these severe conditions is necessary to obtain reasonable simulation results for FSW processes. A flow stress model of 5083-O, which has accurate temperature dependence from room temperature (RT) to high temperatures and strain rate dependence, was studied by experiment. First, quasi-static compression tests were conducted under RT to 500 °C to investigate the temperature dependence of 5083-O. Next, high-speed compression tests under the same temperature range were implemented to understand its strain rate sensitivity. In the experiments, the specimen was a cylinder with a diameter of 10 mm and height of 10 mm. When employing an isotropic model for the workpiece, its flow stress is able to be obtained by uniaxial tensile tests or compression tests. This study considered the material under high temperatures with large strains, therefore, the compression tests were implemented. In addition, to generate higher strain rates for the material during the compression tests, the height of the cylindrical test piece, which is usually double its radius, was set relatively smaller, equal to the radius in this study, namely 10 mm in height. The stroke speeds were set to 1 and 500 mm/min for low and high speed tests, respectively.
In addition to a flow stress model, thermal properties of 5083-O are necessary to analyze FSW processes by FEM. Therefore, the thermal diffusivities and specific heats, which are dependent on temperatures, were measured by the laser flash method and adiabatic method at five different temperatures from 25 to 500 °C. Then, the thermal conductivities were calculated from these measured values.
Then, FSW experiments of 5083-O aluminum alloy were conducted to measure tool temperatures, welding forces and welding torque while butt welding the aluminum sheets. The obtained results served as the fundamental data to investigate temperatures around tool/workpiece interfaces during the process. Then, they were used to validate finite element (FE) modeling and thermal boundary conditions, which accurately represents the welding phenomena around the tool/workpiece interface, such as temperature, flow stress and material flow while joining.
The FSW experiments were conducted on a 2D-FSW machine (Hitachi Power Solution, Hitachi-city, Japan). Welding forces were measured with load cells equipped under the machine table, and welding torque was measured with the spindle motor power. The geometry of each workpiece was 200 mm long, 70 mm wide, and 4 mm thick, and the sides of two workpieces were butt welded. The joining surfaces were machined previously to meet each other without gaps. A tool had a shoulder 12 mm in diameter and 3° in taper angle, and a probe 4 mm in diameter and 3.8 mm in length. Two types of probes, with a smooth surface and threaded surface, were prepared for the experiments.
With respect to welding temperature, tool temperatures are under nearly stable conditions during the FSW process after the initial tool plunge and tool dwell. Although much research has investigated the important aspect of welding phenomena based on temperatures measured at specific points of a workpiece, only a few experimental studies have been reported about tool temperatures because very complicated settings are required for temperature measurement of a rotating tool [23,24,25,26]. Accurate experimental data about tool surface temperature is necessary to understand exact temperatures at the tool/workpiece interface. They are also needed to precisely validate developed simulation models by comparing measured and calculated temperatures. Therefore, a method and device for effectively measuring tool temperatures are essential to investigate FSW processes from theoretical and practical viewpoints.
The tool temperatures were measured with the MULTI INTELLIGENCE tooling system for FSW. Figure 1 shows the temperature measurement tool, cylinder probe, and threaded probe. Figure 2 is a cross-sectional view for the thermocouple positions imbedded in the tool. The thermocouples were arranged to measure the temperatures of the probe-tip and shoulder part, respectively. The thermocouples were imbedded at positions around 1 mm from the tool surface to measure temperatures as close to the tool/workpiece interface temperatures as possible.
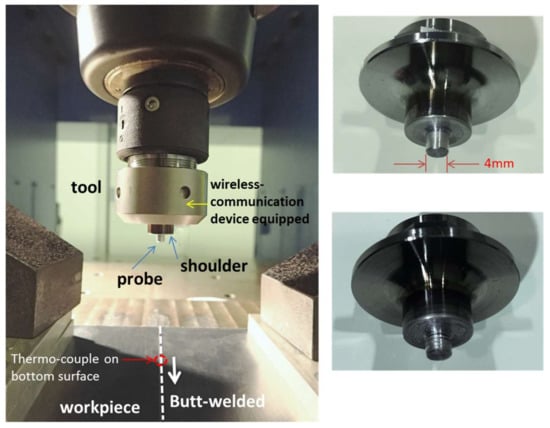
Figure 1.
Temperature measurement tool and probes. (Upper-right: cylinder probe without thread, lower-right: threaded probe).
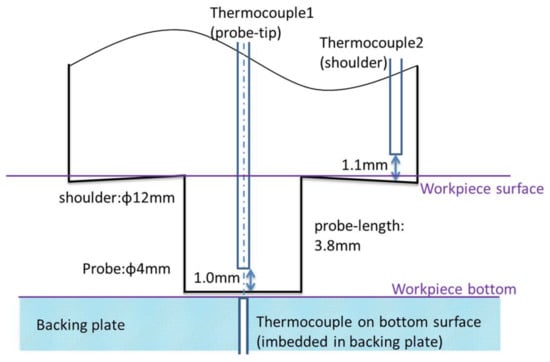
Figure 2.
Positions of thermocouples imbedded in the tool and backing plate.
Table 1 shows process parameters for the experiment. The rotational speed was set to 900 min−1 and the traverse speed 4 mm/s. In addition, the tool plunge speed was set to 0.5 mm/s and the plunge depth to 3.95 mm, and then the tool dwell time was 5 s before traversing.

Table 1.
Experimental conditions to measure temperature, force, and torque.
Under these conditions, tool temperatures, welding forces and welding torque were measured during the FSW process. As a reference, the workpiece bottom surface temperatures on the center line of the joint were also measured using thermocouples imbedded on a backing plate. After joining, microscopic observation was carried out to investigate the cross-section of joint portions.
3. Analysis Procedures
3.1. Model Description
Flow stress modeling of 5083-O was conducted with the compression test results. For the flow stress modeling with strain hardening, temperature dependence, and strain rate sensitivity, Equation (1) was employed [27]:
where is the flow stress, is the strain rate, m is the strain rate sensitivity, and B is a function of strain and temperature T, . Function B, which represents the strain hardening and temperature dependence, was determined from the quasi-static compression test results directly.
Figure 3 shows the quasi-static compression test results at six different temperatures. The results show the large thermal softening of 5083-O. Figure 4 shows the relationship between the strain rate and proof stress obtained from the compression tests performed under two different stroke speeds of 1 and 500 mm/min and five different temperatures. From these results, the strain rate sensitivity m was determined for each temperature: m = 0.003 for room temperature, 0.003 for 150 °C, 0.065 for 300 °C, 0.214 for 400 °C, and 0.199 for 500 °C. Figure 5 shows the flow stress model obtained from the abovementioned modeling, indicating flow stresses for six different temperatures and two strain rates as an example. The flow stress for 550 °C and 0.002 s−1 was assumed for modeling to 1 MPa because it is close to the melting point of 5083-O. Note that the flow stress for T = 400 °C at a higher strain rate = 1 s−1 is higher than that for T = 300 °C at a lower strain rate = 0.001 s−1, and also the flow stress for 500 °C at the higher strain rate is higher than that for T = 400 °C at the lower strain rate. This developed model was used as a constitutive model for FE analyses.
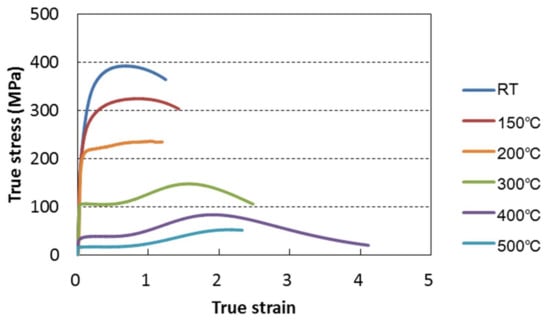
Figure 3.
Quasi-static compression test results of 5083-O at different temperatures.
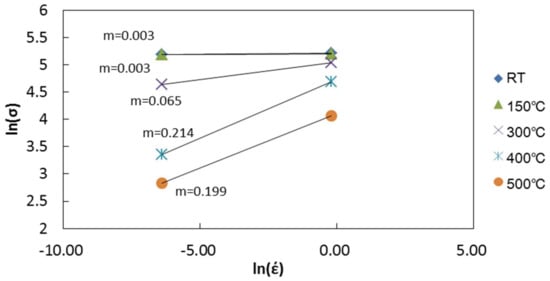
Figure 4.
Strain rate sensitivity for 5083-O.
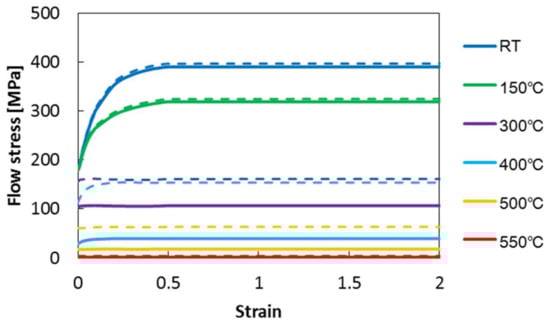
Figure 5.
Flow stress model of 5083-O (solid lines: strain rate 0.002 s−1, dotted lines: strain rate 1 s−1).
To briefly summarize the experimentally-obtained flow stress model, the strain rate sensitivity of 5083-O is very high under high temperatures. Especially over 400 °C, the flow stresses remain high when the strain rate increases. This is one of the mechanical characteristics of this alloy, and is one of the reasons for the difficulty of its joining by FSW.
As temperature-dependent thermal properties, the thermal diffusivities, specific heats and thermal conductivities for 5083-O were obtained, which are shown in Table 2 and were used in the analyses. Here, the density of 2688 kg/m3 was employed for all temperatures.
Table 2.
Thermal properties of 5083-O.
3.2. Analysis Conditions
Numerical studies are essential for the investigation of multi-physics problems like FSW. For example, experimental studies for temperature and plastic flow around the tool/workpiece interface are difficult and time-consuming. Therefore, using the flow stress model developed in Section 3.1, FE analysis was conducted to clarify the thermal and mechanical phenomena around the tool/workpiece interface during the FSW for 5083-O. Especially, temperature, flow stress, and material flow were investigated.
Two types of analyses using two different tool geometries with or without threads at the probe surfaces were conducted like the experiments. Process parameters were set to be the same as those shown in Table 1.
The commercial package DEFORM-3D was used for the Lagrangian analysis of FSW processes. The workpiece was set to a continuum model of 70 × 70 × 4 mm. Each workpiece was meshed into about 50,000 tetrahedral elements when using the cylinder tool model and about 80,000 elements when using the threaded tool model. Each tool was meshed into about 21,000 tetrahedral elements. The element sizes around the tool/workpiece interfaces were set to be about 0.1–0.3 mm in length, finer than those in the surroundings. The tools used in the analyses had almost the same geometries as those used in experiments except the probe height and thread height. The probe height was 0.2 mm smaller in the FE simulation than in the experiments. Thus, mesh breaking at the model’s bottom while re-meshing was avoided by an increase in the clearance between the tool tip and workpiece bottom. As for the threaded tool, the thread height of the model was set to half of the actual height, i.e., 0.2 mm, giving priority to analysis stability during FSW simulations. The tool consisted of about 15,000 elements, and tool/workpiece interface elements were set to be finer than the workpiece modeling. The workpiece model had a rigid plastic body and the tool model, a rigid body.
As for the boundary conditions of the workpiece, the bottom surface was in contact with the backing plate without friction and the side surfaces are fixed in all directions. This study followed the theory of plasticity and Equation (2) was employed for the modeling:
where k is the shear flow stress and is the flow stress. Then, the friction between the tool and workpiece was followed by the shear friction model:
where is the friction stress and mf is the friction factor. The friction factor mf = 1.0 was employed [28,29].
Thermal boundary conditions were followed by Equation (4):
where q is the heat flux, h is the heat transfer coefficient, Tw is surface temperature of the workpiece or tool and Tf is the ambient temperature of 20 °C.
The heat transfer coefficients used for FE analyses were optimized in advance using experimental results of tool temperatures measured as a reference. It was set to 10 kW/m2/K at the workpiece bottom surface, 0.01 kW/m2/K at the workpiece top surface, and 1.5 kW/m2/K at the tool surface. Moreover, heat transfer from the tool surface to the workpiece surface at their contact area was formulated using the tool surface temperature TT and workpiece surface temperature TW as , and its coefficient was set to 11 kW/m2/K [30]. Under the above conditions, thermo-mechanical coupled analyses were conducted. The plunge, dwell, and traverse phases of the FSW process were simulated until the tool traversed a distance of 8 mm, at which temperatures and welding forces became close to a steady state.
4. Experimental Results
Table 3 shows the experimental results of the temperatures, welding forces, and welding torque. They were measured values at a traverse length of 8 mm in the traverse phase. The tool temperature at the probe-tip was 60 °C lower for the threaded probe than for the cylinder probe, while the shoulder temperatures were almost the same. The workpiece temperature was 21 °C higher with the threaded probe than with the cylinder probe. On the other hand, the welding forces and torque were slightly smaller for the threaded probe than for the cylinder probe.
Table 3.
Experiment results (after traversing 8 mm).
Figure 6 shows the micrographs of the workpiece cross-section perpendicular to the welding direction and at the center of the welding line. A defect was found in the advancing side (AS) of the specimen welded with the cylinder probe. On the other hand, no defect was found in the specimen welded using the threaded probe. Note that the affected zone was narrow and its minimum width was close to the probe diameter.
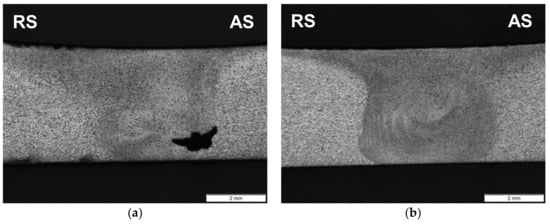
Figure 6.
Micrographs of the cross-section: (a) cylinder probe; and (b) threaded probe.
5. Analysis Results and Discussion
5.1. Validation
Experiment and analysis results were compared for validation of the FE modeling. Figure 7 shows the comparison of the temperatures measured and calculated at a traverse length of 8 mm for the cylinder probe and threaded probe. The tool probe temperatures, tool shoulder temperatures, and workpiece bottom temperatures were compared.
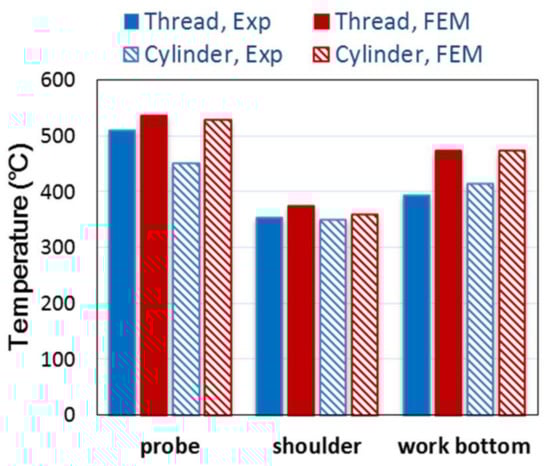
Figure 7.
Comparison between the temperatures obtained by experiment (Exp) and analysis (FEM) for cylinder and threaded probes.
The calculated temperatures of the probe and shoulder were consistent with the measured ones in FSW with the cylinder probe. The work-bottom temperature of the experiment was 17% lower than the experiment. For this reason, it is considered that the thermocouple used in the experiment was embedded within the backing plate and the work-bottom surface temperature could not be measured directly, then the measured temperature became lower than the FEM. This result indicated the validity of the 5083-O flow stress modeling and the analysis modeling, including thermal boundary conditions. As for the threaded probe, the calculated and measured temperatures showed a certain difference only at the probe tip. This may be because the probe thread height in the analysis was set smaller than that in the experiment. On the other hand, the shoulder temperatures of the experiment and analysis were almost identical, and the difference of the work-bottom temperatures was 12%. The details of material behavior and material flow around the tool/workpiece interface are investigated below.
5.2. Material Behavior during FSW Processes
FSW processes were investigated based on the distributions of temperature, flow stress, strain rate and velocity calculated at a traverse length of 8 mm. The temperature distributions during FSW with the cylinder probe and threaded probe are shown in Figure 8 and Figure 9, respectively. Both figures represent the temperature of the half model on the retreating side (RS) to highlight temperatures on the longitudinal cross-section of the welds. The results indicated that the tool/workpiece interface temperature increased to a range between about 450 and 540 °C and, thus, became close to 570 °C, the solidus line of 5083-O at some portions.
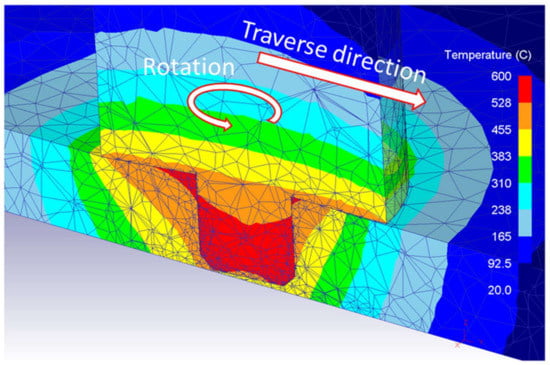
Figure 8.
Temperature distribution of the half model on the retreating side during FSW with a cylinder probe.
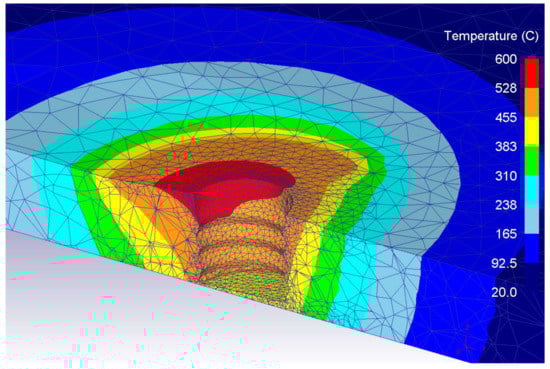
Figure 9.
Temperature distribution of the half model on the retreating side during FSW with a threaded probe.
Figure 10 and Figure 11 show the distributions of the effective stress, or von Mises stress, during FSW with the cylinder probe and threaded probe, respectively. The cross-section of these figures was positioned 1.5 mm from the welding line toward the advancing side. When using the cylinder probe, a tunnel defect was induced on the advancing side (AS) by analysis and appeared on the cross-section. Remember that a tunnel defect was induced at the similar position in the experiment with the cylinder probe as shown in Figure 6. On the other hand, the analysis result of FSW with the threaded probe was defect-free just like the experimental result in Figure 6. Nevertheless, there is not a large difference between the stress distributions between Figure 10 and Figure 11. That is, the growth of a defect had a small influence on the stress distribution. The effective stresses at the tool/workpiece interface were over 100 MPa, despite workpiece temperatures at the interface exceeding 450 °C. For example, point A at the tool front in Figure 11 had an effective stress of 171 MPa under a temperature of 476 °C and an effective strain rate of 102 s−1. This indicated that the high strain rate sensitivity of 5083-O at high temperatures caused high flow stresses at the tool/workpiece interface despite high temperatures, while high flow stress may prevent an extensive material flow.
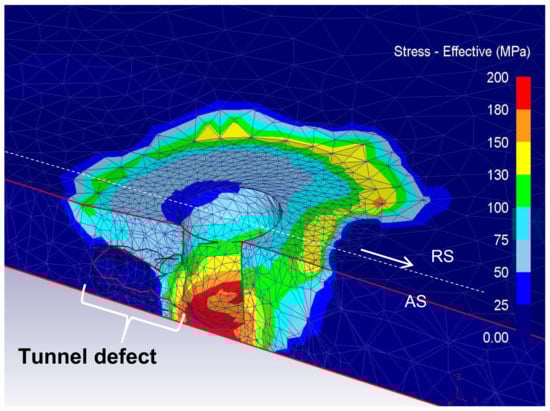
Figure 10.
Effective stress distribution during FSW with a cylinder probe.
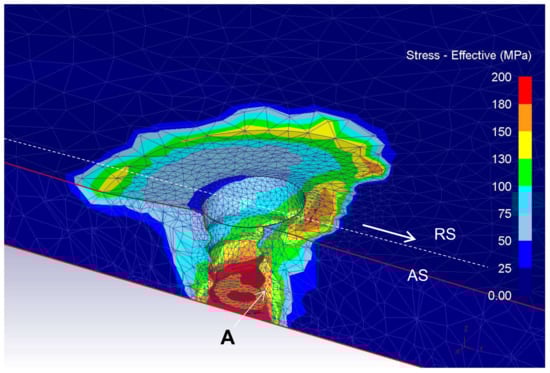
Figure 11.
Effective stress distribution during FSW with a threaded probe.
Figure 12 and Figure 13 show the strain rates during FSW with the cylinder and threaded probes, respectively, highlighting the difference of their lower strain rate regions around AS at the tool back. The areas of high-strain rates from 35 to 250 s−1 were shown in red monotonously in the figures. In Figure 13 for the threaded probe, almost all the tool/workpiece interfaces, except the tool tip area, had high strain rates over 35 s−1, indicating that a steady and intensive material flow occurred in the interface zone of the workpiece. In detail, the maximum strain rate was between 80 to 150 s−1 for the probe side boundary and about 200 to 250 s−1 for the shoulder contact boundary. On the other hand, the strain rates at the cylinder-probe/workpiece interface were less than 35 s−1 in a rather large area, and the intensive material flow necessary to FSW process was prevented. Especially, the low strain rate near the defect indicated weak material flow there. Therefore, the material transfer from the retreating side to the advancing side on the rear side of the cylinder probe was insufficient, resulting in the nucleation and growth of the defect.
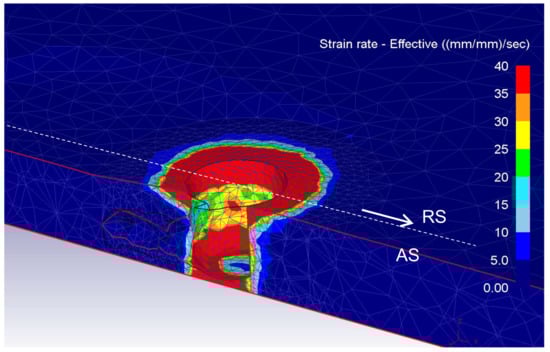
Figure 12.
Effective strain rate distribution during FSW with a cylinder probe.
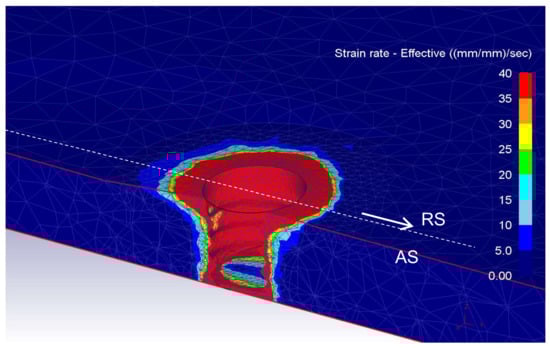
Figure 13.
Effective strain rate distribution during FSW with a threaded probe.
Figure 14 shows the top views of velocity fields during FSW with the cylinder and threaded probes, respectively. Each figure indicates velocity values of the workpiece and tool pin on the cross-section 2 mm above the workpiece bottom surface, and highlights the area of velocity faster than 3 mm/s. Apparently, the absolute value of the material velocity was not symmetrical with respect to the welding line. The radial thickness of the area of velocity over 3 mm/s was about 0.5 mm on the rear side of the threaded probe, showing sufficient material flow. In contrast, it was about 0.2 to 0.3 mm on the rear side of the cylinder probe. This means that changing the threaded probe for the cylinder would reduce the material transfer from the retreating side to the advancing side by about half, leading to defect generation.
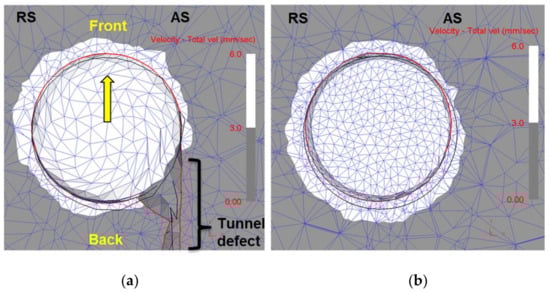
Figure 14.
Flow velocity around (a) the cylinder probe and (b) the threaded probe (top view of the cross-section 2 mm from the bottom).
5.3. Plastic Flow of Workpiece
Figure 15 and Figure 16 show material flow velocities at the tool/workpiece interfaces with the velocity vectors over 10 mm/s highlighted in red. The velocity around the cylinder probe as a whole was slower than that around the threaded probe and was not so complicated except for an area of slow velocity surrounding the defect. On the other hand, the velocity around the threaded probe was large anywhere and indicated that the threaded probe caused a downward flow on the rear side and advancing side, while it caused a horizontal flow on the front side and retreating sides. These flow patterns were consistent with an experimental observation reported elsewhere [31]. Rao et al. investigated the microhardness of 5083 on the AS and RS [32]. The results of this study indicated that the difference in material flow between the AS and RS lead to the asymmetric material property of joined material.
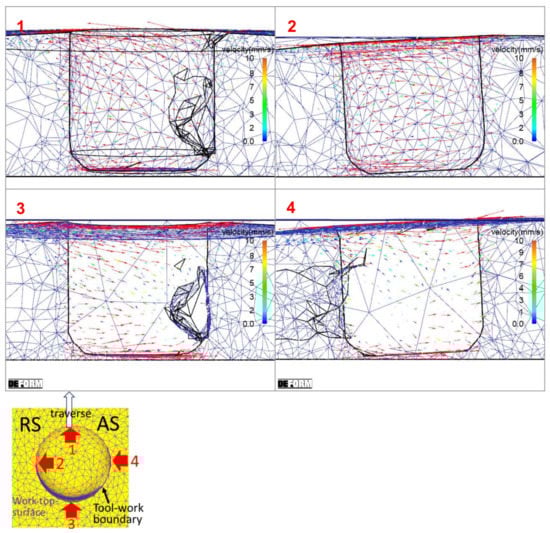
Figure 15.
Velocity of the workpiece on the cylinder probe. Arrows in the added figure indicate the view position and direction (1 is seen from the direction of the arrow 1, 2 is from the arrow 2, 3 is from the arrow 3, 4 is form the arrow 4).
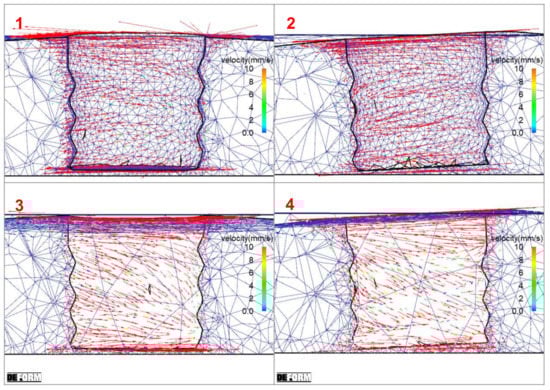
Figure 16.
Velocity of the workpiece on the threaded probe. The view position and direction are the same as in Figure 15 (1 is seen from the direction of the arrow 1, 2 is from the arrow 2, 3 is from the arrow 3, 4 is form the arrow 4).
The analysis results indicated that the material flow on the rear side of a probe directly affects the generation of defects while joining. When sufficient material is provided from the RS to AS on the rear side of a probe, defects would not be generated. Therefore, a detailed analysis of material flow, especially on the rear side of a probe, is necessary for a better understanding of the mechanisms of joining and related defect generation.
Figure 17 shows the workpiece velocities along the back side of two kinds of probes. The vertical line of the figure indicates the distance from the workpiece surface along the tool/workpiece interface. In addition to the resultant velocity, the horizontal and vertical velocity components are indicated in the figure. The workpiece velocity on the cylinder probe causing a defect was smaller than that on the threaded probe. Figure 18 shows a comparison between these three velocities. The minimum resultant velocity on the threaded probe was 2.6 times higher than that on the cylinder probe. The minimum horizontal velocity component and the maximum vertical velocity components on the threaded probe were 2.8 and 1.3 times higher than those on the cylinder probe, respectively. When the cylinder probe was used, the material flow was caused only by the frictional force at the workpiece/tool interface. On the other hand, when the threaded probe was used, the rotational motion of the thread caused additional forces to promote both the peripheral and downward flow of the workpiece. The analysis results demonstrated that the distribution and magnitude of material flow change drastically by applying the threaded probe.
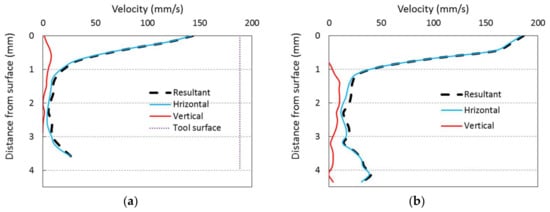
Figure 17.
Material flow velocities at probe back: (a) cylinder probe; and (b) threaded probe.
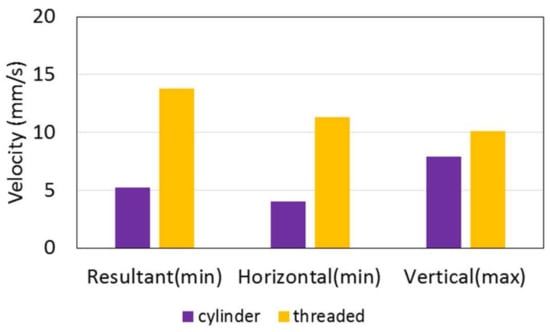
Figure 18.
Comparison of the minimum resultant, minimum horizontal, and maximum vertical velocities of the workpiece caused by two probes of different shapes.
At the rear side of tool, the threaded probe caused material flow from the upper to the lower portion, then the frictional heat generated around the shoulder interface moved downward to induce a high temperatures at the lower portion. This caused the thermal softening of the workpiece leading to the prevention of defects generated at the tool-rear lower portion as well.
6. Conclusions
The material behavior and material flow during FSW of 5083-O were analyzed. For a precise analysis model, first, the flow stress of 5083-O among high temperatures and high strain rates was investigated in detail. Next, a tool temperature measuring device was used to measure the tool/workpiece interface temperatures exactly. Then, the thermal boundary conditions, which are critical for FSW analysis, were optimized and validated. The following was obtained through this study, using the developed analysis model:
- The workpiece temperatures at the tool/workpiece interface during FSW of 5083-O sheets were between 450 and 540 °C, and temperatures at some parts were close to the solidus line of 570 °C. Even under high-temperature conditions, the flow stresses near the interface remained high values over 100 MPa because of high strain rate hardening of this alloy.
- The FSW analysis with the smooth cylinder probe caused a tunneling defect. On the other hand, the analysis with the threaded probe did not generate any defect. These analysis results were consistent with the experiment results.
- The analysis results indicated that the material flow rate on the rear side of a probe directly affected defect generation while joining. When sufficient material transfer was provided from the RS to AS through the rear side of a probe, defects were not generated. Moreover, downward material flow was generated at the tool back with the threaded probe, which was attributed to sufficient material supply to the lower portion on AS where a tunnel defect would occur.
- The minimum velocity of the workpiece calculated on the threaded probe was 2.6 times higher than that on the cylinder probe. It was indicated that the distribution and magnitude of material flow changed drastically by applying the threaded probe.
Acknowledgments
The authors are grateful to Yamamoto Metal Technos Co., Ltd., for technical support with measurements and precision tool machining.
Author Contributions
Nakamura designed and performed the experiments and calculations, and wrote the paper; Obikawa conceived the analyses, and wrote the paper, Nishizaki contributed to conduct the experiments; Enomoto conceived the experiments and analyzed the data, Fang contributed to perform the calculations.
Conflicts of Interest
The authors declare no conflict of interest.
References
- Mishra, R.S.; Ma, Z.Y. Friction stir welding and processing. Mater. Sci. Eng. R Rep. 2005, 50, 1–78. [Google Scholar] [CrossRef]
- Liu, H.J.; Fujii, H.; Maeda, M.; Nogi, K. Tensile properties and fracture locations of friction-stir-welded joints of 2017-T351 aluminum alloy. J. Mater. Process. Technol. 2003, 142, 692–696. [Google Scholar] [CrossRef]
- Jannet, S.; Mathews, P.K.; Raja, R. Comparative investigation of friction stir welding and fusion welding of 6061 T6-5083 O aluminum alloy based on mechanical properties and microstructure. Bull. Pol. Acad. Sci. Tech. Sci. 2014, 62, 791–795. [Google Scholar] [CrossRef]
- Cam, G.; Mistikoglu, S. Recent Developments in Friction Stir Welding of Al-alloys. J. Mater. Eng. Perform. 2014, 23, 1936–1953. [Google Scholar] [CrossRef]
- Forcellese, A.; Simoncini, M.; Casalino, G. Influence of process parameters on the vertical forces generated during friction stir welding of AA6082-T6 and on the mechanical properties of the joints. Metals 2017, 7, 350. [Google Scholar] [CrossRef]
- Casalino, G.; Campanelli, S.; Mortello, M. Influence of shoulder geometry and coating of the tool on the friction stir welding of aluminium alloy plates. Procedia Eng. 2014, 69, 1541–1548. [Google Scholar] [CrossRef]
- Sugimoto, I.; Park, S.H.; Hirano, S.; Hata, S.; Sato, Y.; Kokawa, H.; Ishida, K. High speed welding of friction-stir-welding for mild steel by gas-tungsten-arc-welding hybrid process. Q. J. Jpn. Weld. Soc. 2018, 36, 26–30. [Google Scholar] [CrossRef][Green Version]
- Campanelli, S.L.; Casalino, G.; Casavola, C.; Moramarco, V. Analysis and comparison of friction stir welding and laser assisted friction stir welding of aluminum alloy. Materials 2013, 6, 5923–5941. [Google Scholar] [CrossRef] [PubMed]
- Doksanovic, T.; Dzeba, I.; Markulak, D. Applications of Aluminium Alloys in Civil Engineering. Tehnicki Vjesnik Tech. Gazette 2017, 24, 1609–1618. [Google Scholar]
- Peel, M.; Steuwer, A.; Preuss, M.; Withers, P.J. Microstructure, mechanical properties and residual stresses as a function of welding speed in aluminium AA5083 friction stir welds. Acta Mater. 2003, 51, 4791–4801. [Google Scholar] [CrossRef]
- Hirata, T.; Oguri, T.; Hagino, H.; Tanaka, T.; Chung, S.W.; Takigawa, Y.; Higashi, K. Influence of friction stir welding parameters on grain size and formability in 5083 aluminum alloy. Mater. Sci. Eng. A Struct. Mater. Prop. Microstruct. Process. 2007, 456, 344–349. [Google Scholar] [CrossRef]
- Fujii, H.; Cui, L.; Maeda, M.; Nogi, K. Effect of tool shape on mechanical properties and microstructure of friction stir welded aluminum alloys. Mater. Sci. Eng. A Struct. Mater. Prop. Microstruct. Process. 2006, 419, 25–31. [Google Scholar] [CrossRef]
- Jannet, S.; Mathews, P.K.; Raja, R. Optimization of process parameters of friction stir welded AA 5083-O aluminum alloy using Response Surface Methodology. Bull. Pol. Acad. Sci. Tech. Sci. 2015, 63, 851–855. [Google Scholar] [CrossRef]
- Han, M.S.; Lee, S.J.; Park, J.C.; Ko, S.C.; Woo, Y.B.; Kim, S.J. Optimum condition by mechanical characteristic evaluation in friction stir welding for 5083-O Al alloy. Trans. Nonferr. Met. Soc. China 2009, 19, S17–S22. [Google Scholar] [CrossRef]
- Amini, S.; Amiri, M.R.; Barani, A. Investigation of the effect of tool geometry on friction stir welding of 5083-O aluminum alloy. Int. J. Adv. Manuf. Technol. 2015, 76, 255–261. [Google Scholar] [CrossRef]
- Chen, Z.W.; Pasang, T.; Qi, Y. Shear flow and formation of Nugget zone during friction stir welding of aluminium alloy 5083-O. Mater. Sci. Eng. A Struct. Mater. Prop. Microstruct. Process. 2008, 474, 312–316. [Google Scholar] [CrossRef]
- Chen, Z.W.; Cui, S. Tool-workpiece interaction and shear layer flow during friction stir welding of aluminium alloys. Trans. Nonferr. Met. Soc. China 2007, 17, S258–S261. [Google Scholar]
- Grujicic, M.; Arakere, G.; Yalavarthy, H.V.; He, T.; Yen, C.F.; Cheeseman, B.A. Modeling of AA5083 Material-Microstructure Evolution During Butt Friction-Stir Welding. J. Mater. Eng. Perform. 2010, 19, 672–684. [Google Scholar] [CrossRef]
- Kim, D.; Badarinarayan, H.; Kim, J.H.; Kim, C.; Okamoto, K.; Wagoner, R.H.; Chung, K. Numerical simulation of friction stir butt welding process for AA5083-H18 sheets. Eur. J. Mech. A Solids 2010, 29, 204–215. [Google Scholar] [CrossRef]
- Shi, L.; Wu, C.S. Transient model of heat transfer and material flow at different stages of friction stir welding process. J. Manuf. Process. 2017, 25, 323–339. [Google Scholar] [CrossRef]
- Contuzzi, N.; Campanelli, S.L.; Casalino, G.; Ludovico, A.D. On the role of the Thermal Contact Conductance during the Friction Stir Welding of an AA5754-H111 butt joint. Appl. Therm. Eng. 2016, 104, 263–273. [Google Scholar] [CrossRef]
- Tongne, A.; Desrayaud, C.; Jahazi, M.; Feulvarch, E. On material flow in Friction Stir Welded Al alloys. J. Mater. Process. Technol. 2017, 239, 284–296. [Google Scholar] [CrossRef]
- Assidi, M.; Fourment, L.; Guerdoux, S.; Nelson, T. Friction model for friction stir welding process simulation: Calibrations from welding experiments. Int. J. Mach. Tools Manuf. 2010, 50, 143–155. [Google Scholar] [CrossRef]
- Guerdoux, S.; Fourment, L. A 3D numerical simulation of different phases of friction stir welding. Modell. Simul. Mater. Sci. Eng. 2009, 17, 7. [Google Scholar] [CrossRef]
- Schmale, J.; Fehrenbacher, A.; Shrivastava, A.; Pfefferkorn, F.E. Calibration of dynamic tool-workpiece interface temperature measurement during friction stir welding. Measurement 2016, 88, 331–342. [Google Scholar] [CrossRef]
- Chen, S.; Li, H.; Lu, S.; Ni, R.Y.; Dong, J.H. Temperature measurement and control of bobbin tool friction stir welding. Int. J. Adv. Manuf. Technol. 2016, 86, 337–346. [Google Scholar] [CrossRef]
- Dorbane, A.; Ayoub, G.; Mansoor, B.; Hamade, R.; Kridli, G.; Imad, A. Observations of the mechanical response and evolution of damage of AA 6061-T6 under different strain rates and temperatures. Mater. Sci. Eng. A 2015, 624, 239–249. [Google Scholar] [CrossRef]
- Jain, R.; Pal, S.K.; Singh, S.B. Finite element simulation of temperature and strain distribution in AL2024 aluminum alloy by friction stir welding. In Proceedings of the 5th International & 26th All India Manufacturing Technology, Design and Research Conference, Guwahati, India, 12–14 December 2014. [Google Scholar]
- Zhang, H.W.; Zhang, Z.; Chen, J.T. The finite element simulation of the friction stir welding process. Mater. Sci. Eng. A Struct. Mater. Prop. Microstruct. Process. 2005, 403, 340–348. [Google Scholar] [CrossRef]
- Buffa, G.; Ducato, A.; Fratini, L. Numerical procedure for residual stresses prediction in friction stir welding. Finite Elem. Anal. Des. 2010, 47, 470–476. [Google Scholar] [CrossRef]
- Da Silva, A.A.M.; Arruti, E.; Janeiro, G.; Aldanondo, E.; Alvarez, P.; Echeverria, A. Material flow and mechanical behaviour of dissimilar AA2024-T3 and AA7075-T6 aluminium alloys friction stir welds. Mater. Des. 2011, 32, 2021–2027. [Google Scholar] [CrossRef]
- Rao, D.; Huber, K.; Heerens, J.; Santos, J.F.; Huber, N. Asymmetric mechanical properties and tensile behavior prediction of aluminium alloy 5083 friction stir welding joints. Mater. Sci. Eng. A Struct. Mater. Prop. Microstruct. Process. 2013, 565, 44–50. [Google Scholar] [CrossRef]


© 2018 by the authors. Licensee MDPI, Basel, Switzerland. This article is an open access article distributed under the terms and conditions of the Creative Commons Attribution (CC BY) license (http://creativecommons.org/licenses/by/4.0/).